

Aadi33
6.4k 投稿

Aadi33
報告
ユーザーをブロック
Observe. Adapt. Execute. BP-3B6BD71857D4
取引を発注
超高頻度トレーダー
5.7年
794 フォロー
8.2K+ フォロワー
7.0K+ いいね
投稿
ポートフォリオ
すべて
引用
ライブ
·
--
「正直に言うと、これは本当に苦しい経験でした。市場に入ったのは、そこから何かを作れると思ったからなのに、結果的にかなりの損失を出してしまいました。損失は財布だけでなく、より広いところに影響しましたし、最近は物事がすべて悪い方向に進んでいるように感じます。関わる前にもっと慎重だったらよかったのにと思います。
今はただ、回復して前に進もうとしています。もし仮想通貨に新しく入ったばかりなら、リスクを理解せずに何かに急いで飛び込まないでください。
$CASH
SR-933793B165F6D63D2A22B716
「正直に言うと、これは本当に苦しい経験でした。市場に入ったのは、そこから何かを作れると思ったからなのに、結果的にかなりの損失を出してしまいました。損失は財布だけでなく、より広いところに影響しましたし、最近は物事がすべて悪い方向に進んでいるように感じます。関わる前にもっと慎重だったらよかったのにと思います。
今はただ、回復して前に進もうとしています。もし仮想通貨に新しく入ったばかりなら、リスクを理解せずに何かに急いで飛び込まないでください。
$CASH
SR-933793B165F6D63D2A22B716
今はただ、回復して前に進もうとしています。もし仮想通貨に新しく入ったばかりなら、リスクを理解せずに何かに急いで飛び込まないでください。
$CASH
SR-933793B165F6D63D2A22B716
79
·
--
ブリッシュ
$CASH は好奇心を持って見ているプロジェクトのひとつですが、いま注目されていることや値動きの先を見ておくことが重要だと思います。
本当の問いは、$CASH が短期的な投機ではなく、実際の利用によって一貫した需要を築けるかどうかです。
特に、エコシステムがどのように発展していくのか、ユーザーがどのように関わるのか、そして市場環境が変わっても活動が継続するかどうかに注目しています。
仮想通貨の世界では物語(ナラティブ)が素早く動くことがありますが、持続可能な成長は通常、実行力、導入(採用)、そして継続的な開発によって生まれます。
当面は、私は $CASH をウォッチリストに入れて、動向を注意深く追っています。
あなたは $CASH で特に何を最も注視していますか?
SR-933793B165F6D63D2A22B716
$CASH は好奇心を持って見ているプロジェクトのひとつですが、いま注目されていることや値動きの先を見ておくことが重要だと思います。
本当の問いは、$CASH が短期的な投機ではなく、実際の利用によって一貫した需要を築けるかどうかです。
特に、エコシステムがどのように発展していくのか、ユーザーがどのように関わるのか、そして市場環境が変わっても活動が継続するかどうかに注目しています。
仮想通貨の世界では物語(ナラティブ)が素早く動くことがありますが、持続可能な成長は通常、実行力、導入(採用)、そして継続的な開発によって生まれます。
当面は、私は $CASH をウォッチリストに入れて、動向を注意深く追っています。
あなたは $CASH で特に何を最も注視していますか?
SR-933793B165F6D63D2A22B716
本当の問いは、$CASH が短期的な投機ではなく、実際の利用によって一貫した需要を築けるかどうかです。
特に、エコシステムがどのように発展していくのか、ユーザーがどのように関わるのか、そして市場環境が変わっても活動が継続するかどうかに注目しています。
仮想通貨の世界では物語(ナラティブ)が素早く動くことがありますが、持続可能な成長は通常、実行力、導入(採用)、そして継続的な開発によって生まれます。
当面は、私は $CASH をウォッチリストに入れて、動向を注意深く追っています。
あなたは $CASH で特に何を最も注視していますか?
SR-933793B165F6D63D2A22B716
4
1
6
166
·
--
ブリッシュ
本人確認中
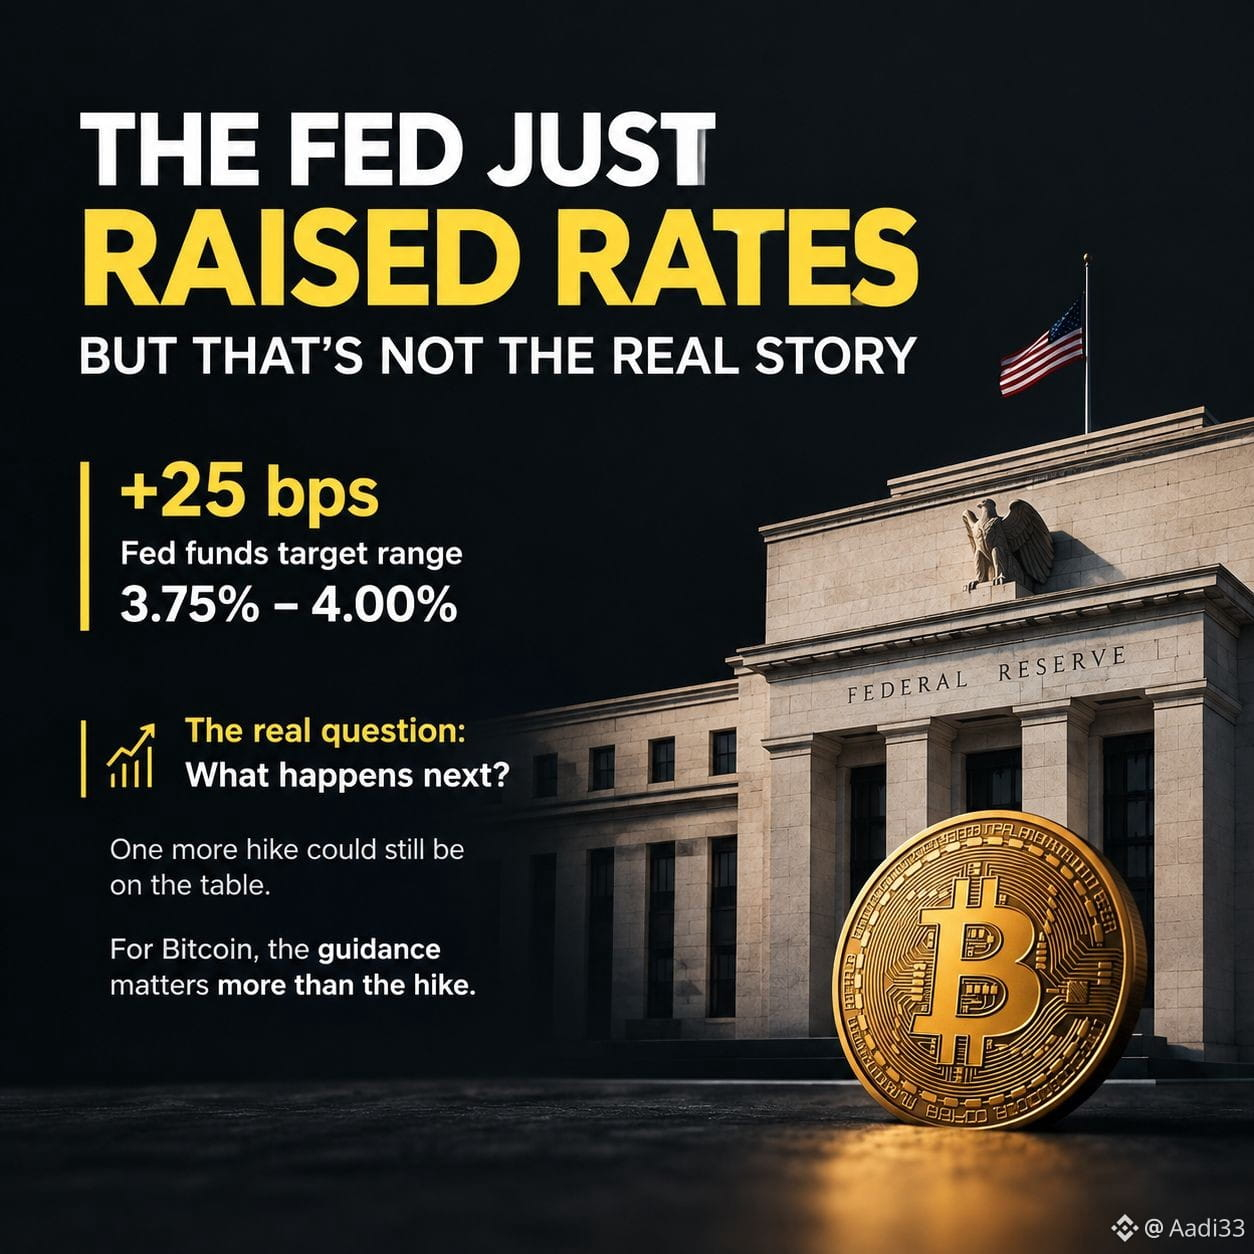
FRBは金利を引き上げた——しかし本当の話はそこじゃない
+25bp。
金利は現在3.75%〜4.00%です。
そして正直に言うと、今回の利上げ自体は驚きではありませんでした。市場はすでに織り込んでいました。
本当のサインは、FRBが次の一手について何を言っているかです。
もう1回の利上げがまだ選択肢として残っている可能性があります。
ビットコインにとっては、これは市場がそのガイダンスをどう解釈するかによって、非常に異なる状況を生みます。
利上げは一見すると弱気要因です。
しかし、投資家がこれを引き締めの最終局面だと見なすなら、反応はすぐに変わり得ます。
見出しを見ないで。
道筋を見てください。
本当のボラティリティが生まれうるのはそこです。
$BTC $ETH $ZEC
#Fed
FRBは金利を引き上げた——しかし本当の話はそこじゃない
+25bp。
金利は現在3.75%〜4.00%です。
そして正直に言うと、今回の利上げ自体は驚きではありませんでした。市場はすでに織り込んでいました。
本当のサインは、FRBが次の一手について何を言っているかです。
もう1回の利上げがまだ選択肢として残っている可能性があります。
ビットコインにとっては、これは市場がそのガイダンスをどう解釈するかによって、非常に異なる状況を生みます。
利上げは一見すると弱気要因です。
しかし、投資家がこれを引き締めの最終局面だと見なすなら、反応はすぐに変わり得ます。
見出しを見ないで。
道筋を見てください。
本当のボラティリティが生まれうるのはそこです。
$BTC $ETH $ZEC
#Fed
+25bp。
金利は現在3.75%〜4.00%です。
そして正直に言うと、今回の利上げ自体は驚きではありませんでした。市場はすでに織り込んでいました。
本当のサインは、FRBが次の一手について何を言っているかです。
もう1回の利上げがまだ選択肢として残っている可能性があります。
ビットコインにとっては、これは市場がそのガイダンスをどう解釈するかによって、非常に異なる状況を生みます。
利上げは一見すると弱気要因です。
しかし、投資家がこれを引き締めの最終局面だと見なすなら、反応はすぐに変わり得ます。
見出しを見ないで。
道筋を見てください。
本当のボラティリティが生まれうるのはそこです。
$BTC $ETH $ZEC
#Fed
6
907
·
--
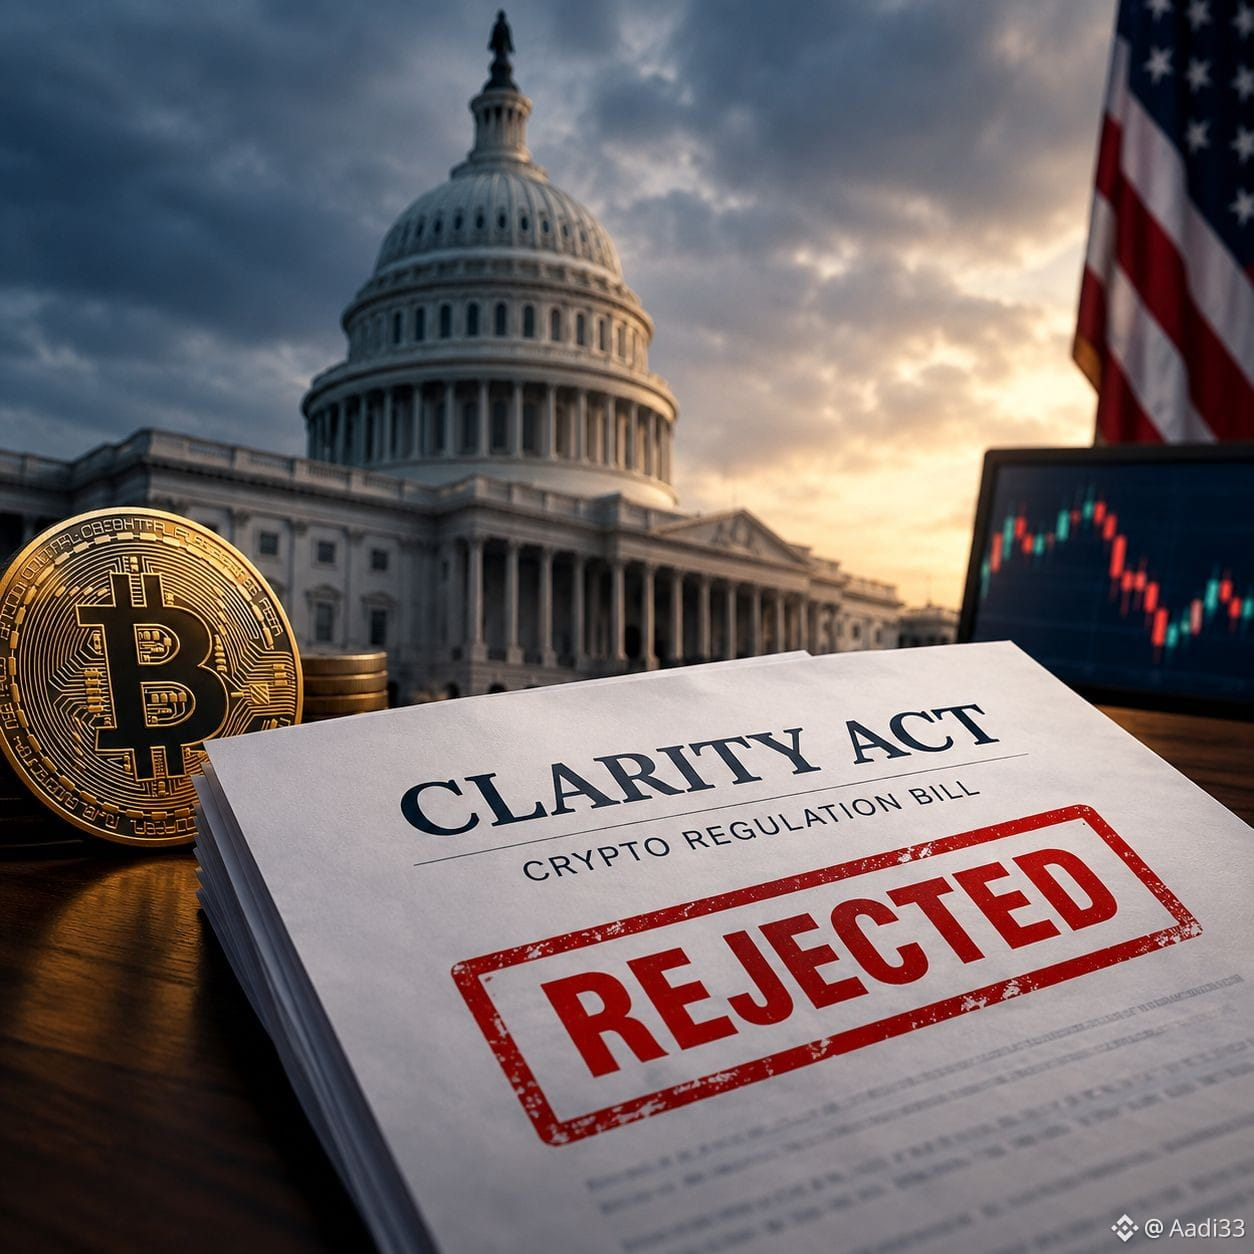
米国上院で「CLARITY(明確化)法」がたった今否決されました。
採決は49対50でした。
この法案は暗号資産(クリプト)のルールをより明確にするはずでした。
しかし議員たちは、ルール、倫理上の懸念、そして暗号資産に関する利害について合意できませんでした。
皮肉なことに?
「CLARITY(明確化)」と名付けられた法案が、暗号資産に対する不確実性をさらに増やしてしまいました。
次に何が起きると思いますか?
$BTC $ETH #Clarity
米国上院で「CLARITY(明確化)法」がたった今否決されました。
採決は49対50でした。
この法案は暗号資産(クリプト)のルールをより明確にするはずでした。
しかし議員たちは、ルール、倫理上の懸念、そして暗号資産に関する利害について合意できませんでした。
皮肉なことに?
「CLARITY(明確化)」と名付けられた法案が、暗号資産に対する不確実性をさらに増やしてしまいました。
次に何が起きると思いますか?
$BTC $ETH #Clarity
採決は49対50でした。
この法案は暗号資産(クリプト)のルールをより明確にするはずでした。
しかし議員たちは、ルール、倫理上の懸念、そして暗号資産に関する利害について合意できませんでした。
皮肉なことに?
「CLARITY(明確化)」と名付けられた法案が、暗号資産に対する不確実性をさらに増やしてしまいました。
次に何が起きると思いますか?
$BTC $ETH #Clarity
3
9
3.2k
·
--
今日の上院の採決ですが、これは本当の採決ではありません。法案を本会議で討議し始めることを許可するかどうかの採決にすぎません。
この案件は何か月も動けずにいました。2025年に下院を通過し、その後上院で停滞。7月にいったん棚上げされ、さらに8月にも棚上げ。ところが今週末、共和党が週末の間に120件以上の修正を入れたため、再び持ち上がりました。内容は主に、トランプの暗号資産取引に結び付いた倫理面のものです。
仮に今日通っても、実際に何かが変わるわけではありません。依然として本当に成立させるには60票が必要で、下院の版と一致させる必要があり、署名も必要です。そして下院は、今週中に中間選挙の後までワシントンを離れます。だから仮に今日勝てても、これを2026年までに終わらせる時間は多くありません。
私は、こうした「ビッグニュース」の日を十分に見てきました。市場は、見出しが本当に意味することではなく、見出しに反応することが多いということを知っています。今日の可決は、討議を続けるために話し合うことが許可される、ただそれだけを意味します。
$BTC $ETH $XRP
今日の上院の採決ですが、これは本当の採決ではありません。法案を本会議で討議し始めることを許可するかどうかの採決にすぎません。
この案件は何か月も動けずにいました。2025年に下院を通過し、その後上院で停滞。7月にいったん棚上げされ、さらに8月にも棚上げ。ところが今週末、共和党が週末の間に120件以上の修正を入れたため、再び持ち上がりました。内容は主に、トランプの暗号資産取引に結び付いた倫理面のものです。
仮に今日通っても、実際に何かが変わるわけではありません。依然として本当に成立させるには60票が必要で、下院の版と一致させる必要があり、署名も必要です。そして下院は、今週中に中間選挙の後までワシントンを離れます。だから仮に今日勝てても、これを2026年までに終わらせる時間は多くありません。
私は、こうした「ビッグニュース」の日を十分に見てきました。市場は、見出しが本当に意味することではなく、見出しに反応することが多いということを知っています。今日の可決は、討議を続けるために話し合うことが許可される、ただそれだけを意味します。
$BTC $ETH $XRP
この案件は何か月も動けずにいました。2025年に下院を通過し、その後上院で停滞。7月にいったん棚上げされ、さらに8月にも棚上げ。ところが今週末、共和党が週末の間に120件以上の修正を入れたため、再び持ち上がりました。内容は主に、トランプの暗号資産取引に結び付いた倫理面のものです。
仮に今日通っても、実際に何かが変わるわけではありません。依然として本当に成立させるには60票が必要で、下院の版と一致させる必要があり、署名も必要です。そして下院は、今週中に中間選挙の後までワシントンを離れます。だから仮に今日勝てても、これを2026年までに終わらせる時間は多くありません。
私は、こうした「ビッグニュース」の日を十分に見てきました。市場は、見出しが本当に意味することではなく、見出しに反応することが多いということを知っています。今日の可決は、討議を続けるために話し合うことが許可される、ただそれだけを意味します。
$BTC $ETH $XRP
2
5
458
·
--
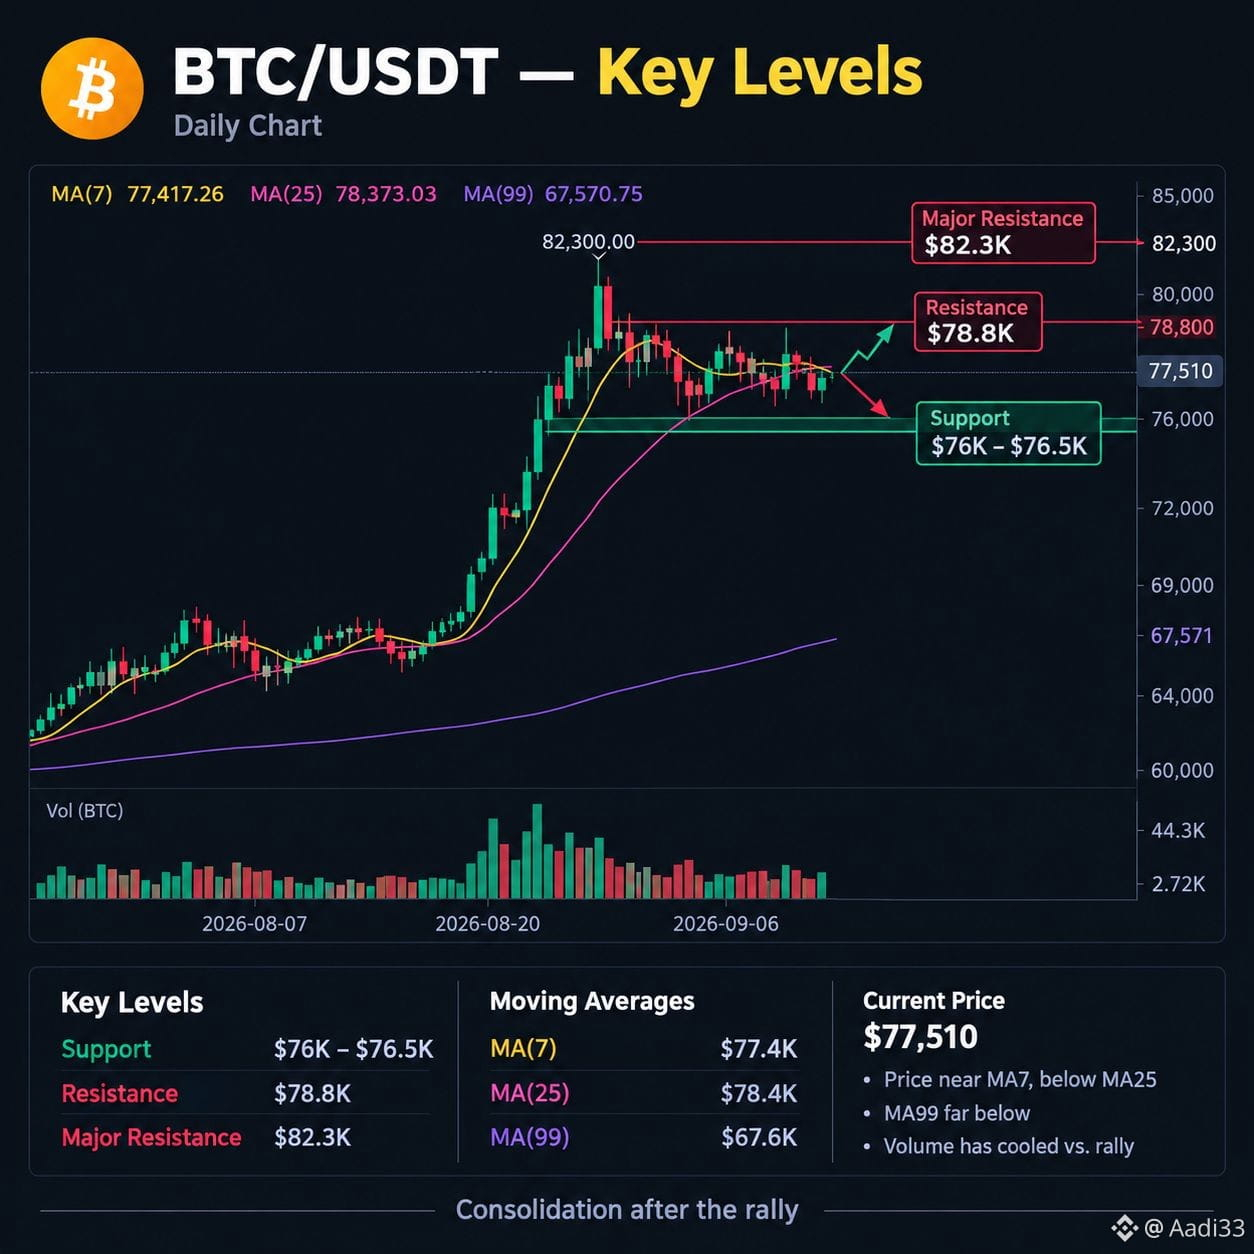
BTCは市場の忍耐力を試しています。
強いサポート+流動性の回収が、次の大きな動きを準備する可能性があります。
ここでのBTCを注意深く見ています。
赤い封筒を添付しました。早めに受け取ってください。
$BTC
BTCは市場の忍耐力を試しています。
強いサポート+流動性の回収が、次の大きな動きを準備する可能性があります。
ここでのBTCを注意深く見ています。
赤い封筒を添付しました。早めに受け取ってください。
$BTC
強いサポート+流動性の回収が、次の大きな動きを準備する可能性があります。
ここでのBTCを注意深く見ています。
赤い封筒を添付しました。早めに受け取ってください。
$BTC
11
5
35

·
--
ブリッシュ
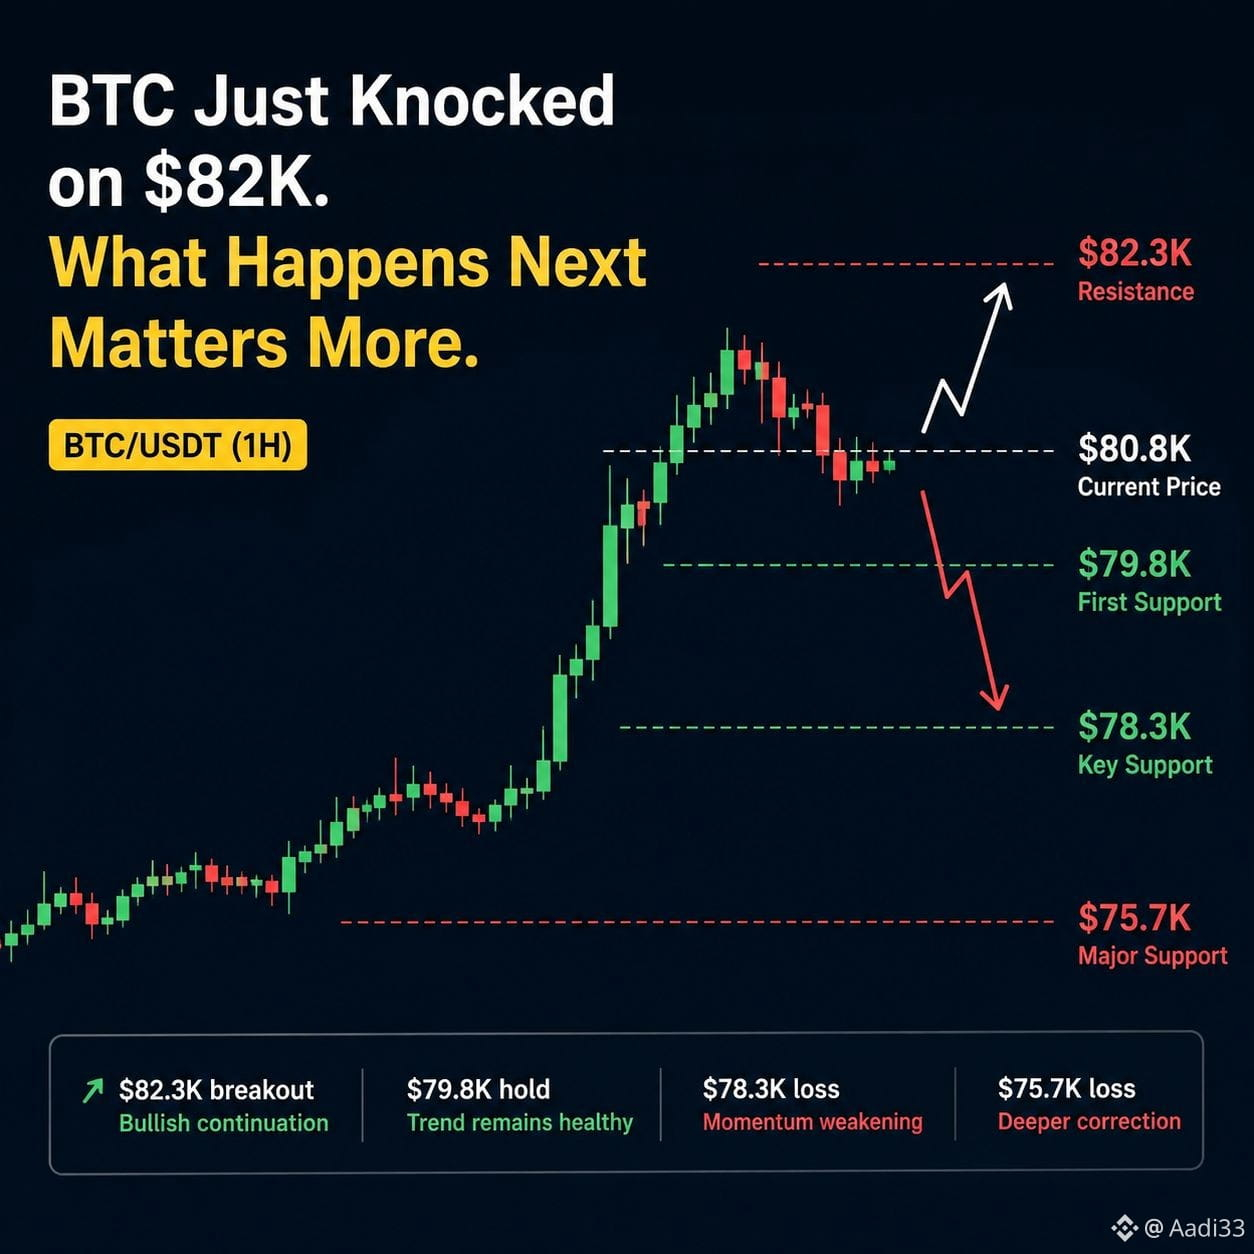
BTCがちょうど8.2万ドルをノックした。次に何が起こるかがもっと重要だ。
ビットコインは、みんなが待っていた動きをついに見せた。
ただし、これはまだ「確定したブレイクアウト」とは言えない。
1Hチャートでは、BTCは82.3Kドルにタッチしたあと約80.8Kドル付近にいる。構造はまだ前向きだ:
MA(7): $80.98K
MA(25): $79.86K
MA(99): $78.35K
これは短期のトレンドが強気であることを示しているが、垂直的な値動きの後、モメンタムはすでに冷えている。
重要なゾーンは81Kドル〜82.3Kドルだ。
ここではすでに売り手が現れている。82.3Kドルを上回る、きれいな1H/4Hの受け入れ(認証)が起きれば、構造はかなり変わり、90Kドルへの道が開ける可能性がある。ロイターも、82.8Kドル前後を主要なレジスタンスとして挙げている。
反対側では、$79.8Kが最初に注目する水準だ。
ここを失えば、BTCは99 MAが現在位置している78.3Kドルへ簡単に再訪するかもしれない。
そして、今日トレーダーが見落としてはいけない別の要因がある:
最新の上昇は、債券利回りの低下と、クリストファー・ウォラー氏の発言を受けたFRB政策に関する期待の後退によって後押しされた。だが、今日の米雇用統計の結果は、この見立てをすぐに変える可能性がある。
だから、私のBTCマップはシンプルだ:
$82.3Kブレイク → 強気の継続
$79.8K維持 → トレンドは健全なまま
$78.3K下落 → モメンタム低下
$75.7K下落 → もっと深い調整が起こり得る
面白いのは、ここでBTCがもう一段の巨大な青い(上昇)ローソク足を必要としないことだ。
必要なのは、82Kドルを上に控える売り手を買い手が吸収できることを証明すること。
それが、短期のショートスクイーズと、真のトレンド反転の違いだ。
あなたは、BTCがすぐに$82.3Kを突破するのを見たい? それともまず$79Kをリテストして、より強い土台を作る方がいいと思う?
$BTC #BTC #bitcoin #BTCanalysis
{future}(BTCUSDT)
BTCがちょうど8.2万ドルをノックした。次に何が起こるかがもっと重要だ。
ビットコインは、みんなが待っていた動きをついに見せた。
ただし、これはまだ「確定したブレイクアウト」とは言えない。
1Hチャートでは、BTCは82.3Kドルにタッチしたあと約80.8Kドル付近にいる。構造はまだ前向きだ:
MA(7): $80.98K
MA(25): $79.86K
MA(99): $78.35K
これは短期のトレンドが強気であることを示しているが、垂直的な値動きの後、モメンタムはすでに冷えている。
重要なゾーンは81Kドル〜82.3Kドルだ。
ここではすでに売り手が現れている。82.3Kドルを上回る、きれいな1H/4Hの受け入れ(認証)が起きれば、構造はかなり変わり、90Kドルへの道が開ける可能性がある。ロイターも、82.8Kドル前後を主要なレジスタンスとして挙げている。
反対側では、$79.8Kが最初に注目する水準だ。
ここを失えば、BTCは99 MAが現在位置している78.3Kドルへ簡単に再訪するかもしれない。
そして、今日トレーダーが見落としてはいけない別の要因がある:
最新の上昇は、債券利回りの低下と、クリストファー・ウォラー氏の発言を受けたFRB政策に関する期待の後退によって後押しされた。だが、今日の米雇用統計の結果は、この見立てをすぐに変える可能性がある。
だから、私のBTCマップはシンプルだ:
$82.3Kブレイク → 強気の継続
$79.8K維持 → トレンドは健全なまま
$78.3K下落 → モメンタム低下
$75.7K下落 → もっと深い調整が起こり得る
面白いのは、ここでBTCがもう一段の巨大な青い(上昇)ローソク足を必要としないことだ。
必要なのは、82Kドルを上に控える売り手を買い手が吸収できることを証明すること。
それが、短期のショートスクイーズと、真のトレンド反転の違いだ。
あなたは、BTCがすぐに$82.3Kを突破するのを見たい? それともまず$79Kをリテストして、より強い土台を作る方がいいと思う?
$BTC #BTC #bitcoin #BTCanalysis
ビットコインは、みんなが待っていた動きをついに見せた。
ただし、これはまだ「確定したブレイクアウト」とは言えない。
1Hチャートでは、BTCは82.3Kドルにタッチしたあと約80.8Kドル付近にいる。構造はまだ前向きだ:
MA(7): $80.98K
MA(25): $79.86K
MA(99): $78.35K
これは短期のトレンドが強気であることを示しているが、垂直的な値動きの後、モメンタムはすでに冷えている。
重要なゾーンは81Kドル〜82.3Kドルだ。
ここではすでに売り手が現れている。82.3Kドルを上回る、きれいな1H/4Hの受け入れ(認証)が起きれば、構造はかなり変わり、90Kドルへの道が開ける可能性がある。ロイターも、82.8Kドル前後を主要なレジスタンスとして挙げている。
反対側では、$79.8Kが最初に注目する水準だ。
ここを失えば、BTCは99 MAが現在位置している78.3Kドルへ簡単に再訪するかもしれない。
そして、今日トレーダーが見落としてはいけない別の要因がある:
最新の上昇は、債券利回りの低下と、クリストファー・ウォラー氏の発言を受けたFRB政策に関する期待の後退によって後押しされた。だが、今日の米雇用統計の結果は、この見立てをすぐに変える可能性がある。
だから、私のBTCマップはシンプルだ:
$82.3Kブレイク → 強気の継続
$79.8K維持 → トレンドは健全なまま
$78.3K下落 → モメンタム低下
$75.7K下落 → もっと深い調整が起こり得る
面白いのは、ここでBTCがもう一段の巨大な青い(上昇)ローソク足を必要としないことだ。
必要なのは、82Kドルを上に控える売り手を買い手が吸収できることを証明すること。
それが、短期のショートスクイーズと、真のトレンド反転の違いだ。
あなたは、BTCがすぐに$82.3Kを突破するのを見たい? それともまず$79Kをリテストして、より強い土台を作る方がいいと思う?
$BTC #BTC #bitcoin #BTCanalysis
2
117
·
--
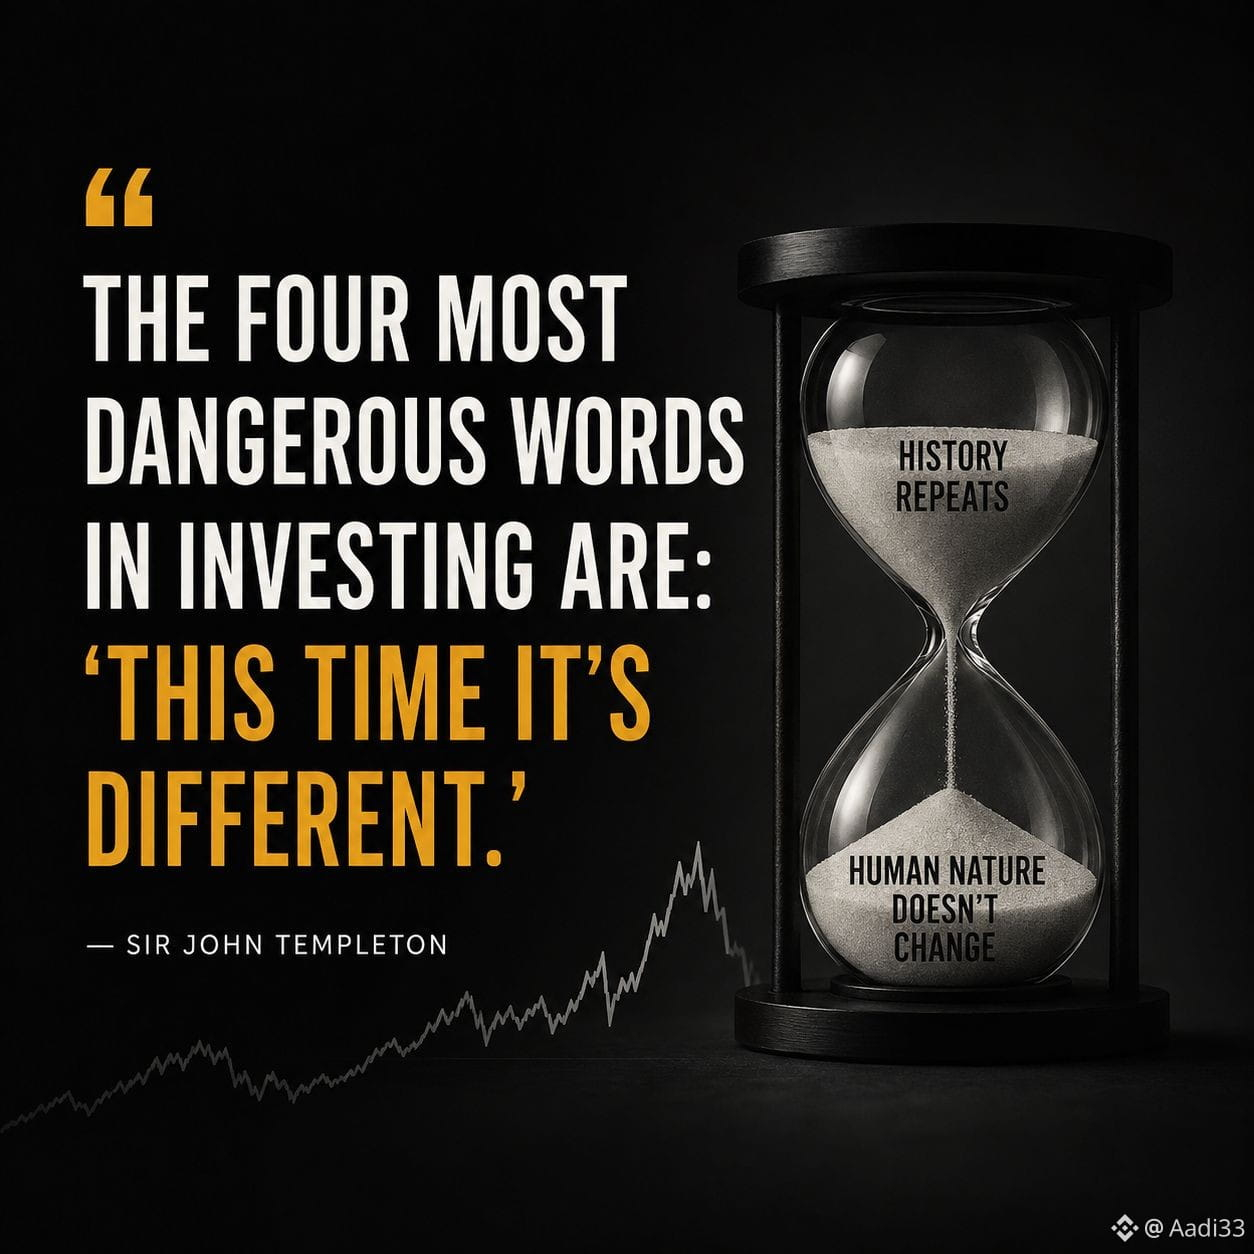
投資における最も危険な4つの言葉は「今回は違う。」
— ジョン・テンプルトン卿
この一文は、まさに今とりわけ関連性を感じます。
市場のサイクルのたびに、「これまでのルールはもう当てはまらない」という新しい説明が生まれます。
今回は地政学的リスクです。
今回はインフレです。
今回はFRB(米連邦準備制度)が問題です。
今回はビットコインが成熟したのです。
今回は機関投資家があらゆる下落局面で買い続けるはずです。
しかし市場には、「変数は変わるが、人間の行動は変わらない」ということを投資家に思い出させる癖があります。
私たちはビットコインが8月にかけて力強く回復したのを見たばかりなのに、その後9月に入ると、原油が上昇し、国債利回りが上がり、金融引き締めが強まるとの期待が高まることで、改めて圧力がかかってきました。BTCは80,000ドルを下回り、株式やその他のリスク資産も同様に圧迫を受けています。
重要な問いは、これが別の大きな下落局面の始まりなのかどうかではありません。
誰も、それを確実に知ることはできません。
より良い問いは、市場が本当に根本的なルールを変えたのか、それとも投資家が、自分たちがすでに信じたいと思っている価格を正当化するために、また新しい物語を見つけているだけなのか、ということです。
この違いは重要です。
「今回は違う」は主張(論拠)ではありません。
それは、あなたの前提をより注意深く検証せよという警告です。
市場は、不確かだと思っている人を罰することはめったにありません。
罰するのは、ちょうど最も間違っているタイミングで確信してしまう人です。
$BTC $ETH $SOL #Marketpsychology
{future}(SOLUSDT)
{future}(ETHUSDT)
{future}(BTCUSDT)
投資における最も危険な4つの言葉は「今回は違う。」
— ジョン・テンプルトン卿
この一文は、まさに今とりわけ関連性を感じます。
市場のサイクルのたびに、「これまでのルールはもう当てはまらない」という新しい説明が生まれます。
今回は地政学的リスクです。
今回はインフレです。
今回はFRB(米連邦準備制度)が問題です。
今回はビットコインが成熟したのです。
今回は機関投資家があらゆる下落局面で買い続けるはずです。
しかし市場には、「変数は変わるが、人間の行動は変わらない」ということを投資家に思い出させる癖があります。
私たちはビットコインが8月にかけて力強く回復したのを見たばかりなのに、その後9月に入ると、原油が上昇し、国債利回りが上がり、金融引き締めが強まるとの期待が高まることで、改めて圧力がかかってきました。BTCは80,000ドルを下回り、株式やその他のリスク資産も同様に圧迫を受けています。
重要な問いは、これが別の大きな下落局面の始まりなのかどうかではありません。
誰も、それを確実に知ることはできません。
より良い問いは、市場が本当に根本的なルールを変えたのか、それとも投資家が、自分たちがすでに信じたいと思っている価格を正当化するために、また新しい物語を見つけているだけなのか、ということです。
この違いは重要です。
「今回は違う」は主張(論拠)ではありません。
それは、あなたの前提をより注意深く検証せよという警告です。
市場は、不確かだと思っている人を罰することはめったにありません。
罰するのは、ちょうど最も間違っているタイミングで確信してしまう人です。
$BTC $ETH $SOL #Marketpsychology
— ジョン・テンプルトン卿
この一文は、まさに今とりわけ関連性を感じます。
市場のサイクルのたびに、「これまでのルールはもう当てはまらない」という新しい説明が生まれます。
今回は地政学的リスクです。
今回はインフレです。
今回はFRB(米連邦準備制度)が問題です。
今回はビットコインが成熟したのです。
今回は機関投資家があらゆる下落局面で買い続けるはずです。
しかし市場には、「変数は変わるが、人間の行動は変わらない」ということを投資家に思い出させる癖があります。
私たちはビットコインが8月にかけて力強く回復したのを見たばかりなのに、その後9月に入ると、原油が上昇し、国債利回りが上がり、金融引き締めが強まるとの期待が高まることで、改めて圧力がかかってきました。BTCは80,000ドルを下回り、株式やその他のリスク資産も同様に圧迫を受けています。
重要な問いは、これが別の大きな下落局面の始まりなのかどうかではありません。
誰も、それを確実に知ることはできません。
より良い問いは、市場が本当に根本的なルールを変えたのか、それとも投資家が、自分たちがすでに信じたいと思っている価格を正当化するために、また新しい物語を見つけているだけなのか、ということです。
この違いは重要です。
「今回は違う」は主張(論拠)ではありません。
それは、あなたの前提をより注意深く検証せよという警告です。
市場は、不確かだと思っている人を罰することはめったにありません。
罰するのは、ちょうど最も間違っているタイミングで確信してしまう人です。
$BTC $ETH $SOL #Marketpsychology
3
4
461
·
--
誰もまだ見ていないBTCの動き…
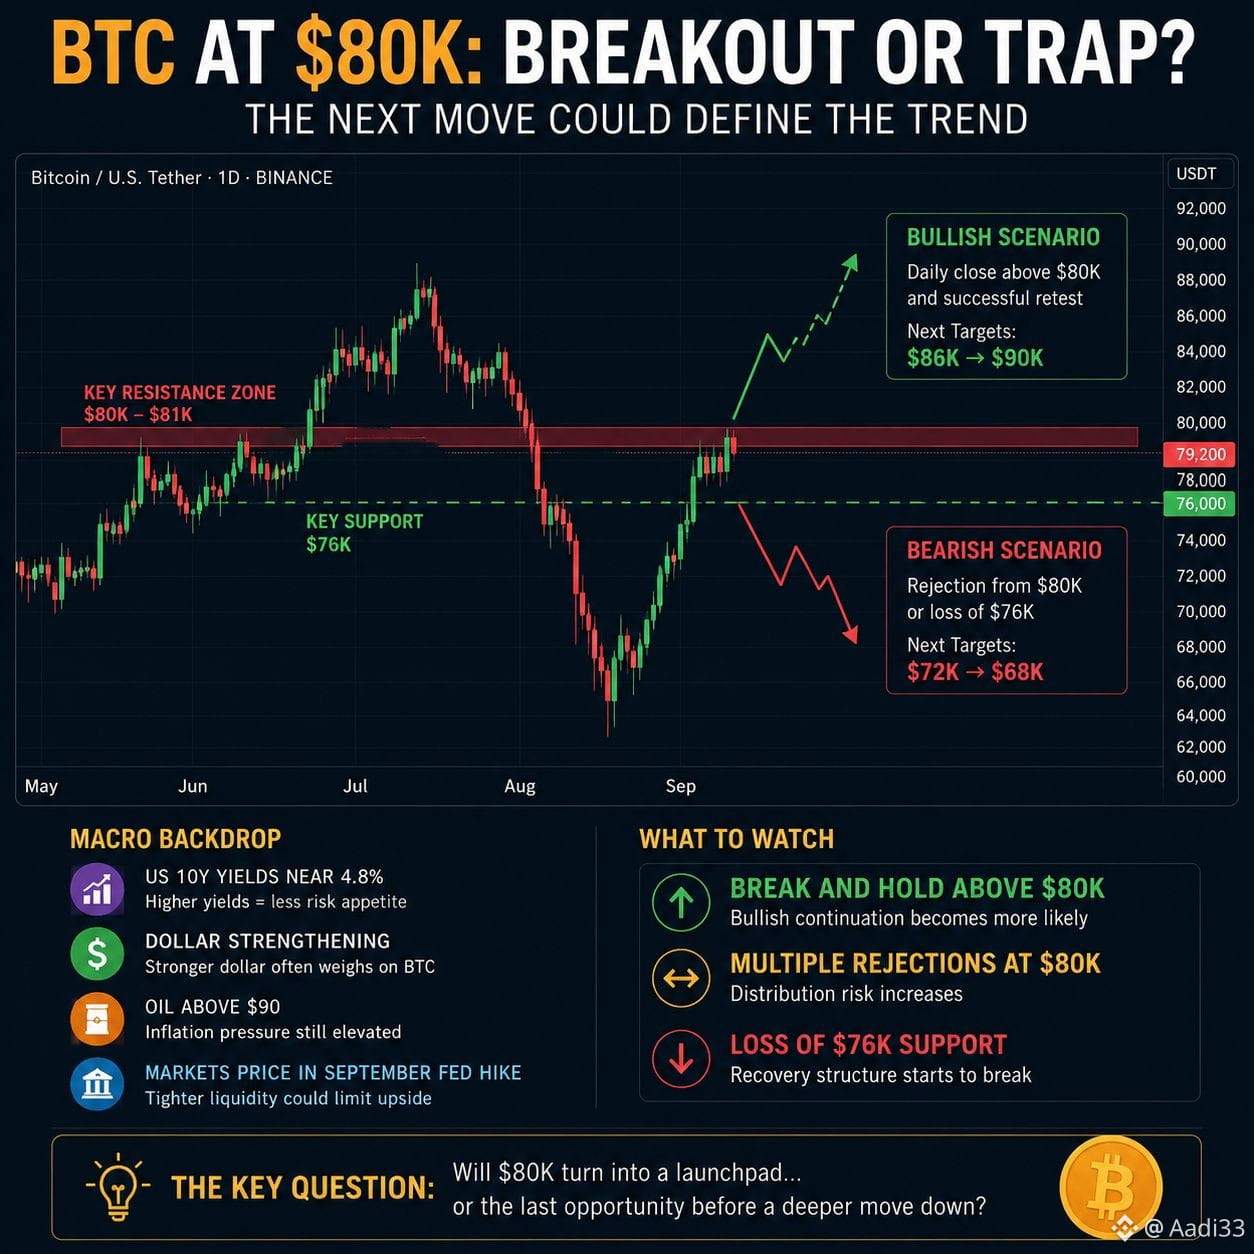
ビットコインは8万ドルへ向けて押し上げていますが、現在の局面の下には興味深い何かが隠れています。
8万ドル回復 → 8.6万〜9万ドル
7.6万ドル損失 → 回復の構造が弱まる
そして9月…
何年も、BTCはこの月に何度も苦戦してきました。ところが、そのパターンが突然変わったのです。
歴史が静かにもう一度繰り返す準備をしているのか、それとも2026年が完全にそのパターンを破ろうとしているのか?
本当の疑問:最初に罠にかかるのは誰?
$BTC #BTC80K
{future}(BTCUSDT)
誰もまだ見ていないBTCの動き…
ビットコインは8万ドルへ向けて押し上げていますが、現在の局面の下には興味深い何かが隠れています。
8万ドル回復 → 8.6万〜9万ドル
7.6万ドル損失 → 回復の構造が弱まる
そして9月…
何年も、BTCはこの月に何度も苦戦してきました。ところが、そのパターンが突然変わったのです。
歴史が静かにもう一度繰り返す準備をしているのか、それとも2026年が完全にそのパターンを破ろうとしているのか?
本当の疑問:最初に罠にかかるのは誰?
$BTC #BTC80K
ビットコインは8万ドルへ向けて押し上げていますが、現在の局面の下には興味深い何かが隠れています。
8万ドル回復 → 8.6万〜9万ドル
7.6万ドル損失 → 回復の構造が弱まる
そして9月…
何年も、BTCはこの月に何度も苦戦してきました。ところが、そのパターンが突然変わったのです。
歴史が静かにもう一度繰り返す準備をしているのか、それとも2026年が完全にそのパターンを破ろうとしているのか?
本当の疑問:最初に罠にかかるのは誰?
$BTC #BTC80K
3
116
·
--
ブリッシュ
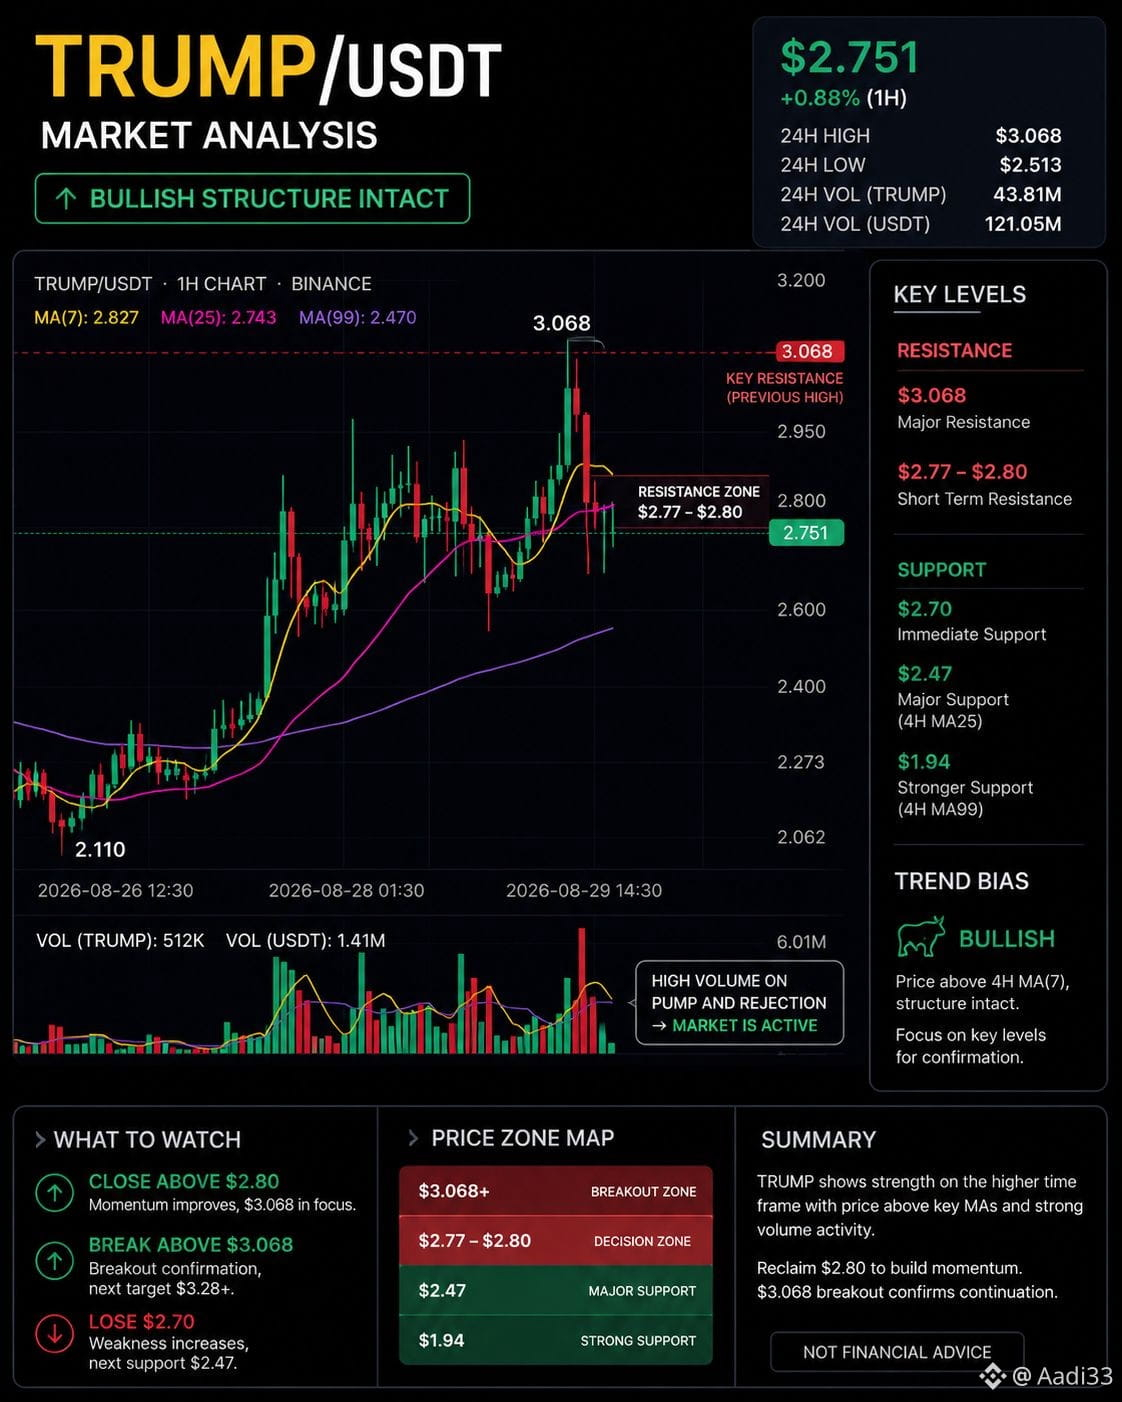
トランプは強気の構造を維持しているが、次の動きは1つの重要なゾーンにかかっている。
価格はおよそ$2.75で、4H MA(7)が$2.735、MA(25)が$2.471だ。
主要な抵抗は$2.80。そこを強く終値で上回れば、$3.068が再び注目される可能性がある。
もし$2.70が割れれば、次の主要なサポートはおよそ$2.47に位置する。
だから私の見立てはシンプルだ:
$2.80超 → 強気モメンタム
$3.068超 → ブレイク確認
$2.70未満 → 注意
チャートは強気だが、まず$2.80を取り戻す必要がある。
$TRUMP #bullish #TrumpCrypto
{future}(TRUMPUSDT)
トランプは強気の構造を維持しているが、次の動きは1つの重要なゾーンにかかっている。
価格はおよそ$2.75で、4H MA(7)が$2.735、MA(25)が$2.471だ。
主要な抵抗は$2.80。そこを強く終値で上回れば、$3.068が再び注目される可能性がある。
もし$2.70が割れれば、次の主要なサポートはおよそ$2.47に位置する。
だから私の見立てはシンプルだ:
$2.80超 → 強気モメンタム
$3.068超 → ブレイク確認
$2.70未満 → 注意
チャートは強気だが、まず$2.80を取り戻す必要がある。
$TRUMP #bullish #TrumpCrypto
価格はおよそ$2.75で、4H MA(7)が$2.735、MA(25)が$2.471だ。
主要な抵抗は$2.80。そこを強く終値で上回れば、$3.068が再び注目される可能性がある。
もし$2.70が割れれば、次の主要なサポートはおよそ$2.47に位置する。
だから私の見立てはシンプルだ:
$2.80超 → 強気モメンタム
$3.068超 → ブレイク確認
$2.70未満 → 注意
チャートは強気だが、まず$2.80を取り戻す必要がある。
$TRUMP #bullish #TrumpCrypto
2
191
·
--
ブリッシュ
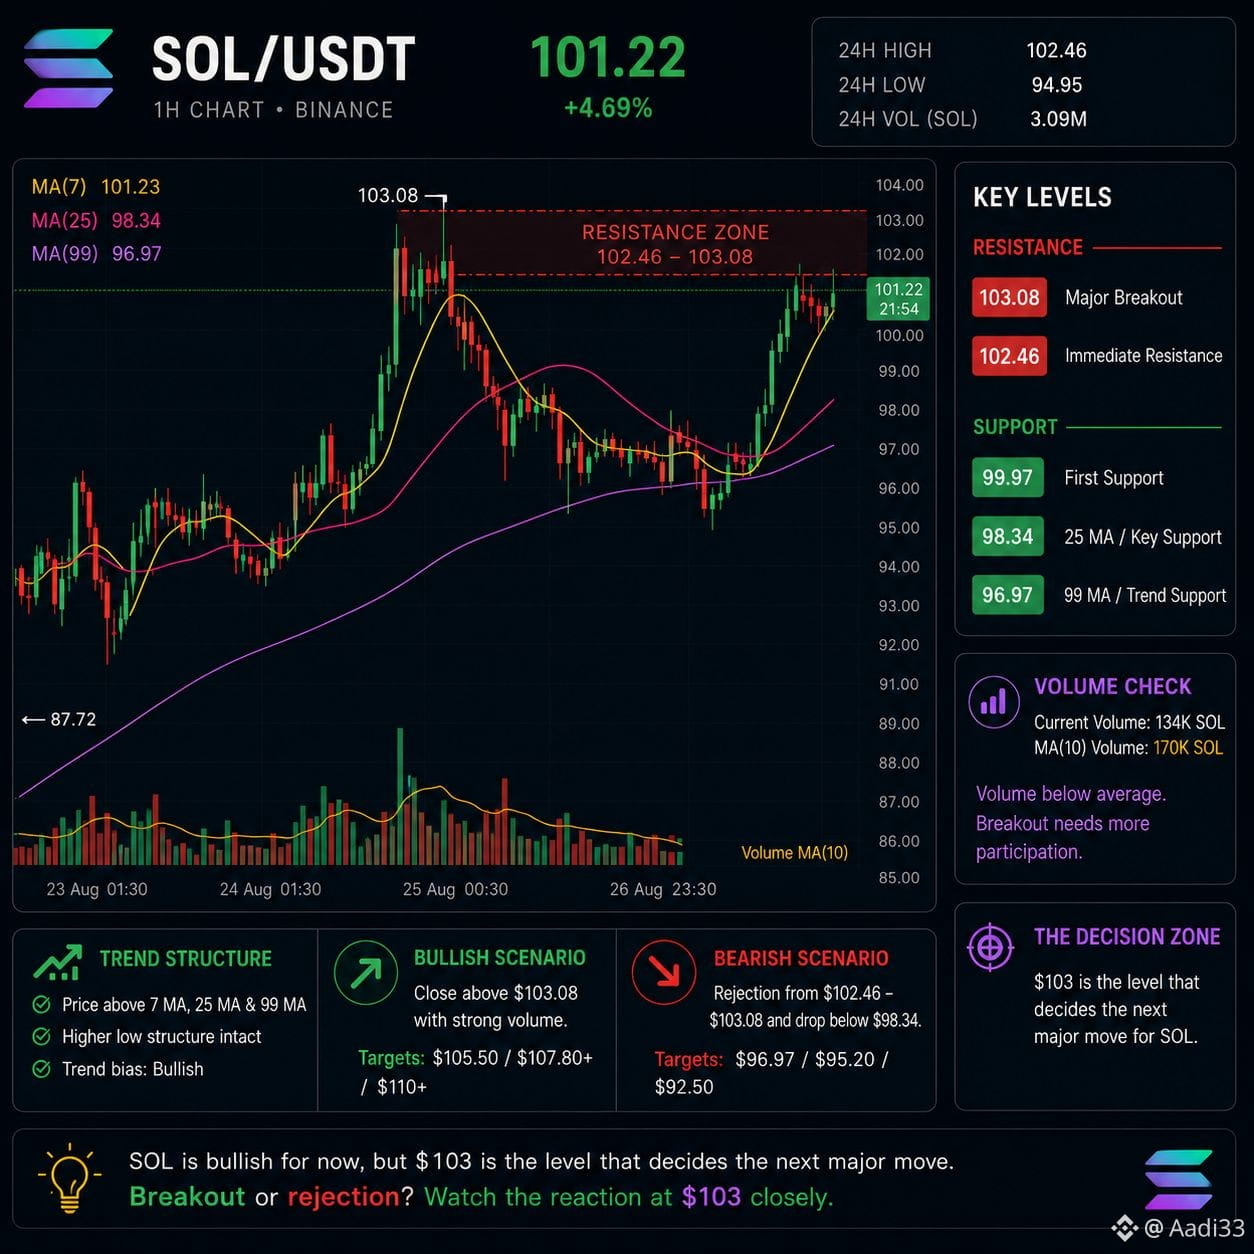
SOLは決断ゾーンにいる
SOLは$100の上に戻ってきましたが、注目すべきは4.7%の値動きそのものではありません。
1Hチャートでは、構造が大きく改善しています。
価格は$98.34の25MAと$96.97の99MAを上回って維持しており、一方で短期の7MAは約$101.23あたりにあります。これにより、現時点でのトレンドははっきりと強気側です。
しかし問題があります。
SOLは現在、$102.46〜$103.08のレジスタンス帯に接近しています。直前のリジェクトはほぼこのゾーンから正確に起きました。
今回の上昇にも注意が必要です。価格は高値へ押し上げられていますが、出来高は10本平均で約170Kのところ、現在は約134K SOLです。これまでのところ、ブレイクアウトの試みには圧倒的な出来高による裏付けがありません。
私のレベル:
$103.08:主要なブレイクアウト・レベル
$102.46:直近のレジスタンス
$99.97:最初のサポート
$98.34:25MAおよび重要な短期サポート
$96.97:99MAおよびより深いトレンド・サポート
もしSOLが出来高のより強い状況で$103を確信を持って終値で上抜けるなら、直近のレンジは新たな上昇局面へ移行している可能性があります。
もし再び跳ね返されるなら、まず$100を見て、その後$98.34を注視します。後者を失うと、現在の構造はかなり弱くなります。
このセットアップは強気ですが、$103こそがSOLにとって「証明が必要な場所」です。
これはブレイクアウトのセットアップとして扱うべきですか?それとも、別のリジェクトが起きるのを待っている状況でしょうか?
$SOL #solonapumping
{future}(SOLUSDT)
SOLは決断ゾーンにいる
SOLは$100の上に戻ってきましたが、注目すべきは4.7%の値動きそのものではありません。
1Hチャートでは、構造が大きく改善しています。
価格は$98.34の25MAと$96.97の99MAを上回って維持しており、一方で短期の7MAは約$101.23あたりにあります。これにより、現時点でのトレンドははっきりと強気側です。
しかし問題があります。
SOLは現在、$102.46〜$103.08のレジスタンス帯に接近しています。直前のリジェクトはほぼこのゾーンから正確に起きました。
今回の上昇にも注意が必要です。価格は高値へ押し上げられていますが、出来高は10本平均で約170Kのところ、現在は約134K SOLです。これまでのところ、ブレイクアウトの試みには圧倒的な出来高による裏付けがありません。
私のレベル:
$103.08:主要なブレイクアウト・レベル
$102.46:直近のレジスタンス
$99.97:最初のサポート
$98.34:25MAおよび重要な短期サポート
$96.97:99MAおよびより深いトレンド・サポート
もしSOLが出来高のより強い状況で$103を確信を持って終値で上抜けるなら、直近のレンジは新たな上昇局面へ移行している可能性があります。
もし再び跳ね返されるなら、まず$100を見て、その後$98.34を注視します。後者を失うと、現在の構造はかなり弱くなります。
このセットアップは強気ですが、$103こそがSOLにとって「証明が必要な場所」です。
これはブレイクアウトのセットアップとして扱うべきですか?それとも、別のリジェクトが起きるのを待っている状況でしょうか?
$SOL #solonapumping
SOLは$100の上に戻ってきましたが、注目すべきは4.7%の値動きそのものではありません。
1Hチャートでは、構造が大きく改善しています。
価格は$98.34の25MAと$96.97の99MAを上回って維持しており、一方で短期の7MAは約$101.23あたりにあります。これにより、現時点でのトレンドははっきりと強気側です。
しかし問題があります。
SOLは現在、$102.46〜$103.08のレジスタンス帯に接近しています。直前のリジェクトはほぼこのゾーンから正確に起きました。
今回の上昇にも注意が必要です。価格は高値へ押し上げられていますが、出来高は10本平均で約170Kのところ、現在は約134K SOLです。これまでのところ、ブレイクアウトの試みには圧倒的な出来高による裏付けがありません。
私のレベル:
$103.08:主要なブレイクアウト・レベル
$102.46:直近のレジスタンス
$99.97:最初のサポート
$98.34:25MAおよび重要な短期サポート
$96.97:99MAおよびより深いトレンド・サポート
もしSOLが出来高のより強い状況で$103を確信を持って終値で上抜けるなら、直近のレンジは新たな上昇局面へ移行している可能性があります。
もし再び跳ね返されるなら、まず$100を見て、その後$98.34を注視します。後者を失うと、現在の構造はかなり弱くなります。
このセットアップは強気ですが、$103こそがSOLにとって「証明が必要な場所」です。
これはブレイクアウトのセットアップとして扱うべきですか?それとも、別のリジェクトが起きるのを待っている状況でしょうか?
$SOL #solonapumping
4
238
·
--
本人確認中
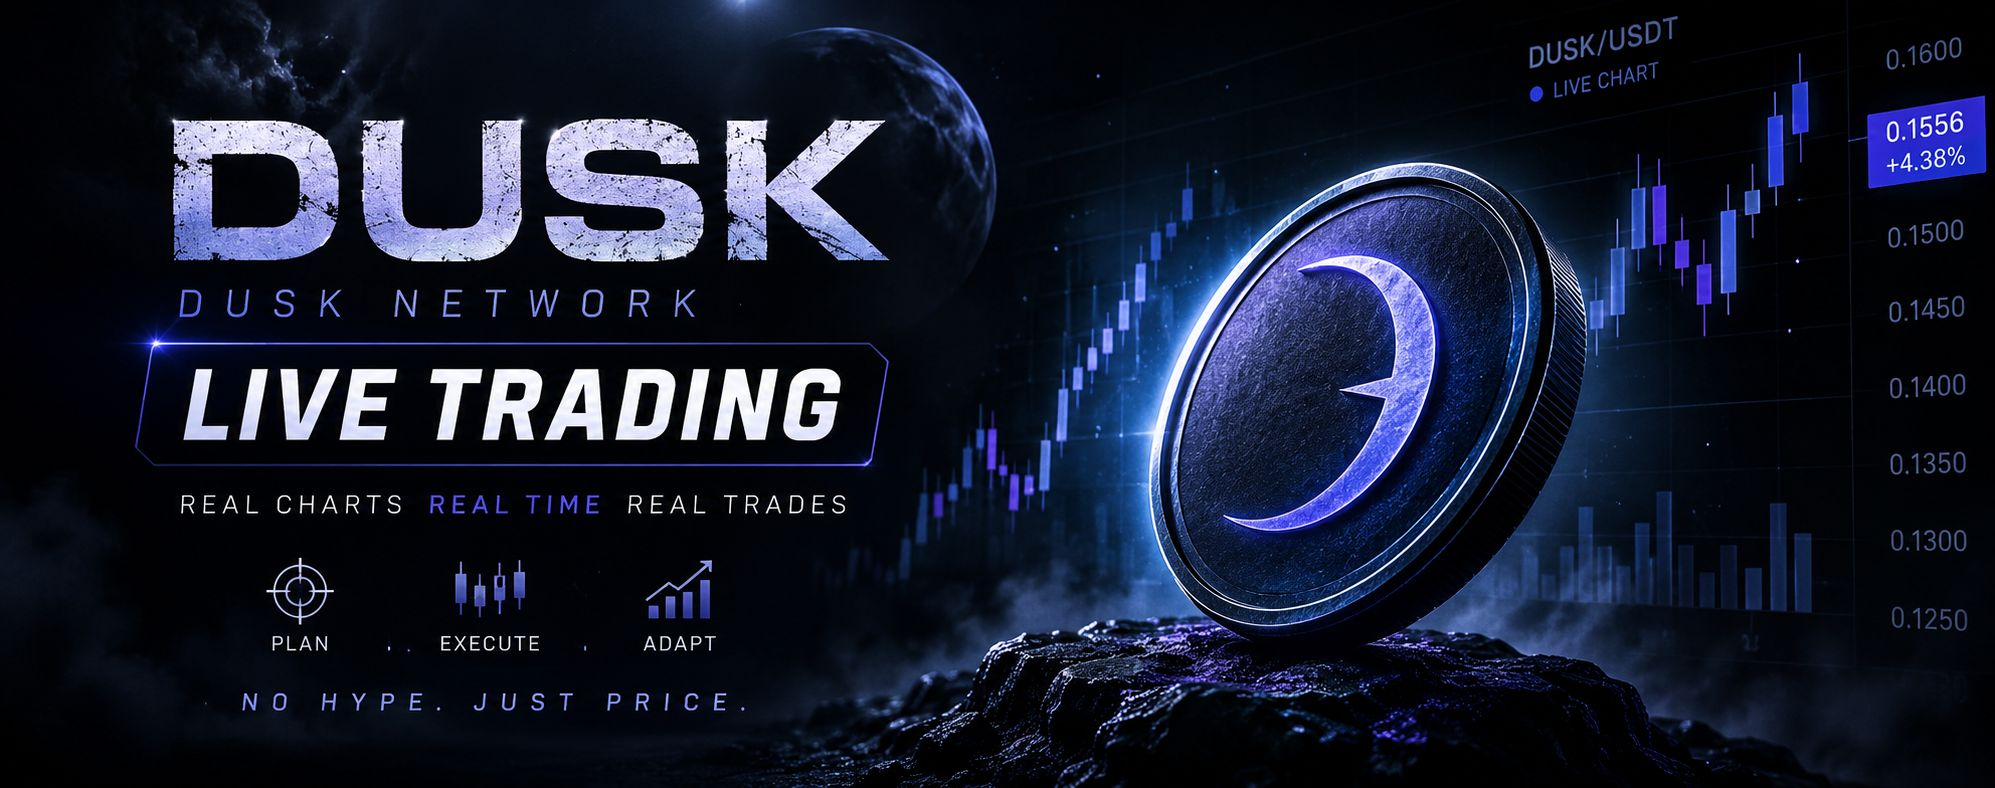
$DUSK 26.4K USDT(30日間の取引)
#dusk $DUSK @Dusk_Foundation
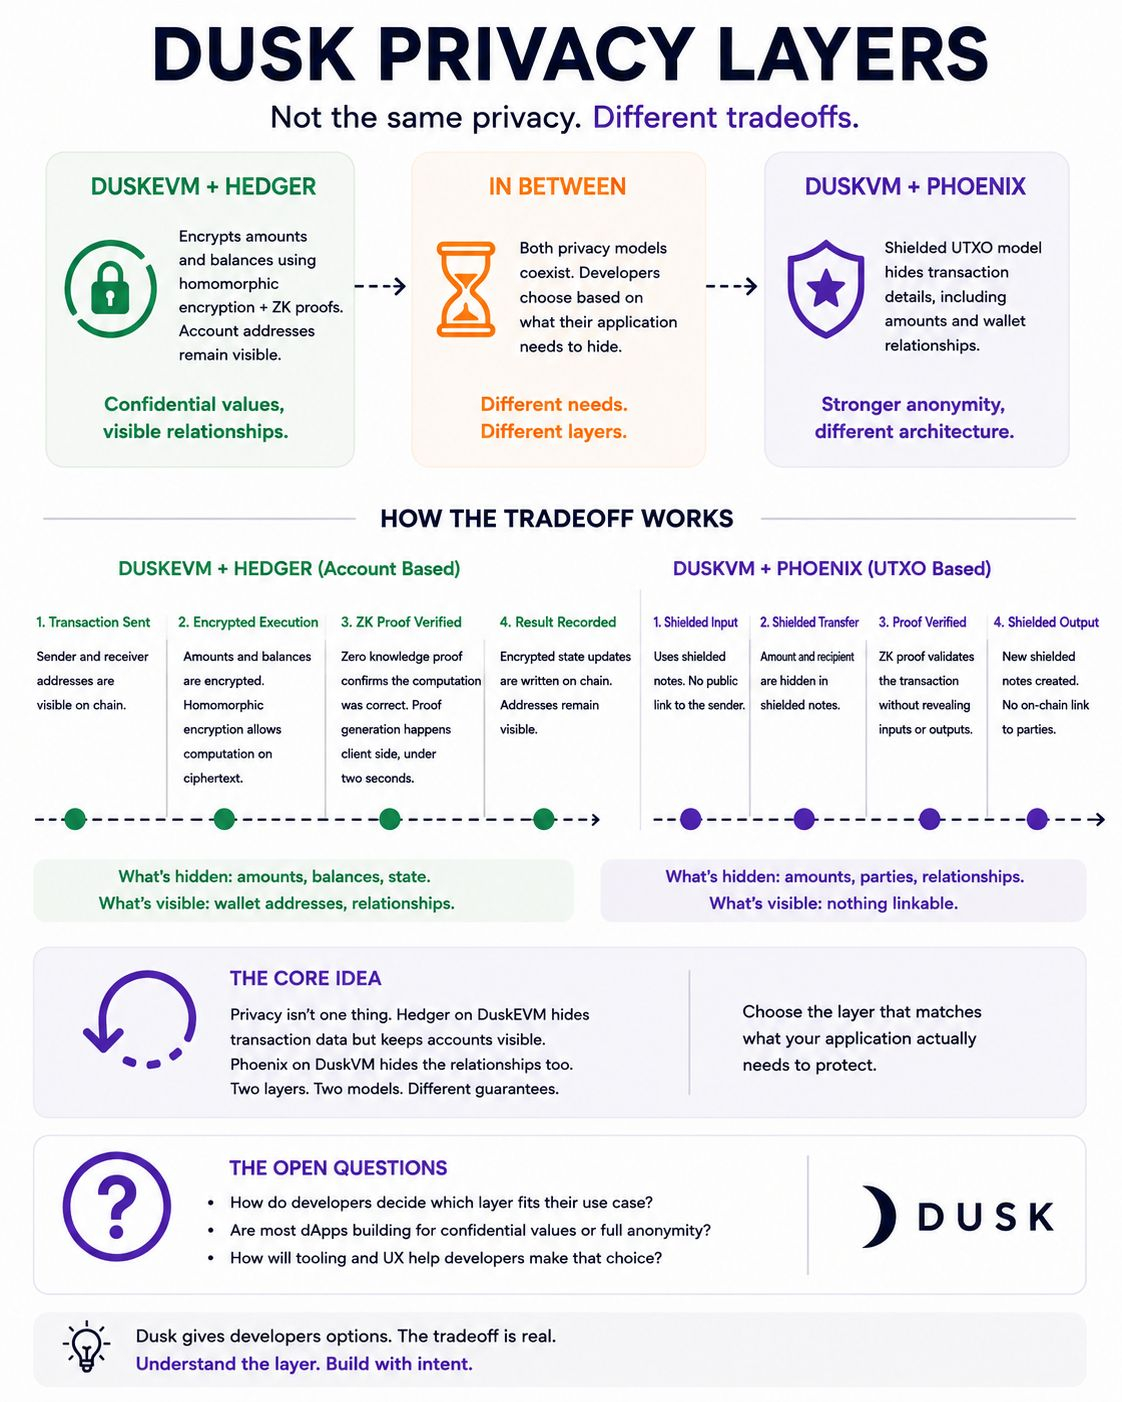
暗号化されたトランザクションは、送信者・受信者・金額など“全部”を隠すことで全体を覆い隠すものだと思っていました。ところが、dusk の最新プライバシー・エンジンは、そのうちの1つしか隠さないようです。
最初に Hedger を見たとき、ホモモルフィック暗号こそが彼らの最強のプライバシー手段だと本気で思いました。実際に露出したままになるのは、むしろもっと面白い部分です。
その理由を説明します。Hedger は duskevm 上で動きます。duskevm は完全に EVM と互換なので、イーサリアムの開発者はソリディティのコントラクトをそのまま移植できます。この互換性は、イーサリアムと同じアカウントベースを維持していることによって成り立っています。つまり、各アカウントには見えるアドレスがあり、これは dusk 本来の UTXO(未使用取引出力)型アーキテクチャとは別のプライバシーモデルを生み出します。
そこで Hedger は、その“可視性”の中で起きることを暗号化します。エリプティック曲線上のエルガマルをベースにしたホモモルフィック暗号を使い、ネットワークは復号することなく暗号化された値に対して計算できます。さらに、ゼロ知識証明で、その計算が正しく行われたことも確認します。残高や送金額はエンドツーエンドで暗号化されたままです。証明生成はクライアント側で行われ、2秒未満です。
ただ、予想していなかったのは、これが完全な匿名性を提供しないことでした。dusk 自身が説明しているとおり、アカウントベースの EVM モデルは、別のトランザクション・アーキテクチャを使う“シールド型の phoenix”とは異なり、 Hedger が提供できる匿名性の度合いを制限してしまいます。
Hedger が速く、導入しやすく、既存のイーサリアムの開発ツールと互換であるように設計されている――その同じ要因こそが、このプライバシー上のトレードオフを生んでいるのです。
そして私自身、開発者がどちらのレイヤーが自分のユースケースに合うのかを、どう判断すべきかまだ分かっていません。dusk e v m に Hedger を組み合わせるのか、それともネイティブの dusk v m に phoenix を使うのか。どちらも“privacy”という同じ言葉で説明されるのに、実際にはまったく別のプライバシーモデルを提供しているからです。
$ONG $EDEN #Dusk/usdt✅ #BinanceSquareTalks
#dusk $DUSK @Dusk
暗号化されたトランザクションは、送信者・受信者・金額など“全部”を隠すことで全体を覆い隠すものだと思っていました。ところが、dusk の最新プライバシー・エンジンは、そのうちの1つしか隠さないようです。
最初に Hedger を見たとき、ホモモルフィック暗号こそが彼らの最強のプライバシー手段だと本気で思いました。実際に露出したままになるのは、むしろもっと面白い部分です。
その理由を説明します。Hedger は duskevm 上で動きます。duskevm は完全に EVM と互換なので、イーサリアムの開発者はソリディティのコントラクトをそのまま移植できます。この互換性は、イーサリアムと同じアカウントベースを維持していることによって成り立っています。つまり、各アカウントには見えるアドレスがあり、これは dusk 本来の UTXO(未使用取引出力)型アーキテクチャとは別のプライバシーモデルを生み出します。
そこで Hedger は、その“可視性”の中で起きることを暗号化します。エリプティック曲線上のエルガマルをベースにしたホモモルフィック暗号を使い、ネットワークは復号することなく暗号化された値に対して計算できます。さらに、ゼロ知識証明で、その計算が正しく行われたことも確認します。残高や送金額はエンドツーエンドで暗号化されたままです。証明生成はクライアント側で行われ、2秒未満です。
ただ、予想していなかったのは、これが完全な匿名性を提供しないことでした。dusk 自身が説明しているとおり、アカウントベースの EVM モデルは、別のトランザクション・アーキテクチャを使う“シールド型の phoenix”とは異なり、 Hedger が提供できる匿名性の度合いを制限してしまいます。
Hedger が速く、導入しやすく、既存のイーサリアムの開発ツールと互換であるように設計されている――その同じ要因こそが、このプライバシー上のトレードオフを生んでいるのです。
そして私自身、開発者がどちらのレイヤーが自分のユースケースに合うのかを、どう判断すべきかまだ分かっていません。dusk e v m に Hedger を組み合わせるのか、それともネイティブの dusk v m に phoenix を使うのか。どちらも“privacy”という同じ言葉で説明されるのに、実際にはまったく別のプライバシーモデルを提供しているからです。
$ONG $EDEN #Dusk/usdt✅ #BinanceSquareTalks
暗号化されたトランザクションは、送信者・受信者・金額など“全部”を隠すことで全体を覆い隠すものだと思っていました。ところが、dusk の最新プライバシー・エンジンは、そのうちの1つしか隠さないようです。
最初に Hedger を見たとき、ホモモルフィック暗号こそが彼らの最強のプライバシー手段だと本気で思いました。実際に露出したままになるのは、むしろもっと面白い部分です。
その理由を説明します。Hedger は duskevm 上で動きます。duskevm は完全に EVM と互換なので、イーサリアムの開発者はソリディティのコントラクトをそのまま移植できます。この互換性は、イーサリアムと同じアカウントベースを維持していることによって成り立っています。つまり、各アカウントには見えるアドレスがあり、これは dusk 本来の UTXO(未使用取引出力)型アーキテクチャとは別のプライバシーモデルを生み出します。
そこで Hedger は、その“可視性”の中で起きることを暗号化します。エリプティック曲線上のエルガマルをベースにしたホモモルフィック暗号を使い、ネットワークは復号することなく暗号化された値に対して計算できます。さらに、ゼロ知識証明で、その計算が正しく行われたことも確認します。残高や送金額はエンドツーエンドで暗号化されたままです。証明生成はクライアント側で行われ、2秒未満です。
ただ、予想していなかったのは、これが完全な匿名性を提供しないことでした。dusk 自身が説明しているとおり、アカウントベースの EVM モデルは、別のトランザクション・アーキテクチャを使う“シールド型の phoenix”とは異なり、 Hedger が提供できる匿名性の度合いを制限してしまいます。
Hedger が速く、導入しやすく、既存のイーサリアムの開発ツールと互換であるように設計されている――その同じ要因こそが、このプライバシー上のトレードオフを生んでいるのです。
そして私自身、開発者がどちらのレイヤーが自分のユースケースに合うのかを、どう判断すべきかまだ分かっていません。dusk e v m に Hedger を組み合わせるのか、それともネイティブの dusk v m に phoenix を使うのか。どちらも“privacy”という同じ言葉で説明されるのに、実際にはまったく別のプライバシーモデルを提供しているからです。
$ONG $EDEN #Dusk/usdt✅ #BinanceSquareTalks
4
6
328
·
--
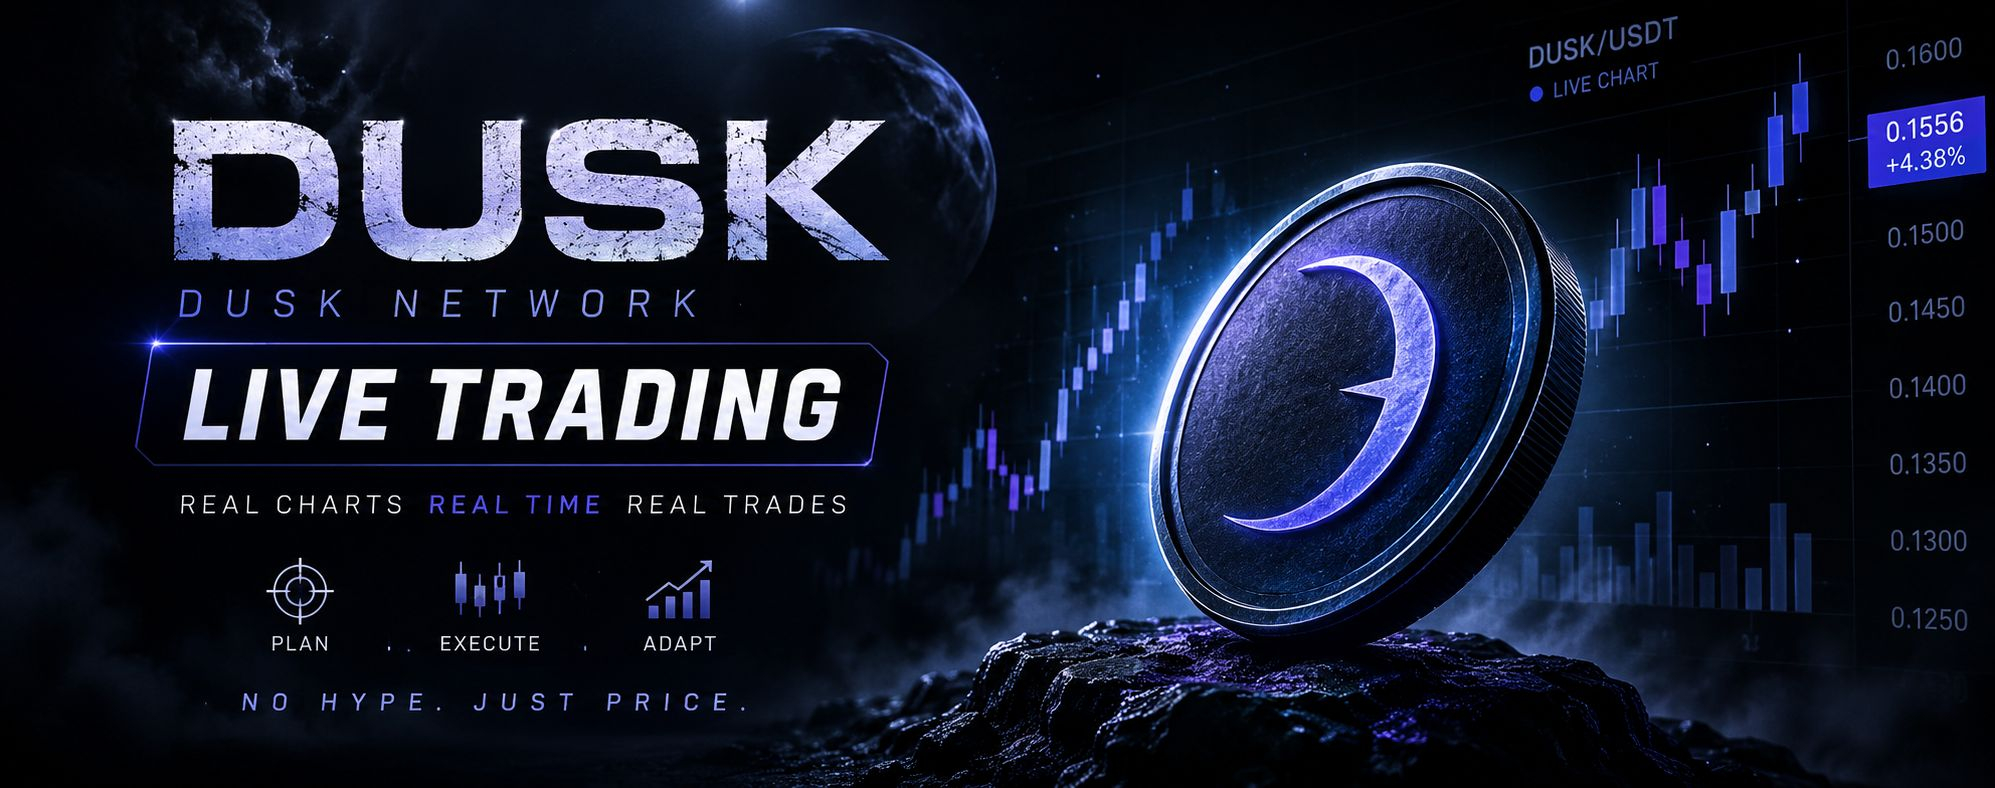
$DUSK 22.4K USDT(30日間の取引)
#dusk $DUSK @Dusk_Foundation
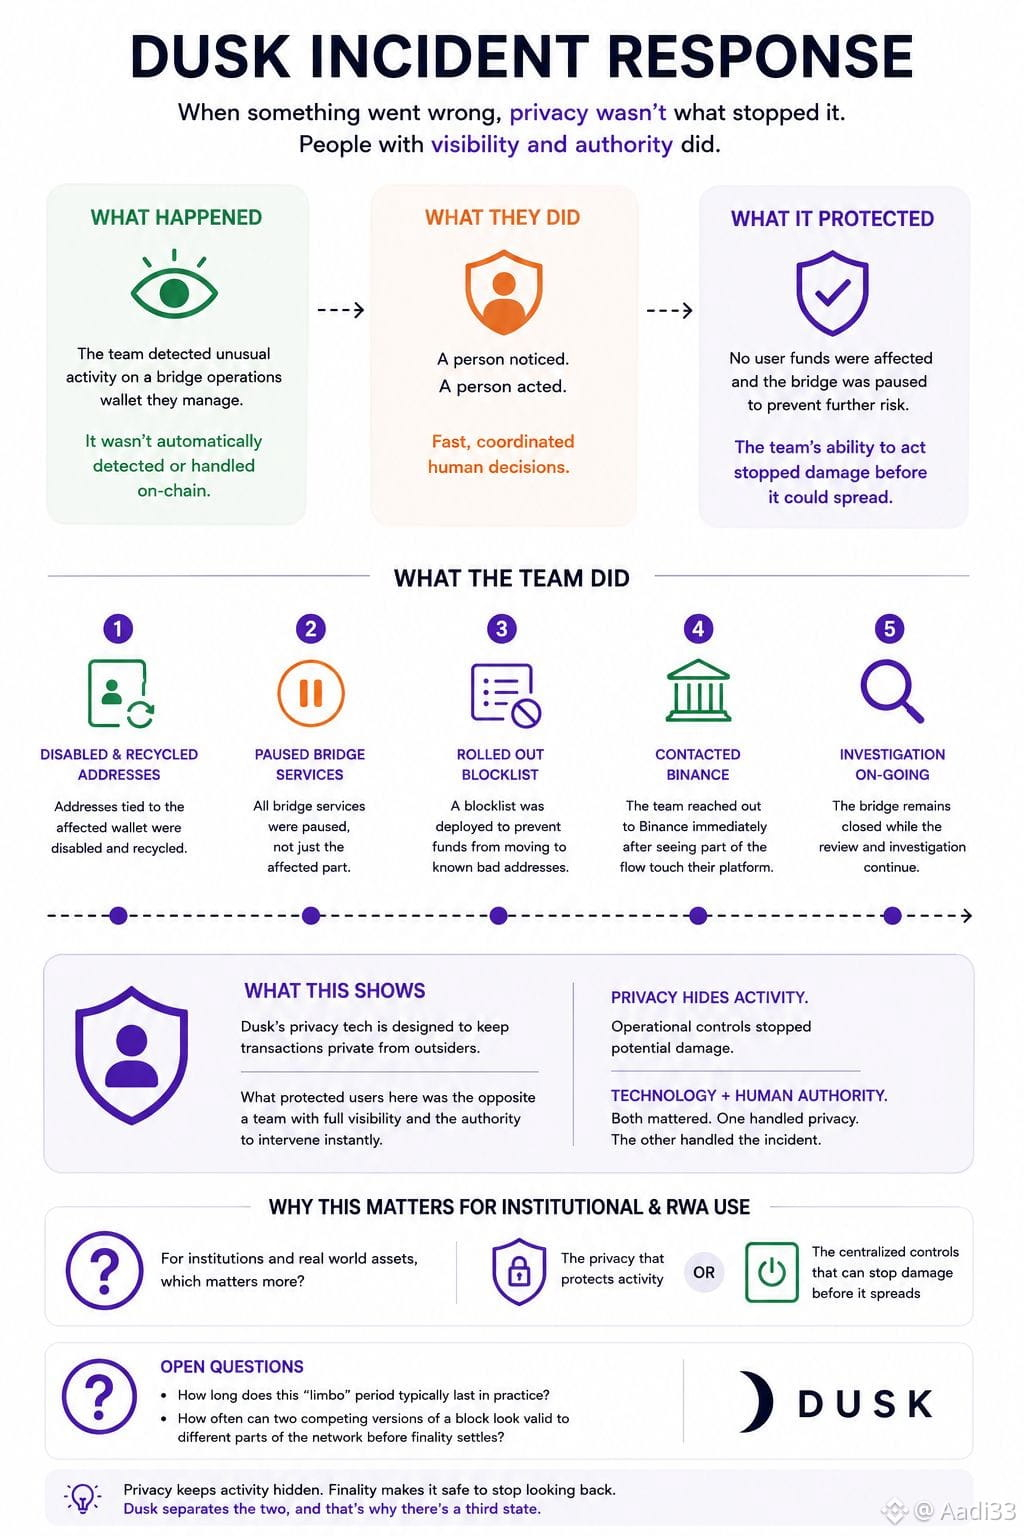
私は、プライバシーチェーンの最大の強みは「何かがうまくいかなくなったとき」にこそはっきり現れるのだと気づきました。実際、duskにはインシデントがありましたが、それを止めたのはプライバシーではありませんでした。
最初にこれを見たとき、悪用されたものについての話になるのだろうと思いました。けれど、より興味深かったのは、その直後に何が起きたかです。
理由はこうです。8月16日、duskのチームはブリッジ運用のために管理しているウォレットで、不審なアクティビティを確認しました。対応はプロトコルが自動的に検知・処理したものではありません。誰かが気づき、誰かが動いたのです。
では実際に何が起きたのか。チームは、そのウォレットに紐づくアドレスを無効化し、再利用(リサイクル)しました。影響を受けた部分だけでなく、ブリッジのサービス自体を完全に停止しました。資金が既知の悪用アドレスに送金されないよう、ブロックリストを展開しました。また、フローの一部がそのプラットフォームに触れたのを見た瞬間、binanceに直接連絡しました。
私が注目したのは、これらの行動がいずれもプライバシーレイヤーそのものからは生まれていなかったことです。すべての判断と動きは、何かを止める権限を持った人々によって、しかも迅速に実行されていました。
duskのプライバシー技術が本当に見事なのは、取引が外部から覗き込む人に対して非公開のままである点です。ですが、ここでユーザーを守ったのは、その正反対でした。つまり、何が起きているかを把握でき、何かがおかしいと見えた瞬間に介入する権限を持つチームがいたことです。
現時点では「ユーザーファンドの影響はなかった」と彼らは言っています。しかしレビューが続いている間もブリッジは閉じたままなので、状況は、着地した先(結論)ではなく、いまのところの判断としてこうなっています。
制度的な領域や現実世界の資産に強く踏み込もうとしているチェーンにとって、どちらがより重要かは、彼らが勝ち取ろうとしている相手の人々にとって変わるでしょう。取引アクティビティを守るプライバシーか、それとも、被害が広がる前に止められることを実証した中央集権的なコントロールか。
$ONG $TMX #Dusk/usdt✅ #BullRunAhead
#dusk $DUSK @Dusk
私は、プライバシーチェーンの最大の強みは「何かがうまくいかなくなったとき」にこそはっきり現れるのだと気づきました。実際、duskにはインシデントがありましたが、それを止めたのはプライバシーではありませんでした。
最初にこれを見たとき、悪用されたものについての話になるのだろうと思いました。けれど、より興味深かったのは、その直後に何が起きたかです。
理由はこうです。8月16日、duskのチームはブリッジ運用のために管理しているウォレットで、不審なアクティビティを確認しました。対応はプロトコルが自動的に検知・処理したものではありません。誰かが気づき、誰かが動いたのです。
では実際に何が起きたのか。チームは、そのウォレットに紐づくアドレスを無効化し、再利用(リサイクル)しました。影響を受けた部分だけでなく、ブリッジのサービス自体を完全に停止しました。資金が既知の悪用アドレスに送金されないよう、ブロックリストを展開しました。また、フローの一部がそのプラットフォームに触れたのを見た瞬間、binanceに直接連絡しました。
私が注目したのは、これらの行動がいずれもプライバシーレイヤーそのものからは生まれていなかったことです。すべての判断と動きは、何かを止める権限を持った人々によって、しかも迅速に実行されていました。
duskのプライバシー技術が本当に見事なのは、取引が外部から覗き込む人に対して非公開のままである点です。ですが、ここでユーザーを守ったのは、その正反対でした。つまり、何が起きているかを把握でき、何かがおかしいと見えた瞬間に介入する権限を持つチームがいたことです。
現時点では「ユーザーファンドの影響はなかった」と彼らは言っています。しかしレビューが続いている間もブリッジは閉じたままなので、状況は、着地した先(結論)ではなく、いまのところの判断としてこうなっています。
制度的な領域や現実世界の資産に強く踏み込もうとしているチェーンにとって、どちらがより重要かは、彼らが勝ち取ろうとしている相手の人々にとって変わるでしょう。取引アクティビティを守るプライバシーか、それとも、被害が広がる前に止められることを実証した中央集権的なコントロールか。
$ONG $TMX #Dusk/usdt✅ #BullRunAhead
私は、プライバシーチェーンの最大の強みは「何かがうまくいかなくなったとき」にこそはっきり現れるのだと気づきました。実際、duskにはインシデントがありましたが、それを止めたのはプライバシーではありませんでした。
最初にこれを見たとき、悪用されたものについての話になるのだろうと思いました。けれど、より興味深かったのは、その直後に何が起きたかです。
理由はこうです。8月16日、duskのチームはブリッジ運用のために管理しているウォレットで、不審なアクティビティを確認しました。対応はプロトコルが自動的に検知・処理したものではありません。誰かが気づき、誰かが動いたのです。
では実際に何が起きたのか。チームは、そのウォレットに紐づくアドレスを無効化し、再利用(リサイクル)しました。影響を受けた部分だけでなく、ブリッジのサービス自体を完全に停止しました。資金が既知の悪用アドレスに送金されないよう、ブロックリストを展開しました。また、フローの一部がそのプラットフォームに触れたのを見た瞬間、binanceに直接連絡しました。
私が注目したのは、これらの行動がいずれもプライバシーレイヤーそのものからは生まれていなかったことです。すべての判断と動きは、何かを止める権限を持った人々によって、しかも迅速に実行されていました。
duskのプライバシー技術が本当に見事なのは、取引が外部から覗き込む人に対して非公開のままである点です。ですが、ここでユーザーを守ったのは、その正反対でした。つまり、何が起きているかを把握でき、何かがおかしいと見えた瞬間に介入する権限を持つチームがいたことです。
現時点では「ユーザーファンドの影響はなかった」と彼らは言っています。しかしレビューが続いている間もブリッジは閉じたままなので、状況は、着地した先(結論)ではなく、いまのところの判断としてこうなっています。
制度的な領域や現実世界の資産に強く踏み込もうとしているチェーンにとって、どちらがより重要かは、彼らが勝ち取ろうとしている相手の人々にとって変わるでしょう。取引アクティビティを守るプライバシーか、それとも、被害が広がる前に止められることを実証した中央集権的なコントロールか。
$ONG $TMX #Dusk/usdt✅ #BullRunAhead
7
14
260
·
--
ブリッシュ
$DUSK 20.7K USDT(30日間の取引)
#dusk $DUSK @Dusk_Foundation
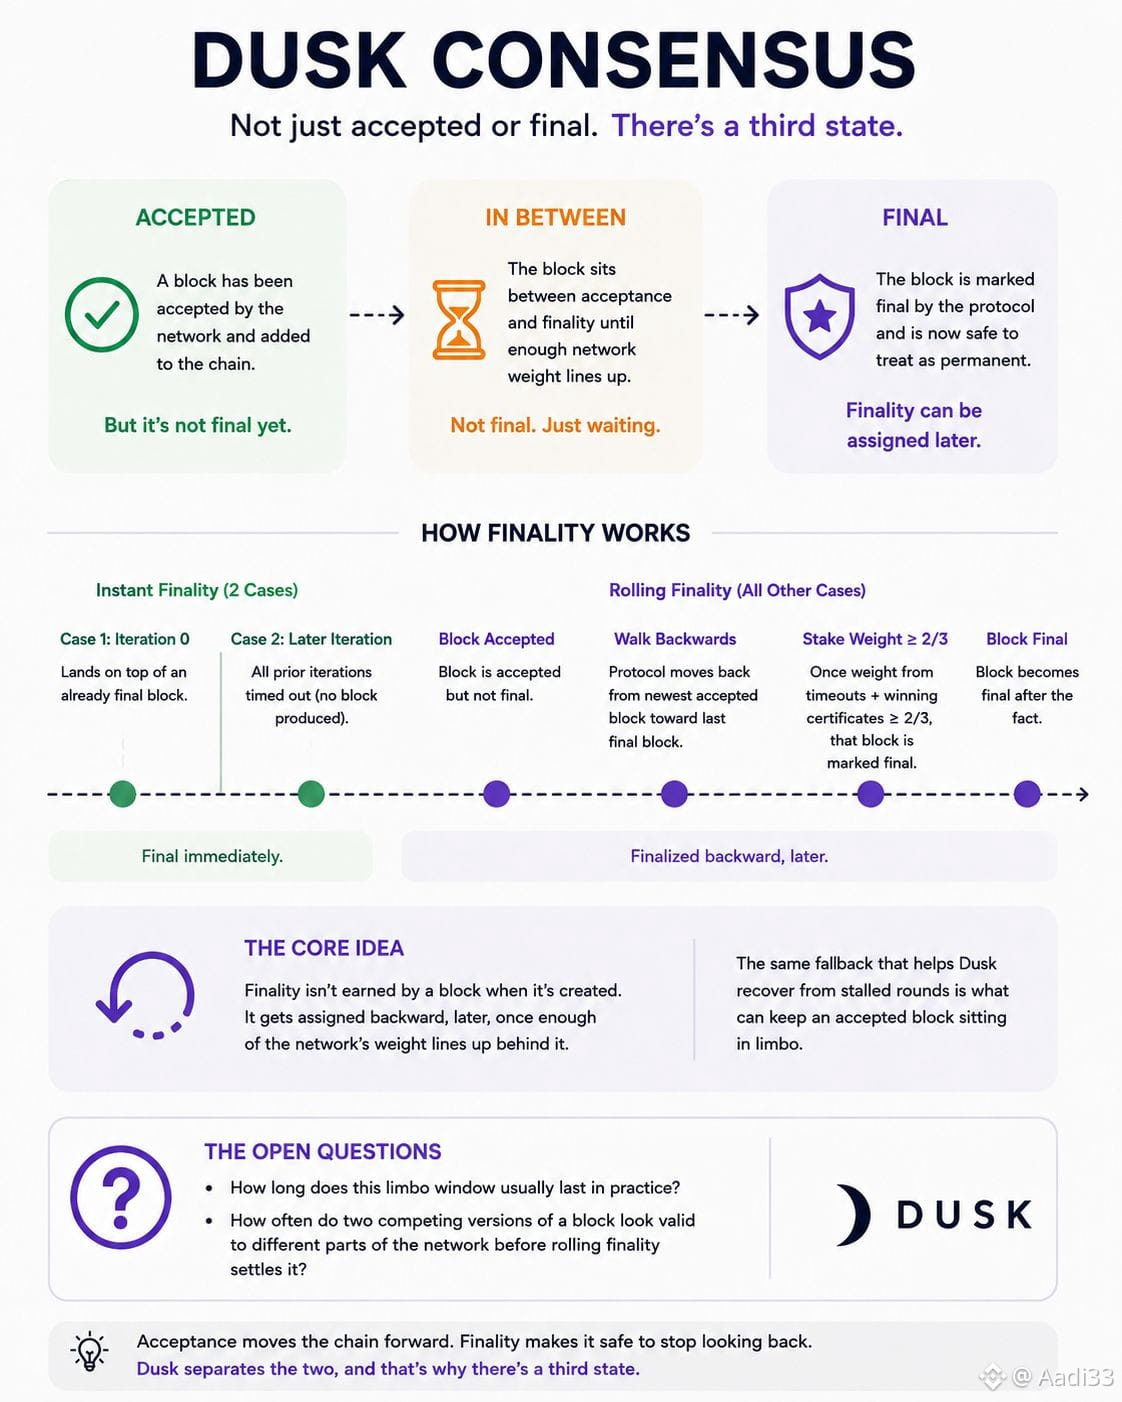
ブロックチェーンがブロックを受理したら、それで終わり、永久に固定されて動かない——そう思っていました。ところがduskは、受理と確定(finality)をまったく別のものとして扱っていて、ブロックがその間にしばらく“挟まった状態”で停滞し得ます。
最初にこれを見たとき、「受理される=その時点でブロックがロックされる」と考えていました。その2つの言葉のあいだにある“実際のギャップ”のほうが、よほど興味深かったです。
ブロックが即時の確定を得るのは、特定の2つのケースだけです。ひとつは、反復(iteration)0の時点で、すでに確定済みのブロックの真上に着地する場合。もうひとつは、それ以外の後続の反復で着地する場合で、そのブロックの前の各反復がすべてタイムアウトし、何も生成されなかったときです。この2つ以外では、受理されたブロックはまだ確定していません。そこに“置かれているだけ”です。
そこでduskは、条件に当てはまらないもののための第二の経路を作りました。それがローリング確定(rolling finality)です。ネットワークは、最新の受理済みブロックからさかのぼって、実際に最後まで確定していた直前のブロックへ向かって歩みます。その過程で、通ってきた各タイムアウトと、それぞれの途中で勝った証明(winning certificate)に裏付けられるステーク(賭け金)の重みを積み上げていきます。そして、そのステーク重みが総量の2/3を超えたところで、着地したブロックが確定としてマークされます。“後から”です。
私がこの仕組みの理解で難しく感じたのは、ここでの確定は「作られた瞬間に、そのブロックが得る性質」ではないことです。ネットワーク全体の重みがそれに十分に揃った“後になって”、さかのぼって割り当てられます。
同じフォールバック機構が、あるラウンドが停滞したときにduskがリカバリできるようにしている一方で、つい受理されたばかりのブロックを、まだ恒久的なものとして扱うには安全でない“リムボ(宙ぶらりん)”状態に留めるのにも役立っています。
結局のところ、このリムボのウィンドウが実際には通常どれくらい続くのか、またローリング確定が落ち着く前に、ブロックの競合する2つの版が、ネットワークの異なる部分から“正しいように見える”ことがどれくらいの頻度で起きるのか、私はまだ分かりません。
#Dusk/usdt✅ #BullRunAhead $BTC $PROM
#dusk $DUSK @Dusk
ブロックチェーンがブロックを受理したら、それで終わり、永久に固定されて動かない——そう思っていました。ところがduskは、受理と確定(finality)をまったく別のものとして扱っていて、ブロックがその間にしばらく“挟まった状態”で停滞し得ます。
最初にこれを見たとき、「受理される=その時点でブロックがロックされる」と考えていました。その2つの言葉のあいだにある“実際のギャップ”のほうが、よほど興味深かったです。
ブロックが即時の確定を得るのは、特定の2つのケースだけです。ひとつは、反復(iteration)0の時点で、すでに確定済みのブロックの真上に着地する場合。もうひとつは、それ以外の後続の反復で着地する場合で、そのブロックの前の各反復がすべてタイムアウトし、何も生成されなかったときです。この2つ以外では、受理されたブロックはまだ確定していません。そこに“置かれているだけ”です。
そこでduskは、条件に当てはまらないもののための第二の経路を作りました。それがローリング確定(rolling finality)です。ネットワークは、最新の受理済みブロックからさかのぼって、実際に最後まで確定していた直前のブロックへ向かって歩みます。その過程で、通ってきた各タイムアウトと、それぞれの途中で勝った証明(winning certificate)に裏付けられるステーク(賭け金)の重みを積み上げていきます。そして、そのステーク重みが総量の2/3を超えたところで、着地したブロックが確定としてマークされます。“後から”です。
私がこの仕組みの理解で難しく感じたのは、ここでの確定は「作られた瞬間に、そのブロックが得る性質」ではないことです。ネットワーク全体の重みがそれに十分に揃った“後になって”、さかのぼって割り当てられます。
同じフォールバック機構が、あるラウンドが停滞したときにduskがリカバリできるようにしている一方で、つい受理されたばかりのブロックを、まだ恒久的なものとして扱うには安全でない“リムボ(宙ぶらりん)”状態に留めるのにも役立っています。
結局のところ、このリムボのウィンドウが実際には通常どれくらい続くのか、またローリング確定が落ち着く前に、ブロックの競合する2つの版が、ネットワークの異なる部分から“正しいように見える”ことがどれくらいの頻度で起きるのか、私はまだ分かりません。
#Dusk/usdt✅ #BullRunAhead $BTC $PROM
ブロックチェーンがブロックを受理したら、それで終わり、永久に固定されて動かない——そう思っていました。ところがduskは、受理と確定(finality)をまったく別のものとして扱っていて、ブロックがその間にしばらく“挟まった状態”で停滞し得ます。
最初にこれを見たとき、「受理される=その時点でブロックがロックされる」と考えていました。その2つの言葉のあいだにある“実際のギャップ”のほうが、よほど興味深かったです。
ブロックが即時の確定を得るのは、特定の2つのケースだけです。ひとつは、反復(iteration)0の時点で、すでに確定済みのブロックの真上に着地する場合。もうひとつは、それ以外の後続の反復で着地する場合で、そのブロックの前の各反復がすべてタイムアウトし、何も生成されなかったときです。この2つ以外では、受理されたブロックはまだ確定していません。そこに“置かれているだけ”です。
そこでduskは、条件に当てはまらないもののための第二の経路を作りました。それがローリング確定(rolling finality)です。ネットワークは、最新の受理済みブロックからさかのぼって、実際に最後まで確定していた直前のブロックへ向かって歩みます。その過程で、通ってきた各タイムアウトと、それぞれの途中で勝った証明(winning certificate)に裏付けられるステーク(賭け金)の重みを積み上げていきます。そして、そのステーク重みが総量の2/3を超えたところで、着地したブロックが確定としてマークされます。“後から”です。
私がこの仕組みの理解で難しく感じたのは、ここでの確定は「作られた瞬間に、そのブロックが得る性質」ではないことです。ネットワーク全体の重みがそれに十分に揃った“後になって”、さかのぼって割り当てられます。
同じフォールバック機構が、あるラウンドが停滞したときにduskがリカバリできるようにしている一方で、つい受理されたばかりのブロックを、まだ恒久的なものとして扱うには安全でない“リムボ(宙ぶらりん)”状態に留めるのにも役立っています。
結局のところ、このリムボのウィンドウが実際には通常どれくらい続くのか、またローリング確定が落ち着く前に、ブロックの競合する2つの版が、ネットワークの異なる部分から“正しいように見える”ことがどれくらいの頻度で起きるのか、私はまだ分かりません。
#Dusk/usdt✅ #BullRunAhead $BTC $PROM
12
13
380
ログインして、さらにコンテンツを読む
厳選トピックで世界の暗号資産トレーダーの仲間入り
⚡️ 暗号資産に関する最新かつ有益な情報が見つかります。
💬 世界最大の暗号資産取引所から信頼されています。
👍 認証を受けたクリエイターから、有益なインサイトを得られます。
メール / 電話番号
トレンドトピック
FedMinutesFocusOnOctoberPause
閲覧回数 196,091
1,376人が討論中
🚨 警戒レベル引き上げ ‼️ 次の1時間は無闇に取引しないでください 🚨
皆さん、FOMC議事要旨の発表まで1時間を切りました。
今日すでに大きなボラティリティが見られたことを考えると、発表直前に誰にも無謀な高レバレッジポジションを取ってほしくありません。
私が注目している大きな反応は、ゴールド(XAU)、シルバー(XAG)、BTC、ETHです。さらにSOLのような銘柄や、レバレッジの高い時価総額が中小規模のアルトコインは、BTCの値動きを増幅させる可能性があります。
今夜は特にゴールドとシルバーに注意が必要です。市場はすでに米ドルと米国債利回りに反応しており、両方の貴金属はFRB議事要旨の発表を前に大きな圧力を受けています。
簡単に言うと、
📉タカ派的なFOMC議事要旨 → 米ドル・利回りが上昇する可能性 → BTC、暗号資産、ゴールド、シルバーに下押し圧力
📈ハト派的なFOMC議事要旨 → 米ドル・利回りが落ち着く可能性 → BTC、ゴールド、シルバー、リスク資産が大きく反発する可能性があります。
そして、最初のローソク足が罠になることもあるので忘れないでください。一度急騰してすぐに急落し、両方向で清算が起きてから、本当の方向性が見えてくることもあります。
今はポジションを守り、不要なレバレッジを減らし、最初の値動きにFOMOで飛び乗らないようにしてください。
今夜はまず$XAU 、$XAG 、$BTC を注視しています。これらの動きを見れば、市場がFRBの発表をどう受け止めているか、すぐに分かるでしょう。
時間どおりに皆さんに最新情報をお知らせします。
@Panda Traders をフォローして、今すぐ通知をオンにしてください。
#FedMinutesFocusOnOctoberPause
Panda Traders
·いいね:19件
·閲覧回数 4.2k
BinanceLaunchesBinanceIntelligence
閲覧回数 1.1M
6,569人が討論中
EvernorthDelaysNasdaqDebutToOct12
閲覧回数 17,292
320人が討論中