
#43
43
3,643 views
43 Discussing
Hot
Latest

·
--
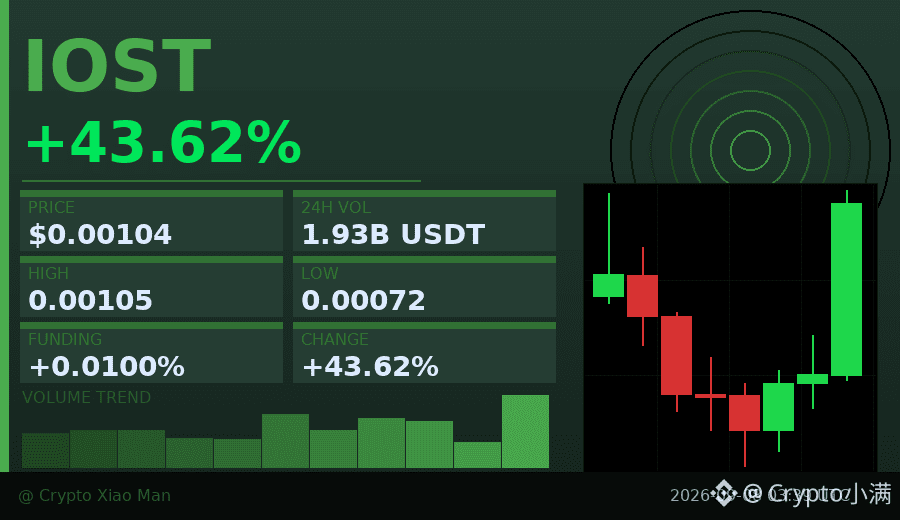
Behind the 43% surge, is IOST truly different today?
Trading volume has jumped to 193 million USDT. The hourly chart has closed with three consecutive bullish candles, and this doesn’t look like a simple rebound. The funding rate is only 0.01%, suggesting the long side hasn’t gotten overheated yet. The long position ratio at 53% also remains relatively healthy.
It has rallied from the low of 0.00072 to the current level of 0.00104—this rebound of nearly 45% is supported by volume. The key now is whether it can hold above the psychological level of 0.001.
I’m watching the closing prices over the next two hours. If it can stay above 0.00098, there could still be room for short-term upside.
$IOST #放量突破 #43%
Click the small card below to quickly check the行情👇
Behind the 43% surge, is IOST truly different today?
Trading volume has jumped to 193 million USDT. The hourly chart has closed with three consecutive bullish candles, and this doesn’t look like a simple rebound. The funding rate is only 0.01%, suggesting the long side hasn’t gotten overheated yet. The long position ratio at 53% also remains relatively healthy.
It has rallied from the low of 0.00072 to the current level of 0.00104—this rebound of nearly 45% is supported by volume. The key now is whether it can hold above the psychological level of 0.001.
I’m watching the closing prices over the next two hours. If it can stay above 0.00098, there could still be room for short-term upside.
$IOST #放量突破 #43%
Click the small card below to quickly check the行情👇
Trading volume has jumped to 193 million USDT. The hourly chart has closed with three consecutive bullish candles, and this doesn’t look like a simple rebound. The funding rate is only 0.01%, suggesting the long side hasn’t gotten overheated yet. The long position ratio at 53% also remains relatively healthy.
It has rallied from the low of 0.00072 to the current level of 0.00104—this rebound of nearly 45% is supported by volume. The key now is whether it can hold above the psychological level of 0.001.
I’m watching the closing prices over the next two hours. If it can stay above 0.00098, there could still be room for short-term upside.
$IOST #放量突破 #43%
Click the small card below to quickly check the行情👇
17
·
--
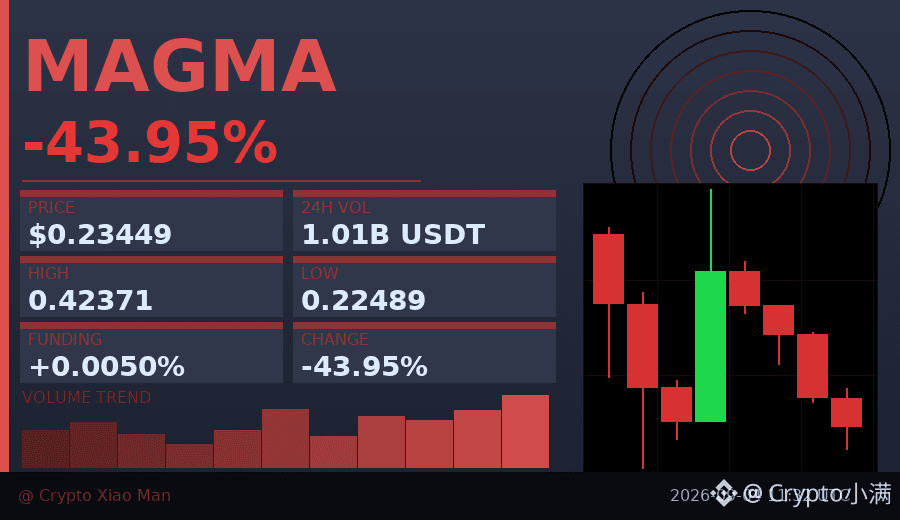
Behind the 43% drop, trading volume exceeded $100 million—this divergence is worth pondering.
MAGMA has been hammered from the high of 0.42 down to 0.23, with three consecutive bearish candles on the hourly chart, seemingly giving bears the upper hand. But take a closer look at the long-vs-short ratio: 49% vs 51%—nearly evenly matched. What does that mean?
After such a sharp fall, the market isn’t one-sided between bulls and bears, suggesting someone is quietly picking up during the decline. The funding rate of 0.005% is close to neutral, so there isn’t much leverage liquidation pressure.
This isn’t the time to guess the bottom, but this combination—"a hard drop, big disagreement, and sufficient volume"—often comes right before a turning point. I’ll wait for an hourly bullish candle to confirm stabilization.
$MAGMA #MAGMA #43%跌幅
Click the small card below to quickly check the行情👇
Behind the 43% drop, trading volume exceeded $100 million—this divergence is worth pondering.
MAGMA has been hammered from the high of 0.42 down to 0.23, with three consecutive bearish candles on the hourly chart, seemingly giving bears the upper hand. But take a closer look at the long-vs-short ratio: 49% vs 51%—nearly evenly matched. What does that mean?
After such a sharp fall, the market isn’t one-sided between bulls and bears, suggesting someone is quietly picking up during the decline. The funding rate of 0.005% is close to neutral, so there isn’t much leverage liquidation pressure.
This isn’t the time to guess the bottom, but this combination—"a hard drop, big disagreement, and sufficient volume"—often comes right before a turning point. I’ll wait for an hourly bullish candle to confirm stabilization.
$MAGMA #MAGMA #43%跌幅
Click the small card below to quickly check the行情👇
MAGMA has been hammered from the high of 0.42 down to 0.23, with three consecutive bearish candles on the hourly chart, seemingly giving bears the upper hand. But take a closer look at the long-vs-short ratio: 49% vs 51%—nearly evenly matched. What does that mean?
After such a sharp fall, the market isn’t one-sided between bulls and bears, suggesting someone is quietly picking up during the decline. The funding rate of 0.005% is close to neutral, so there isn’t much leverage liquidation pressure.
This isn’t the time to guess the bottom, but this combination—"a hard drop, big disagreement, and sufficient volume"—often comes right before a turning point. I’ll wait for an hourly bullish candle to confirm stabilization.
$MAGMA #MAGMA #43%跌幅
Click the small card below to quickly check the行情👇
49

·
--
$T That was a bit brutal—on the 15m chart it directly dropped 3.15%. Volume spiked to 2.28x, volatility Z at 2.60. This isn’t the kind of low-volume, slow bleeding—it’s selling with volume pressing down.
Even more interesting is the OI: on 15m it’s +4.16%, on 1h it’s +7.65%. Price is down while open interest is up—this is a typical structure of shorts adding leverage and entering. Funding rate is -0.4854%, near-end percentile at 97%. The short crowding is already pushed up to the high percentile. Whole pool anomaly #28, notional change #43—depth confirmation shows both price and volume are abnormal.
Aggressive trade imbalance +2.8%, buy/sell ratio 1.06, and there’s still some support in the order book. In the past 24h, turnover is 94.27M. This isn’t a small market, but with such an extreme funding-rate percentile, the biggest risk is shorts stepping on their own feet. When the funding rate is negative down at the 97th percentile, it often means the market is stretched to the extreme at a certain stage—chasing shorts from here may not be the best risk-reward.
With OI rising, price falling, and funding extremely negative—if a rebound comes here, short covering orders will be very uncomfortable. Keep an eye on it first; don’t rush to pick a side.
$T That was a bit brutal—on the 15m chart it directly dropped 3.15%. Volume spiked to 2.28x, volatility Z at 2.60. This isn’t the kind of low-volume, slow bleeding—it’s selling with volume pressing down.
Even more interesting is the OI: on 15m it’s +4.16%, on 1h it’s +7.65%. Price is down while open interest is up—this is a typical structure of shorts adding leverage and entering. Funding rate is -0.4854%, near-end percentile at 97%. The short crowding is already pushed up to the high percentile. Whole pool anomaly #28, notional change #43—depth confirmation shows both price and volume are abnormal.
Aggressive trade imbalance +2.8%, buy/sell ratio 1.06, and there’s still some support in the order book. In the past 24h, turnover is 94.27M. This isn’t a small market, but with such an extreme funding-rate percentile, the biggest risk is shorts stepping on their own feet. When the funding rate is negative down at the 97th percentile, it often means the market is stretched to the extreme at a certain stage—chasing shorts from here may not be the best risk-reward.
With OI rising, price falling, and funding extremely negative—if a rebound comes here, short covering orders will be very uncomfortable. Keep an eye on it first; don’t rush to pick a side.
Even more interesting is the OI: on 15m it’s +4.16%, on 1h it’s +7.65%. Price is down while open interest is up—this is a typical structure of shorts adding leverage and entering. Funding rate is -0.4854%, near-end percentile at 97%. The short crowding is already pushed up to the high percentile. Whole pool anomaly #28, notional change #43—depth confirmation shows both price and volume are abnormal.
Aggressive trade imbalance +2.8%, buy/sell ratio 1.06, and there’s still some support in the order book. In the past 24h, turnover is 94.27M. This isn’t a small market, but with such an extreme funding-rate percentile, the biggest risk is shorts stepping on their own feet. When the funding rate is negative down at the 97th percentile, it often means the market is stretched to the extreme at a certain stage—chasing shorts from here may not be the best risk-reward.
With OI rising, price falling, and funding extremely negative—if a rebound comes here, short covering orders will be very uncomfortable. Keep an eye on it first; don’t rush to pick a side.
10


·
--
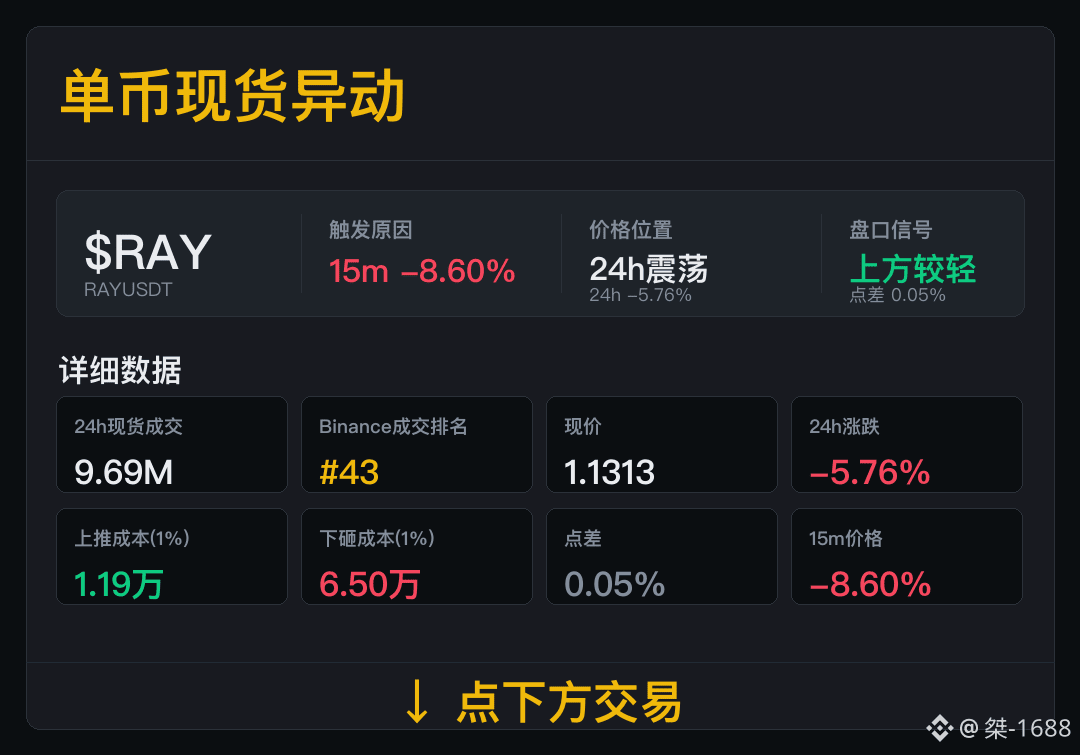
$RAY short-term momentum has picked up—first verify the trade ranking and order-book costs.
Spot trades: 9.69M; Binance trade ranking: #43. Track both the trade size and its position on the leaderboard.
Now: 24h change -5.76%; spread 0.05%; buy-side push cost 11.9k, sell-side drop cost 65.0k. In the next phase, keep the spread at the current level, and let trading stay active—short-term execution will be smoother.
For the next segment, first check the volume strength, then check the bid-ask spread.
$RAY short-term momentum has picked up—first verify the trade ranking and order-book costs.
Spot trades: 9.69M; Binance trade ranking: #43. Track both the trade size and its position on the leaderboard.
Now: 24h change -5.76%; spread 0.05%; buy-side push cost 11.9k, sell-side drop cost 65.0k. In the next phase, keep the spread at the current level, and let trading stay active—short-term execution will be smoother.
For the next segment, first check the volume strength, then check the bid-ask spread.
Spot trades: 9.69M; Binance trade ranking: #43. Track both the trade size and its position on the leaderboard.
Now: 24h change -5.76%; spread 0.05%; buy-side push cost 11.9k, sell-side drop cost 65.0k. In the next phase, keep the spread at the current level, and let trading stay active—short-term execution will be smoother.
For the next segment, first check the volume strength, then check the bid-ask spread.
60
·
--
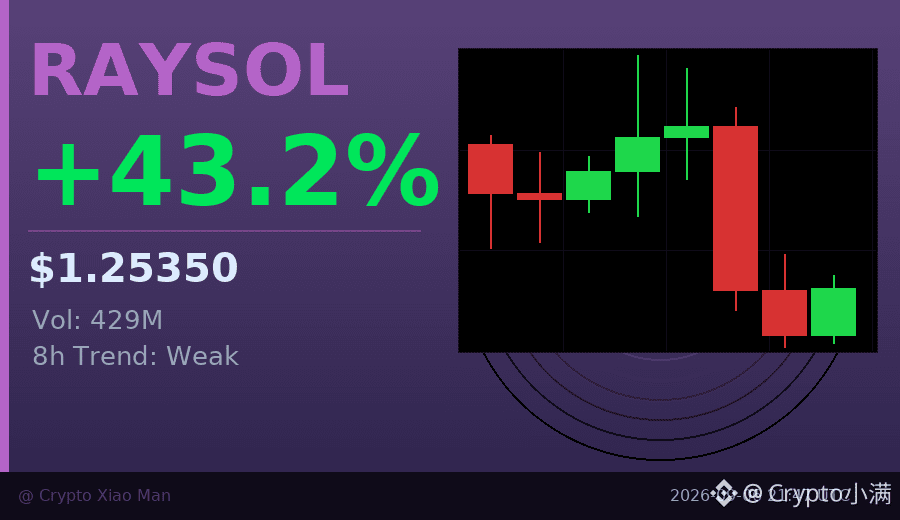
A 43% increase, yet the funding rate is negative — that happened on RAYSOL at the same time.
Over the past 24 hours, trading volume surged to $429 million, with the price rising from 0.87 to 1.44 and then pulling back to 1.25.
On the surface, it looks like a strong breakout, but the funding rate of -0.00543 shows that long traders are not paying a premium to shorts.
What’s more worth noting is that the candlesticks over the last 8 hours have generally been weakening, and the momentum from chasing longs at higher levels is fading.
The long/short ratio is 50%/50%, with both sides showing restraint. At times like this, the risk of buying into strength is often greater than the opportunity.
Wait until the funding rate turns positive and trading volume expands again — there’s no rush.
$RAYSOL #资金费率背离 #43%
Click the small card below to quickly view the market 👇
A 43% increase, yet the funding rate is negative — that happened on RAYSOL at the same time.
Over the past 24 hours, trading volume surged to $429 million, with the price rising from 0.87 to 1.44 and then pulling back to 1.25.
On the surface, it looks like a strong breakout, but the funding rate of -0.00543 shows that long traders are not paying a premium to shorts.
What’s more worth noting is that the candlesticks over the last 8 hours have generally been weakening, and the momentum from chasing longs at higher levels is fading.
The long/short ratio is 50%/50%, with both sides showing restraint. At times like this, the risk of buying into strength is often greater than the opportunity.
Wait until the funding rate turns positive and trading volume expands again — there’s no rush.
$RAYSOL #资金费率背离 #43%
Click the small card below to quickly view the market 👇
Over the past 24 hours, trading volume surged to $429 million, with the price rising from 0.87 to 1.44 and then pulling back to 1.25.
On the surface, it looks like a strong breakout, but the funding rate of -0.00543 shows that long traders are not paying a premium to shorts.
What’s more worth noting is that the candlesticks over the last 8 hours have generally been weakening, and the momentum from chasing longs at higher levels is fading.
The long/short ratio is 50%/50%, with both sides showing restraint. At times like this, the risk of buying into strength is often greater than the opportunity.
Wait until the funding rate turns positive and trading volume expands again — there’s no rush.
$RAYSOL #资金费率背离 #43%
Click the small card below to quickly view the market 👇
15
·
--
Behind the 43% surge, funds are quietly pulling back.
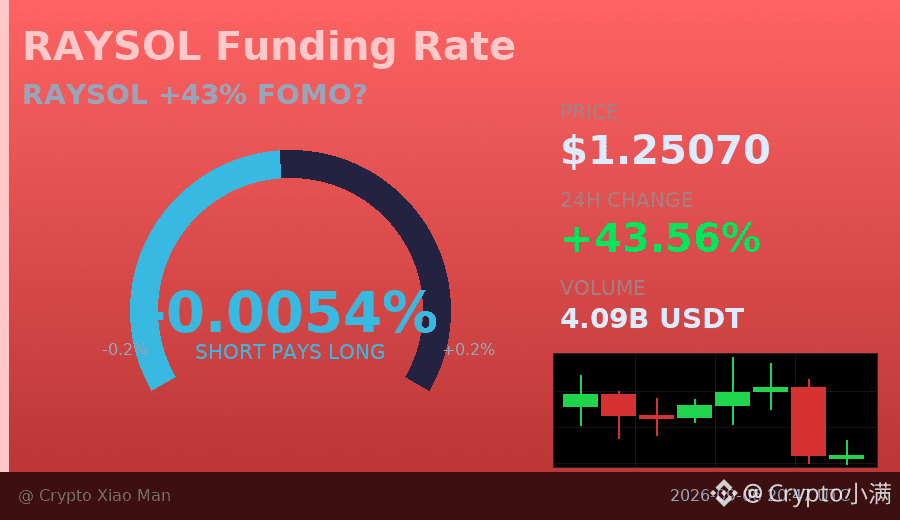
RAYSOL surged to 1.44 today before pulling back to 1.25. Trading volume of 408 million is not small, but the funding rate has already turned negative at -0.0054%. Longs account for 48% and shorts 52%, which suggests that those chasing the rally are starting to hesitate.
The 8-hour candlestick trend is also clear: after the spike, several consecutive bearish candles appeared, showing weakening buying pressure. At times like this, rising fast does not mean it can be held.
What I’m more concerned about is whether there will be a pullback shakeout next—after all, the bears now have a slight edge.
$RAYSOL #资金费率转负 #43%涨幅
Click the small card below to quickly view the market👇
Behind the 43% surge, funds are quietly pulling back.
RAYSOL surged to 1.44 today before pulling back to 1.25. Trading volume of 408 million is not small, but the funding rate has already turned negative at -0.0054%. Longs account for 48% and shorts 52%, which suggests that those chasing the rally are starting to hesitate.
The 8-hour candlestick trend is also clear: after the spike, several consecutive bearish candles appeared, showing weakening buying pressure. At times like this, rising fast does not mean it can be held.
What I’m more concerned about is whether there will be a pullback shakeout next—after all, the bears now have a slight edge.
$RAYSOL #资金费率转负 #43%涨幅
Click the small card below to quickly view the market👇
RAYSOL surged to 1.44 today before pulling back to 1.25. Trading volume of 408 million is not small, but the funding rate has already turned negative at -0.0054%. Longs account for 48% and shorts 52%, which suggests that those chasing the rally are starting to hesitate.
The 8-hour candlestick trend is also clear: after the spike, several consecutive bearish candles appeared, showing weakening buying pressure. At times like this, rising fast does not mean it can be held.
What I’m more concerned about is whether there will be a pullback shakeout next—after all, the bears now have a slight edge.
$RAYSOL #资金费率转负 #43%涨幅
Click the small card below to quickly view the market👇
17

·
--
Bearish
60-SECOND ALPHA #43 | $ROBO
$ROBO sits at the intersection of crypto and AI, showing how quickly the two narratives are merging. But an AI label alone doesn't create value.
Alpha: When AI meets crypto, always ask what the AI actually does not just what the ticker claims.
{future}(ROBOUSDT)
60-SECOND ALPHA #43 | $ROBO
$ROBO sits at the intersection of crypto and AI, showing how quickly the two narratives are merging. But an AI label alone doesn't create value.
Alpha: When AI meets crypto, always ask what the AI actually does not just what the ticker claims.
$ROBO sits at the intersection of crypto and AI, showing how quickly the two narratives are merging. But an AI label alone doesn't create value.
Alpha: When AI meets crypto, always ask what the AI actually does not just what the ticker claims.

456
·
--
A 43% increase, yet the funding rate is only 0.00027? That’s unusual.
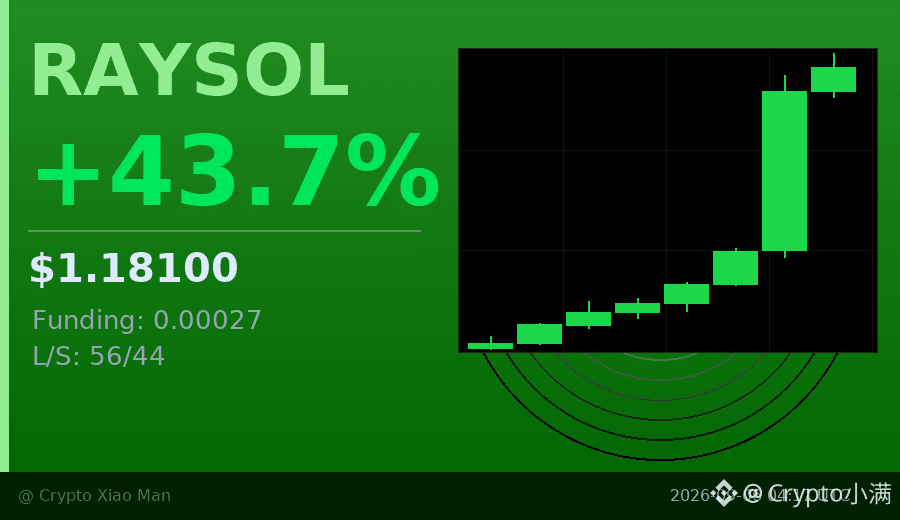
Normally, a surge of this magnitude would come with an extremely high funding rate, indicating a flood of leveraged longs. But RAYSOL is different — trading volume has expanded to 34.4 million U, while open interest remains relatively restrained. The long-short ratio is 56% to 44%, with no one-sided crowding.
The hourly candles have closed green in a row, pushing price from 0.82 all the way to 1.18. The buying is real, not just a pure leverage game. This kind of move is actually healthier; at least for now, there’s no obvious risk of a profit-taking cascade.
Still, with intraday volatility above 40%, chasing the rally remains risky. Waiting for a pullback confirmation may be the more prudent move.
$RAYSOL #Meme 币 #43% 涨幅
Click the card below to quickly check the market👇
A 43% increase, yet the funding rate is only 0.00027? That’s unusual.
Normally, a surge of this magnitude would come with an extremely high funding rate, indicating a flood of leveraged longs. But RAYSOL is different — trading volume has expanded to 34.4 million U, while open interest remains relatively restrained. The long-short ratio is 56% to 44%, with no one-sided crowding.
The hourly candles have closed green in a row, pushing price from 0.82 all the way to 1.18. The buying is real, not just a pure leverage game. This kind of move is actually healthier; at least for now, there’s no obvious risk of a profit-taking cascade.
Still, with intraday volatility above 40%, chasing the rally remains risky. Waiting for a pullback confirmation may be the more prudent move.
$RAYSOL #Meme 币 #43% 涨幅
Click the card below to quickly check the market👇
Normally, a surge of this magnitude would come with an extremely high funding rate, indicating a flood of leveraged longs. But RAYSOL is different — trading volume has expanded to 34.4 million U, while open interest remains relatively restrained. The long-short ratio is 56% to 44%, with no one-sided crowding.
The hourly candles have closed green in a row, pushing price from 0.82 all the way to 1.18. The buying is real, not just a pure leverage game. This kind of move is actually healthier; at least for now, there’s no obvious risk of a profit-taking cascade.
Still, with intraday volatility above 40%, chasing the rally remains risky. Waiting for a pullback confirmation may be the more prudent move.
$RAYSOL #Meme 币 #43% 涨幅
Click the card below to quickly check the market👇
129
·
--
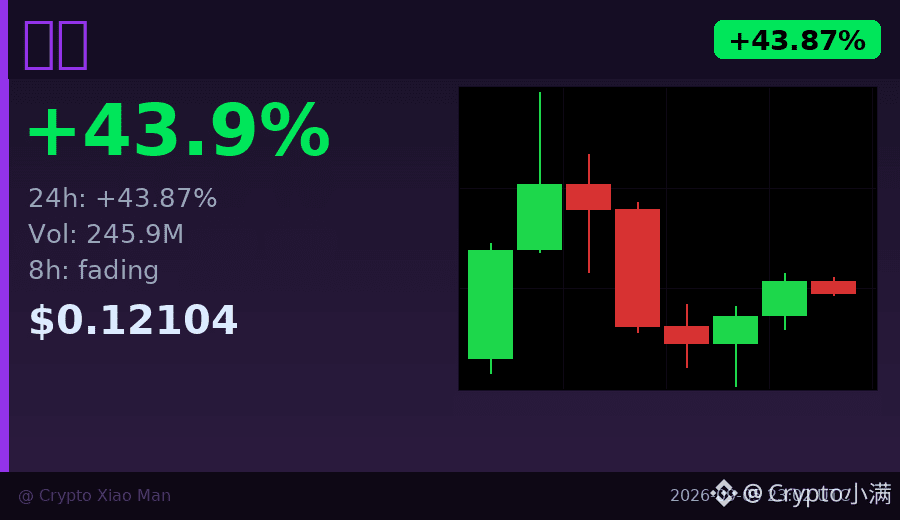
Behind the 43% surge, trading volume jumped to $246 million, but over the past 8 hours the price has actually been quietly weakening.
I’ve seen this kind of volume-price divergence many times—funds are still coming in, but buying momentum has already started to fade. The current funding rate is 0.047%, with a long/short ratio of 57/43, so it’s not extremely crowded.
The key is whether it can hold the 0.12 level next. If volume keeps increasing but the price can’t move higher, short-term pullback risk will continue to build.
$Bull Run #量价背离 #43%
Click the card below to quickly check the market👇
Behind the 43% surge, trading volume jumped to $246 million, but over the past 8 hours the price has actually been quietly weakening.
I’ve seen this kind of volume-price divergence many times—funds are still coming in, but buying momentum has already started to fade. The current funding rate is 0.047%, with a long/short ratio of 57/43, so it’s not extremely crowded.
The key is whether it can hold the 0.12 level next. If volume keeps increasing but the price can’t move higher, short-term pullback risk will continue to build.
$Bull Run #量价背离 #43%
Click the card below to quickly check the market👇
I’ve seen this kind of volume-price divergence many times—funds are still coming in, but buying momentum has already started to fade. The current funding rate is 0.047%, with a long/short ratio of 57/43, so it’s not extremely crowded.
The key is whether it can hold the 0.12 level next. If volume keeps increasing but the price can’t move higher, short-term pullback risk will continue to build.
$Bull Run #量价背离 #43%
Click the card below to quickly check the market👇
22
·
--
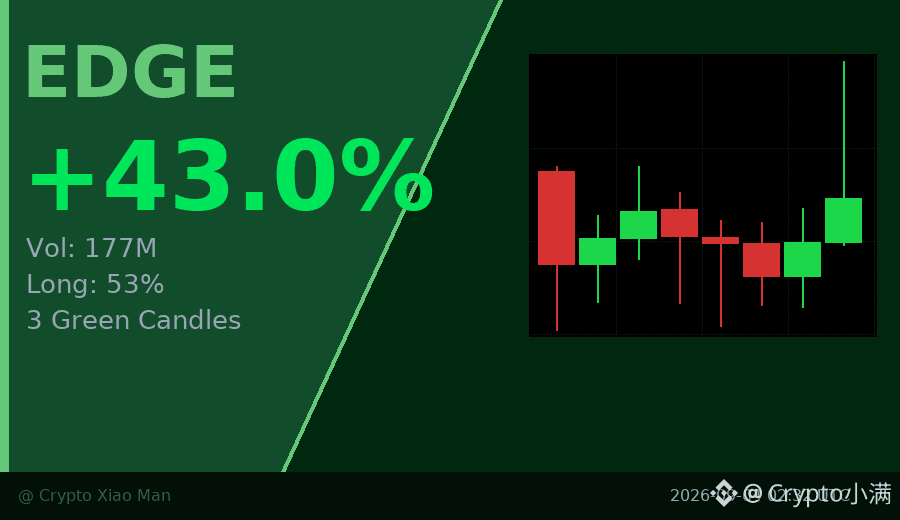
Behind the 43% increase, the funding rate has quietly climbed to 0.044—bulls are willing to pay a premium for their positions, but the long-to-short ratio is only 53/47, suggesting it’s not yet crowded.
Over the past 3 hourly K-lines, candles have been closing in the green continuously; the latest one also shows a noticeably larger trading volume, with buyers accelerating their entry.
This kind of situation—"hot funding, but positions haven’t exploded"—often appears in the middle of a trend rather than at its end.
$EDGE #资金费率 #43%
Click the small card below to quickly check the market行情👇
Behind the 43% increase, the funding rate has quietly climbed to 0.044—bulls are willing to pay a premium for their positions, but the long-to-short ratio is only 53/47, suggesting it’s not yet crowded.
Over the past 3 hourly K-lines, candles have been closing in the green continuously; the latest one also shows a noticeably larger trading volume, with buyers accelerating their entry.
This kind of situation—"hot funding, but positions haven’t exploded"—often appears in the middle of a trend rather than at its end.
$EDGE #资金费率 #43%
Click the small card below to quickly check the market行情👇
Over the past 3 hourly K-lines, candles have been closing in the green continuously; the latest one also shows a noticeably larger trading volume, with buyers accelerating their entry.
This kind of situation—"hot funding, but positions haven’t exploded"—often appears in the middle of a trend rather than at its end.
$EDGE #资金费率 #43%
Click the small card below to quickly check the market行情👇
64
·
--
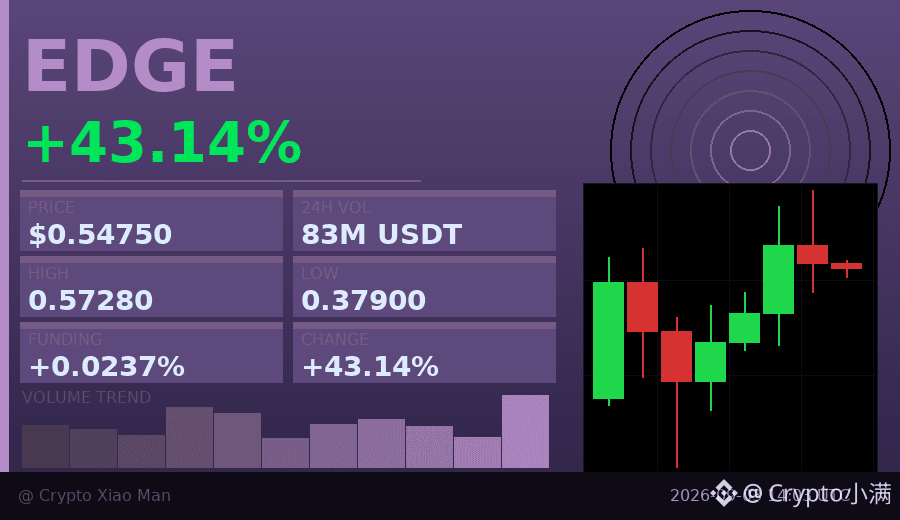
After a 43% surge, EDGE finally starts to catch its breath.
The recent rally pushed up to the 0.57 high, with volume stacking to 82.80 million USD, but now the hourly chart has turned down for three consecutive bearish candles. The funding rate is 0.0237%, which isn’t high. The long-to-short ratio is 58% vs. 42%—longs are in the lead, but not to the point of overcrowding.
After such a sudden spike followed by sideways consolidation, you either wait for a directional breakout, or see whether a pullback can hold and stabilize. Chasing at the top isn’t necessary—wait for it to choose a direction more reliably.
$EDGE #山寨币异动 #43%
Tap the small card below to quickly check the行情👇
After a 43% surge, EDGE finally starts to catch its breath.
The recent rally pushed up to the 0.57 high, with volume stacking to 82.80 million USD, but now the hourly chart has turned down for three consecutive bearish candles. The funding rate is 0.0237%, which isn’t high. The long-to-short ratio is 58% vs. 42%—longs are in the lead, but not to the point of overcrowding.
After such a sudden spike followed by sideways consolidation, you either wait for a directional breakout, or see whether a pullback can hold and stabilize. Chasing at the top isn’t necessary—wait for it to choose a direction more reliably.
$EDGE #山寨币异动 #43%
Tap the small card below to quickly check the行情👇
The recent rally pushed up to the 0.57 high, with volume stacking to 82.80 million USD, but now the hourly chart has turned down for three consecutive bearish candles. The funding rate is 0.0237%, which isn’t high. The long-to-short ratio is 58% vs. 42%—longs are in the lead, but not to the point of overcrowding.
After such a sudden spike followed by sideways consolidation, you either wait for a directional breakout, or see whether a pullback can hold and stabilize. Chasing at the top isn’t necessary—wait for it to choose a direction more reliably.
$EDGE #山寨币异动 #43%
Tap the small card below to quickly check the行情👇
79
·
--
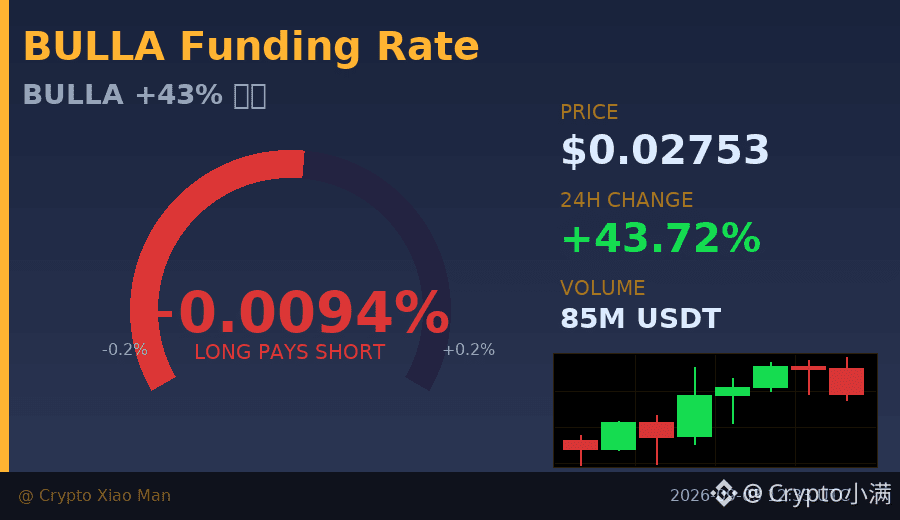
Behind the 43% surge, buy pressure is starting to catch its breath.
BULLA surged to 0.0275 today, with trading volume piling up to 84.8 million USDT—looks strong at first glance. But if you look closely at the hourly chart, the last three consecutive candlesticks have closed bearish, and the price has clearly hit resistance around 0.03.
The funding rate of 0.0094 isn’t extreme, and the long/short ratio of 57% to 43% is fairly moderate too. The question is: with all this already up, will the buying pressure be able to keep up going forward?
I’m inclined to wait for the hourly chart to turn bullish again before making a move—chasing right now feels a bit awkward.
$BULLA #Meme #43%
Tap the small card below to quickly check the market outlook👇
Behind the 43% surge, buy pressure is starting to catch its breath.
BULLA surged to 0.0275 today, with trading volume piling up to 84.8 million USDT—looks strong at first glance. But if you look closely at the hourly chart, the last three consecutive candlesticks have closed bearish, and the price has clearly hit resistance around 0.03.
The funding rate of 0.0094 isn’t extreme, and the long/short ratio of 57% to 43% is fairly moderate too. The question is: with all this already up, will the buying pressure be able to keep up going forward?
I’m inclined to wait for the hourly chart to turn bullish again before making a move—chasing right now feels a bit awkward.
$BULLA #Meme #43%
Tap the small card below to quickly check the market outlook👇
BULLA surged to 0.0275 today, with trading volume piling up to 84.8 million USDT—looks strong at first glance. But if you look closely at the hourly chart, the last three consecutive candlesticks have closed bearish, and the price has clearly hit resistance around 0.03.
The funding rate of 0.0094 isn’t extreme, and the long/short ratio of 57% to 43% is fairly moderate too. The question is: with all this already up, will the buying pressure be able to keep up going forward?
I’m inclined to wait for the hourly chart to turn bullish again before making a move—chasing right now feels a bit awkward.
$BULLA #Meme #43%
Tap the small card below to quickly check the market outlook👇
63
·
--
There’s one detail I think is worth mentioning—
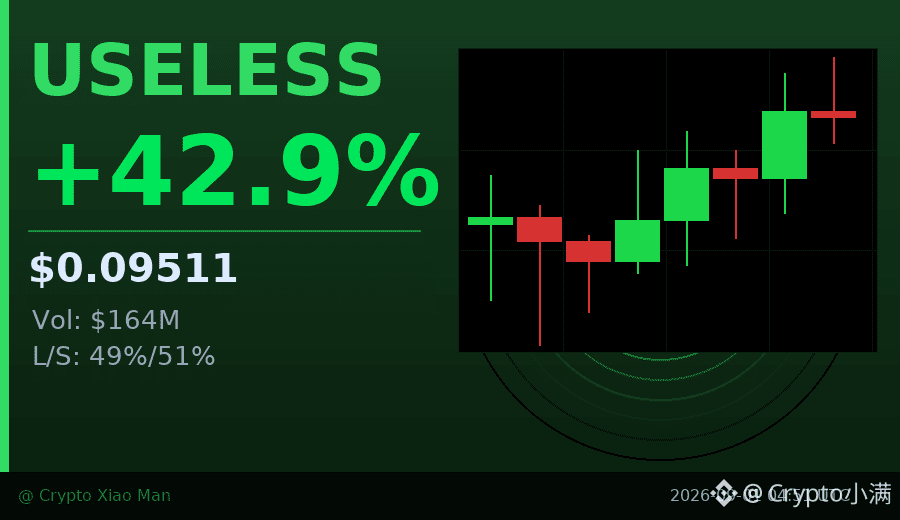
$USELESS Today, in the past 24 hours it has risen by nearly 43%. Put that number on any coin, it’s not small.
From a low of 0.066 all the way to 0.097—an entire big wave.
But what’s interesting isn’t the percentage increase itself; it’s the long/short structure:
Right now, the people taking long and the people taking short are almost evenly split (49% long / 51% short).
In other words, before and during this big rally, nearly half of the people were actually betting that it would drop.
So what does that mean? Those betting on a decline will be forced to concede as the market rises and automatically get liquidated/closed out.
That “forced concession” action itself then further pushes the price higher—
this is what’s called “short squeeze.” In plain terms: the expectation of a fall becomes the fuel for a rise.
The 8-hour candlesticks overall are strengthening, and trading volume is also quite active—today it ran out 160 million USD in volume.
The funding rate is close to 0, which suggests the market isn’t extremely tilted to either side yet—so there’s no overheating for now.
One point I’ll be watching next: around 0.097 is today’s high.
If the volume can’t keep up, this area may form a short-term resistance zone; if it breaks out on increased volume, that indicates the momentum is still there.
For these small coins that explode in volume in a short time, risk control matters more than anything—
you can observe, but if you plan to enter, your position size must be light.
$USELESS #小币暴涨 #43%涨幅
Click the small card below to quickly view the market👇
There’s one detail I think is worth mentioning—
$USELESS Today, in the past 24 hours it has risen by nearly 43%. Put that number on any coin, it’s not small.
From a low of 0.066 all the way to 0.097—an entire big wave.
But what’s interesting isn’t the percentage increase itself; it’s the long/short structure:
Right now, the people taking long and the people taking short are almost evenly split (49% long / 51% short).
In other words, before and during this big rally, nearly half of the people were actually betting that it would drop.
So what does that mean? Those betting on a decline will be forced to concede as the market rises and automatically get liquidated/closed out.
That “forced concession” action itself then further pushes the price higher—
this is what’s called “short squeeze.” In plain terms: the expectation of a fall becomes the fuel for a rise.
The 8-hour candlesticks overall are strengthening, and trading volume is also quite active—today it ran out 160 million USD in volume.
The funding rate is close to 0, which suggests the market isn’t extremely tilted to either side yet—so there’s no overheating for now.
One point I’ll be watching next: around 0.097 is today’s high.
If the volume can’t keep up, this area may form a short-term resistance zone; if it breaks out on increased volume, that indicates the momentum is still there.
For these small coins that explode in volume in a short time, risk control matters more than anything—
you can observe, but if you plan to enter, your position size must be light.
$USELESS #小币暴涨 #43%涨幅
Click the small card below to quickly view the market👇
$USELESS Today, in the past 24 hours it has risen by nearly 43%. Put that number on any coin, it’s not small.
From a low of 0.066 all the way to 0.097—an entire big wave.
But what’s interesting isn’t the percentage increase itself; it’s the long/short structure:
Right now, the people taking long and the people taking short are almost evenly split (49% long / 51% short).
In other words, before and during this big rally, nearly half of the people were actually betting that it would drop.
So what does that mean? Those betting on a decline will be forced to concede as the market rises and automatically get liquidated/closed out.
That “forced concession” action itself then further pushes the price higher—
this is what’s called “short squeeze.” In plain terms: the expectation of a fall becomes the fuel for a rise.
The 8-hour candlesticks overall are strengthening, and trading volume is also quite active—today it ran out 160 million USD in volume.
The funding rate is close to 0, which suggests the market isn’t extremely tilted to either side yet—so there’s no overheating for now.
One point I’ll be watching next: around 0.097 is today’s high.
If the volume can’t keep up, this area may form a short-term resistance zone; if it breaks out on increased volume, that indicates the momentum is still there.
For these small coins that explode in volume in a short time, risk control matters more than anything—
you can observe, but if you plan to enter, your position size must be light.
$USELESS #小币暴涨 #43%涨幅
Click the small card below to quickly view the market👇
49
·
--
To be honest, $BTR , I’ve watched today’s price action several times.
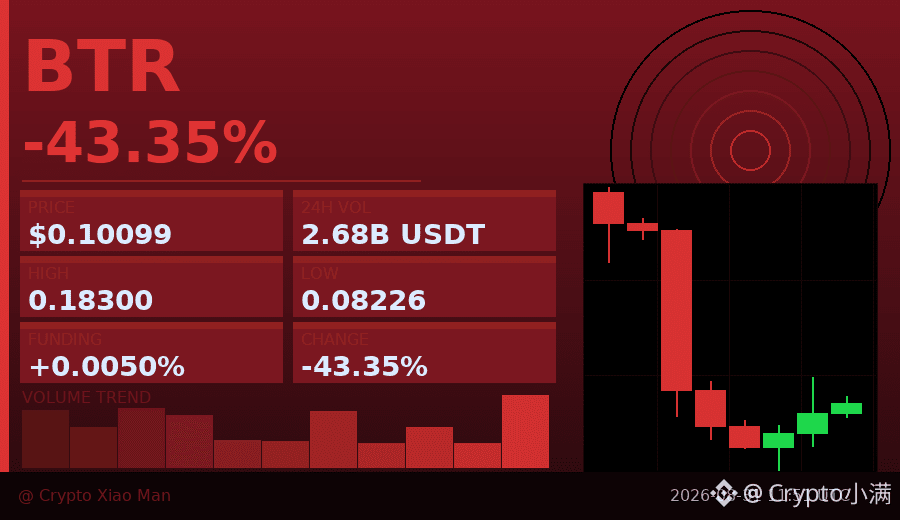
Over the past 24 hours it’s down 43%: it was smashed from the high of 0.183 all the way to the low of 0.082—almost a 50% drop. Just that number alone is already shocking.
But there’s a detail that’s even more worth paying attention to: after the price bottomed out, the most recent three consecutive hourly candlesticks all closed green, and the trading volume is quite substantial. This suggests that there are buyers stepping in at low levels—not a lifeless, nobody-cares situation, but real money coming in.
Now look at the long/short positioning: currently 61% of people are betting on a drop, while only 39% are betting on a rise. This extremely bearish skew is actually a bit dangerous—if the price continues moving upward, those who bet on the drop will be forced to close their positions. The act of closing can, in turn, push the price higher and trigger a chain reaction.
I’m not saying a rebound is guaranteed, but with this combination of “a big sell-off + low-level volume contraction at the bottom + shorts crowded together,” I’ll be watching closely.
If afterward it can hold steady around 0.095–0.10 and the volume keeps up, then this area could be a support zone for the current stage. Conversely, if volume expands again and the price breaks down through 0.082, then all the analysis above becomes invalid.
Let’s observe first—don’t rush.
$BTR #暴跌后的信号 #43%跌幅
Click the small card below to quickly check the market 👇
To be honest, $BTR , I’ve watched today’s price action several times.
Over the past 24 hours it’s down 43%: it was smashed from the high of 0.183 all the way to the low of 0.082—almost a 50% drop. Just that number alone is already shocking.
But there’s a detail that’s even more worth paying attention to: after the price bottomed out, the most recent three consecutive hourly candlesticks all closed green, and the trading volume is quite substantial. This suggests that there are buyers stepping in at low levels—not a lifeless, nobody-cares situation, but real money coming in.
Now look at the long/short positioning: currently 61% of people are betting on a drop, while only 39% are betting on a rise. This extremely bearish skew is actually a bit dangerous—if the price continues moving upward, those who bet on the drop will be forced to close their positions. The act of closing can, in turn, push the price higher and trigger a chain reaction.
I’m not saying a rebound is guaranteed, but with this combination of “a big sell-off + low-level volume contraction at the bottom + shorts crowded together,” I’ll be watching closely.
If afterward it can hold steady around 0.095–0.10 and the volume keeps up, then this area could be a support zone for the current stage. Conversely, if volume expands again and the price breaks down through 0.082, then all the analysis above becomes invalid.
Let’s observe first—don’t rush.
$BTR #暴跌后的信号 #43%跌幅
Click the small card below to quickly check the market 👇
Over the past 24 hours it’s down 43%: it was smashed from the high of 0.183 all the way to the low of 0.082—almost a 50% drop. Just that number alone is already shocking.
But there’s a detail that’s even more worth paying attention to: after the price bottomed out, the most recent three consecutive hourly candlesticks all closed green, and the trading volume is quite substantial. This suggests that there are buyers stepping in at low levels—not a lifeless, nobody-cares situation, but real money coming in.
Now look at the long/short positioning: currently 61% of people are betting on a drop, while only 39% are betting on a rise. This extremely bearish skew is actually a bit dangerous—if the price continues moving upward, those who bet on the drop will be forced to close their positions. The act of closing can, in turn, push the price higher and trigger a chain reaction.
I’m not saying a rebound is guaranteed, but with this combination of “a big sell-off + low-level volume contraction at the bottom + shorts crowded together,” I’ll be watching closely.
If afterward it can hold steady around 0.095–0.10 and the volume keeps up, then this area could be a support zone for the current stage. Conversely, if volume expands again and the price breaks down through 0.082, then all the analysis above becomes invalid.
Let’s observe first—don’t rush.
$BTR #暴跌后的信号 #43%跌幅
Click the small card below to quickly check the market 👇
192
·
--
Up 43%, but there are more people shorting than going long.
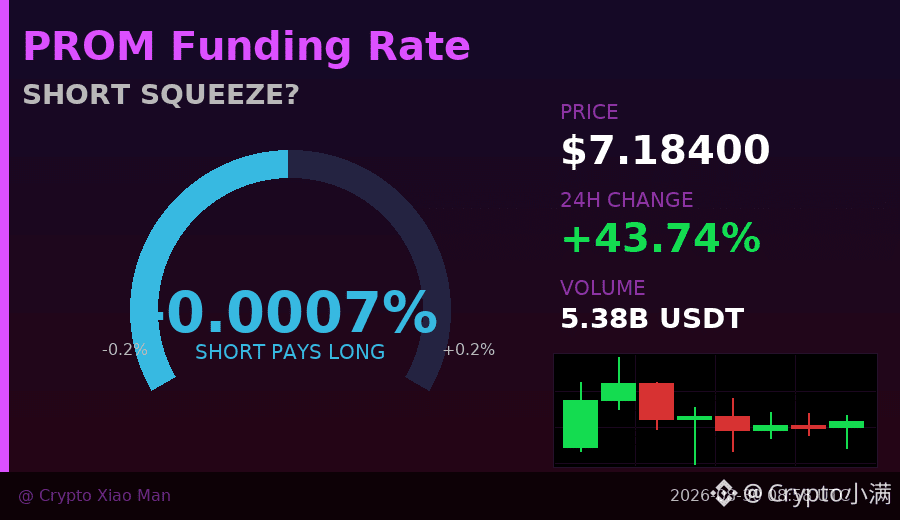
$PROM today surged from a low of 4.9 to a high of 7.9, up more than 40%. The turnover volume exceeded $500 million. In theory, in this kind of market, longs should have the advantage—but looking at the long/short ratio, shorts still account for 59.7%, while longs are only 40%.
That’s interesting—prices are rising, but most open positions are in the opposite direction.
In fast-rally markets like this, there’s a pattern: when shorts get trapped, they either add more positions or are forced to close. Closing positions then pushes the price even higher, creating a “short squeeze” cycle.
However, the 8-hour candlestick chart shows an overall weakening trend—from the 7.6 range, it has pulled back to around 7.1, suggesting the short-term peak has already passed and the momentum from the rally is fading.
The funding rate is nearly zero (-0.00000687), indicating that neither side has yet established a clear cost-based contest. The next direction is still being fought over.
The question now isn’t “whether to chase,” but: when will the shorts finally give up, or when will the longs be unable to hold on.
$PROM #逼空行情 #43%surge
Click the small card below to quickly check the market👇
Up 43%, but there are more people shorting than going long.
$PROM today surged from a low of 4.9 to a high of 7.9, up more than 40%. The turnover volume exceeded $500 million. In theory, in this kind of market, longs should have the advantage—but looking at the long/short ratio, shorts still account for 59.7%, while longs are only 40%.
That’s interesting—prices are rising, but most open positions are in the opposite direction.
In fast-rally markets like this, there’s a pattern: when shorts get trapped, they either add more positions or are forced to close. Closing positions then pushes the price even higher, creating a “short squeeze” cycle.
However, the 8-hour candlestick chart shows an overall weakening trend—from the 7.6 range, it has pulled back to around 7.1, suggesting the short-term peak has already passed and the momentum from the rally is fading.
The funding rate is nearly zero (-0.00000687), indicating that neither side has yet established a clear cost-based contest. The next direction is still being fought over.
The question now isn’t “whether to chase,” but: when will the shorts finally give up, or when will the longs be unable to hold on.
$PROM #逼空行情 #43%surge
Click the small card below to quickly check the market👇
$PROM today surged from a low of 4.9 to a high of 7.9, up more than 40%. The turnover volume exceeded $500 million. In theory, in this kind of market, longs should have the advantage—but looking at the long/short ratio, shorts still account for 59.7%, while longs are only 40%.
That’s interesting—prices are rising, but most open positions are in the opposite direction.
In fast-rally markets like this, there’s a pattern: when shorts get trapped, they either add more positions or are forced to close. Closing positions then pushes the price even higher, creating a “short squeeze” cycle.
However, the 8-hour candlestick chart shows an overall weakening trend—from the 7.6 range, it has pulled back to around 7.1, suggesting the short-term peak has already passed and the momentum from the rally is fading.
The funding rate is nearly zero (-0.00000687), indicating that neither side has yet established a clear cost-based contest. The next direction is still being fought over.
The question now isn’t “whether to chase,” but: when will the shorts finally give up, or when will the longs be unable to hold on.
$PROM #逼空行情 #43%surge
Click the small card below to quickly check the market👇
44
·
--
55.87% of the shorts are still shorting a coin that has already surged 43%.
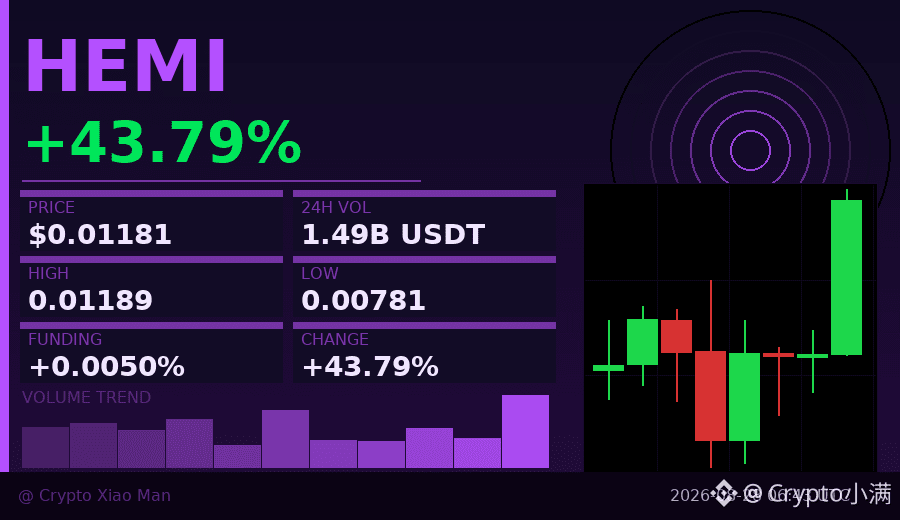
$HEMI ’s data today is a bit unusual—price was pushed from a low of 0.0078 all the way up to 0.0119, up more than 43%, yet the short-side share in the contracts is actually as high as 55.87%, while longs are only 44.13%.
The normal logic would be: when a coin rises this fast, shorts should have already surrendered and closed their positions. But that isn’t happening here. This suggests a group of players is still holding onto short positions at high levels—either they’re stubbornly “holding on,” or they’re opening new shorts at even higher prices, betting that it will pull back.
The funding rate is only 0.005%, and this number tells me that the whole derivatives market isn’t “chasing longs like crazy.” The longs’ leverage sentiment looks calm; instead, it’s the shorts bearing the pressure.
Now look at the candlesticks: the last hourly candle’s trading volume suddenly jumped to over 1 billion, about 1.5x that of the previous few candles, and the price also set a new intraday high at 0.0119.
A breakout with higher volume + a large amount of shorts still not closed—technically, this combination is called a “short trap.” The higher it goes, the more expensive the cost for trapped shorts to exit becomes, and the larger the buy pressure forced upon them.
Open interest (OI) is currently 1.5 billion—this is a sizable position. If the price can hold in the high range, these shorts will face increasingly costly closing prices.
Watch two key points: whether 0.0119 can hold (near today’s high), and whether the short share starts to drop rapidly.
$HEMI #空头陷阱信号 #43%涨幅
Click the small card below to quickly check the行情👇
55.87% of the shorts are still shorting a coin that has already surged 43%.
$HEMI ’s data today is a bit unusual—price was pushed from a low of 0.0078 all the way up to 0.0119, up more than 43%, yet the short-side share in the contracts is actually as high as 55.87%, while longs are only 44.13%.
The normal logic would be: when a coin rises this fast, shorts should have already surrendered and closed their positions. But that isn’t happening here. This suggests a group of players is still holding onto short positions at high levels—either they’re stubbornly “holding on,” or they’re opening new shorts at even higher prices, betting that it will pull back.
The funding rate is only 0.005%, and this number tells me that the whole derivatives market isn’t “chasing longs like crazy.” The longs’ leverage sentiment looks calm; instead, it’s the shorts bearing the pressure.
Now look at the candlesticks: the last hourly candle’s trading volume suddenly jumped to over 1 billion, about 1.5x that of the previous few candles, and the price also set a new intraday high at 0.0119.
A breakout with higher volume + a large amount of shorts still not closed—technically, this combination is called a “short trap.” The higher it goes, the more expensive the cost for trapped shorts to exit becomes, and the larger the buy pressure forced upon them.
Open interest (OI) is currently 1.5 billion—this is a sizable position. If the price can hold in the high range, these shorts will face increasingly costly closing prices.
Watch two key points: whether 0.0119 can hold (near today’s high), and whether the short share starts to drop rapidly.
$HEMI #空头陷阱信号 #43%涨幅
Click the small card below to quickly check the行情👇
$HEMI ’s data today is a bit unusual—price was pushed from a low of 0.0078 all the way up to 0.0119, up more than 43%, yet the short-side share in the contracts is actually as high as 55.87%, while longs are only 44.13%.
The normal logic would be: when a coin rises this fast, shorts should have already surrendered and closed their positions. But that isn’t happening here. This suggests a group of players is still holding onto short positions at high levels—either they’re stubbornly “holding on,” or they’re opening new shorts at even higher prices, betting that it will pull back.
The funding rate is only 0.005%, and this number tells me that the whole derivatives market isn’t “chasing longs like crazy.” The longs’ leverage sentiment looks calm; instead, it’s the shorts bearing the pressure.
Now look at the candlesticks: the last hourly candle’s trading volume suddenly jumped to over 1 billion, about 1.5x that of the previous few candles, and the price also set a new intraday high at 0.0119.
A breakout with higher volume + a large amount of shorts still not closed—technically, this combination is called a “short trap.” The higher it goes, the more expensive the cost for trapped shorts to exit becomes, and the larger the buy pressure forced upon them.
Open interest (OI) is currently 1.5 billion—this is a sizable position. If the price can hold in the high range, these shorts will face increasingly costly closing prices.
Watch two key points: whether 0.0119 can hold (near today’s high), and whether the short share starts to drop rapidly.
$HEMI #空头陷阱信号 #43%涨幅
Click the small card below to quickly check the行情👇
96
·
--
43%, it wasn’t started rising just today—
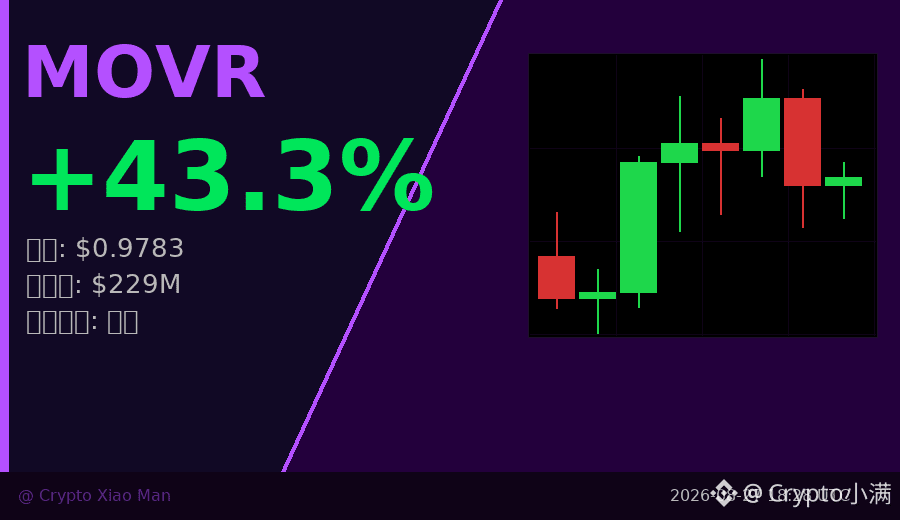
Over the past 8 hours, MOVR steadily strengthened, jumping from 0.62 to a high of 1.17. The move in this range is close to 90%.
But interestingly, the funding rate is almost zero (0.003%), suggesting this rally wasn’t built purely with leverage.
The long/short ratio is 55.7% longs vs 44.3% shorts, with no extreme skew.
Instead, it implies a significant portion of traders are still short this uptrend—
and once those shorts can’t hold, they become the fuel for the next leg higher.
Trading volume also has something to say: nearly $230 million in a single day. For a mover at this scale, that’s unusually high volume.
In terms of candlestick structure, volume is clearly concentrated on the 4th and 5th candles, showing an aggressive buying rhythm—not a shakeout.
Of course, the pullback from 1.17 to the current 0.978 indicates that short-term profit-taking is reducing positions—
the higher the price level, the looser the supply/chips.
The key now is whether it can hold the psychological integer level around 1.0.
If it holds, shorts stay passive; if it fails, price may retest support below 0.9 in the short term.
$MOVR #暴涨行情 #43% price increase
Click the small card below to quickly check the chart 👇
43%, it wasn’t started rising just today—
Over the past 8 hours, MOVR steadily strengthened, jumping from 0.62 to a high of 1.17. The move in this range is close to 90%.
But interestingly, the funding rate is almost zero (0.003%), suggesting this rally wasn’t built purely with leverage.
The long/short ratio is 55.7% longs vs 44.3% shorts, with no extreme skew.
Instead, it implies a significant portion of traders are still short this uptrend—
and once those shorts can’t hold, they become the fuel for the next leg higher.
Trading volume also has something to say: nearly $230 million in a single day. For a mover at this scale, that’s unusually high volume.
In terms of candlestick structure, volume is clearly concentrated on the 4th and 5th candles, showing an aggressive buying rhythm—not a shakeout.
Of course, the pullback from 1.17 to the current 0.978 indicates that short-term profit-taking is reducing positions—
the higher the price level, the looser the supply/chips.
The key now is whether it can hold the psychological integer level around 1.0.
If it holds, shorts stay passive; if it fails, price may retest support below 0.9 in the short term.
$MOVR #暴涨行情 #43% price increase
Click the small card below to quickly check the chart 👇
Over the past 8 hours, MOVR steadily strengthened, jumping from 0.62 to a high of 1.17. The move in this range is close to 90%.
But interestingly, the funding rate is almost zero (0.003%), suggesting this rally wasn’t built purely with leverage.
The long/short ratio is 55.7% longs vs 44.3% shorts, with no extreme skew.
Instead, it implies a significant portion of traders are still short this uptrend—
and once those shorts can’t hold, they become the fuel for the next leg higher.
Trading volume also has something to say: nearly $230 million in a single day. For a mover at this scale, that’s unusually high volume.
In terms of candlestick structure, volume is clearly concentrated on the 4th and 5th candles, showing an aggressive buying rhythm—not a shakeout.
Of course, the pullback from 1.17 to the current 0.978 indicates that short-term profit-taking is reducing positions—
the higher the price level, the looser the supply/chips.
The key now is whether it can hold the psychological integer level around 1.0.
If it holds, shorts stay passive; if it fails, price may retest support below 0.9 in the short term.
$MOVR #暴涨行情 #43% price increase
Click the small card below to quickly check the chart 👇
73
·
--
$SNXXB intraday volatility has expanded, so trading volume and spread need to be viewed together.
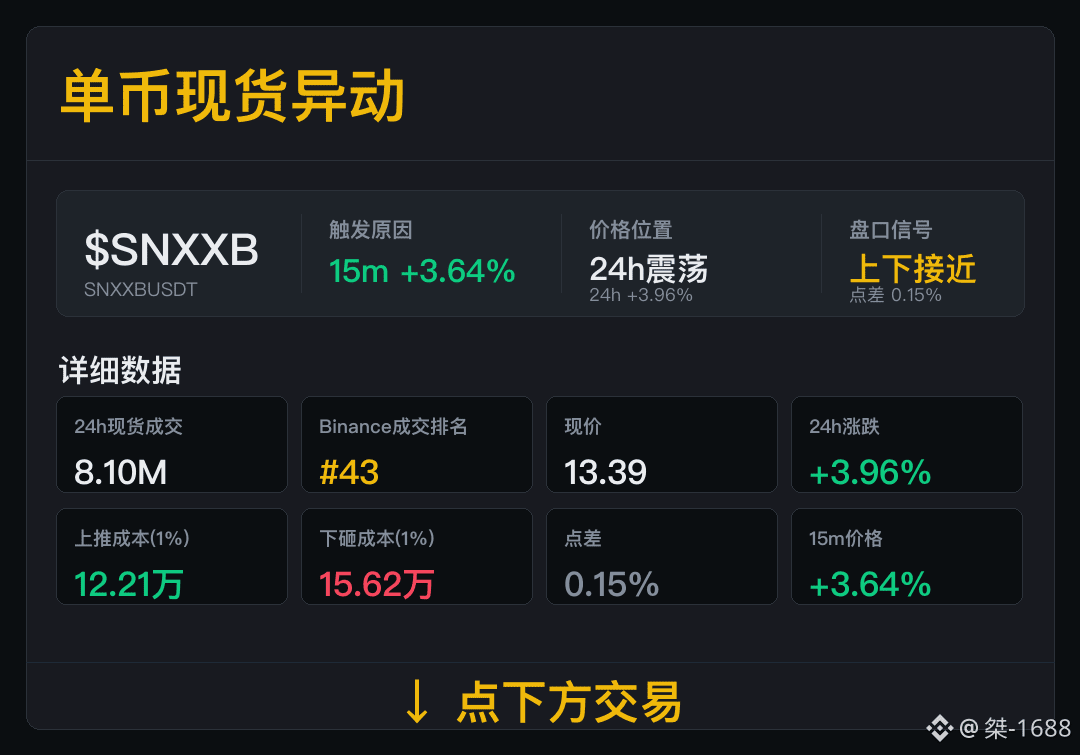
Spot trading volume is 8.10M, with Binance ranking #43 by volume. Trading scale and ranking can be tracked together.
The current 24h change is +3.96%; spread is 0.15%, with an upward push cost of 122.1K and a downward sell-off cost of 156.2K. When spot volume aligns with order book costs, short-term signals are more solid.
Going forward, don’t just look at the current price. If volume drops or the spread widens, lower the weight first.
$SNXXB intraday volatility has expanded, so trading volume and spread need to be viewed together.
Spot trading volume is 8.10M, with Binance ranking #43 by volume. Trading scale and ranking can be tracked together.
The current 24h change is +3.96%; spread is 0.15%, with an upward push cost of 122.1K and a downward sell-off cost of 156.2K. When spot volume aligns with order book costs, short-term signals are more solid.
Going forward, don’t just look at the current price. If volume drops or the spread widens, lower the weight first.
Spot trading volume is 8.10M, with Binance ranking #43 by volume. Trading scale and ranking can be tracked together.
The current 24h change is +3.96%; spread is 0.15%, with an upward push cost of 122.1K and a downward sell-off cost of 156.2K. When spot volume aligns with order book costs, short-term signals are more solid.
Going forward, don’t just look at the current price. If volume drops or the spread widens, lower the weight first.
1
883

·
--
In the narrative of AI, the money always cycles back—back to that one day, the day of $TAO , even though no one knows the exact date. August 20 seems to be that day: the full-day trading volume jumped from the 40–80M range of the past few weeks straight to 189M, and the price simultaneously completed a breakout—pay attention to the details: on the same K-line, there are two quotes, indicating that real funds behind this order book are changing hands, not just a technical indicator correction.
For the past two months, $TAO has been grinding in a tight box of 187–205. During that period, any rebound lacked trading confirmation. What really needs confirmation is whether this volume-expanding bullish candle will, like on August 9, surge higher and then drop back into the trading range. It’s still -72% from ATH, and the market cap is 2.01B at #43. At this level you can’t really call it cheap, and you also can’t deny it’s been overlooked for an entire year. What I care about most is: if the AI agent narrative continues to spread, will capital choose the already validated consensus of $TAO, or divert to newer, smaller-cap tickers—historical patterns are that the leader moves first, but it may not be the one with the biggest upside.
Risk lies in whether the volume can be sustained. If, in the next three days, trading volume falls back below 80M, this breakout is likely just short-covering. If volume expands and holds above 210, then 240–260 above is the real disagreement zone. People who are late and chasing in now should set their stop-loss properly—once the $200 level breaks, the pattern returns to square one.
In the AI or agent narrative you’ve been seeing recently, what fund flows are you watching? Is it $FET , or are other tickers siphoning flows, or is $TAO being treated as the only settlement/bridge for capital?
In the narrative of AI, the money always cycles back—back to that one day, the day of $TAO , even though no one knows the exact date. August 20 seems to be that day: the full-day trading volume jumped from the 40–80M range of the past few weeks straight to 189M, and the price simultaneously completed a breakout—pay attention to the details: on the same K-line, there are two quotes, indicating that real funds behind this order book are changing hands, not just a technical indicator correction.
For the past two months, $TAO has been grinding in a tight box of 187–205. During that period, any rebound lacked trading confirmation. What really needs confirmation is whether this volume-expanding bullish candle will, like on August 9, surge higher and then drop back into the trading range. It’s still -72% from ATH, and the market cap is 2.01B at #43. At this level you can’t really call it cheap, and you also can’t deny it’s been overlooked for an entire year. What I care about most is: if the AI agent narrative continues to spread, will capital choose the already validated consensus of $TAO , or divert to newer, smaller-cap tickers—historical patterns are that the leader moves first, but it may not be the one with the biggest upside.
Risk lies in whether the volume can be sustained. If, in the next three days, trading volume falls back below 80M, this breakout is likely just short-covering. If volume expands and holds above 210, then 240–260 above is the real disagreement zone. People who are late and chasing in now should set their stop-loss properly—once the $200 level breaks, the pattern returns to square one.
In the AI or agent narrative you’ve been seeing recently, what fund flows are you watching? Is it $FET , or are other tickers siphoning flows, or is $TAO being treated as the only settlement/bridge for capital?
For the past two months, $TAO has been grinding in a tight box of 187–205. During that period, any rebound lacked trading confirmation. What really needs confirmation is whether this volume-expanding bullish candle will, like on August 9, surge higher and then drop back into the trading range. It’s still -72% from ATH, and the market cap is 2.01B at #43. At this level you can’t really call it cheap, and you also can’t deny it’s been overlooked for an entire year. What I care about most is: if the AI agent narrative continues to spread, will capital choose the already validated consensus of $TAO , or divert to newer, smaller-cap tickers—historical patterns are that the leader moves first, but it may not be the one with the biggest upside.
Risk lies in whether the volume can be sustained. If, in the next three days, trading volume falls back below 80M, this breakout is likely just short-covering. If volume expands and holds above 210, then 240–260 above is the real disagreement zone. People who are late and chasing in now should set their stop-loss properly—once the $200 level breaks, the pattern returns to square one.
In the AI or agent narrative you’ve been seeing recently, what fund flows are you watching? Is it $FET , or are other tickers siphoning flows, or is $TAO being treated as the only settlement/bridge for capital?
82

·
--
We're tracking the latest trends on CoinGecko, where several tokens are making waves. Our community is eager to stay updated on the market's top performers.
We're seeing notable market cap ranks, with Hyperliquid (HYPE) at #10 and Worldcoin (WLD) at #43, alongside Humanity (H) at #85 🚀.
We're highlighting these tokens, including Siren (SIREN) and Backpack (BP), as we conclude our overview, with Bittensor (TAO) also on our radar 💡, and OpenGradient (OPG) 👍, as we wrap up, looking forward to more updates 📊.
$BANANAS31, $OPG, $EVAA
We're tracking the latest trends on CoinGecko, where several tokens are making waves. Our community is eager to stay updated on the market's top performers.
We're seeing notable market cap ranks, with Hyperliquid (HYPE) at #10 and Worldcoin (WLD) at #43, alongside Humanity (H) at #85 🚀.
We're highlighting these tokens, including Siren (SIREN) and Backpack (BP), as we conclude our overview, with Bittensor (TAO) also on our radar 💡, and OpenGradient (OPG) 👍, as we wrap up, looking forward to more updates 📊.
$BANANAS31 , $OPG , $EVAA
We're seeing notable market cap ranks, with Hyperliquid (HYPE) at #10 and Worldcoin (WLD) at #43, alongside Humanity (H) at #85 🚀.
We're highlighting these tokens, including Siren (SIREN) and Backpack (BP), as we conclude our overview, with Bittensor (TAO) also on our radar 💡, and OpenGradient (OPG) 👍, as we wrap up, looking forward to more updates 📊.
$BANANAS31 , $OPG , $EVAA
339
Log in to explore more content
Join global crypto users on Binance Square
⚡️ Get latest and useful information about crypto.
💬 Trusted by the world’s largest crypto exchange.
👍 Discover real insights from verified creators.
Email / Phone number
Trending Topics
1
#NEARSurges26%Past$3.45
3,634 views
53 Discussing
2
#BOJHikesRatesTo31YearHigh
9,479 views
337 Discussing
3
#ChainlinkPowersBottomlinePaymentPlatform
13,586 views
378 Discussing
4
#DtcpayCompletes$25MSeriesA
175 views
13 Discussing
5
#InjectiveLaunchesINJOnSolana
129 views
15 Discussing
6
#StellarActivatesProtocol28At211TPS
22,386 views
513 Discussing
7
#SECGrantsInnovationExemptionForTokenizedStocks
18,744 views
415 Discussing
8
#XRPGains3%AsRippleAddsMPPSupport
15,856 views
328 Discussing
9
#SPGlobalToAcquireOpenZeppelin
9,224 views
214 Discussing
10
#WorldLaunchesSelfCustodyAppIn150Countries
5,100 views
119 Discussing