
MrAwaisBilal
6 Publications

MrAwaisBilal
Signaler
Bloquer l’utilisateur
Ouvert au trading
9.3 mois
0 Suivis
12 Abonnés
7 J’aime
Publications
Portefeuille
·
--
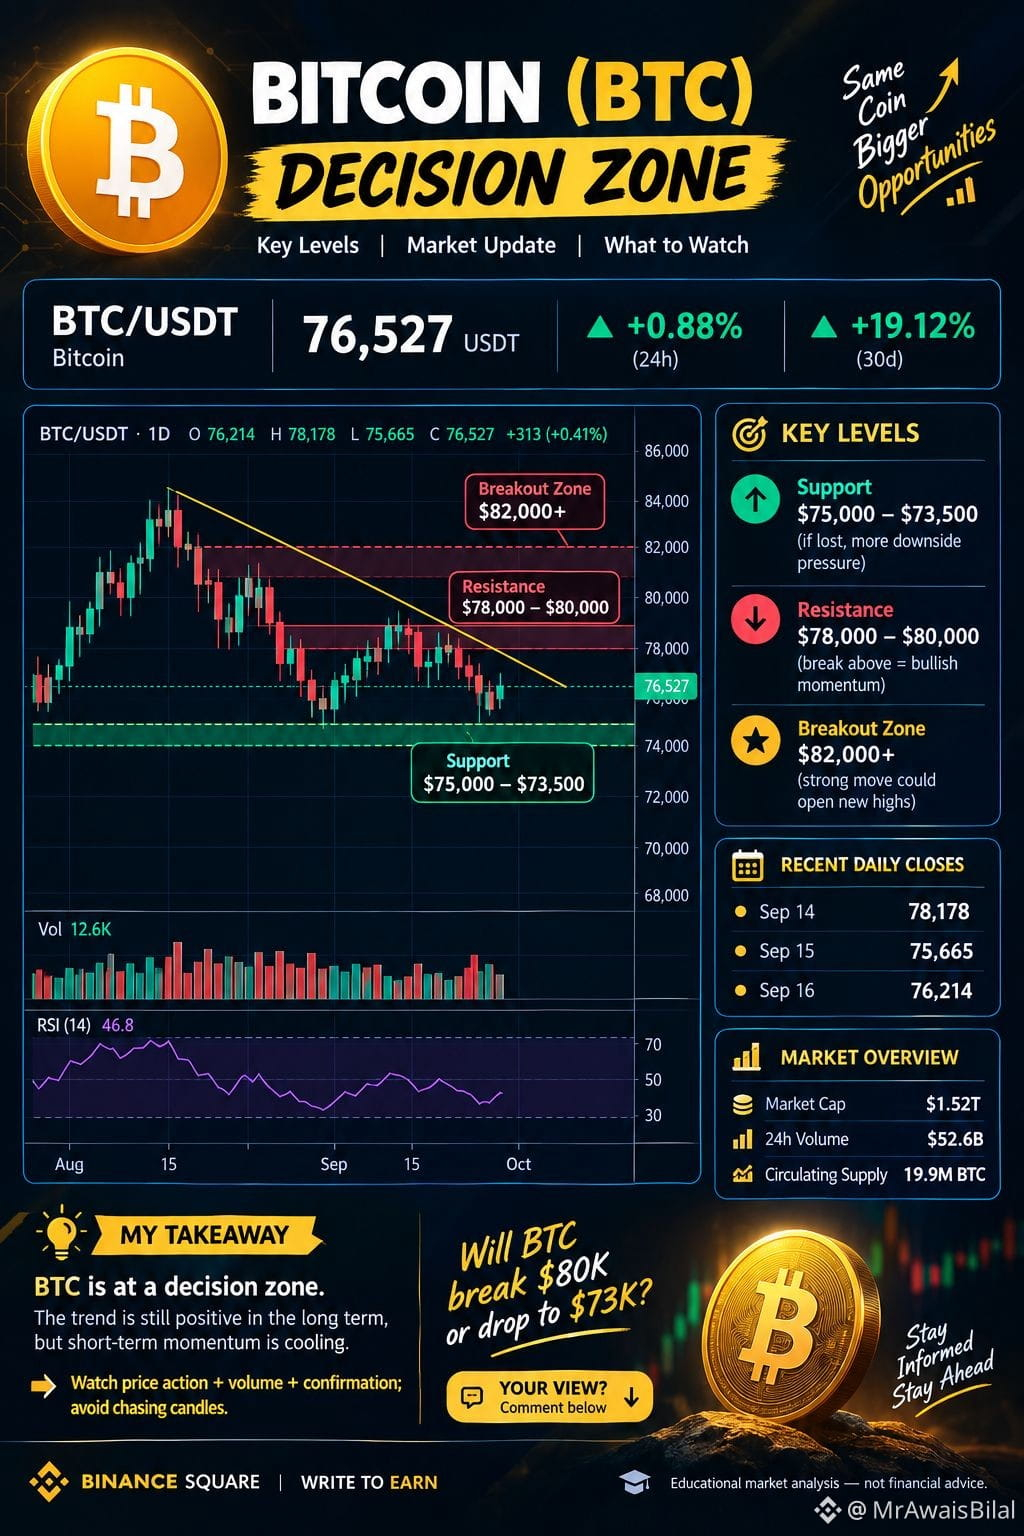
$BTC BITCOIN (BTC) — ZONE DE DÉCISION !
Le BTC s’échange actuellement autour de 76 527 USDT.
Niveaux clés à surveiller :
Support : 75K–73,5K $
Résistance : 78K–80K $
Zone de cassure : 82K+ $
Le Bitcoin montre des signes de reprise après la correction récente, mais l’élan à court terme nécessite encore une confirmation.
👀 La vraie question :
Est-ce que le BTC va casser 80K → 82K+ ou revenir sur la zone de support 75K–73,5K ?
Ne poursuis pas la bougie. Surveille le mouvement des prix + le volume + la confirmation.
💬 Quel est ton avis ? BTC → 82K ou 73K d’abord ?
#Bitcoin #BTC #BTCUSDT #Binance #BinanceSquare #Crypto #CryptoTrading #Web3
#MemeLaunchpads82%OfArcDayOneVolume #Binance #FedSEPProjects2026RateAt4.1%
$BTC BITCOIN (BTC) — ZONE DE DÉCISION !
Le BTC s’échange actuellement autour de 76 527 USDT.
Niveaux clés à surveiller :
Support : 75K–73,5K $
Résistance : 78K–80K $
Zone de cassure : 82K+ $
Le Bitcoin montre des signes de reprise après la correction récente, mais l’élan à court terme nécessite encore une confirmation.
👀 La vraie question :
Est-ce que le BTC va casser 80K → 82K+ ou revenir sur la zone de support 75K–73,5K ?
Ne poursuis pas la bougie. Surveille le mouvement des prix + le volume + la confirmation.
💬 Quel est ton avis ? BTC → 82K ou 73K d’abord ?
#Bitcoin #BTC #BTCUSDT #Binance #BinanceSquare #Crypto #CryptoTrading #Web3
#MemeLaunchpads82%OfArcDayOneVolume #Binance #FedSEPProjects2026RateAt4.1%
Le BTC s’échange actuellement autour de 76 527 USDT.
Niveaux clés à surveiller :
Support : 75K–73,5K $
Résistance : 78K–80K $
Zone de cassure : 82K+ $
Le Bitcoin montre des signes de reprise après la correction récente, mais l’élan à court terme nécessite encore une confirmation.
👀 La vraie question :
Est-ce que le BTC va casser 80K → 82K+ ou revenir sur la zone de support 75K–73,5K ?
Ne poursuis pas la bougie. Surveille le mouvement des prix + le volume + la confirmation.
💬 Quel est ton avis ? BTC → 82K ou 73K d’abord ?
#Bitcoin #BTC #BTCUSDT #Binance #BinanceSquare #Crypto #CryptoTrading #Web3
#MemeLaunchpads82%OfArcDayOneVolume #Binance #FedSEPProjects2026RateAt4.1%
58
·
--
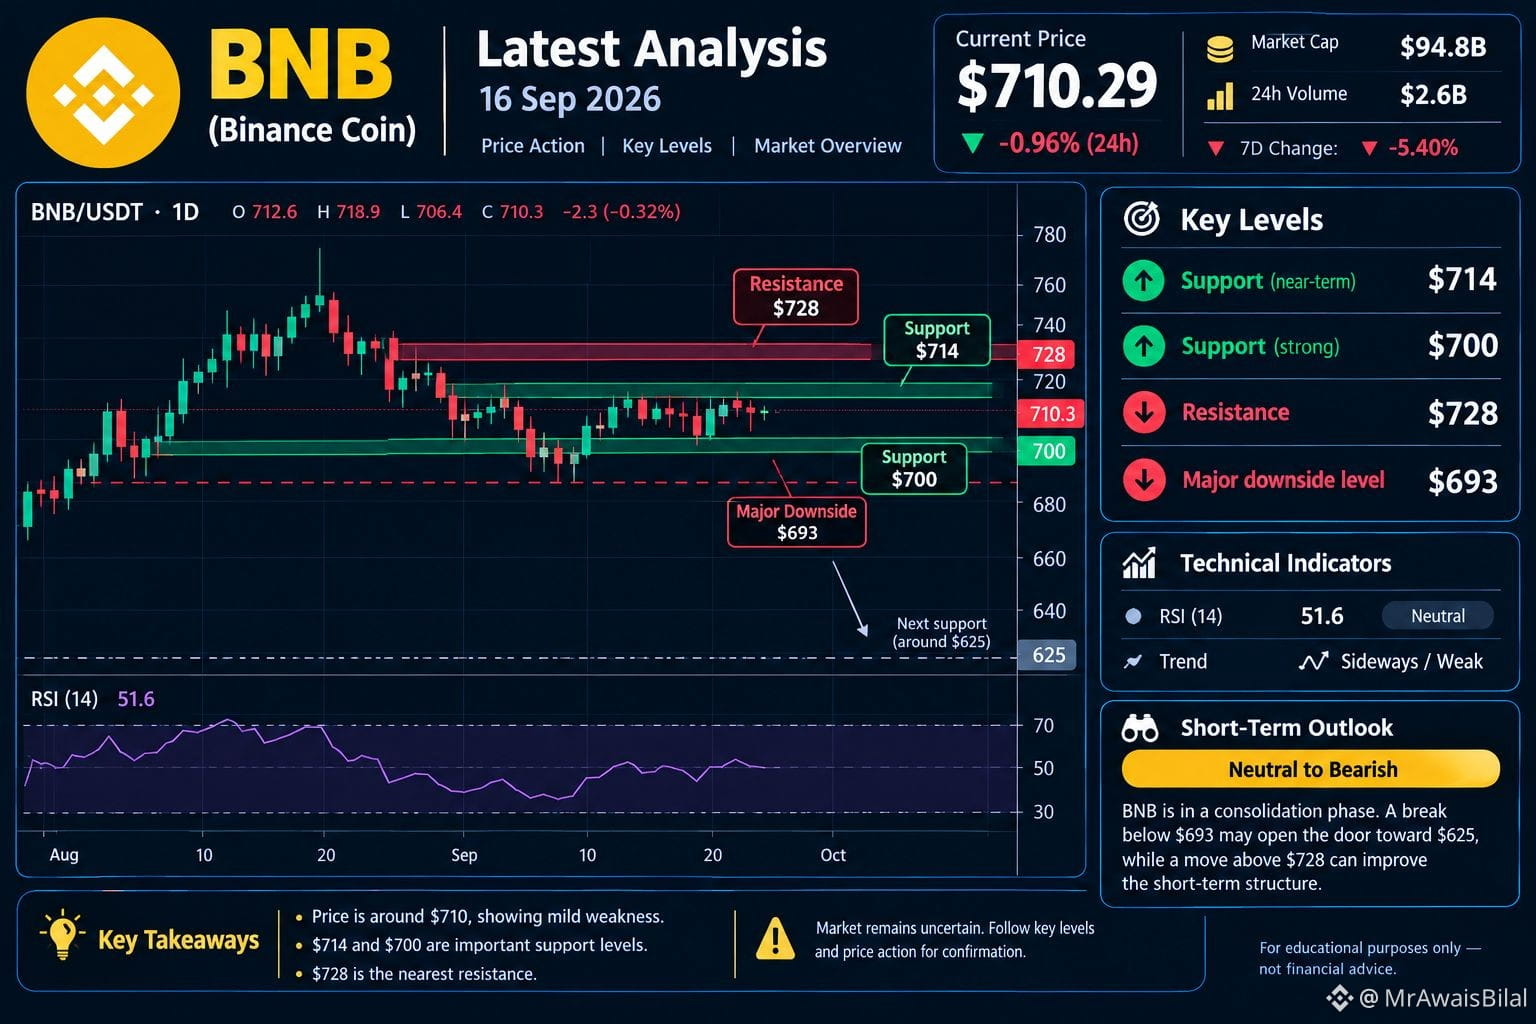
$BNB today dernière analyse
{spot}(BNBUSDT)
#
Prix: ~710$
24H : -0,96% | 7J : -5,40% �
CoinGecko +1
🟢 Support : 700$–714$
🔴 Résistance : 728$
⚠️ En dessous de 693$ : la baisse pourrait s’étendre vers ~625$
📊 RSI : ~51,6 — neutre
Court terme : latéral à légèrement baissier ; une confirmation autour de 700$/728$ est importante. �
CoinMarketCap +1
*Analyse éducative uniquement, pas un conseil financier.*
#FedRateWatch #ZcashHoldersBackNU7Upgrade #MSTRTradingVolumeSurpassesMorganStanley #BitcoinFalls4%
$BNB today dernière analyse
#
Prix: ~710$
24H : -0,96% | 7J : -5,40% �
CoinGecko +1
🟢 Support : 700$–714$
🔴 Résistance : 728$
⚠️ En dessous de 693$ : la baisse pourrait s’étendre vers ~625$
📊 RSI : ~51,6 — neutre
Court terme : latéral à légèrement baissier ; une confirmation autour de 700$/728$ est importante. �
CoinMarketCap +1
*Analyse éducative uniquement, pas un conseil financier.*
#FedRateWatch #ZcashHoldersBackNU7Upgrade #MSTRTradingVolumeSurpassesMorganStanley #BitcoinFalls4%
#
Prix: ~710$
24H : -0,96% | 7J : -5,40% �
CoinGecko +1
🟢 Support : 700$–714$
🔴 Résistance : 728$
⚠️ En dessous de 693$ : la baisse pourrait s’étendre vers ~625$
📊 RSI : ~51,6 — neutre
Court terme : latéral à légèrement baissier ; une confirmation autour de 700$/728$ est importante. �
CoinMarketCap +1
*Analyse éducative uniquement, pas un conseil financier.*
#FedRateWatch #ZcashHoldersBackNU7Upgrade #MSTRTradingVolumeSurpassesMorganStanley #BitcoinFalls4%
65
·
--
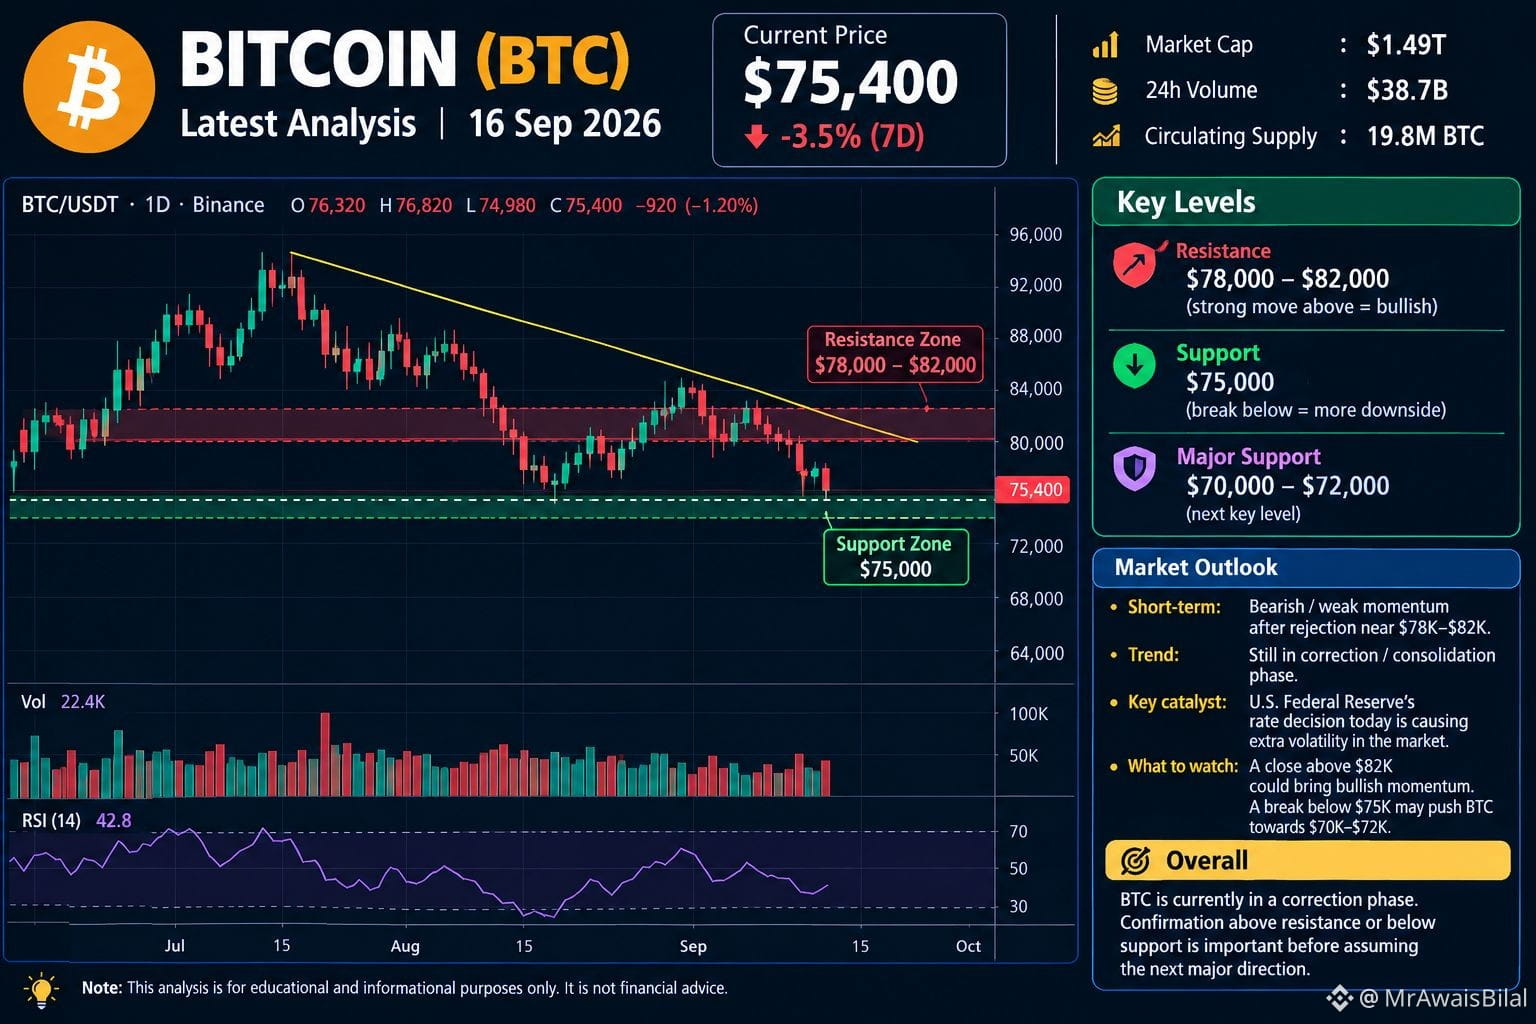
$BTC bitcoin — Dernière analyse
Prix actuel : autour de 75 400 $. Le BTC a baissé d’environ 3,5 % sur les 7 derniers jours. �
CoinGecko +1
Court terme : baissier/faible élan après un rejet près de la zone 78 000–82 000 $.
Support : 75 000 $ est un niveau important à court terme ; s’il est perdu, cela pourrait exposer des niveaux plus bas.
Résistance : 78 000–82 000 $. Un mouvement fort de retour au-dessus de cette zone améliorerait la structure à court terme.
Catalyseur majeur aujourd’hui : la décision des taux de la Réserve fédérale américaine crée une volatilité supplémentaire sur le marché. �
reuters.com +1
Globalement : le BTC se trouve actuellement dans une phase de correction/consolidation ; il est donc important d’obtenir une confirmation au-dessus de la résistance ou en dessous du support avant de supposer la prochaine grande direction.
*Il s’agit d’une analyse de marché, pas d’une garantie ni de conseils financiers.*#FedRateWatch #USSenateBlocksClarityAct #StrategyMarketCapPassesFord #ClarityActOddsHalveOnPolymarket #US30YTreasuryYieldTops5.40%
$BTC bitcoin — Dernière analyse
Prix actuel : autour de 75 400 $. Le BTC a baissé d’environ 3,5 % sur les 7 derniers jours. �
CoinGecko +1
Court terme : baissier/faible élan après un rejet près de la zone 78 000–82 000 $.
Support : 75 000 $ est un niveau important à court terme ; s’il est perdu, cela pourrait exposer des niveaux plus bas.
Résistance : 78 000–82 000 $. Un mouvement fort de retour au-dessus de cette zone améliorerait la structure à court terme.
Catalyseur majeur aujourd’hui : la décision des taux de la Réserve fédérale américaine crée une volatilité supplémentaire sur le marché. �
reuters.com +1
Globalement : le BTC se trouve actuellement dans une phase de correction/consolidation ; il est donc important d’obtenir une confirmation au-dessus de la résistance ou en dessous du support avant de supposer la prochaine grande direction.
*Il s’agit d’une analyse de marché, pas d’une garantie ni de conseils financiers.*#FedRateWatch #USSenateBlocksClarityAct #StrategyMarketCapPassesFord #ClarityActOddsHalveOnPolymarket #US30YTreasuryYieldTops5.40%
Prix actuel : autour de 75 400 $. Le BTC a baissé d’environ 3,5 % sur les 7 derniers jours. �
CoinGecko +1
Court terme : baissier/faible élan après un rejet près de la zone 78 000–82 000 $.
Support : 75 000 $ est un niveau important à court terme ; s’il est perdu, cela pourrait exposer des niveaux plus bas.
Résistance : 78 000–82 000 $. Un mouvement fort de retour au-dessus de cette zone améliorerait la structure à court terme.
Catalyseur majeur aujourd’hui : la décision des taux de la Réserve fédérale américaine crée une volatilité supplémentaire sur le marché. �
reuters.com +1
Globalement : le BTC se trouve actuellement dans une phase de correction/consolidation ; il est donc important d’obtenir une confirmation au-dessus de la résistance ou en dessous du support avant de supposer la prochaine grande direction.
*Il s’agit d’une analyse de marché, pas d’une garantie ni de conseils financiers.*#FedRateWatch #USSenateBlocksClarityAct #StrategyMarketCapPassesFord #ClarityActOddsHalveOnPolymarket #US30YTreasuryYieldTops5.40%
69
·
--
Voir la traduction
Analyst Who Correctly Predicted XRP Crash to $1.88 Sets His Next Price Target$XRP As noted by market expert Dark Defender, the XRP price has completed Wave 4 in its Elliot Wave pattern and is poised to soar over 200% from here.
The XRP price is on the cusp of a significant movement, as the token has completed Wave 4 in its Elliot Wave pattern. As the altcoin continues to advance in line with predictions, market experts like Dark Defender set sights on a new target of $5.85 in Wave 5, an over 207% rise from the current price.
✨Bear Market Hasn’t Yet Started
In a recent X post, crypto analyst Dark Defender shared his bullish perspectives on the XRP token. The analyst utilized Elliott Wave theory, asserting that XRP will achieve a new peak in this cycle.
Notably, Dark Defender has been tracking the Wave 4 since February 13, 2025. Based on his analysis, the token completed Wave A at $1.60 in April and Wave B at $3.66 in July. The analyst marked $1.88 as the completion point of Wave C of the Monthly Wave 4, which is now technically confirmed as done.
Dark Defender noted that he stayed calm during XRP’s price movements, identifying a key support zone between $2.2222 and $1.8815. While XRP dropped to this level, it managed to bounce back, completing Wave C of Wave 4 at $1.88.
✨Ignore FUD
In his previous analysis in February, Dark Defender urged investors and traders to ignore FUD (Fear, Uncertainty, Doubt) and instead focus on the potential developments. He presented a technical analysis chart for the XRP/USD pair, outlining its long-term projection based on historical market cycles and technical indicators.
Using the Elliot Wave theory and Fibonacci levels, the expert identified the key support around $1.88, which has been tested and held firm during market corrections. According to his analysis, Waves 1 to 3 show a clear impulsive structure.
Building on this momentum, Wave 4 has also unfolded as a healthy corrective phase, retracing toward the $1.90–$2.00 zone in line with the 70.2% Fibonacci level. During this phase, the XRP price managed to stay above critical structural support and preserve the broader bullish trend.
Currently, XRP is experiencing high volatility. At the time of writing, the crypto token trades for $1.88, down 5.6% in a day. This negative momentum is further bolstered by its weekly and monthly declines, having dropped 8% in a week and 16% in a month.
🚀🚀🚀 FOLLOW BE_MASTER BUY_SMART 💰💰💰
Appreciate the work. 😍 Thank You. 👍 FOLLOW BeMaster BuySmart 🚀 TO FIND OUT MORE $$$$$ 🤩 BE MASTER BUY SMART 💰🤩
🚀🚀🚀 PLEASE CLICK FOLLOW BE MASTER BUY SMART - Thank You.
$BTC
{spot}(BTCUSDT)
$XRP
{spot}(XRPUSDT)
#USNonFarmPayrollReport #USJobsData #BTCVSGOLD #CPIWatch #TrumpTariffs
Analyst Who Correctly Predicted XRP Crash to $1.88 Sets His Next Price Target
$XRP As noted by market expert Dark Defender, the XRP price has completed Wave 4 in its Elliot Wave pattern and is poised to soar over 200% from here.
The XRP price is on the cusp of a significant movement, as the token has completed Wave 4 in its Elliot Wave pattern. As the altcoin continues to advance in line with predictions, market experts like Dark Defender set sights on a new target of $5.85 in Wave 5, an over 207% rise from the current price.
✨Bear Market Hasn’t Yet Started
In a recent X post, crypto analyst Dark Defender shared his bullish perspectives on the XRP token. The analyst utilized Elliott Wave theory, asserting that XRP will achieve a new peak in this cycle.
Notably, Dark Defender has been tracking the Wave 4 since February 13, 2025. Based on his analysis, the token completed Wave A at $1.60 in April and Wave B at $3.66 in July. The analyst marked $1.88 as the completion point of Wave C of the Monthly Wave 4, which is now technically confirmed as done.
Dark Defender noted that he stayed calm during XRP’s price movements, identifying a key support zone between $2.2222 and $1.8815. While XRP dropped to this level, it managed to bounce back, completing Wave C of Wave 4 at $1.88.
✨Ignore FUD
In his previous analysis in February, Dark Defender urged investors and traders to ignore FUD (Fear, Uncertainty, Doubt) and instead focus on the potential developments. He presented a technical analysis chart for the XRP/USD pair, outlining its long-term projection based on historical market cycles and technical indicators.
Using the Elliot Wave theory and Fibonacci levels, the expert identified the key support around $1.88, which has been tested and held firm during market corrections. According to his analysis, Waves 1 to 3 show a clear impulsive structure.
Building on this momentum, Wave 4 has also unfolded as a healthy corrective phase, retracing toward the $1.90–$2.00 zone in line with the 70.2% Fibonacci level. During this phase, the XRP price managed to stay above critical structural support and preserve the broader bullish trend.
Currently, XRP is experiencing high volatility. At the time of writing, the crypto token trades for $1.88, down 5.6% in a day. This negative momentum is further bolstered by its weekly and monthly declines, having dropped 8% in a week and 16% in a month.
🚀🚀🚀 FOLLOW BE_MASTER BUY_SMART 💰💰💰
Appreciate the work. 😍 Thank You. 👍 FOLLOW BeMaster BuySmart 🚀 TO FIND OUT MORE $$$$$ 🤩 BE MASTER BUY SMART 💰🤩
🚀🚀🚀 PLEASE CLICK FOLLOW BE MASTER BUY SMART - Thank You.
$BTC
$XRP
#USNonFarmPayrollReport #USJobsData #BTCVSGOLD #CPIWatch #TrumpTariffs
The XRP price is on the cusp of a significant movement, as the token has completed Wave 4 in its Elliot Wave pattern. As the altcoin continues to advance in line with predictions, market experts like Dark Defender set sights on a new target of $5.85 in Wave 5, an over 207% rise from the current price.
✨Bear Market Hasn’t Yet Started
In a recent X post, crypto analyst Dark Defender shared his bullish perspectives on the XRP token. The analyst utilized Elliott Wave theory, asserting that XRP will achieve a new peak in this cycle.
Notably, Dark Defender has been tracking the Wave 4 since February 13, 2025. Based on his analysis, the token completed Wave A at $1.60 in April and Wave B at $3.66 in July. The analyst marked $1.88 as the completion point of Wave C of the Monthly Wave 4, which is now technically confirmed as done.
Dark Defender noted that he stayed calm during XRP’s price movements, identifying a key support zone between $2.2222 and $1.8815. While XRP dropped to this level, it managed to bounce back, completing Wave C of Wave 4 at $1.88.
✨Ignore FUD
In his previous analysis in February, Dark Defender urged investors and traders to ignore FUD (Fear, Uncertainty, Doubt) and instead focus on the potential developments. He presented a technical analysis chart for the XRP/USD pair, outlining its long-term projection based on historical market cycles and technical indicators.
Using the Elliot Wave theory and Fibonacci levels, the expert identified the key support around $1.88, which has been tested and held firm during market corrections. According to his analysis, Waves 1 to 3 show a clear impulsive structure.
Building on this momentum, Wave 4 has also unfolded as a healthy corrective phase, retracing toward the $1.90–$2.00 zone in line with the 70.2% Fibonacci level. During this phase, the XRP price managed to stay above critical structural support and preserve the broader bullish trend.
Currently, XRP is experiencing high volatility. At the time of writing, the crypto token trades for $1.88, down 5.6% in a day. This negative momentum is further bolstered by its weekly and monthly declines, having dropped 8% in a week and 16% in a month.
🚀🚀🚀 FOLLOW BE_MASTER BUY_SMART 💰💰💰
Appreciate the work. 😍 Thank You. 👍 FOLLOW BeMaster BuySmart 🚀 TO FIND OUT MORE $$$$$ 🤩 BE MASTER BUY SMART 💰🤩
🚀🚀🚀 PLEASE CLICK FOLLOW BE MASTER BUY SMART - Thank You.
$BTC
$XRP
#USNonFarmPayrollReport #USJobsData #BTCVSGOLD #CPIWatch #TrumpTariffs
1
·
--
Voir la traduction
Japan could shake the global market on 19 December 2025 📅
Guys I need just 2 minutes of your time, Listen carefully👇👇👇👇
Japan quietly supported global markets for many years… and now that support is vanashing.
Here’s what Japan was doing (in very simple words) 👇
1. For almost 30 years, Japan kept interest rates near zero.
2. That means borrowing Japanese yen was very cheap.
3. Big investors used this cheap yen like “fuel”:
Borrow yen cheaply
Convert it into dollars/other currencies
Buy stocks, bonds, and crypto
This is called the yen carry trade.
Now what has changed? ⚠️
Japan is raising interest rates (highest expected in 31 years)
Why does this matter to crypto and global markets?
Because when borrowing yen becomes expensive… the opposite happens 👇
1. Investors borrow less money
2. Many investors reduce risky positions
3. Some will sell assets (including crypto) to pay back yen loans
4. That means liquidity can leave the market
And when liquidity leaves, markets feel pressure.
That’s why 19 December is important.
If Japan hikes rates, we can see a strong move downward in crypto too.
We’ve seen this pattern before 📉
March 2024: Japan hike → BTC dropped about 23%
July 2024: Japan hike → BTC dropped about 26%
January 2025: Japan hike → BTC dropped about 31%
So my pandas , trade carefully 🙏
Volatility around 19 December can be huge. If the interest rates hike up and BTC is expected to dump to 70k
Also remember: PandaTraders warned about the last drop before hand
We called the crash from 90K, and BTC dumped to 85K, hitting our targets ✅
As usual Panda Traders is monitoring the market 24/7 for you guys and maintains the legacy of informing you before every major crash and every big pump‼️
Once we get confirmation, we will look to short BTC on 19th december
Keep Following Panda Traders for daily BTC updates and crash alerts ✅
$BTC $XRP $SOL
{spot}(SOLUSDT)
{spot}(BTCUSDT)
{spot}(XRPUSDT)
#USNonFarmPayrollReport #TrumpTariffs #WriteToEarnUpgrade #BTCVSGOLD #BinanceBlockchainWeek
Japan could shake the global market on 19 December 2025 📅
Guys I need just 2 minutes of your time, Listen carefully👇👇👇👇
Japan quietly supported global markets for many years… and now that support is vanashing.
Here’s what Japan was doing (in very simple words) 👇
1. For almost 30 years, Japan kept interest rates near zero.
2. That means borrowing Japanese yen was very cheap.
3. Big investors used this cheap yen like “fuel”:
Borrow yen cheaply
Convert it into dollars/other currencies
Buy stocks, bonds, and crypto
This is called the yen carry trade.
Now what has changed? ⚠️
Japan is raising interest rates (highest expected in 31 years)
Why does this matter to crypto and global markets?
Because when borrowing yen becomes expensive… the opposite happens 👇
1. Investors borrow less money
2. Many investors reduce risky positions
3. Some will sell assets (including crypto) to pay back yen loans
4. That means liquidity can leave the market
And when liquidity leaves, markets feel pressure.
That’s why 19 December is important.
If Japan hikes rates, we can see a strong move downward in crypto too.
We’ve seen this pattern before 📉
March 2024: Japan hike → BTC dropped about 23%
July 2024: Japan hike → BTC dropped about 26%
January 2025: Japan hike → BTC dropped about 31%
So my pandas , trade carefully 🙏
Volatility around 19 December can be huge. If the interest rates hike up and BTC is expected to dump to 70k
Also remember: PandaTraders warned about the last drop before hand
We called the crash from 90K, and BTC dumped to 85K, hitting our targets ✅
As usual Panda Traders is monitoring the market 24/7 for you guys and maintains the legacy of informing you before every major crash and every big pump‼️
Once we get confirmation, we will look to short BTC on 19th december
Keep Following Panda Traders for daily BTC updates and crash alerts ✅
$BTC $XRP $SOL
#USNonFarmPayrollReport #TrumpTariffs #WriteToEarnUpgrade #BTCVSGOLD #BinanceBlockchainWeek
Guys I need just 2 minutes of your time, Listen carefully👇👇👇👇
Japan quietly supported global markets for many years… and now that support is vanashing.
Here’s what Japan was doing (in very simple words) 👇
1. For almost 30 years, Japan kept interest rates near zero.
2. That means borrowing Japanese yen was very cheap.
3. Big investors used this cheap yen like “fuel”:
Borrow yen cheaply
Convert it into dollars/other currencies
Buy stocks, bonds, and crypto
This is called the yen carry trade.
Now what has changed? ⚠️
Japan is raising interest rates (highest expected in 31 years)
Why does this matter to crypto and global markets?
Because when borrowing yen becomes expensive… the opposite happens 👇
1. Investors borrow less money
2. Many investors reduce risky positions
3. Some will sell assets (including crypto) to pay back yen loans
4. That means liquidity can leave the market
And when liquidity leaves, markets feel pressure.
That’s why 19 December is important.
If Japan hikes rates, we can see a strong move downward in crypto too.
We’ve seen this pattern before 📉
March 2024: Japan hike → BTC dropped about 23%
July 2024: Japan hike → BTC dropped about 26%
January 2025: Japan hike → BTC dropped about 31%
So my pandas , trade carefully 🙏
Volatility around 19 December can be huge. If the interest rates hike up and BTC is expected to dump to 70k
Also remember: PandaTraders warned about the last drop before hand
We called the crash from 90K, and BTC dumped to 85K, hitting our targets ✅
As usual Panda Traders is monitoring the market 24/7 for you guys and maintains the legacy of informing you before every major crash and every big pump‼️
Once we get confirmation, we will look to short BTC on 19th december
Keep Following Panda Traders for daily BTC updates and crash alerts ✅
$BTC $XRP $SOL
#USNonFarmPayrollReport #TrumpTariffs #WriteToEarnUpgrade #BTCVSGOLD #BinanceBlockchainWeek

1
·
--
Voir la traduction
Btc $BTC – Latest Market Analysis
Current Trend:
Bitcoin is trading in a consolidation phase, moving sideways after a strong bullish rally earlier. The price is holding above key support, which shows that long-term buyers are still active.
Market Structure:
Support Zone: $88,000 – $90,000
Resistance Zone: $98,000 – $100,000
Volume is moderate, suggesting traders are waiting for a clear breakout direction.
Technical Outlook:
As long as BTC stays above support, the trend remains bullish-neutral.
A breakout above $100K could trigger strong upside momentum.
If support breaks, a short-term correction toward $85K is possible.
Sentiment:
Market sentiment is mixed but stable. Institutional interest and long-term holding continue to support Bitcoin’s price.
---
📈 Simple Price Chart (Illustration)
Price
100K ┤ ▲
98K ┤ ▲ │ Resistance
95K ┤ ▲ │
92K ┤ ▲ │
90K ┼────▲───────┼── Support
88K ┤ ▲
└────────────────── Time
{spot}(BTCUSDT)
#TrumpTariffs #WriteToEarnUpgrade #USJobsData #BinanceBlockchainWeek #BTCVSGOLD
Btc
$BTC – Latest Market Analysis
Current Trend:
Bitcoin is trading in a consolidation phase, moving sideways after a strong bullish rally earlier. The price is holding above key support, which shows that long-term buyers are still active.
Market Structure:
Support Zone: $88,000 – $90,000
Resistance Zone: $98,000 – $100,000
Volume is moderate, suggesting traders are waiting for a clear breakout direction.
Technical Outlook:
As long as BTC stays above support, the trend remains bullish-neutral.
A breakout above $100K could trigger strong upside momentum.
If support breaks, a short-term correction toward $85K is possible.
Sentiment:
Market sentiment is mixed but stable. Institutional interest and long-term holding continue to support Bitcoin’s price.
---
📈 Simple Price Chart (Illustration)
Price
100K ┤ ▲
98K ┤ ▲ │ Resistance
95K ┤ ▲ │
92K ┤ ▲ │
90K ┼────▲───────┼── Support
88K ┤ ▲
└────────────────── Time
#TrumpTariffs #WriteToEarnUpgrade #USJobsData #BinanceBlockchainWeek #BTCVSGOLD
Current Trend:
Bitcoin is trading in a consolidation phase, moving sideways after a strong bullish rally earlier. The price is holding above key support, which shows that long-term buyers are still active.
Market Structure:
Support Zone: $88,000 – $90,000
Resistance Zone: $98,000 – $100,000
Volume is moderate, suggesting traders are waiting for a clear breakout direction.
Technical Outlook:
As long as BTC stays above support, the trend remains bullish-neutral.
A breakout above $100K could trigger strong upside momentum.
If support breaks, a short-term correction toward $85K is possible.
Sentiment:
Market sentiment is mixed but stable. Institutional interest and long-term holding continue to support Bitcoin’s price.
---
📈 Simple Price Chart (Illustration)
Price
100K ┤ ▲
98K ┤ ▲ │ Resistance
95K ┤ ▲ │
92K ┤ ▲ │
90K ┼────▲───────┼── Support
88K ┤ ▲
└────────────────── Time
#TrumpTariffs #WriteToEarnUpgrade #USJobsData #BinanceBlockchainWeek #BTCVSGOLD
7
7
Connectez-vous pour découvrir plus de contenu
Rejoignez la communauté mondiale des adeptes de cryptomonnaies sur Binance Square
⚡️ Suviez les dernières informations importantes sur les cryptomonnaies.
💬 Jugé digne de confiance par la plus grande plateforme d’échange de cryptomonnaies au monde.
👍 Découvrez les connaissances que partagent les créateurs vérifiés.
Adresse e-mail/Nº de téléphone
Sujets d’actualité
SaylorHintsStrategyBitcoinBuy
2.2M vues
11,574 mentions
#saylorhintsstrategybitcoinbuy
Michael Saylor vient de lâcher un autre teaser de “Bitcoin Tracker” avec « une touche d’orange. » Vous savez ce que ça veut dire : MicroStrategy est sur le point de révéler demain un nouvel achat massif, et la toile s’enflamme avec #saylorhintsstrategybitcoinbuy ! 🚀
Pendant ce temps, les traders particuliers appliquent la philosophie ultime de business à l’ère du numérique : « Acheter Haut, Vendre Bas ! » 📉 Vraiment un chef-d’œuvre de comédie financière. Comment fait-on un bénéfice ? Facile, on n’en fait pas ! Il suffit de le trader pour un maximum d’adrénaline et une angoisse existentielle pure, tout en confiant ses sacs aux teneurs de marché.
Que devraient faire les traders ? Arrêtez de paniquer-vendre vos tokens préférés ! Respirez un bon coup, étudiez les graphiques, et peut-être arrêtez de jouer au Robin des Bois inversé.
Cliquez giao dịch bên dưới pour me soutenir.
$BTC
$ONE
$CELR
Alpha H U N T E R
·0 mentions J’aime
·115 vues
BOJRaisesRatesTo31YearHigh
188,808 vues
2,783 mentions
BuffettStepsDownAsBerkshireChairman
91,716 vues
1,445 mentions