Last updated: 3 June 2024
What is Binance Trading Insight?
Trading Insight (previously known as ‘My Portfolio Insight’) is a useful tool designed to enhance the crypto trading experience on Binance.
Trading Insight can help make informed trading decisions, based on a combination of:
- Historical data: Each trading signal comes with detailed historical data, showing how similar signals have performed in the past.
- Multi-source signals: Signals combine data from on-chain activity, decentralized exchanges (DEXs), centralized exchanges (CEXs), and the latest crypto news for a comprehensive view.
- AI-driven insights: Advanced AI to analyze market trends and sector movements, providing you with deeper insights.
- Technical analysis alerts: Notifications on significant technical patterns to aid your market entry decisions.
Trading Insight is currently only available via the Binance app.
How to access Trading Insight?
There are 3 ways for you to access Trading Insight from the Binance app:
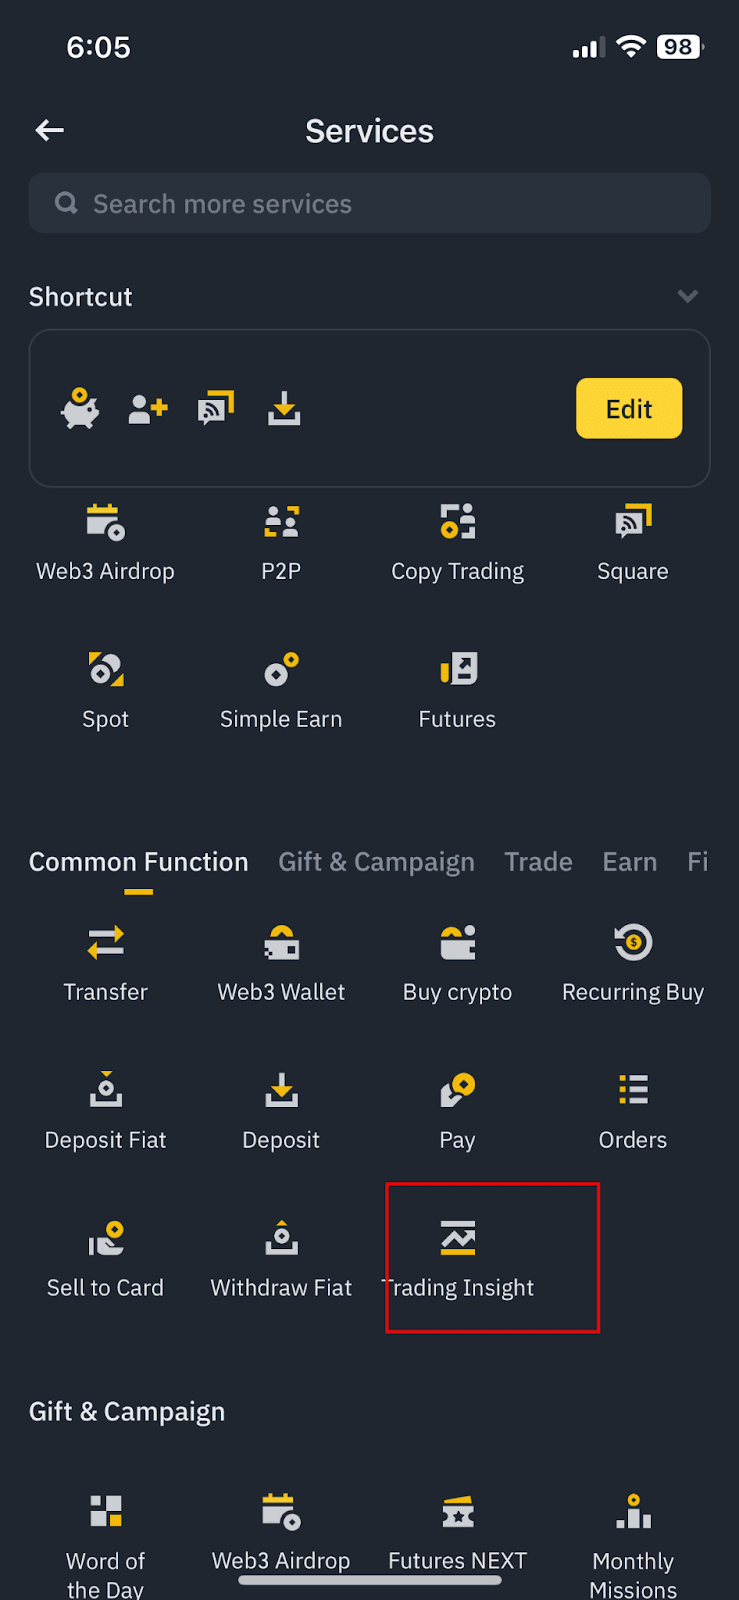
- Tap [More]. Under the [Common Function] tab, select [Trading Insight].
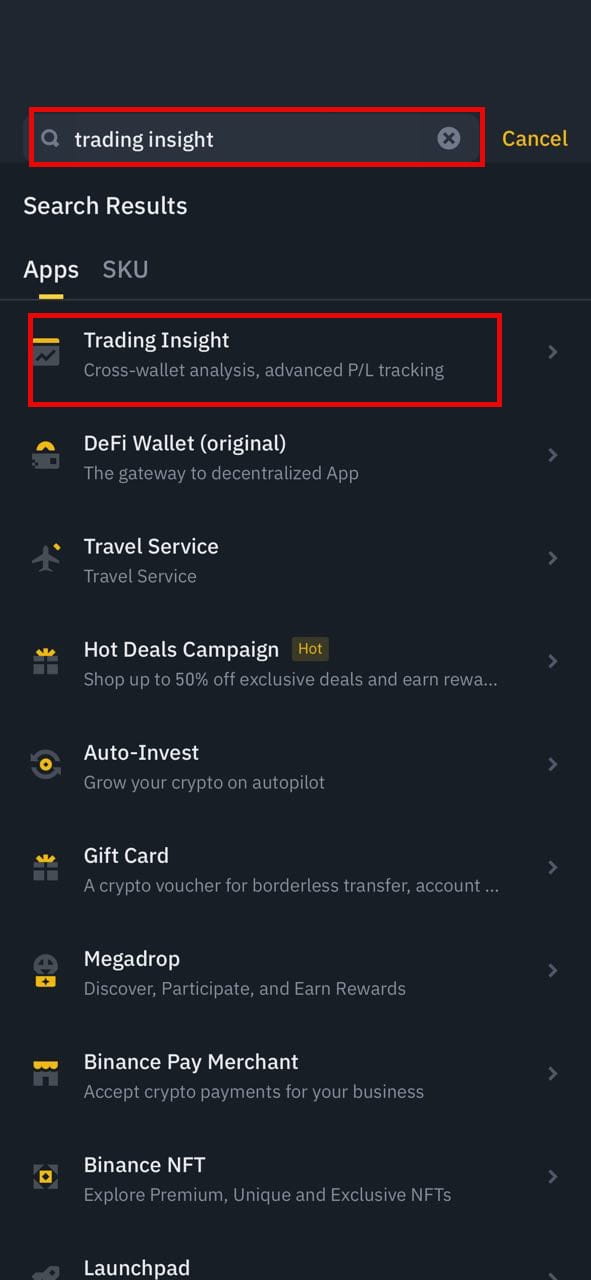
- Type "Trading Insight" in the top search bar.
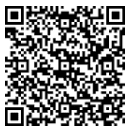
- Scan the below QR code with your mobile device to access Trading Insight directly. Please ensure you have the Binance app installed.
Click the below sections to learn about the different functionalities available on Trading Insight.
1. Sector Rotation tab
Sector Rotation is a powerful feature within Trading Insight designed to help you identify and capitalize on trending cryptocurrency sectors. By analyzing historical data and utilizing AI, Sector Rotation highlights sectors that are showing strong momentum and potential for growth.
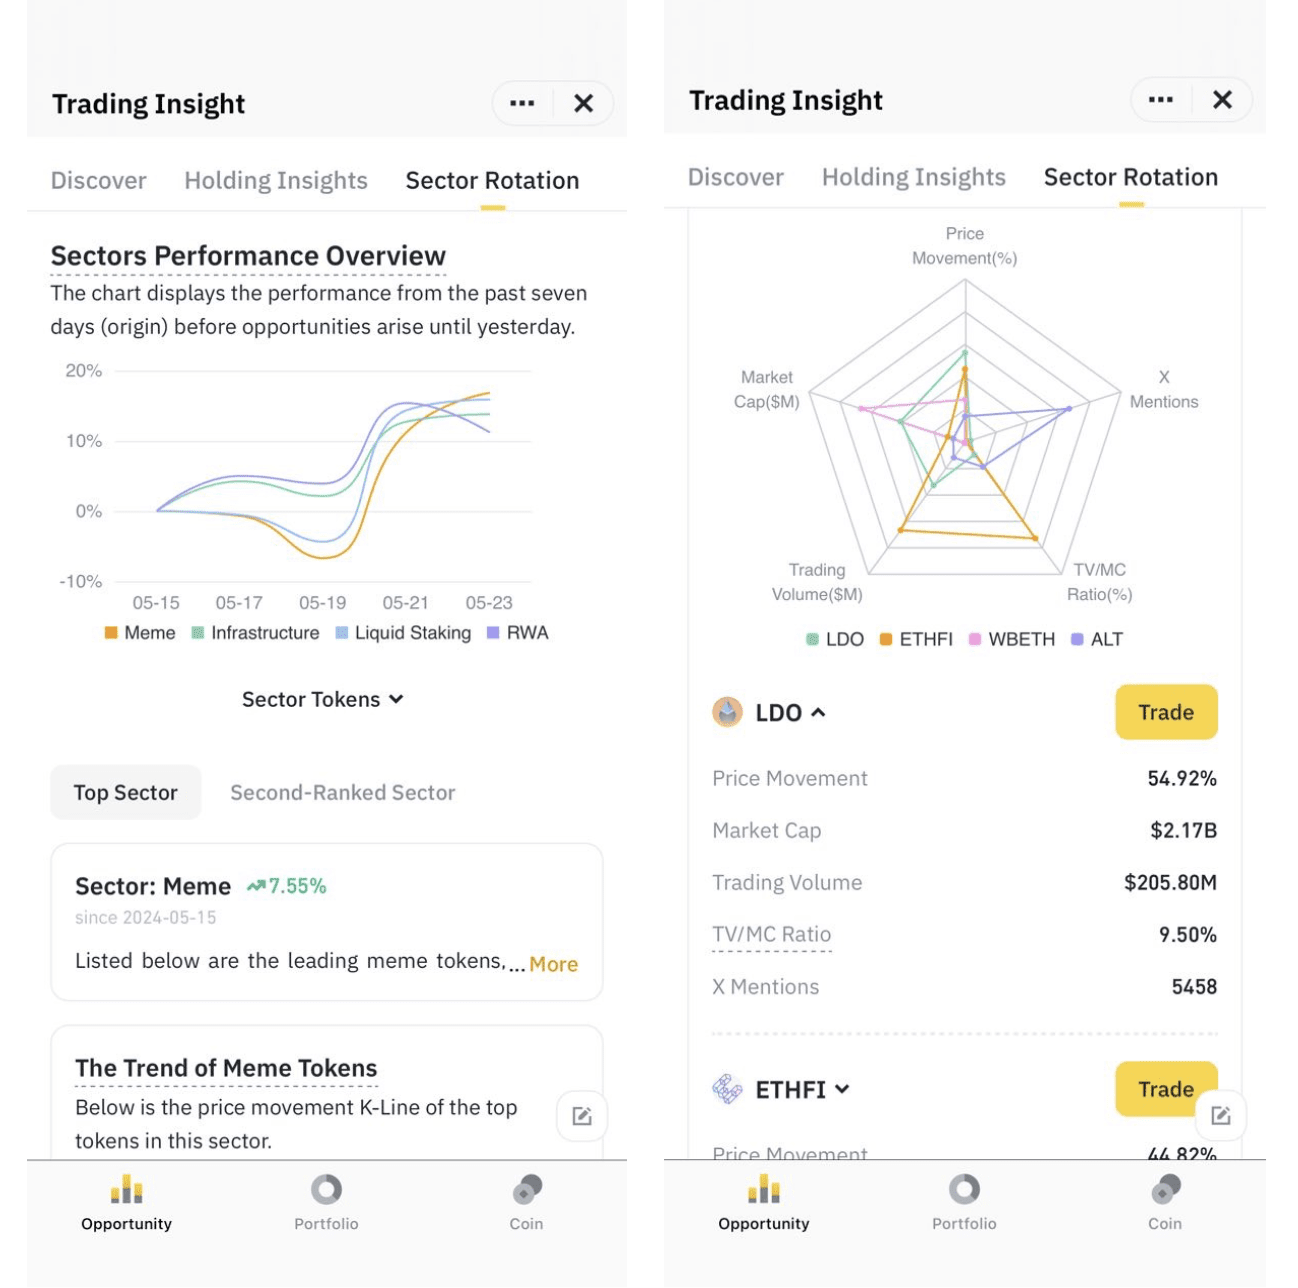
How Sector Rotation works:
- Sector identification: Using AI and big data analysis to examine price patterns, sector rotation groups cryptocurrencies that have historically moved together or had clear correlation to one another in price fluctuations (e.g., DeFi, NFTs, Layer 1 blockchains).
- Sector activation: When a sector's overall price increases by 10% or more, or when a significant gap emerges between leading and lagging sectors, the sector is considered "activated."
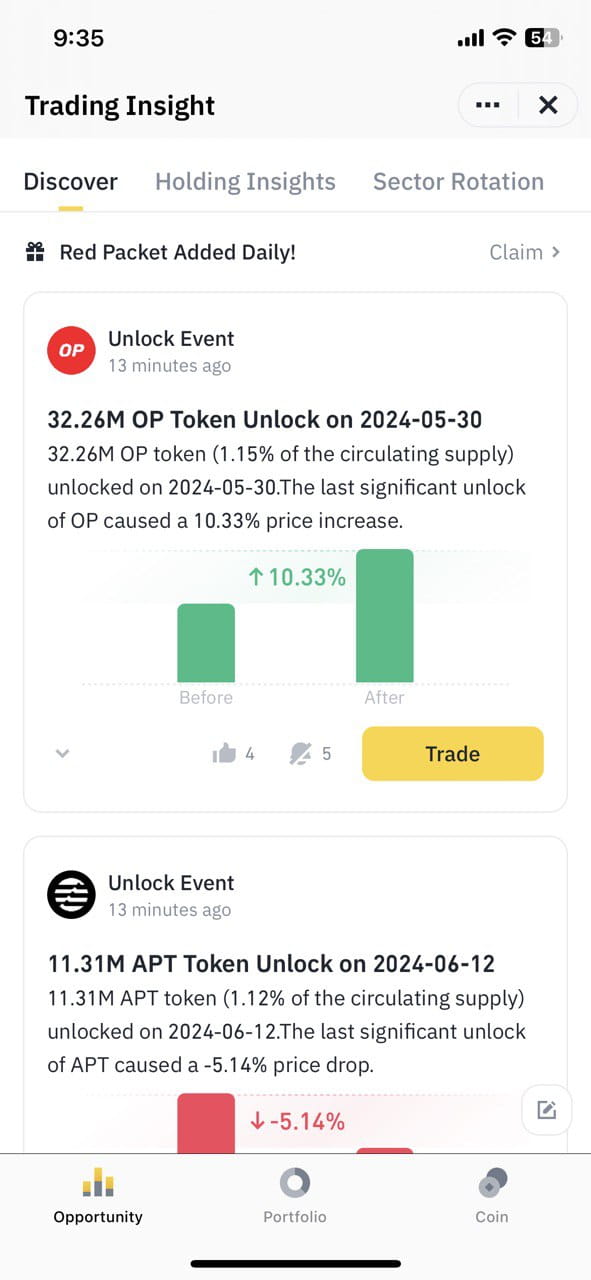
- Actionable insights: Once activated, Sector Rotation displays the sector's price performance over the past 7 days and provides trading signals in the [Discover] section. You can explore these signals to find potential opportunities within the trending sector.
Frequently Asked Questions on Sector Rotation
1. What is the purpose of Sector Rotation?
Sector Rotation helps you identify strong crypto sectors and discover potential investment opportunities within those sectors.
Sector Rotation helps you identify strong crypto sectors and discover potential investment opportunities within those sectors.
2. How is sector data determined?
Sector data is based on 6 to 12 months of historical data, AI and big data analysis to identify groups of cryptocurrencies that have shown strong correlations in their price movements.
Sector data is based on 6 to 12 months of historical data, AI and big data analysis to identify groups of cryptocurrencies that have shown strong correlations in their price movements.
3. When is a sector considered "activated"?
A sector is considered activated when its overall price increases by 10% or more, or when a significant gap emerges between leading and lagging sectors.
A sector is considered activated when its overall price increases by 10% or more, or when a significant gap emerges between leading and lagging sectors.
4. What kind of information does Sector Rotation provide?
Sector Rotation provides insights into a sector's recent price performance (past 7 days) and generates trading signals when a sector is activated.
Sector Rotation provides insights into a sector's recent price performance (past 7 days) and generates trading signals when a sector is activated.
5. What future improvements can I expect for Sector Rotation?
The Sector Rotation function is constantly being enhanced. In the future, you can expect:
The Sector Rotation function is constantly being enhanced. In the future, you can expect:
- More sectors to be added
- Price comparisons of multiple coins within each sector
- More real-time data (currently T+1) for deeper insights
2. Portfolio Insights
The [Portfolio] function in [Trading Insight] shows you an overview of your assets by wallet, including total balance, PNL and more.
How to view insights by [Portfolio] mode?
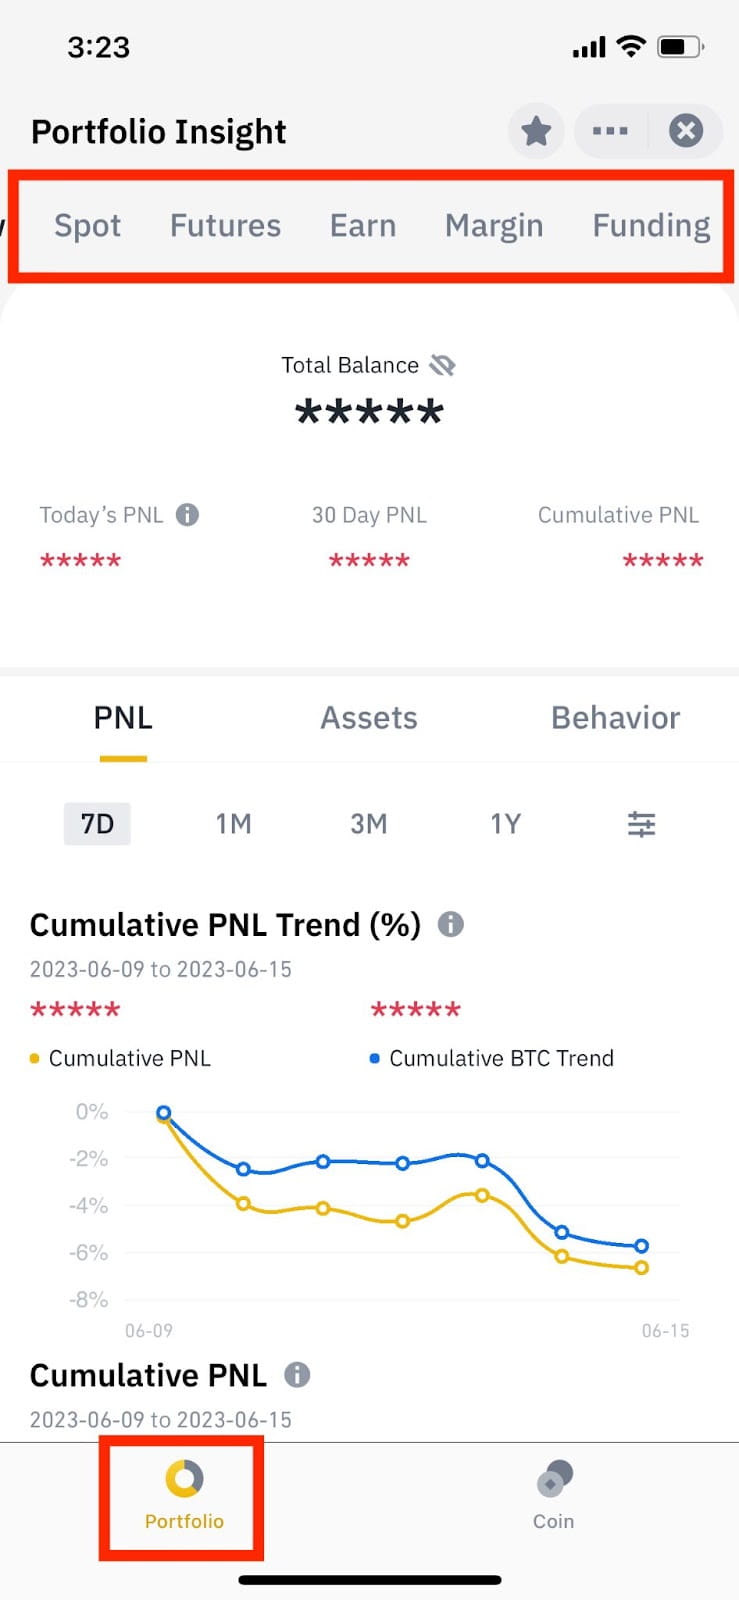
1. From the main Trading Insight screen, select the [Portfolio] tab from the bottom menu bar.
You can view your overall portfolio stats or select a wallet (Spot, Funding, Futures, Earn, Margin) on the top navigation bar to view its stats.
You can view your overall portfolio stats or select a wallet (Spot, Funding, Futures, Earn, Margin) on the top navigation bar to view its stats.
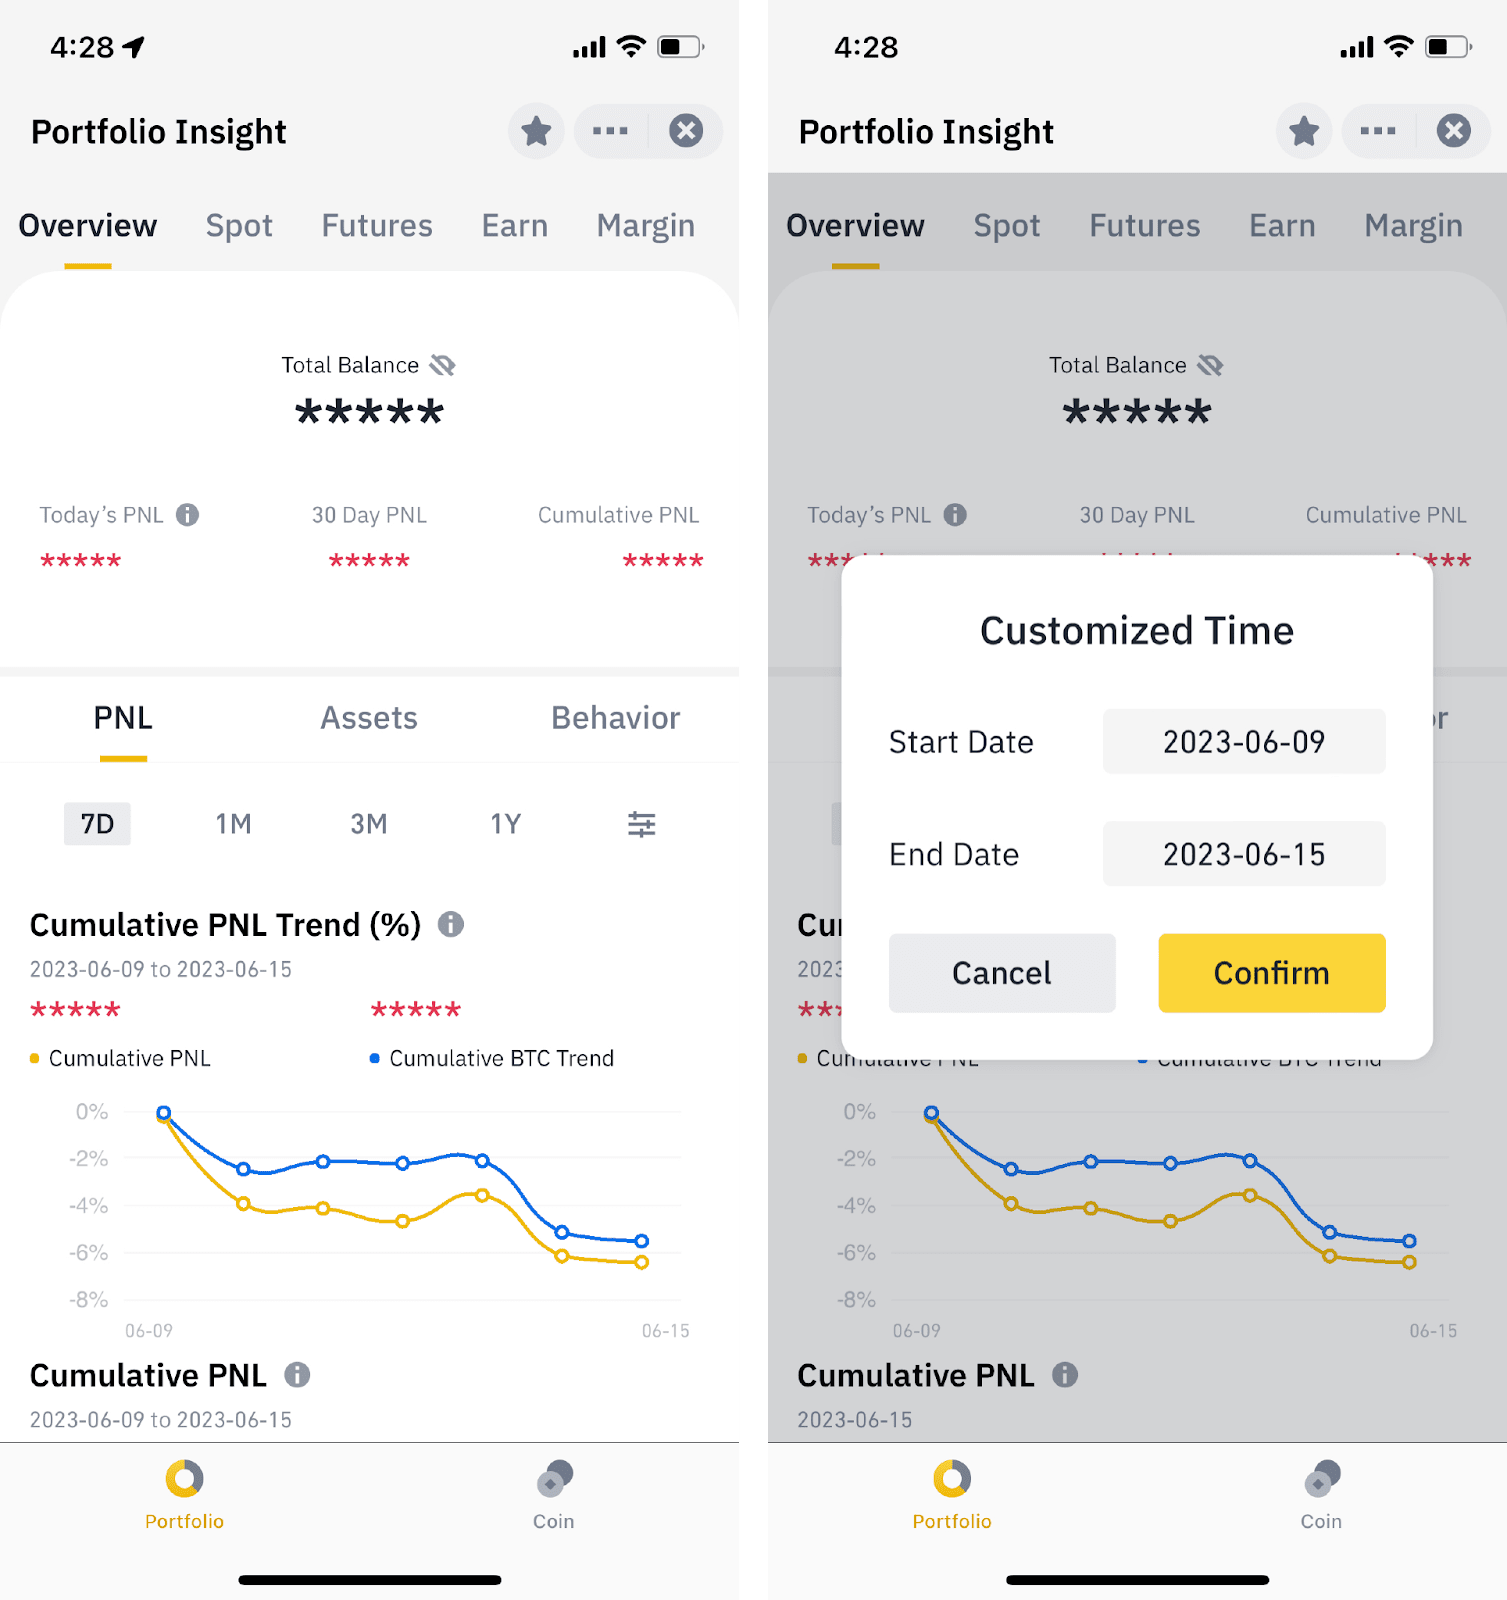
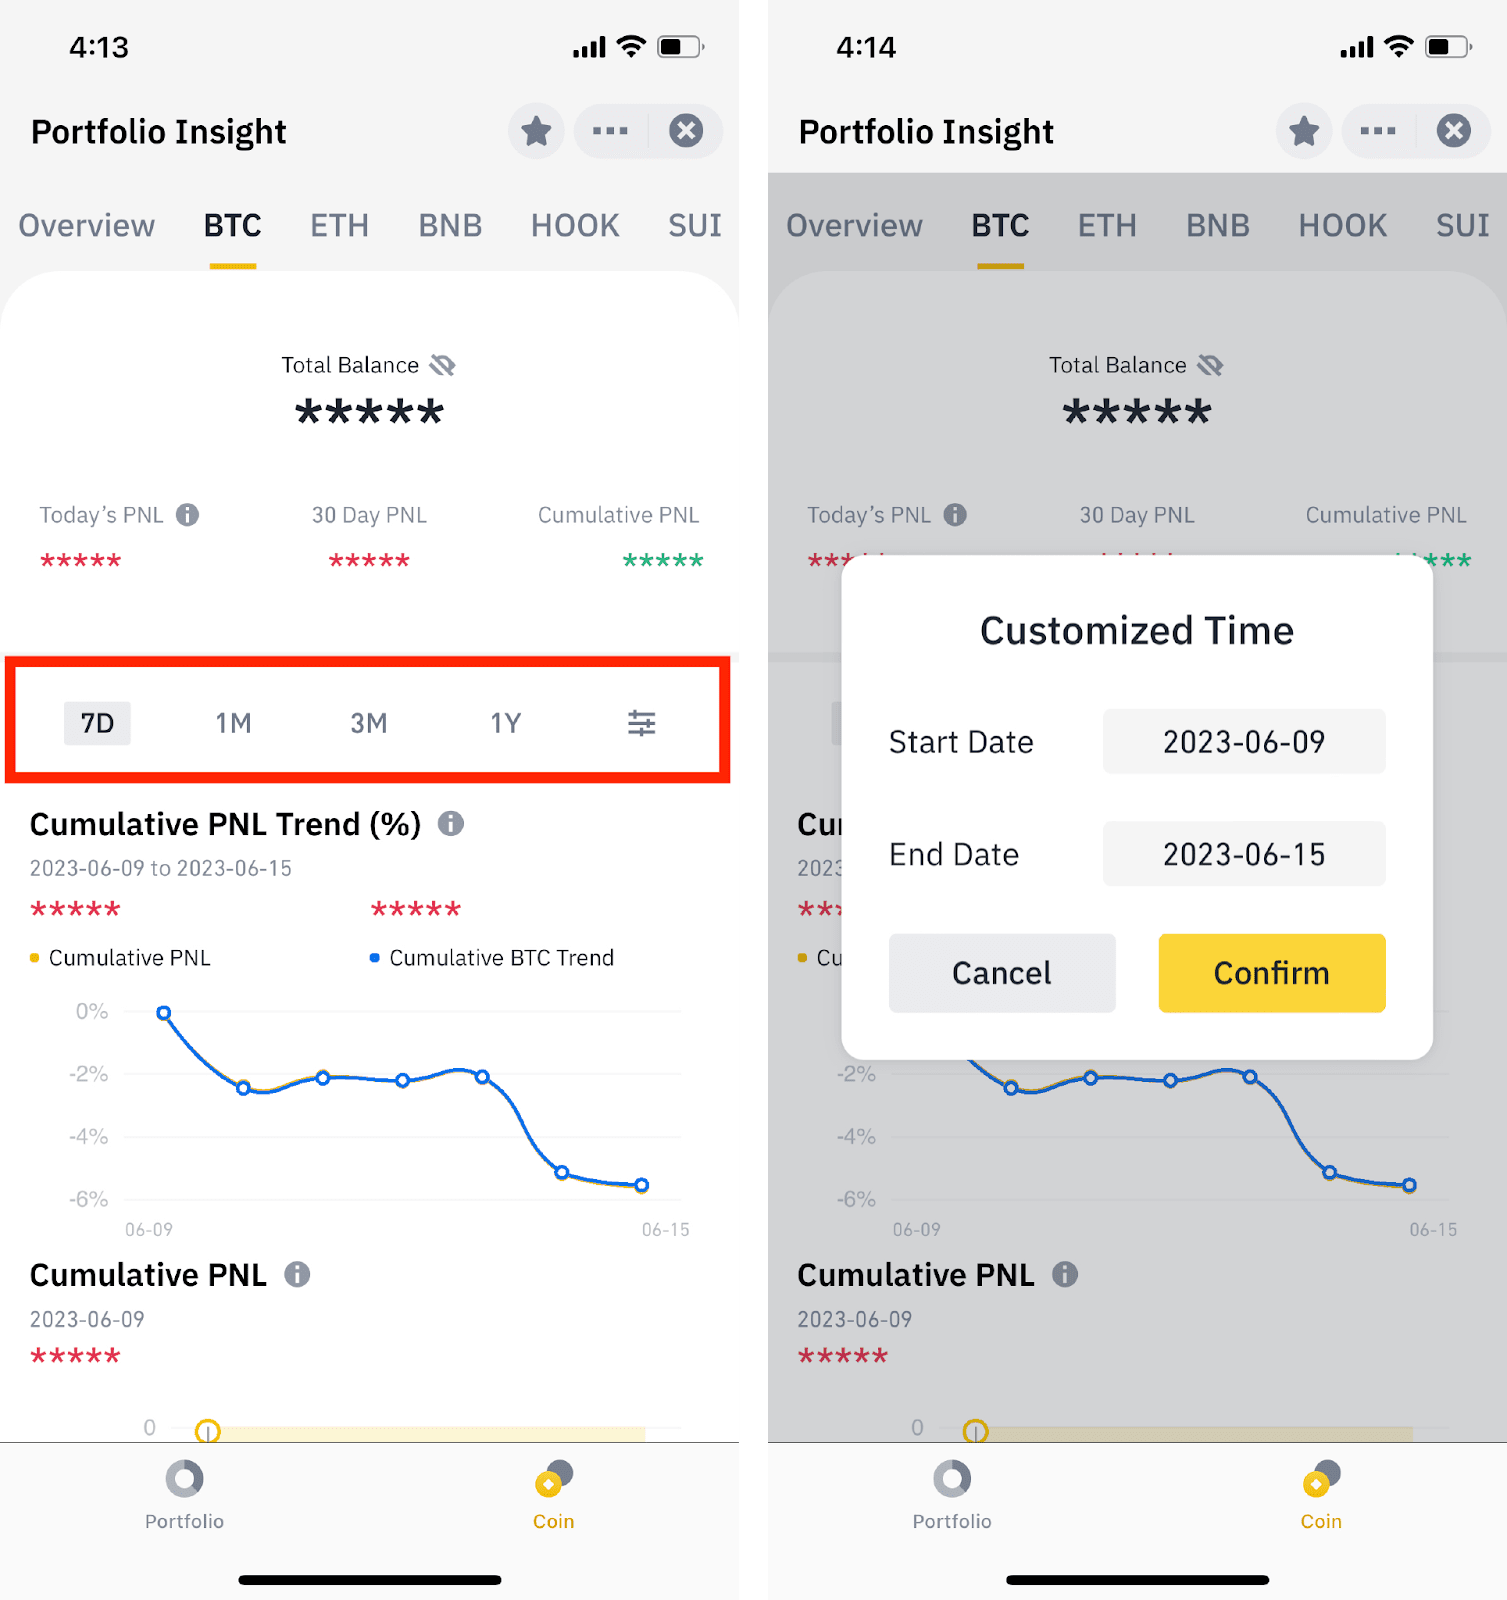
2. You can view your PNL, asset allocation, and trading activities under the [Overview] tab. Select the default ranges (7 days, 1 month, 3 months, and 1 year) or customize your preferred range to view the data.
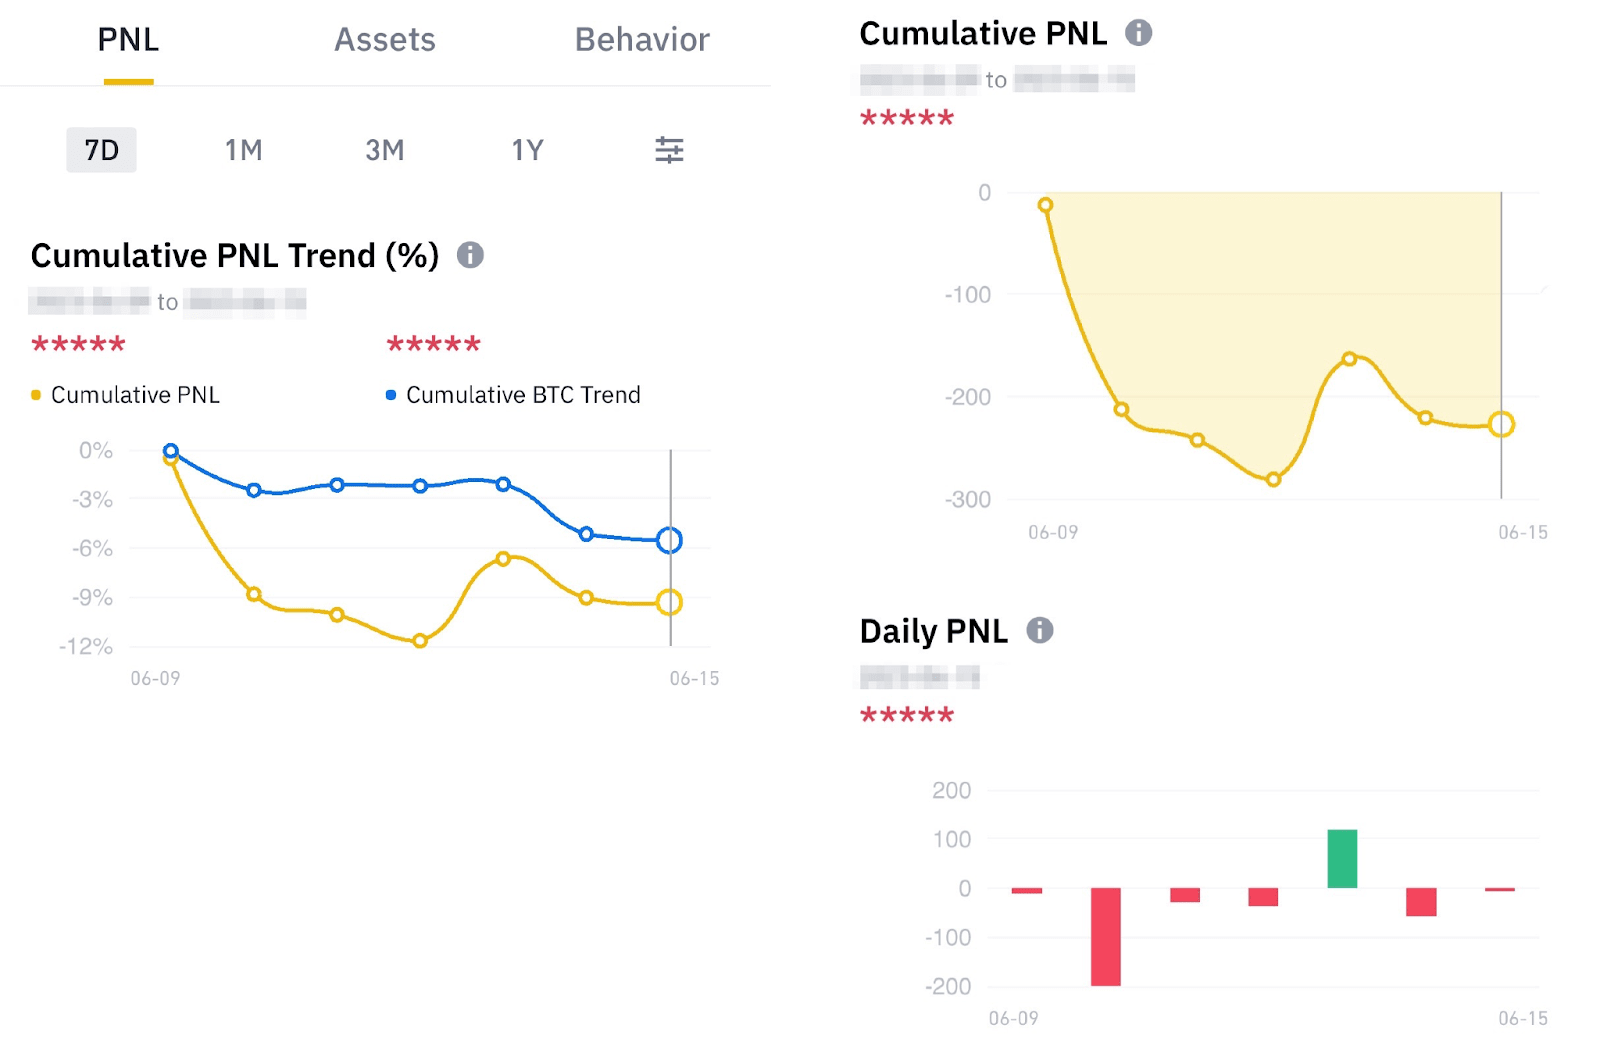
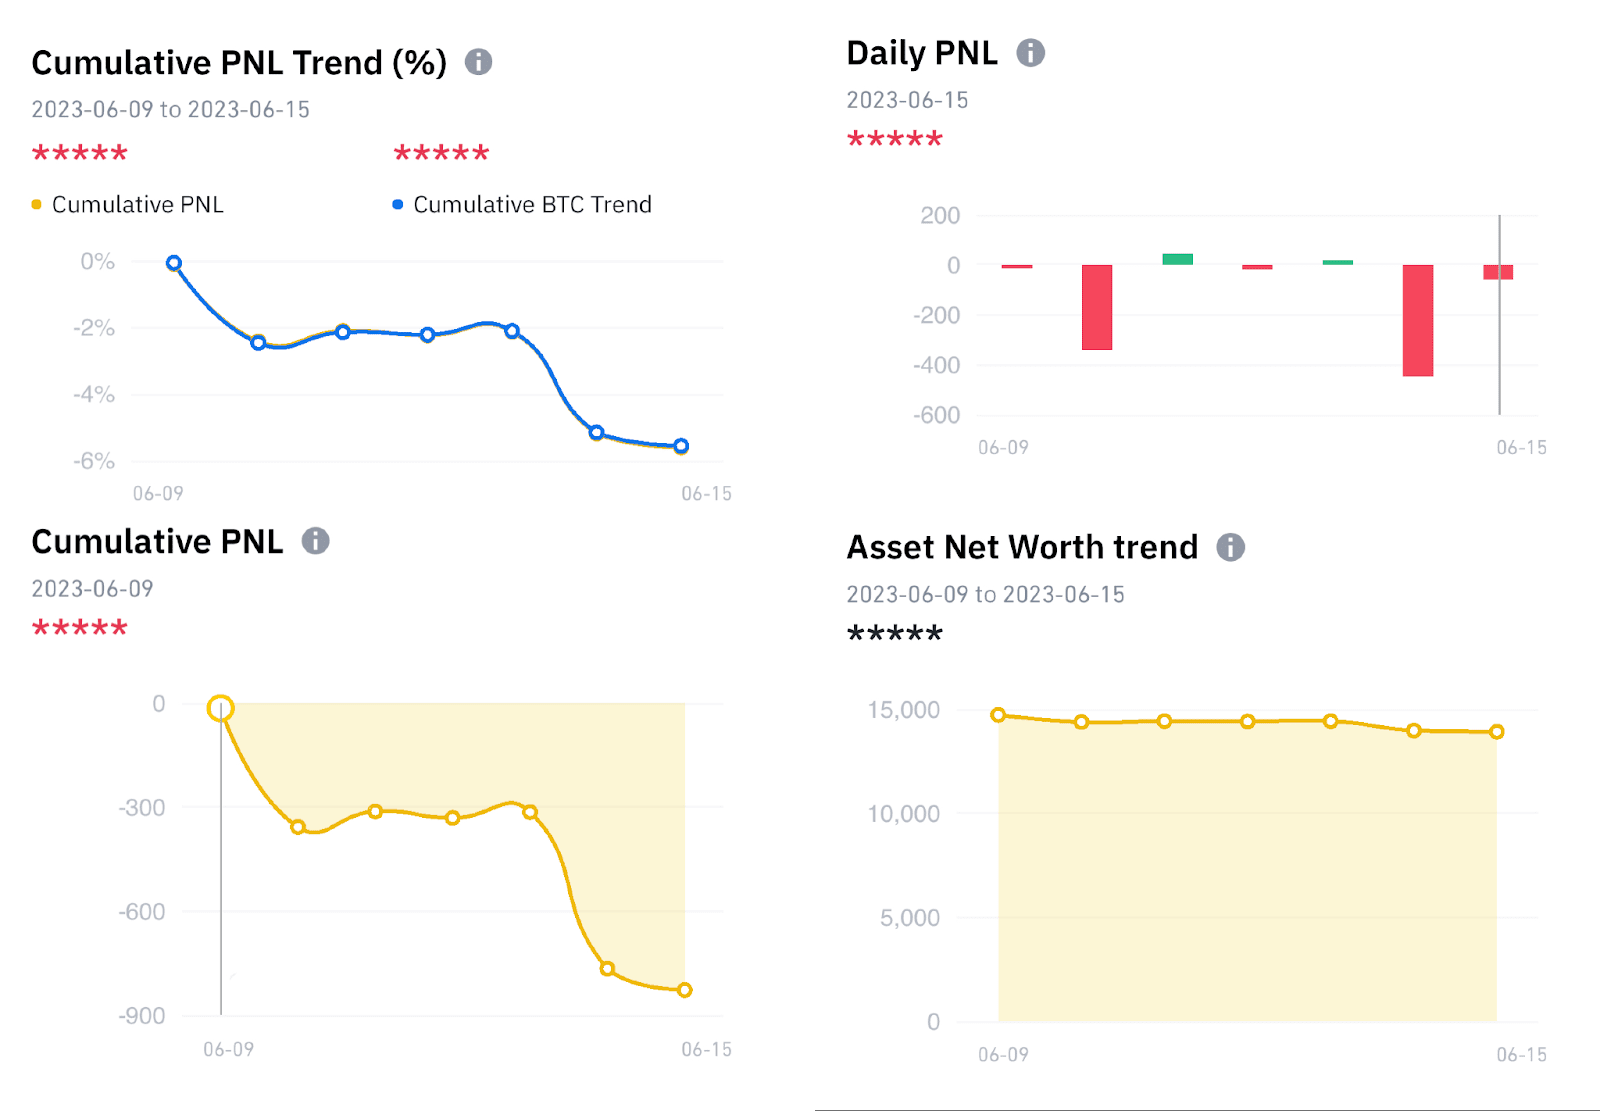
3. Under the [PNL] tab, you can view:
- Cumulative PNL Trend (%): Cumulative PNL / (Assets in Your Account from Day 1 + Average Net Transfer and Deposit from Day 1 to Day N)
- Cumulative PNL: Sum of your daily profit and loss from day 1 to day N
- Daily PNL: Current Total Assets - Initial Assets at 00:00:00 UTC - Net Transfer and Deposit Amount
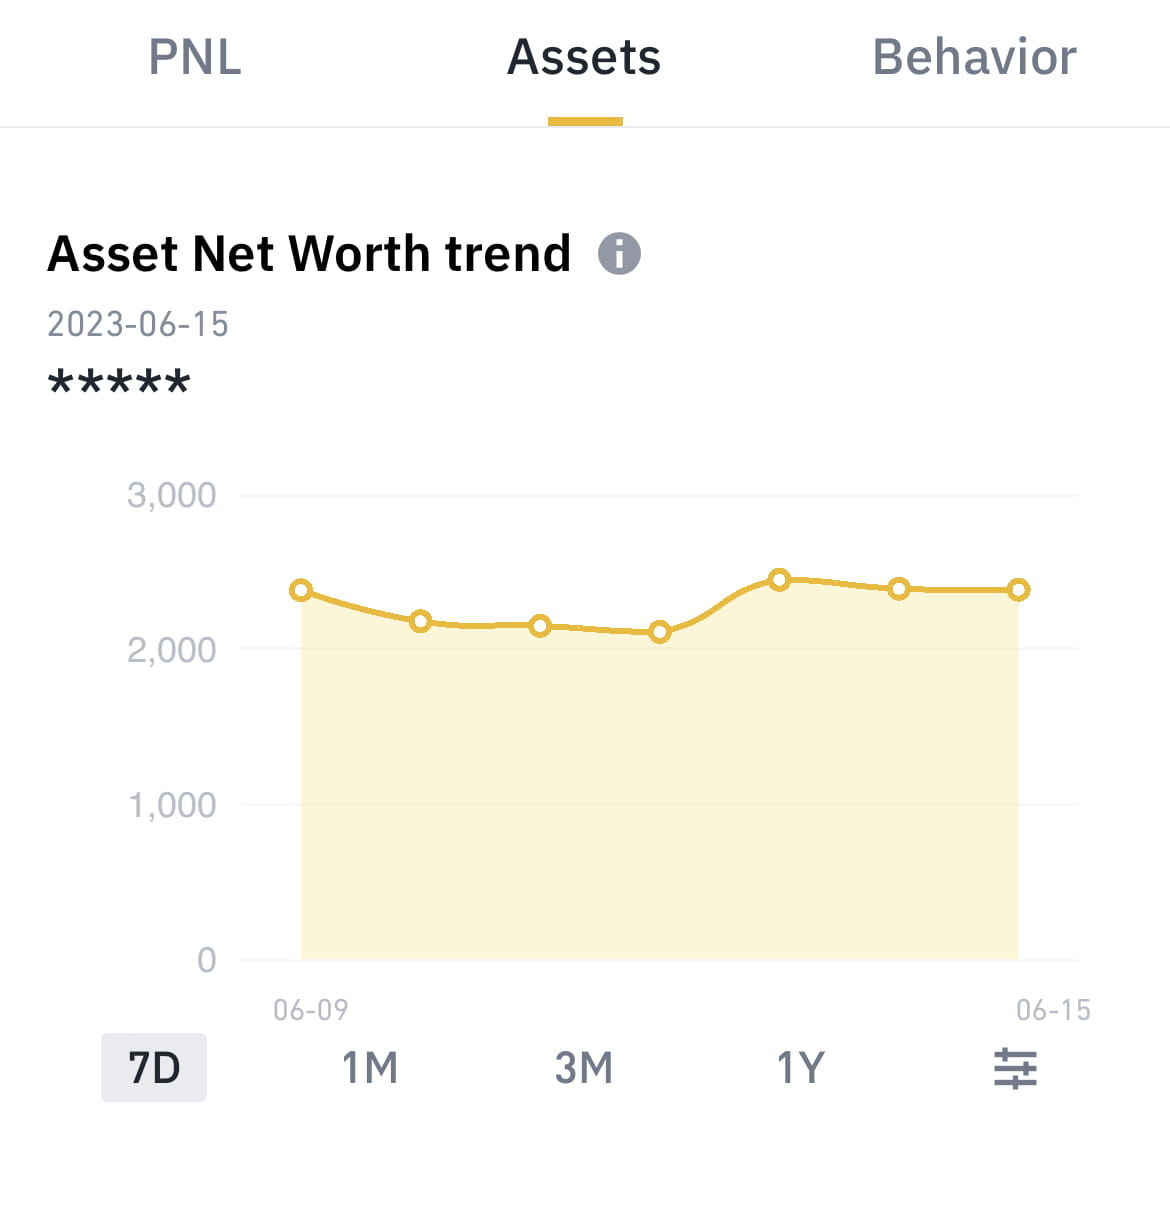
4. Under the [Assets] tab, you can view the asset net worth trend and balances of each asset you hold.
Asset Net Worth Trend = Total Net Value of All Assets from Day 1 to Day N
Asset Net Worth Trend = Total Net Value of All Assets from Day 1 to Day N
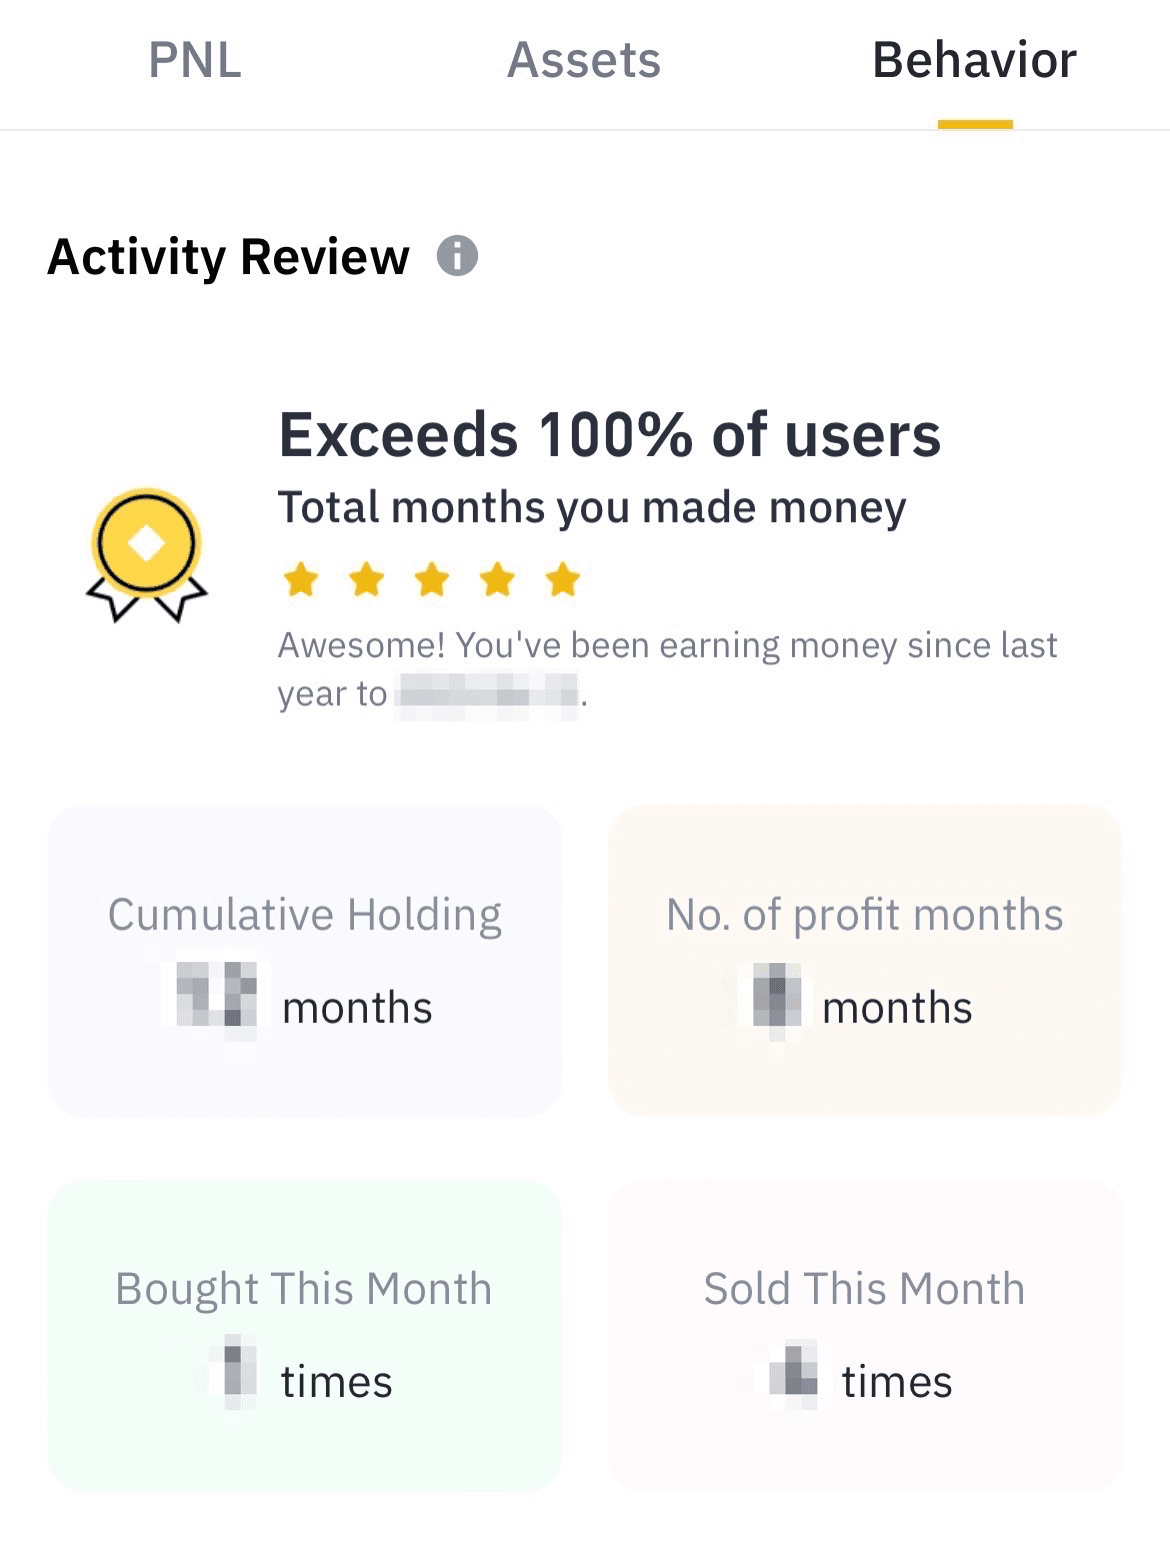
5. Under the [Behavior] tab, you can view your trading activities, including the cumulative holding months, the number of profit months, and the number of times you traded this month.
3. Coin Insights
The [Coin] function in [Trading Insight] shows you an overview per each asset you hold, including total balance, PNL and more.
How to view insights by [Coin]?
1. From the Trading Insight screen, select the [Coin] tab from the bottom menu bar.
You can view your overall asset stats or select an asset from the top navigation bar to view its stats.
You can view your overall asset stats or select an asset from the top navigation bar to view its stats.
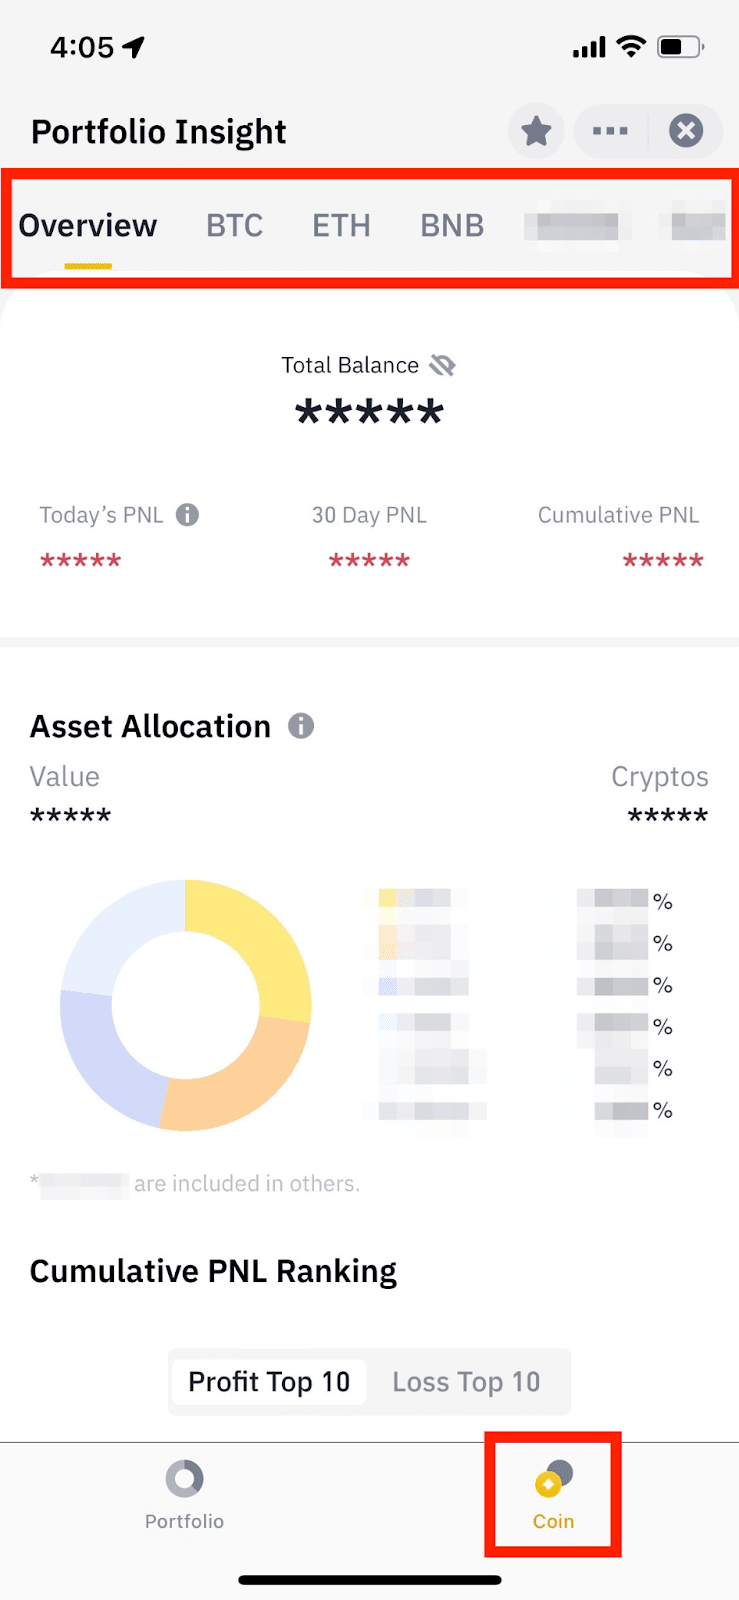
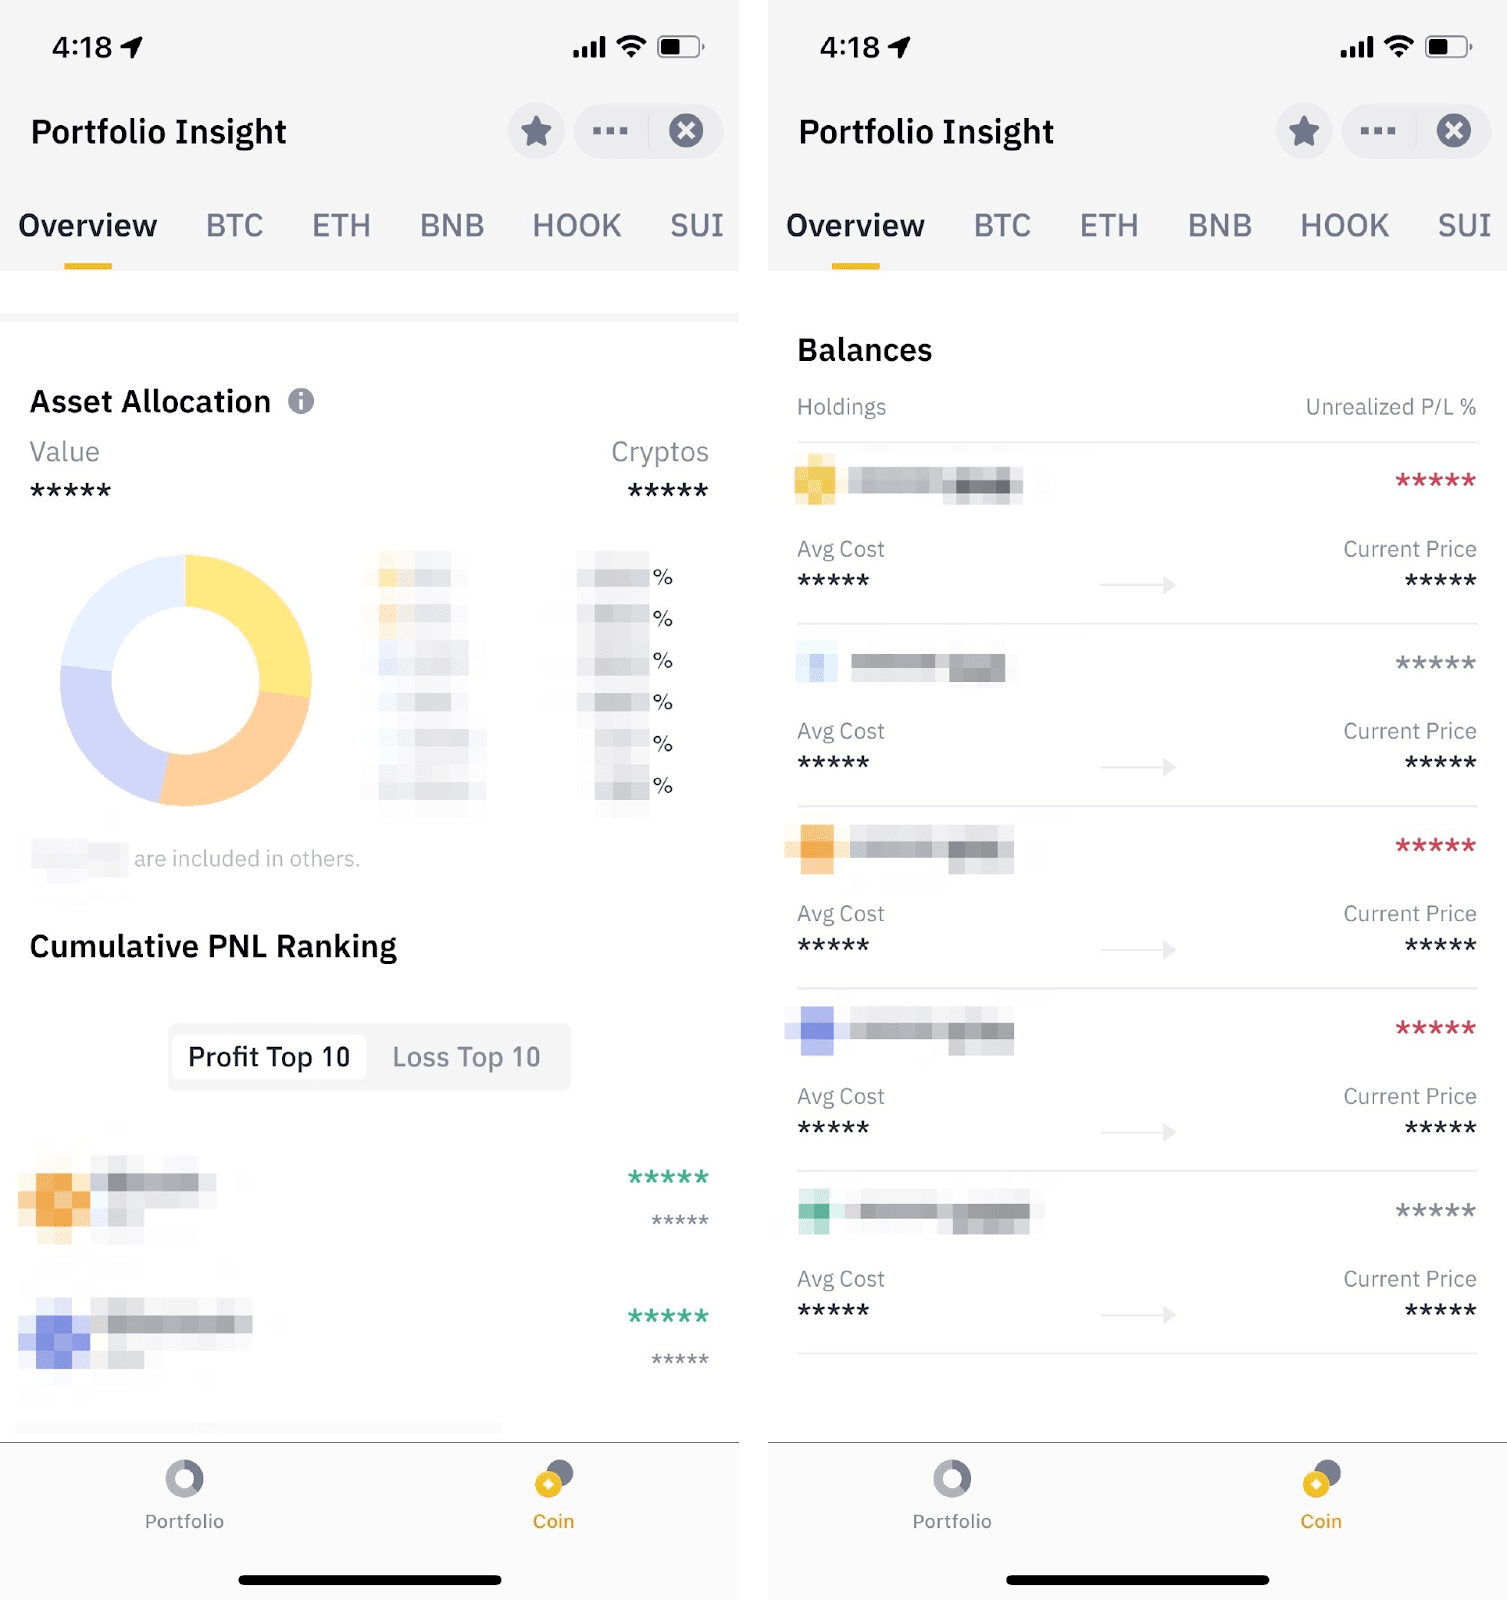
2. Under the [Overview] tab, you can view the following:
- Asset Allocation: The market value of each asset in your accounts
- Cumulative PNL Ranking: The top 10 profit and loss assets
- Balances: The balance, average cost, unrealized PNL %, and current price of each asset you hold
3. Under each asset tab, you can view the following:
- Cumulative PNL Trend (%): Cumulative PNL / (Assets in Your Account from Day 1 + Average Net Transfer and Deposit from Day 1 to Day N)
- Cumulative PNL: Sum of Your Daily Profit and Loss from Day 1 to Day N
- Daily PNL: Current Total Assets - Initial Assets at 00:00:00 UTC - Net Transfer and Deposit Amount
- Asset Net Worth trend: The Total Net Value of All Assets from Day 1 to Day N
4. Under each token’s tab, you can also select the default ranges (7 days, 1 month, 3 months, and 1 year) or customize your preferred range to view the asset’s performance.
Trackers and signals available on Trading Insight
| On-chain token activity | Track smart money movements and gain insights into the buying or selling power behind specific tokens. This can help you anticipate potential price movements. |
| Technical pattern identification | Receive alerts when significant technical patterns like head and shoulders, double tops/bottoms, or triangles form. These patterns often indicate potential trend reversals or continuations. |
| Signal overlap | Some signals may not directly lead to price changes but serve as valuable indicators of future movements. Key signal tags include price volatility, trading volume, all-time highs/lows, short-term price trends, search trends, and social sentiment. By combining these signals, you can gain a more comprehensive understanding of a token's outlook. |
| Token movements from/to Binance | Signal alert for large deposits/withdrawals from/to binance. |
| Token unlocks | Information on upcoming token unlocks and their potential impact on prices. |
| AI-powered news analysis | See the potential impact of upcoming news and events based on historical data. |
| Launchpad and Launchpool activity | Stay updated on key events. |
| Higher APR opportunities | Discover ways to optimize your existing holdings. |
To learn more about your Binance account, visit the Guide to Account Functions FAQs page.