
钱无敌1688
642 Posts

钱无敌1688
推特@yangqisniper | 前传统金融10年操盘经验|现主攻Web3 山寨合约|自研脚本监控资金异动与市场结构|寻找早期机会、高胜率交易、蹭主力车|专注分享 #AI #Web3 #美股 投资机会|偶尔抽象LSP #Binance Author:洋气 Sniper

BICO Holder
High-Frequency Trader
2.3 Years
159 Following
3.9K+ Followers
576 Liked
Posts
All
Quotes
Live
钱无敌1688
·
--
Bullish#BTC Market Analysis 9/15
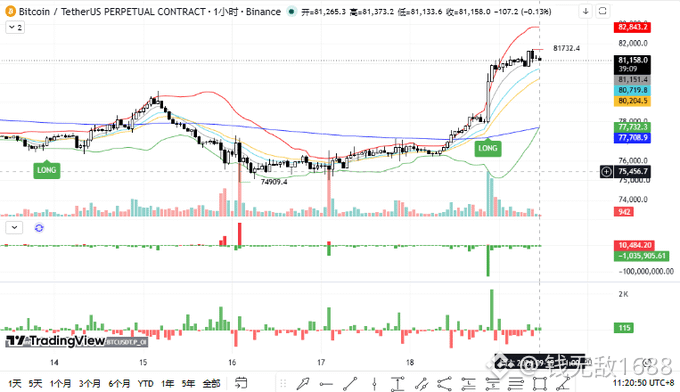
Yesterday all the long targets for the orders at 78,300–78,500 and 79,300 were completed, with the high reaching 79,570. For the new longs, the lowest only pulled back to 77,334—just 34 points away from 77,300. The market didn’t even give that extra margin of error, and didn’t offer an opportunity to get in.
Now $BTC is back around 77,900. The larger trend still leans bullish, but this move to 79,570 is mainly about squeezing out positions, not pushing a fresh long aggressively.
During the spike, OI dropped from 106.5K to 104.3K, then after the pullback it fell again to 103.1K. This suggests the shorts are getting stopped out, while longs are also taking profits at higher levels. What’s happening now is more like a leveraged squeeze followed by de-leveraging retracement—not shorts taking back control.
Today only do longs on retracements.
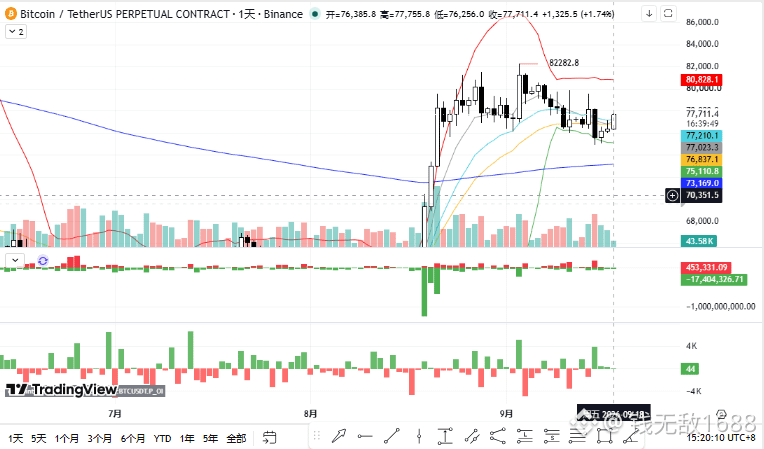
4H EMA21 is at 77,700; daily EMA21 is at 76,970. Today wait for stabilization in the 77,300–77,700 zone to go long. Stop loss: 76,400.
Targets: first look at 79,300–79,600. If it breaks through, then 80,500–81,000. If it shows strength, watch for 82,000.
Don’t chase if price is above 79,500.
Only if 4H holds above 79,600, and OI rises mildly, can it be considered a real breakout. If the 4H close breaks below 76,900, the long setup is canceled.
At 2:00 AM the day after tomorrow, the FOMC rate decision will be released. It’s easy for them to whip prices back and forth to wash leverage in advance—don’t open positions with too large a size.
Simple summary: the trend still looks bullish; buy the 77,300–77,700 zone, don’t chase above 79,500. If it breaks below 76,900, then admit the mistake.
⚠️ The above is only my personal order-book analysis and not investment advice. Manage position sizing carefully.
Yesterday all the long targets for the orders at 78,300–78,500 and 79,300 were completed, with the high reaching 79,570. For the new longs, the lowest only pulled back to 77,334—just 34 points away from 77,300. The market didn’t even give that extra margin of error, and didn’t offer an opportunity to get in.
Now $BTC is back around 77,900. The larger trend still leans bullish, but this move to 79,570 is mainly about squeezing out positions, not pushing a fresh long aggressively.
During the spike, OI dropped from 106.5K to 104.3K, then after the pullback it fell again to 103.1K. This suggests the shorts are getting stopped out, while longs are also taking profits at higher levels. What’s happening now is more like a leveraged squeeze followed by de-leveraging retracement—not shorts taking back control.
Today only do longs on retracements.
4H EMA21 is at 77,700; daily EMA21 is at 76,970. Today wait for stabilization in the 77,300–77,700 zone to go long. Stop loss: 76,400.
Targets: first look at 79,300–79,600. If it breaks through, then 80,500–81,000. If it shows strength, watch for 82,000.
Don’t chase if price is above 79,500.
Only if 4H holds above 79,600, and OI rises mildly, can it be considered a real breakout. If the 4H close breaks below 76,900, the long setup is canceled.
At 2:00 AM the day after tomorrow, the FOMC rate decision will be released. It’s easy for them to whip prices back and forth to wash leverage in advance—don’t open positions with too large a size.
Simple summary: the trend still looks bullish; buy the 77,300–77,700 zone, don’t chase above 79,500. If it breaks below 76,900, then admit the mistake.
⚠️ The above is only my personal order-book analysis and not investment advice. Manage position sizing carefully.
钱无敌1688
·
--
Bullish#BTC Market analysis 9/14
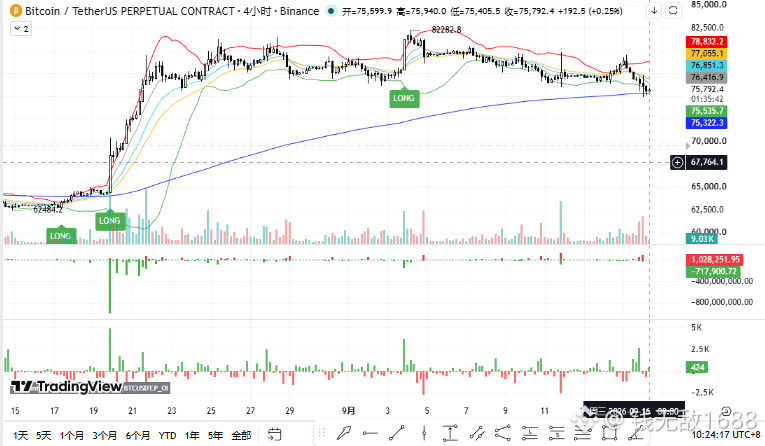
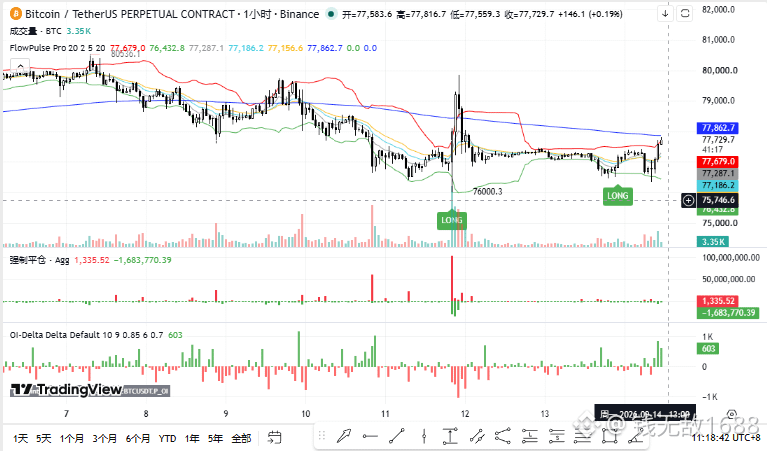
Yesterday, a long position at 76900–77200 has already been entered. This morning it was shaken down to the low of 76350, but the stop-loss at 75800 was not hit. Now it is back around 77800. Hold the positions; the first target is still 78300–78500, just one step away.
$BTC The daily trend has not been broken yet. Around 76000, continuous support has been effective. Today, we continue to look for longs.
However, 77900–78000 is a hard resistance zone in the short term.
Here it also coincides with the 1-hour EMA200. When the rebound reached this area, OI increased by about 2.7%, while price only rose about 0.7%. This indicates that leveraged longs are starting to pile up at the resistance level. Chasing longs directly may easily get you washed out.
Today, only do pullback longs.
For new entries: wait for the pullback to 76900–77300 to stabilize, then take the trade again. Stop-loss: 75900.
Targets: first look at 78300–78500. If it breaks through, then look at 79300. If momentum stays strong, continue to look at 80500.
If there is a valid breakdown on the 4-hour timeframe below 76000, the bullish idea is cancelled.
This coming Thursday at 2:00 AM there will be an FOMC event. Today, when opening positions, don’t make leverage too large.
Simple summary: The larger trend is still relatively bullish, but don’t chase above 78000. It feels better to re-enter on a pullback to 76900–77300.
⚠️ The above is only my personal market analysis, not investment advice. Pay attention to position sizing.
Yesterday, a long position at 76900–77200 has already been entered. This morning it was shaken down to the low of 76350, but the stop-loss at 75800 was not hit. Now it is back around 77800. Hold the positions; the first target is still 78300–78500, just one step away.
$BTC The daily trend has not been broken yet. Around 76000, continuous support has been effective. Today, we continue to look for longs.
However, 77900–78000 is a hard resistance zone in the short term.
Here it also coincides with the 1-hour EMA200. When the rebound reached this area, OI increased by about 2.7%, while price only rose about 0.7%. This indicates that leveraged longs are starting to pile up at the resistance level. Chasing longs directly may easily get you washed out.
Today, only do pullback longs.
For new entries: wait for the pullback to 76900–77300 to stabilize, then take the trade again. Stop-loss: 75900.
Targets: first look at 78300–78500. If it breaks through, then look at 79300. If momentum stays strong, continue to look at 80500.
If there is a valid breakdown on the 4-hour timeframe below 76000, the bullish idea is cancelled.
This coming Thursday at 2:00 AM there will be an FOMC event. Today, when opening positions, don’t make leverage too large.
Simple summary: The larger trend is still relatively bullish, but don’t chase above 78000. It feels better to re-enter on a pullback to 76900–77300.
⚠️ The above is only my personal market analysis, not investment advice. Pay attention to position sizing.
钱无敌1688
·
--
Bullish#BTC Market analysis 9/13
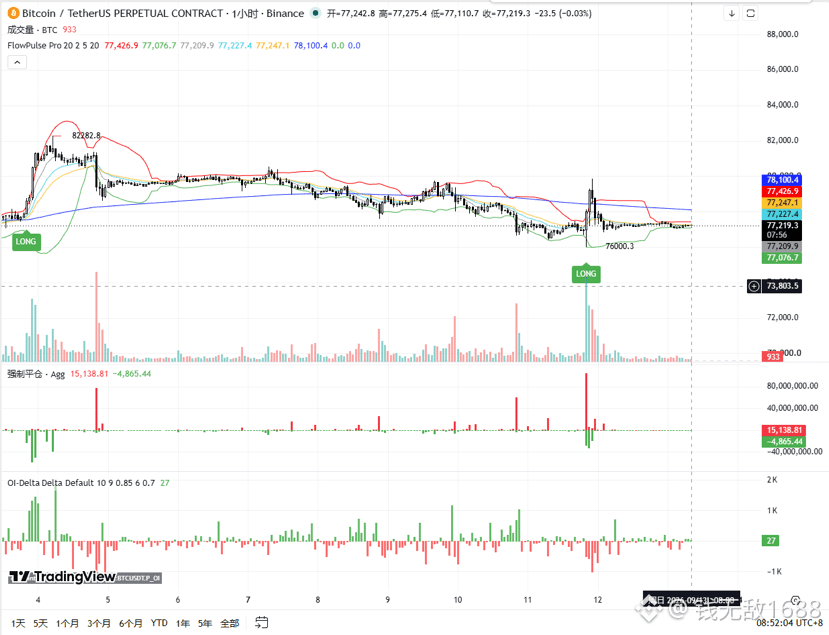
The long positions from the 76800-77200 range I mentioned yesterday have already been entered, with the lowest at 77025. The market moved sideways all day; the target wasn’t reached, and the 75600 stop-loss was not hit. The long-position logic continues to be held.
$BTC is currently around 77150. The daily close remains above the EMA21 at 76860. The larger trend is still treated as a bullish pullback.
Funds are waiting for direction
In the past 24 hours, both price and OI have only fluctuated by about 0.1%. The 1-hour Bollinger Bands have compressed to roughly 350 points. It’s not a matter of who wins between longs and shorts; it’s that weekend capital is waiting for someone to make the first move. Next, a breakout with increased volume is likely.
Go long at lower levels today
You can lightly go long within 76900-77200; hold the longs entered yesterday.
Set stop-loss at 75800. After breaking and holding above 77600, look for 78300-78500. If it breaks through, watch for 79300, with a strong target of 80500.
A valid bearish break below 76000 on the 4-hour chart indicates the daily support has failed, and the longs should be exited.
Simple summary: Continue to look for longs. Hold above 76800 and wait for the consolidation to end before testing 78500-79300.
⚠️ The above is only my personal order-book/price action analysis, not investment advice. Pay attention to position sizing and risk management.
The long positions from the 76800-77200 range I mentioned yesterday have already been entered, with the lowest at 77025. The market moved sideways all day; the target wasn’t reached, and the 75600 stop-loss was not hit. The long-position logic continues to be held.
$BTC is currently around 77150. The daily close remains above the EMA21 at 76860. The larger trend is still treated as a bullish pullback.
Funds are waiting for direction
In the past 24 hours, both price and OI have only fluctuated by about 0.1%. The 1-hour Bollinger Bands have compressed to roughly 350 points. It’s not a matter of who wins between longs and shorts; it’s that weekend capital is waiting for someone to make the first move. Next, a breakout with increased volume is likely.
Go long at lower levels today
You can lightly go long within 76900-77200; hold the longs entered yesterday.
Set stop-loss at 75800. After breaking and holding above 77600, look for 78300-78500. If it breaks through, watch for 79300, with a strong target of 80500.
A valid bearish break below 76000 on the 4-hour chart indicates the daily support has failed, and the longs should be exited.
Simple summary: Continue to look for longs. Hold above 76800 and wait for the consolidation to end before testing 78500-79300.
⚠️ The above is only my personal order-book/price action analysis, not investment advice. Pay attention to position sizing and risk management.
钱无敌1688
·
--
#BTC market analysis 9/12
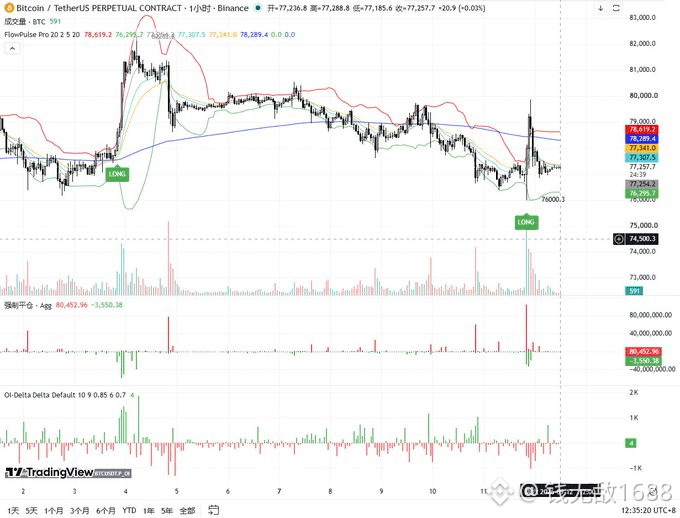
The long positions in the 76000-76500 range that I mentioned yesterday have already been filled.
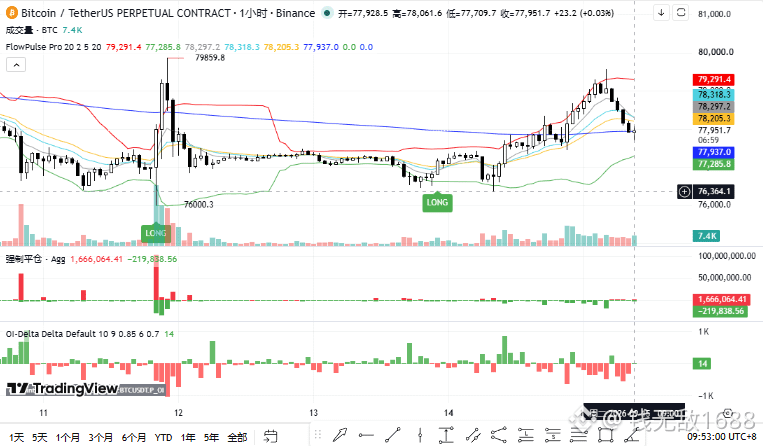
After the CPI was released, the price precisely dipped to 76000.3 at the lowest point, then surged up to 79859. Both targets—78200-78500 and 79300—were fully achieved, and the 75200 stop loss was not hit.
$BTC is currently around 77200. CPI m/m was 0.4%, and core CPI m/m was 0.3%. The market first sells off the longs, then lifts the price to the shorts. Over the past 24 hours, OI decreased by about 3.44%. The spike upward last night was mainly due to short covering, not strong additional long buying.
The larger trend continues to be treated as a long-side pullback
The daily chart has regained the EMA21 at 76821, indicating that 76000 has valid support. However, the 4-hour chart is still below EMA21 at 77746, so don’t chase the price from here.
Today’s trading plan
If the pullback to 76800-77200 holds and does not break, you can enter longs in small batches.
Stop loss: 75600. First target: 78200-78500. A breakout opens the way to 79300-79800, with a strong target at 80500.
If the 4-hour close falls below 76000, it means the support has failed and the long trade idea should be canceled.
Weekend liquidity is thin, so it’s better to observe more and act less.
⚠️
The above is only my personal order-flow analysis, not investment advice. Pay attention to position sizing.
The long positions in the 76000-76500 range that I mentioned yesterday have already been filled.
After the CPI was released, the price precisely dipped to 76000.3 at the lowest point, then surged up to 79859. Both targets—78200-78500 and 79300—were fully achieved, and the 75200 stop loss was not hit.
$BTC is currently around 77200. CPI m/m was 0.4%, and core CPI m/m was 0.3%. The market first sells off the longs, then lifts the price to the shorts. Over the past 24 hours, OI decreased by about 3.44%. The spike upward last night was mainly due to short covering, not strong additional long buying.
The larger trend continues to be treated as a long-side pullback
The daily chart has regained the EMA21 at 76821, indicating that 76000 has valid support. However, the 4-hour chart is still below EMA21 at 77746, so don’t chase the price from here.
Today’s trading plan
If the pullback to 76800-77200 holds and does not break, you can enter longs in small batches.
Stop loss: 75600. First target: 78200-78500. A breakout opens the way to 79300-79800, with a strong target at 80500.
If the 4-hour close falls below 76000, it means the support has failed and the long trade idea should be canceled.
Weekend liquidity is thin, so it’s better to observe more and act less.
⚠️
The above is only my personal order-flow analysis, not investment advice. Pay attention to position sizing.
钱无敌1688
·
--
#BTC Market Analysis 9/10
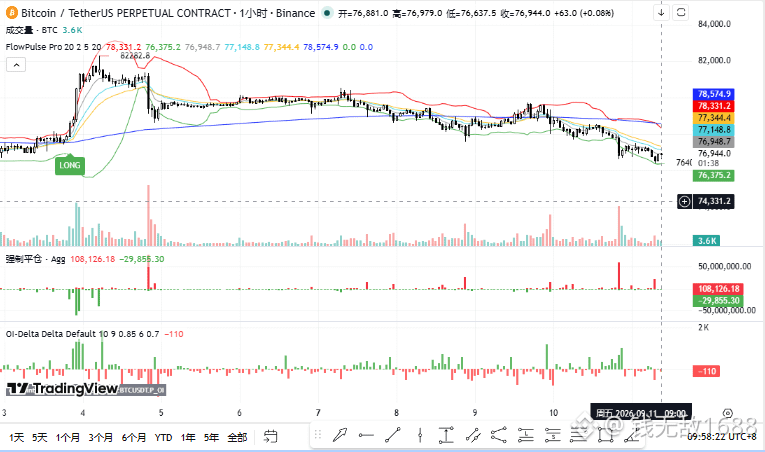
Yesterday we emphasized that you must hold above 79300 to go long. The price closed 4 hours later at 79281—just 19 points short. Then it dropped to 77706. The level being so precisely controlled may feel excessive, but that’s how trading works. Missing by 19 points is still considered not having held steady, so long positions naturally wouldn’t enter.
$BTC ’s decline starting from 82282 is still viewed as a pullback after the daily uptrend. The larger trend has not yet turned bearish.
1) 77000-77600 is the main support. It has already tested that area twice. Buyers are still stepping in, but the support is also being consumed. A further retest should not be treated as an immediate bottom-buy.
2) The 4-hour EMA21 and the Bollinger midline are concentrated around 78900-79300. Only if the 4-hour price holds above 79300, and then a pullback to 78900-79100 does not break, should you consider going long. Stop loss: 77400. Targets: 80500, then 81500-82200.
In the past 24 hours, price has fallen by about 0.78%, and OI has dropped by about 1.43%. It looks more like the long side is deleveraging rather than shorts entering aggressively.
Tonight at 20:30, PPI will be released; tomorrow evening at CPI will be released. Don’t chase positions ahead of the data.
The broader trend remains bullish. The pullback hasn’t ended yet. Hold 77000-77600, and only go long after 79300 is reclaimed.
⚠️ For personal order-flow analysis only, not investment advice.
Yesterday we emphasized that you must hold above 79300 to go long. The price closed 4 hours later at 79281—just 19 points short. Then it dropped to 77706. The level being so precisely controlled may feel excessive, but that’s how trading works. Missing by 19 points is still considered not having held steady, so long positions naturally wouldn’t enter.
$BTC ’s decline starting from 82282 is still viewed as a pullback after the daily uptrend. The larger trend has not yet turned bearish.
1) 77000-77600 is the main support. It has already tested that area twice. Buyers are still stepping in, but the support is also being consumed. A further retest should not be treated as an immediate bottom-buy.
2) The 4-hour EMA21 and the Bollinger midline are concentrated around 78900-79300. Only if the 4-hour price holds above 79300, and then a pullback to 78900-79100 does not break, should you consider going long. Stop loss: 77400. Targets: 80500, then 81500-82200.
In the past 24 hours, price has fallen by about 0.78%, and OI has dropped by about 1.43%. It looks more like the long side is deleveraging rather than shorts entering aggressively.
Tonight at 20:30, PPI will be released; tomorrow evening at CPI will be released. Don’t chase positions ahead of the data.
The broader trend remains bullish. The pullback hasn’t ended yet. Hold 77000-77600, and only go long after 79300 is reclaimed.
⚠️ For personal order-flow analysis only, not investment advice.
钱无敌1688
·
--
#BTC Market Analysis 9/10
Yesterday we emphasized that you must hold above 79300 to go long. The price closed 4 hours later at 79281—just 19 points short. Then it dropped to 77706. The level being so precisely controlled may feel excessive, but that’s how trading works. Missing by 19 points is still considered not having held steady, so long positions naturally wouldn’t enter.
$BTC ’s decline starting from 82282 is still viewed as a pullback after the daily uptrend. The larger trend has not yet turned bearish.
1) 77000-77600 is the main support. It has already tested that area twice. Buyers are still stepping in, but the support is also being consumed. A further retest should not be treated as an immediate bottom-buy.
2) The 4-hour EMA21 and the Bollinger midline are concentrated around 78900-79300. Only if the 4-hour price holds above 79300, and then a pullback to 78900-79100 does not break, should you consider going long. Stop loss: 77400. Targets: 80500, then 81500-82200.
In the past 24 hours, price has fallen by about 0.78%, and OI has dropped by about 1.43%. It looks more like the long side is deleveraging rather than shorts entering aggressively.
Tonight at 20:30, PPI will be released; tomorrow evening at CPI will be released. Don’t chase positions ahead of the data.
The broader trend remains bullish. The pullback hasn’t ended yet. Hold 77000-77600, and only go long after 79300 is reclaimed.
⚠️ For personal order-flow analysis only, not investment advice.
Yesterday we emphasized that you must hold above 79300 to go long. The price closed 4 hours later at 79281—just 19 points short. Then it dropped to 77706. The level being so precisely controlled may feel excessive, but that’s how trading works. Missing by 19 points is still considered not having held steady, so long positions naturally wouldn’t enter.
$BTC ’s decline starting from 82282 is still viewed as a pullback after the daily uptrend. The larger trend has not yet turned bearish.
1) 77000-77600 is the main support. It has already tested that area twice. Buyers are still stepping in, but the support is also being consumed. A further retest should not be treated as an immediate bottom-buy.
2) The 4-hour EMA21 and the Bollinger midline are concentrated around 78900-79300. Only if the 4-hour price holds above 79300, and then a pullback to 78900-79100 does not break, should you consider going long. Stop loss: 77400. Targets: 80500, then 81500-82200.
In the past 24 hours, price has fallen by about 0.78%, and OI has dropped by about 1.43%. It looks more like the long side is deleveraging rather than shorts entering aggressively.
Tonight at 20:30, PPI will be released; tomorrow evening at CPI will be released. Don’t chase positions ahead of the data.
The broader trend remains bullish. The pullback hasn’t ended yet. Hold 77000-77600, and only go long after 79300 is reclaimed.
⚠️ For personal order-flow analysis only, not investment advice.

静姐6888
·
--
Some lights will shine briefly,
only to go out when the wind blows.
But there are also lights that are lit one by one,
and from afar,
they look like a city at night.
In its roadmap, LUCIC has planned
3,333 NFT card artworks.
This isn’t just a number written on paper—
it’s part of the journey of an ecosystem being built.
One NFT card is a beam of light.
3,333 NFTs are 3,333 stories.
Today,
we have already seen thousands of lights.
When they are all lit,
what we see will no longer be just
some points of light,
but a vast
sky at night
filled with stars
only to go out when the wind blows.
But there are also lights that are lit one by one,
and from afar,
they look like a city at night.
In its roadmap, LUCIC has planned
3,333 NFT card artworks.
This isn’t just a number written on paper—
it’s part of the journey of an ecosystem being built.
One NFT card is a beam of light.
3,333 NFTs are 3,333 stories.
Today,
we have already seen thousands of lights.
When they are all lit,
what we see will no longer be just
some points of light,
but a vast
sky at night
filled with stars


AI小龙虾
·
--
#spcx今日走势分析 The richest man is sending red envelopes 🧧🧧 spx — by the end of October there will be over 1 billion shares, and by mid-November, after the Q3 earnings are released, an additional ~1.3 billion restricted shares will gradually become tradable, bringing the total to over 2.3 billion shares. The near-term tug-of-war between mechanical buying demand and the medium-term supply shock is becoming the key variable in SpaceX’s Q4 pricing. As of the time of writing, SpaceX rose more than 3% on Tuesday, with the stock price at a nearly two-month high, and the total market value has returned to $2 trillion. The newly released shares will either be sold to potential passive buyers, or the stock price will rise due to increased demand from index funds. Products tracking indices such as the Nasdaq are expected to bring more demand—but no matter how many shares are unlocked, I’m not selling anyway! Hold on, hug the rich man’s thigh and get some tasty broth!$SPCX



静静Amily
·
--
Bullish#美伊互袭油轮冲突升级 The United States and Iran are at it again—they’re fighting again. You hit my ship, I hit your ship, $CL Will the oil price go up? 📈$BTC


心月势不可挡
·
--
The autumn sky is exceptionally high and clear. With a gentle breeze and light wind, the sunlight becomes softer and no longer burns.
As the autumn wind slowly blows, the leaves gradually put on new clothes: ginkgo leaves spread across the ground in a blanket of gold, maple leaves blaze into a sea of red, and plane tree leaves fall one by one in steady murmurs—like fluttering butterflies—landing on the fallen leaves with a rustling sound.
In the hills and countryside, the layered forests are dyed in full splendor, with yellows and reds of varying depths blending and glowing across the mountains. In the fields, waves of ripening rice roll on, fruits and melons hang laden on the branches, and the air carries a faint sweet scent of grains and osmanthus.
The lake water is clear, reeds sway with the wind, and now and then a line of wild geese flies south. Everywhere is a picture of maturity and peacefulness.
As the autumn wind slowly blows, the leaves gradually put on new clothes: ginkgo leaves spread across the ground in a blanket of gold, maple leaves blaze into a sea of red, and plane tree leaves fall one by one in steady murmurs—like fluttering butterflies—landing on the fallen leaves with a rustling sound.
In the hills and countryside, the layered forests are dyed in full splendor, with yellows and reds of varying depths blending and glowing across the mountains. In the fields, waves of ripening rice roll on, fruits and melons hang laden on the branches, and the air carries a faint sweet scent of grains and osmanthus.
The lake water is clear, reeds sway with the wind, and now and then a line of wild geese flies south. Everywhere is a picture of maturity and peacefulness.




奋斗Hustle1688
·
--
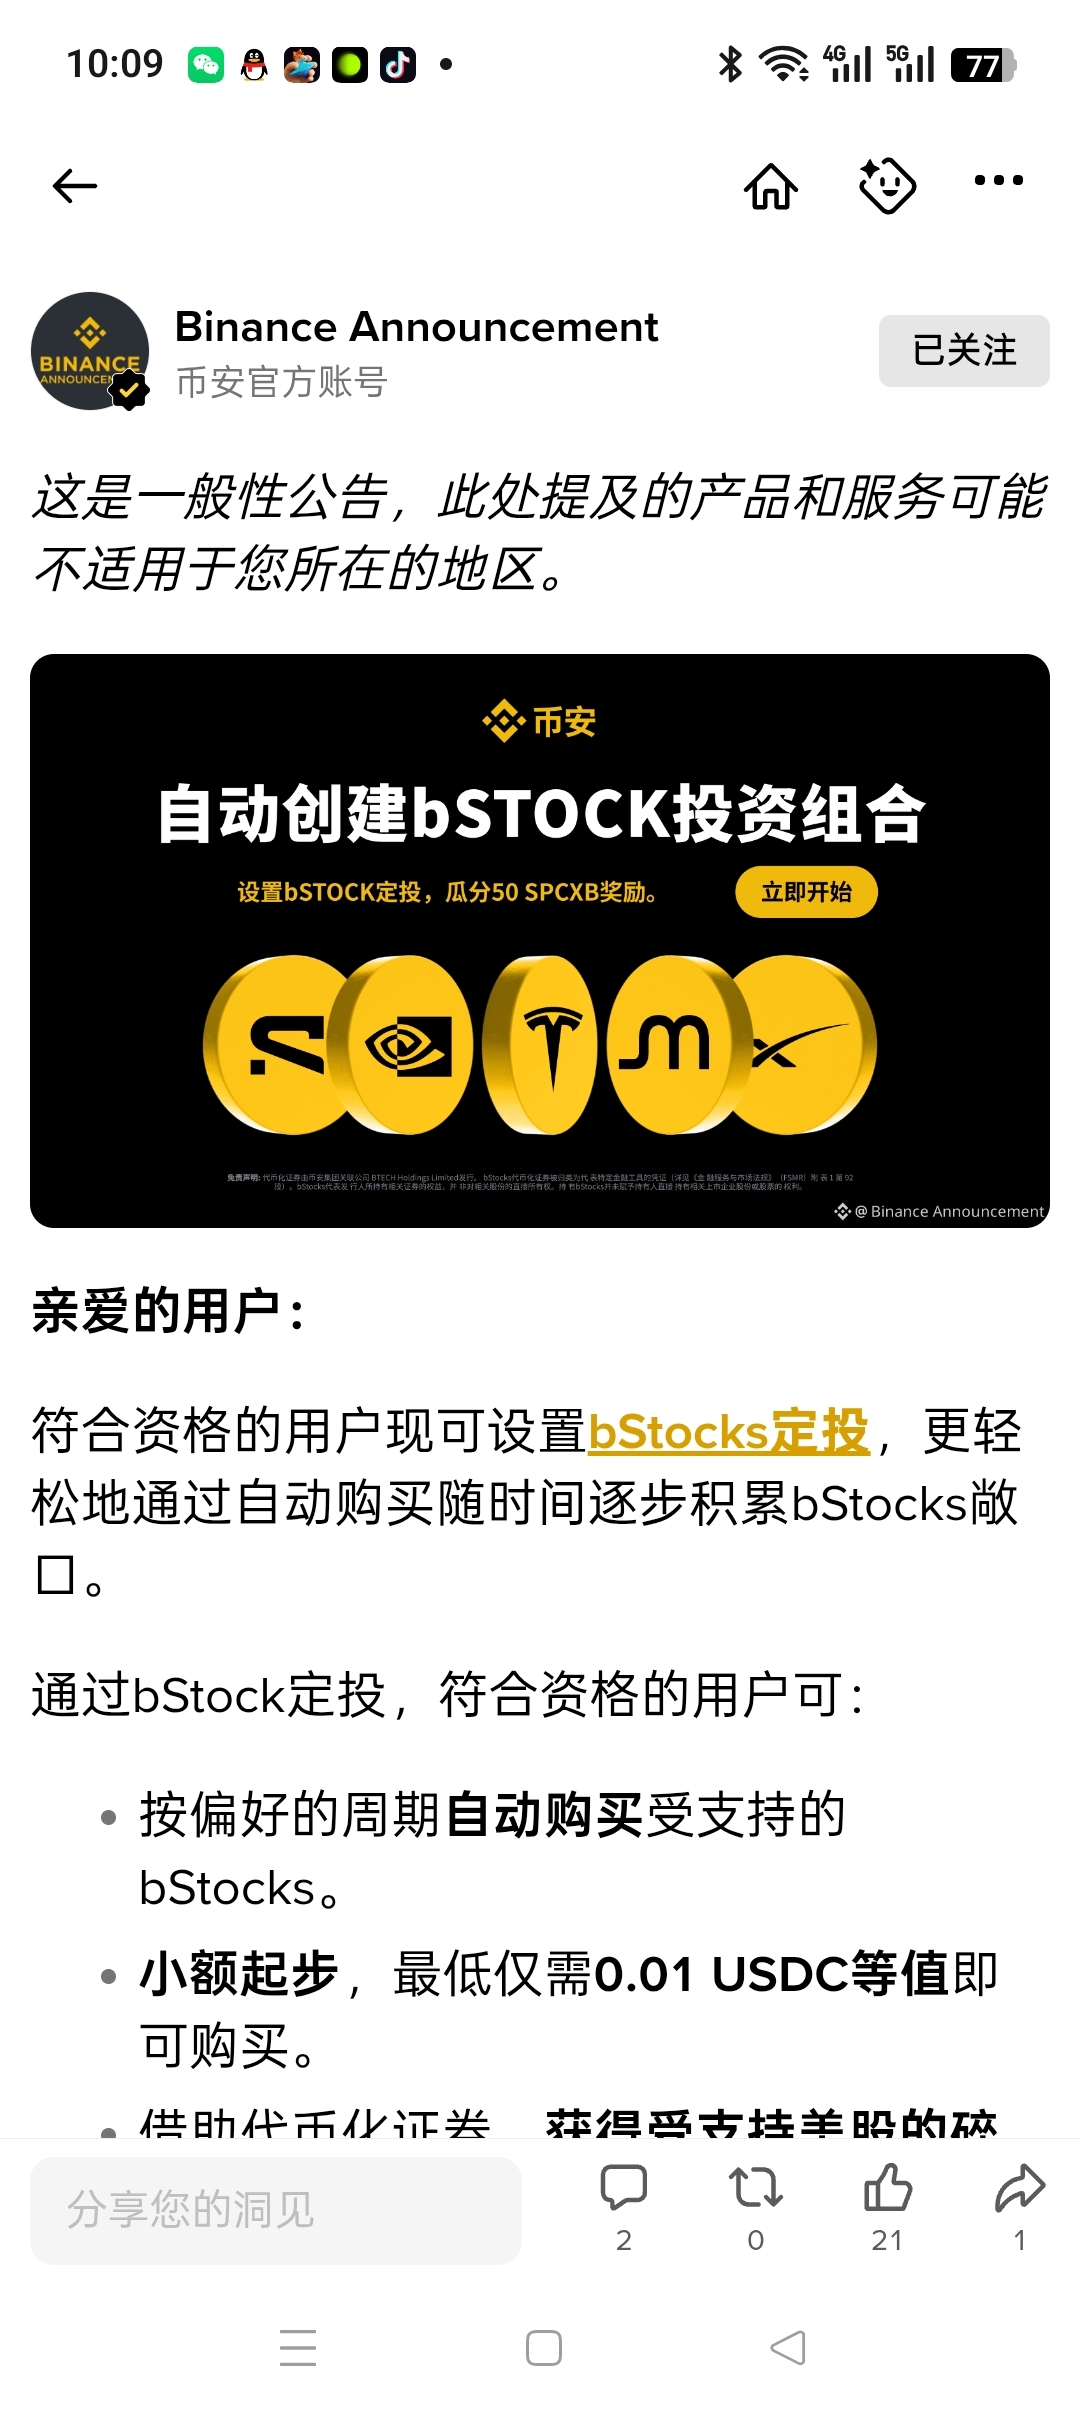
🔔 Big news! Binance launches the “Automatic Stock Investing” feature for US stocks—be a shareholder with just 0.01 U!
钱无敌1688
·
--
Bearish#BTC Market Analysis 9/6
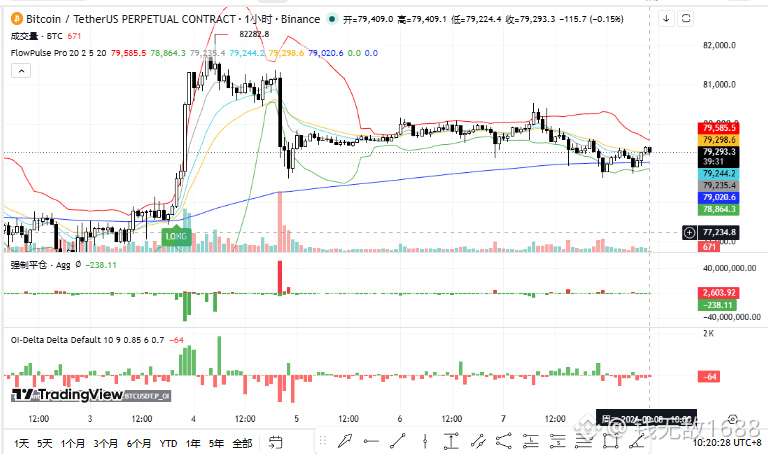
It moved up to 80k, then pulled back again. What’s missing now is not a single surge, but whether it can hold after being pushed up.
The rebound-short condition given yesterday has already appeared: the high in the early morning was 80167, then within 1 hour it fell back below 79900. But after that, the lowest only reached 79653, and the 78600 target was not hit, so the path cannot be considered complete.
Currently $BTC is around 79937. Today focus on two things:
Support is still there, but there has been no breakout yet.
The 4-hour EMA21 is near 79520, and yesterday’s low was 79405, forming a 79400-79500 support zone. Above, 80000-80300 still has not been firmly reclaimed. The 1-hour Bollinger Bands have narrowed, so this is currently a sideways range, not a one-way drop.
Price has rebounded slightly, but OI has fallen by about 1.5%.
This is more consistent with a repair during de-risking. It cannot yet confirm fresh long-side follow-through; likewise, there is no evidence that shorts are aggressively adding.
The Friday strong NFP-related rate hike concerns are still there, but on that day ETFs still saw a net inflow of about $175 million. Macro pressure does not mean spot buying has disappeared, which is also why it is not appropriate to chase shorts right now.
Today's main view: leaning toward a pullback, but new short entries should wait until support gives way.
Wait for the 4-hour candle to close below 79400, then if it rebounds to 79500-79800 and the 1-hour chart is rejected again, consider shorting. Stop loss at 80400, target first at 78600, and if that breaks, look toward 77400.
If 80300 is reclaimed first, cancel this short plan. Right now support has not broken and resistance has not been surpassed, so there is no need to force a trade around 79900.
Personal analysis only; please pay attention to position management.
It moved up to 80k, then pulled back again. What’s missing now is not a single surge, but whether it can hold after being pushed up.
The rebound-short condition given yesterday has already appeared: the high in the early morning was 80167, then within 1 hour it fell back below 79900. But after that, the lowest only reached 79653, and the 78600 target was not hit, so the path cannot be considered complete.
Currently $BTC is around 79937. Today focus on two things:
Support is still there, but there has been no breakout yet.
The 4-hour EMA21 is near 79520, and yesterday’s low was 79405, forming a 79400-79500 support zone. Above, 80000-80300 still has not been firmly reclaimed. The 1-hour Bollinger Bands have narrowed, so this is currently a sideways range, not a one-way drop.
Price has rebounded slightly, but OI has fallen by about 1.5%.
This is more consistent with a repair during de-risking. It cannot yet confirm fresh long-side follow-through; likewise, there is no evidence that shorts are aggressively adding.
The Friday strong NFP-related rate hike concerns are still there, but on that day ETFs still saw a net inflow of about $175 million. Macro pressure does not mean spot buying has disappeared, which is also why it is not appropriate to chase shorts right now.
Today's main view: leaning toward a pullback, but new short entries should wait until support gives way.
Wait for the 4-hour candle to close below 79400, then if it rebounds to 79500-79800 and the 1-hour chart is rejected again, consider shorting. Stop loss at 80400, target first at 78600, and if that breaks, look toward 77400.
If 80300 is reclaimed first, cancel this short plan. Right now support has not broken and resistance has not been surpassed, so there is no need to force a trade around 79900.
Personal analysis only; please pay attention to position management.

Mahi_玛希BNB
·
--
Bullish### 🚀 ETH Market Watch
**$ETH is showing strong recovery momentum! 🔥**
Ethereum has been showing strong buyer interest, but the **$2,500–$2,560 zone** remains an important area to watch. If ETH breaks above this resistance with strong volume, bullish momentum could accelerate. 📈
1️⃣ **Follow MAHI BNB** ✅
2️⃣ **Like & Comment “ETH”** ✅
3️⃣ **Repost This Post** 🔄✅
4️⃣ **Stay Tuned for the Next Gift 🎁🧧** ✅
However, crypto remains highly volatile, so confirmation and trading volume are key before chasing a breakout. 👀
**My watchlist:**
ETH → Breakout 📈 or Rejection ⚠️
$SOL $BNB
#ETH #Ethereum(ETH) #Crypto_Jobs🎯 #altcoinseason #DeFi #Binance #BinanceSquareFamily #writetoearn
**$ETH is showing strong recovery momentum! 🔥**
Ethereum has been showing strong buyer interest, but the **$2,500–$2,560 zone** remains an important area to watch. If ETH breaks above this resistance with strong volume, bullish momentum could accelerate. 📈
1️⃣ **Follow MAHI BNB** ✅
2️⃣ **Like & Comment “ETH”** ✅
3️⃣ **Repost This Post** 🔄✅
4️⃣ **Stay Tuned for the Next Gift 🎁🧧** ✅
However, crypto remains highly volatile, so confirmation and trading volume are key before chasing a breakout. 👀
**My watchlist:**
ETH → Breakout 📈 or Rejection ⚠️
$SOL $BNB
#ETH #Ethereum(ETH) #Crypto_Jobs🎯 #altcoinseason #DeFi #Binance #BinanceSquareFamily #writetoearn


奕泽YIZZE
·
--
🧧🎁
The wind sweeps across the mountains and fields, rushing toward the next mountains and seas.
All perseverance will eventually meet the light that belongs to itself.
——Lucic
The wind sweeps across the mountains and fields, rushing toward the next mountains and seas.
All perseverance will eventually meet the light that belongs to itself.
——Lucic


trader叫兽
·
--
🧧🧧🧧
Good morning, everyone, brothers—you're absolutely amazing
We’ve surpassed 7,000 followers
Follow me on YouTube: Crypto Trading Mentor
More benefits can be unlocked
Thank you, brothers, for your support
$BNB
🧧🧧🧧
Good morning, everyone, brothers—you're absolutely amazing
We’ve surpassed 7,000 followers
Follow me on YouTube: Crypto Trading Mentor
More benefits can be unlocked
Thank you, brothers, for your support
$BNB
🧧🧧🧧


生蚝哥Oyster
·
--
BullishMarket Flash | Bonk Guy: This round belongs to Robinhood and BNB Chain; the BNB golden cycle has arrived
On September 6, well-known trader Bonk Guy posted a rallying call, warning the market not to ignore the BNB Chain narrative and saying that now is the golden season for BNB Chain.
Looking back at his earlier call, he had already suggested weeks ago that Robinhood season was about to arrive. At the time, it did not gain much recognition, but the subsequent meme market basically confirmed his judgment:
• PONS rose from a $4 million market cap when he first mentioned it to a peak of $990 million
• CASHCAT reached a high of $270 million, AI hit a high of $280 million, while a large number of meme coins also emerged with market caps in the tens of millions
In his view, MARSCOIN kicked off the first battle in the BNB Chain coin-stock meme sector and is currently the clear leader in the field, with the gap to other projects expected to keep widening.
Bonk Guy emphasized that once the BNB Chain market breaks out, both the speed and intensity will be extremely fierce; do not wait until a token has already risen 10x before chasing it.
The core logic is that Binance has 320 million global users, and MARSCOIN is now listed on Binance spot and futures, greatly lowering the participation barrier for overseas users. Looking at history, SAFEMOON once surged to a peak market cap of $17 billion on BNB Chain, fully proving the enormous imagination space of BNB Chain meme coins.
He believes the rally will not have only one leader, and many follow-on coins will emerge later; when BNB season truly starts, the explosive power will be very strong. He recommends positioning early: it is better to get in sooner than to chase higher prices later.
On September 6, well-known trader Bonk Guy posted a rallying call, warning the market not to ignore the BNB Chain narrative and saying that now is the golden season for BNB Chain.
Looking back at his earlier call, he had already suggested weeks ago that Robinhood season was about to arrive. At the time, it did not gain much recognition, but the subsequent meme market basically confirmed his judgment:
• PONS rose from a $4 million market cap when he first mentioned it to a peak of $990 million
• CASHCAT reached a high of $270 million, AI hit a high of $280 million, while a large number of meme coins also emerged with market caps in the tens of millions
In his view, MARSCOIN kicked off the first battle in the BNB Chain coin-stock meme sector and is currently the clear leader in the field, with the gap to other projects expected to keep widening.
Bonk Guy emphasized that once the BNB Chain market breaks out, both the speed and intensity will be extremely fierce; do not wait until a token has already risen 10x before chasing it.
The core logic is that Binance has 320 million global users, and MARSCOIN is now listed on Binance spot and futures, greatly lowering the participation barrier for overseas users. Looking at history, SAFEMOON once surged to a peak market cap of $17 billion on BNB Chain, fully proving the enormous imagination space of BNB Chain meme coins.
He believes the rally will not have only one leader, and many follow-on coins will emerge later; when BNB season truly starts, the explosive power will be very strong. He recommends positioning early: it is better to get in sooner than to chase higher prices later.

Log in to explore more content