

陈总趋势论
1.6k Posts

陈总趋势论
Report
Block User
✅公众号:ChenZong888,专注合约日内波段,胜率稳定80%-85%;现货周期性埋伏潜力币,熊市低吸、牛市高抛,把握市场趋势,关注我,让你稳定收益🎯
12 Following
119 Followers
1.1K+ Liked
Posts
All
Quotes
PINNED
·
--
On Binance's official platform across from you, communication is safer and more convenient!
Entering the Binance chat room is actually very simple
Strategy ID: Bow-Heavy-Hao-[ChenZong888]
1. First, save the QR code below
2. Open the Binance homepage and search for chat rooms
3. Tap the + in the top right corner
4. Tap Scan QR code, and upload the QR code you just saved
Then you can add me as a friend!
#黄金突破1月下行趋势线
On Binance's official platform across from you, communication is safer and more convenient!
Entering the Binance chat room is actually very simple
Strategy ID: Bow-Heavy-Hao-[ChenZong888]
1. First, save the QR code below
2. Open the Binance homepage and search for chat rooms
3. Tap the + in the top right corner
4. Tap Scan QR code, and upload the QR code you just saved
Then you can add me as a friend!
#黄金突破1月下行趋势线
Entering the Binance chat room is actually very simple
Strategy ID: Bow-Heavy-Hao-[ChenZong888]
1. First, save the QR code below
2. Open the Binance homepage and search for chat rooms
3. Tap the + in the top right corner
4. Tap Scan QR code, and upload the QR code you just saved
Then you can add me as a friend!
#黄金突破1月下行趋势线

2
67
·
--
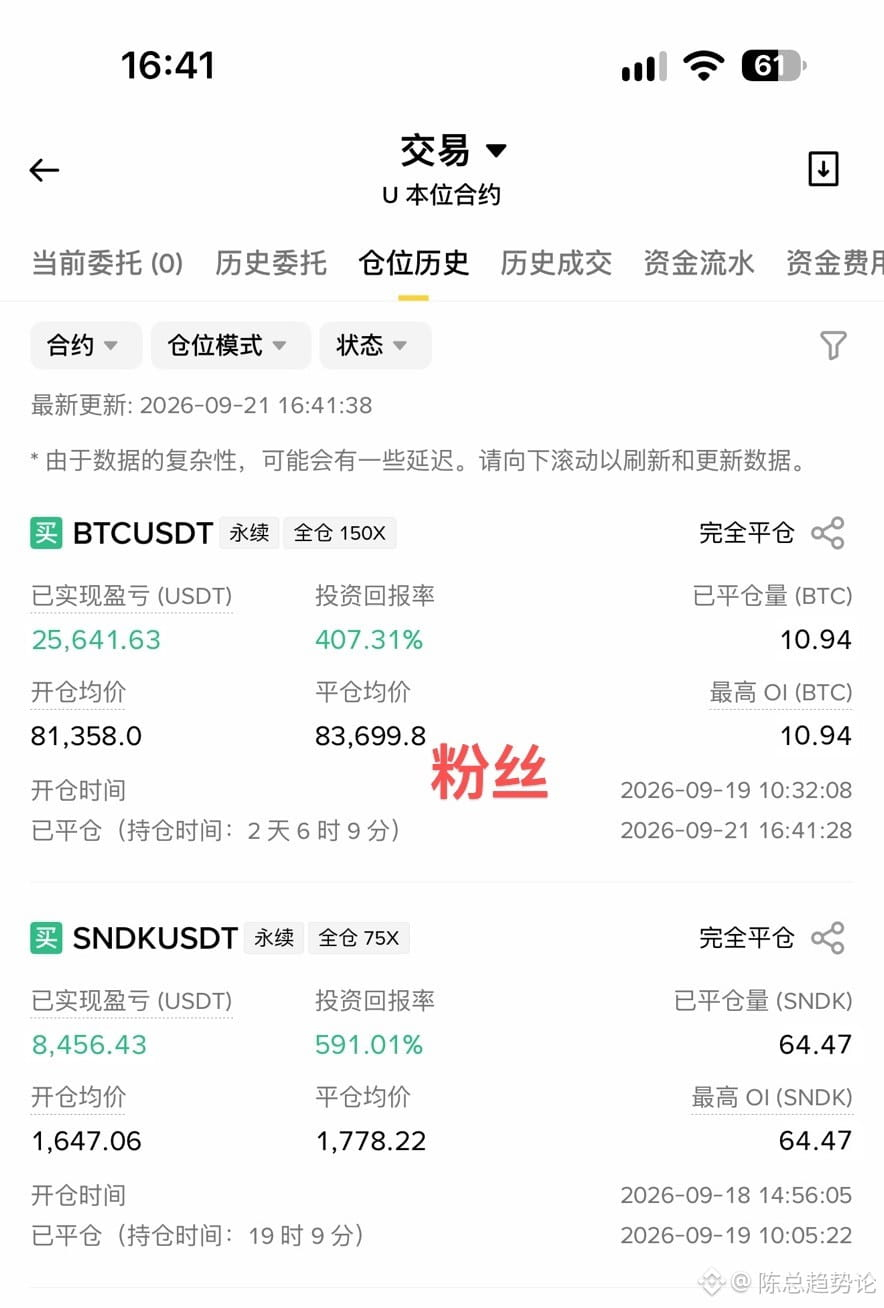
For nine years in the crypto world, four traps have taken the lives of countless people
After nine years, I’ve seen too many people rush in with excitement—and leave drenched in blood.
The ways to lose money are countless, but at the root there are four:
1. An itch you can’t stop
Treat it like a casino: when you’re not in a position, it feels unbearable. You end up making a dozen or more trades a day. Add in fees and slippage, and the principal quietly evaporates by 30%. The more impatient you are, the more you lose.
2. Overconcentrate and go all-in with high leverage
Have 80% of your holdings in, with 20x leverage. When you win, you look glorious; when you lose, you get wiped out. Leverage doesn’t amplify profits—it amplifies how fast you die.
3. Small gains, big losses
Make 5% and you run immediately. Lose 30% and you stubbornly hold on, averaging down. Take-profit too fast, stop-loss too slow—the most deadly mindset. The market isn’t afraid you leave early; it’s afraid you can’t leave at all.
4. Never use stop-loss
Rely purely on “feeling,” betting that the market will behave. One black swan can cut your position in half. Not using a stop-loss is like not wearing a seatbelt. Most of the time you’re fine—until something happens, and then it’s over.
Those who survive treat stop-loss as an iron rule. Even if you get thrown off the train, it’s still better than being liquidated.
Move less, trade with light positions, and always set stop-loss—respect the market. Only when your principal is still there do you have the right to talk about making money.
Follow Mr. Chen. No empty promises—just the truth that helps you stay alive. If you want to learn real things, let’s move forward together.
For nine years in the crypto world, four traps have taken the lives of countless people
After nine years, I’ve seen too many people rush in with excitement—and leave drenched in blood.
The ways to lose money are countless, but at the root there are four:
1. An itch you can’t stop
Treat it like a casino: when you’re not in a position, it feels unbearable. You end up making a dozen or more trades a day. Add in fees and slippage, and the principal quietly evaporates by 30%. The more impatient you are, the more you lose.
2. Overconcentrate and go all-in with high leverage
Have 80% of your holdings in, with 20x leverage. When you win, you look glorious; when you lose, you get wiped out. Leverage doesn’t amplify profits—it amplifies how fast you die.
3. Small gains, big losses
Make 5% and you run immediately. Lose 30% and you stubbornly hold on, averaging down. Take-profit too fast, stop-loss too slow—the most deadly mindset. The market isn’t afraid you leave early; it’s afraid you can’t leave at all.
4. Never use stop-loss
Rely purely on “feeling,” betting that the market will behave. One black swan can cut your position in half. Not using a stop-loss is like not wearing a seatbelt. Most of the time you’re fine—until something happens, and then it’s over.
Those who survive treat stop-loss as an iron rule. Even if you get thrown off the train, it’s still better than being liquidated.
Move less, trade with light positions, and always set stop-loss—respect the market. Only when your principal is still there do you have the right to talk about making money.
Follow Mr. Chen. No empty promises—just the truth that helps you stay alive. If you want to learn real things, let’s move forward together.
After nine years, I’ve seen too many people rush in with excitement—and leave drenched in blood.
The ways to lose money are countless, but at the root there are four:
1. An itch you can’t stop
Treat it like a casino: when you’re not in a position, it feels unbearable. You end up making a dozen or more trades a day. Add in fees and slippage, and the principal quietly evaporates by 30%. The more impatient you are, the more you lose.
2. Overconcentrate and go all-in with high leverage
Have 80% of your holdings in, with 20x leverage. When you win, you look glorious; when you lose, you get wiped out. Leverage doesn’t amplify profits—it amplifies how fast you die.
3. Small gains, big losses
Make 5% and you run immediately. Lose 30% and you stubbornly hold on, averaging down. Take-profit too fast, stop-loss too slow—the most deadly mindset. The market isn’t afraid you leave early; it’s afraid you can’t leave at all.
4. Never use stop-loss
Rely purely on “feeling,” betting that the market will behave. One black swan can cut your position in half. Not using a stop-loss is like not wearing a seatbelt. Most of the time you’re fine—until something happens, and then it’s over.
Those who survive treat stop-loss as an iron rule. Even if you get thrown off the train, it’s still better than being liquidated.
Move less, trade with light positions, and always set stop-loss—respect the market. Only when your principal is still there do you have the right to talk about making money.
Follow Mr. Chen. No empty promises—just the truth that helps you stay alive. If you want to learn real things, let’s move forward together.
1
159
·
--
Verified
#cardano纳入x402套件支持ada支付
Cardano’s move here goes deeper than it looks on the surface.
While getting into Mastercard’s network, it also pushes ADA into the x402 SDK. But what’s really worth thinking about is the direction it chose: having AI agents pay the bill themselves.
In essence, the x402 protocol reactivates the HTTP 402 status code—one that has been dormant for decades. In the past, on-chain payments required human confirmation; now the software can settle the bill on its own. The data doesn’t lie: over the past 30 days, AI agents initiated 14 million payments via x402, with Base and Polygon leading the pack.
The backdrop is also intriguing: the U.S. crypto legislation is stuck in the Senate, and the CLARITY Act didn’t even get through a procedural vote. Cardano decided to sidestep regulatory uncertainty and look for real-world execution first—on the payments track.
But there’s a problem: the true share of actual trades for x402 recently has been a point of contention in the industry. Some analyses suggest that a significant portion of these “AI payments” are being generated—or “farmed”—artificially.
So here’s the question: when paying shifts from humans to machines, is this crypto payments track genuinely being driven by this kind of scenario—or does it stall again at the concept stage?
If you want real data on Cardano’s stablecoin supply, come talk to me.
#cardano纳入x402套件支持ada支付
Cardano’s move here goes deeper than it looks on the surface.
While getting into Mastercard’s network, it also pushes ADA into the x402 SDK. But what’s really worth thinking about is the direction it chose: having AI agents pay the bill themselves.
In essence, the x402 protocol reactivates the HTTP 402 status code—one that has been dormant for decades. In the past, on-chain payments required human confirmation; now the software can settle the bill on its own. The data doesn’t lie: over the past 30 days, AI agents initiated 14 million payments via x402, with Base and Polygon leading the pack.
The backdrop is also intriguing: the U.S. crypto legislation is stuck in the Senate, and the CLARITY Act didn’t even get through a procedural vote. Cardano decided to sidestep regulatory uncertainty and look for real-world execution first—on the payments track.
But there’s a problem: the true share of actual trades for x402 recently has been a point of contention in the industry. Some analyses suggest that a significant portion of these “AI payments” are being generated—or “farmed”—artificially.
So here’s the question: when paying shifts from humans to machines, is this crypto payments track genuinely being driven by this kind of scenario—or does it stall again at the concept stage?
If you want real data on Cardano’s stablecoin supply, come talk to me.
Cardano’s move here goes deeper than it looks on the surface.
While getting into Mastercard’s network, it also pushes ADA into the x402 SDK. But what’s really worth thinking about is the direction it chose: having AI agents pay the bill themselves.
In essence, the x402 protocol reactivates the HTTP 402 status code—one that has been dormant for decades. In the past, on-chain payments required human confirmation; now the software can settle the bill on its own. The data doesn’t lie: over the past 30 days, AI agents initiated 14 million payments via x402, with Base and Polygon leading the pack.
The backdrop is also intriguing: the U.S. crypto legislation is stuck in the Senate, and the CLARITY Act didn’t even get through a procedural vote. Cardano decided to sidestep regulatory uncertainty and look for real-world execution first—on the payments track.
But there’s a problem: the true share of actual trades for x402 recently has been a point of contention in the industry. Some analyses suggest that a significant portion of these “AI payments” are being generated—or “farmed”—artificially.
So here’s the question: when paying shifts from humans to machines, is this crypto payments track genuinely being driven by this kind of scenario—or does it stall again at the concept stage?
If you want real data on Cardano’s stablecoin supply, come talk to me.

2
3
2.1k
·
--
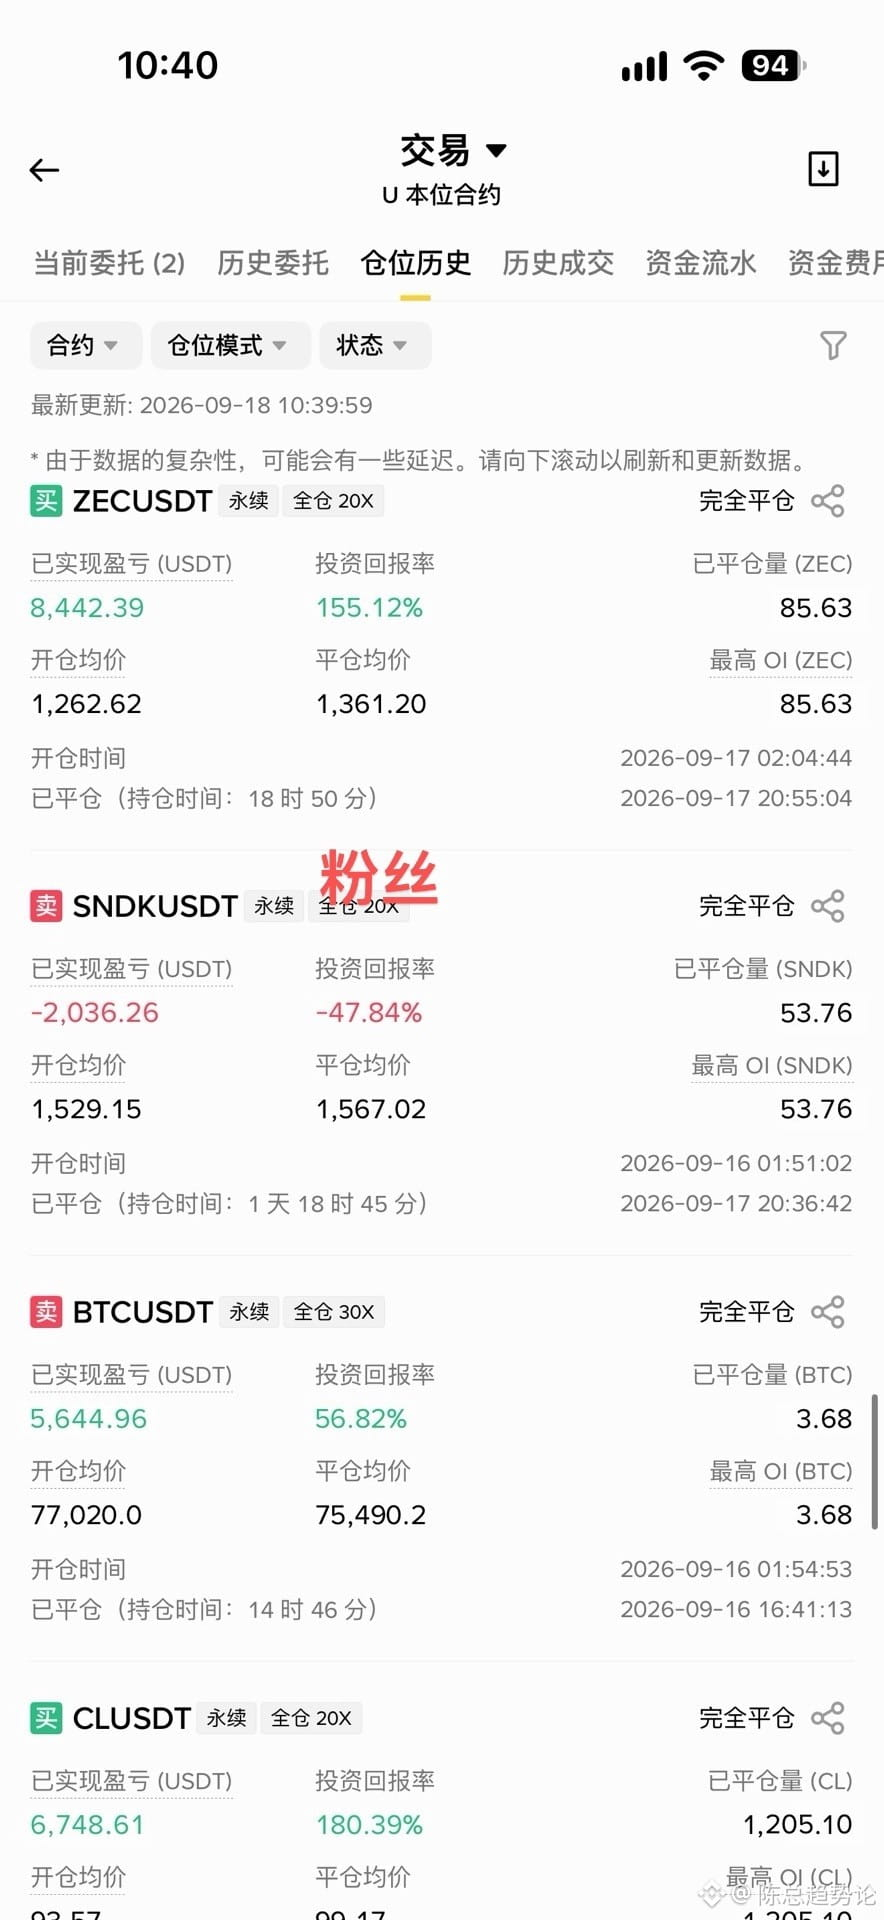
You lost money on a contract—stop blaming luck all the time
Once you’ve been in it long enough, you’ll understand: most losses have nothing to do with the market—they’re your own faults.$BEAT
Doesn’t that sound familiar? You just won a couple trades and got cocky, increased leverage, and built up your position—then one pullback wipes out the profit. Another, even more common one: when it goes up you can’t hold it, and when it drops you refuse to cut—turning a small loss into a big one.
I’ve stepped into all these traps. Before, I used to blame my bad luck too, but looking back I finally realized it wasn’t a market problem—it was a lack of rules.$ZEC
Many people stare at the one-minute chart, and as soon as the price moves they can’t help but get itchy to trade. The more you do that, the more you get repeatedly harvested. Later I just stopped looking at small timeframes and focused only on the big direction. What truly decides your account’s fate isn’t a few minutes of fluctuation—it’s the whole trend.
And here’s the habit that completely changed me: before placing an order, calculate the risk—not first think about how much you could make. Set a stop loss of 50U, and a target of at least 100U. If it’s not worth it, don’t trade.
Getting it wrong is normal, but one mistake shouldn’t shake your foundation. Per-trade losses must be locked in. Most people aren’t bad at technicals—they simply won’t admit they’re wrong.
If you’re wrong, get out—preserve your bullets. There’s another chance next round. Dying on the trade isn’t persistence; it’s adding fuel to the risk.
In the end, trading isn’t about who predicts better—it’s about who lasts longer. The market doesn’t lack opportunities; it lacks people who can wait for the right ones.
If your principal is still there, you’ll have a share in the bull market. If it’s gone, no matter how big the opportunity is, it’s pointless.
I’ve fallen hard all the way too. The traps I’ve stepped into are summarized as practical takeaways to share with you.
Follow Chen Zong. I won’t draw fantasies of getting rich overnight—I’ll only talk about real, usable trading logic for ordinary people.
You lost money on a contract—stop blaming luck all the time
Once you’ve been in it long enough, you’ll understand: most losses have nothing to do with the market—they’re your own faults.$BEAT
Doesn’t that sound familiar? You just won a couple trades and got cocky, increased leverage, and built up your position—then one pullback wipes out the profit. Another, even more common one: when it goes up you can’t hold it, and when it drops you refuse to cut—turning a small loss into a big one.
I’ve stepped into all these traps. Before, I used to blame my bad luck too, but looking back I finally realized it wasn’t a market problem—it was a lack of rules.$ZEC
Many people stare at the one-minute chart, and as soon as the price moves they can’t help but get itchy to trade. The more you do that, the more you get repeatedly harvested. Later I just stopped looking at small timeframes and focused only on the big direction. What truly decides your account’s fate isn’t a few minutes of fluctuation—it’s the whole trend.
And here’s the habit that completely changed me: before placing an order, calculate the risk—not first think about how much you could make. Set a stop loss of 50U, and a target of at least 100U. If it’s not worth it, don’t trade.
Getting it wrong is normal, but one mistake shouldn’t shake your foundation. Per-trade losses must be locked in. Most people aren’t bad at technicals—they simply won’t admit they’re wrong.
If you’re wrong, get out—preserve your bullets. There’s another chance next round. Dying on the trade isn’t persistence; it’s adding fuel to the risk.
In the end, trading isn’t about who predicts better—it’s about who lasts longer. The market doesn’t lack opportunities; it lacks people who can wait for the right ones.
If your principal is still there, you’ll have a share in the bull market. If it’s gone, no matter how big the opportunity is, it’s pointless.
I’ve fallen hard all the way too. The traps I’ve stepped into are summarized as practical takeaways to share with you.
Follow Chen Zong. I won’t draw fantasies of getting rich overnight—I’ll only talk about real, usable trading logic for ordinary people.
Once you’ve been in it long enough, you’ll understand: most losses have nothing to do with the market—they’re your own faults.$BEAT
Doesn’t that sound familiar? You just won a couple trades and got cocky, increased leverage, and built up your position—then one pullback wipes out the profit. Another, even more common one: when it goes up you can’t hold it, and when it drops you refuse to cut—turning a small loss into a big one.
I’ve stepped into all these traps. Before, I used to blame my bad luck too, but looking back I finally realized it wasn’t a market problem—it was a lack of rules.$ZEC
Many people stare at the one-minute chart, and as soon as the price moves they can’t help but get itchy to trade. The more you do that, the more you get repeatedly harvested. Later I just stopped looking at small timeframes and focused only on the big direction. What truly decides your account’s fate isn’t a few minutes of fluctuation—it’s the whole trend.
And here’s the habit that completely changed me: before placing an order, calculate the risk—not first think about how much you could make. Set a stop loss of 50U, and a target of at least 100U. If it’s not worth it, don’t trade.
Getting it wrong is normal, but one mistake shouldn’t shake your foundation. Per-trade losses must be locked in. Most people aren’t bad at technicals—they simply won’t admit they’re wrong.
If you’re wrong, get out—preserve your bullets. There’s another chance next round. Dying on the trade isn’t persistence; it’s adding fuel to the risk.
In the end, trading isn’t about who predicts better—it’s about who lasts longer. The market doesn’t lack opportunities; it lacks people who can wait for the right ones.
If your principal is still there, you’ll have a share in the bull market. If it’s gone, no matter how big the opportunity is, it’s pointless.
I’ve fallen hard all the way too. The traps I’ve stepped into are summarized as practical takeaways to share with you.
Follow Chen Zong. I won’t draw fantasies of getting rich overnight—I’ll only talk about real, usable trading logic for ordinary people.
1
24
·
--
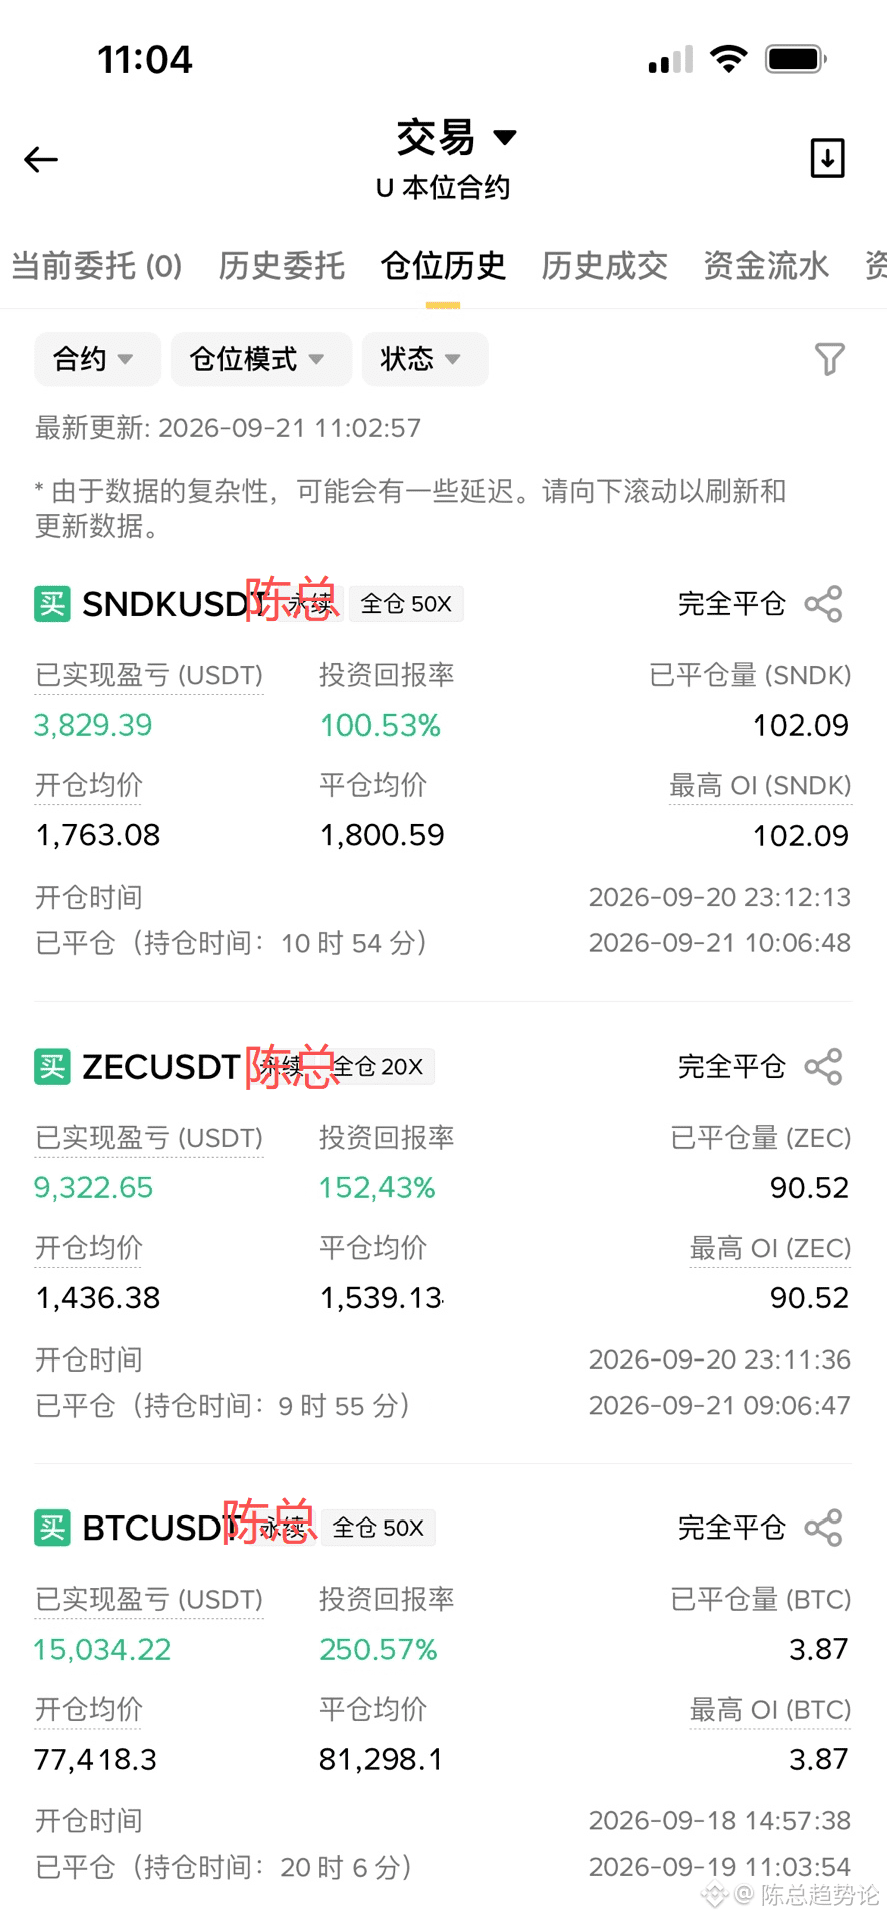
Nine years in the crypto圈, and six iron rules keep me alive till now
I’m Chen Zong, 35 years old. I’ve been soaking in this industry for nine years. I’ve been trading for a long time—my account once peaked at over 30 million, and I’ve also taken some hard falls. I’m still standing today, and it’s not fate. It’s the six rules I’ve stubbornly followed.
① Strong pull, slow decline—when the main force is accumulating
If it rallies hard and then the pullback is mild, chances are big money has quietly built a position. Don’t get scared off by a few small red candles—what they want is for you to leave. Look at the big picture; don’t fixate on a single line.
② A steep drop followed by a weak rebound—80% is distribution
If it suddenly dumps and can’t be pulled back, most likely the main force is selling. Don’t try to bottom-fish here—you’ll be likely to catch the coin halfway down.
③ High-volume at the top isn’t necessarily the peak
Many people panic when they see volume. Sometimes, it’s actually a signal to keep pushing higher. The truly dangerous situation is when there’s no volume at high levels—if nobody is stepping in, that’s when it’s over.
④ At the bottom, watch volume for consistency
One spike could be a false move. Only after several consecutive ones does it mean a consensus is forming—and then the market is more stable.
⑤ Don’t worship indicators—watch volume, that’s enough
The essence of the market is a battle of human nature. Emotions can’t be hidden; volume is the most honest. If you understand volume, you understand most of the order book.
⑥ Learn to go to cash—only then do you deserve the big opportunities
Don’t be greedy, don’t be afraid. Only those who can wait can hold on to the truly big行情.
One last line: the biggest enemy of trading isn’t the news—it’s you. The market always has variables. Stay calm and control your hands, and only then do you have the资格 to survive to the end
Nine years in the crypto圈, and six iron rules keep me alive till now
I’m Chen Zong, 35 years old. I’ve been soaking in this industry for nine years. I’ve been trading for a long time—my account once peaked at over 30 million, and I’ve also taken some hard falls. I’m still standing today, and it’s not fate. It’s the six rules I’ve stubbornly followed.
① Strong pull, slow decline—when the main force is accumulating
If it rallies hard and then the pullback is mild, chances are big money has quietly built a position. Don’t get scared off by a few small red candles—what they want is for you to leave. Look at the big picture; don’t fixate on a single line.
② A steep drop followed by a weak rebound—80% is distribution
If it suddenly dumps and can’t be pulled back, most likely the main force is selling. Don’t try to bottom-fish here—you’ll be likely to catch the coin halfway down.
③ High-volume at the top isn’t necessarily the peak
Many people panic when they see volume. Sometimes, it’s actually a signal to keep pushing higher. The truly dangerous situation is when there’s no volume at high levels—if nobody is stepping in, that’s when it’s over.
④ At the bottom, watch volume for consistency
One spike could be a false move. Only after several consecutive ones does it mean a consensus is forming—and then the market is more stable.
⑤ Don’t worship indicators—watch volume, that’s enough
The essence of the market is a battle of human nature. Emotions can’t be hidden; volume is the most honest. If you understand volume, you understand most of the order book.
⑥ Learn to go to cash—only then do you deserve the big opportunities
Don’t be greedy, don’t be afraid. Only those who can wait can hold on to the truly big行情.
One last line: the biggest enemy of trading isn’t the news—it’s you. The market always has variables. Stay calm and control your hands, and only then do you have the资格 to survive to the end
I’m Chen Zong, 35 years old. I’ve been soaking in this industry for nine years. I’ve been trading for a long time—my account once peaked at over 30 million, and I’ve also taken some hard falls. I’m still standing today, and it’s not fate. It’s the six rules I’ve stubbornly followed.
① Strong pull, slow decline—when the main force is accumulating
If it rallies hard and then the pullback is mild, chances are big money has quietly built a position. Don’t get scared off by a few small red candles—what they want is for you to leave. Look at the big picture; don’t fixate on a single line.
② A steep drop followed by a weak rebound—80% is distribution
If it suddenly dumps and can’t be pulled back, most likely the main force is selling. Don’t try to bottom-fish here—you’ll be likely to catch the coin halfway down.
③ High-volume at the top isn’t necessarily the peak
Many people panic when they see volume. Sometimes, it’s actually a signal to keep pushing higher. The truly dangerous situation is when there’s no volume at high levels—if nobody is stepping in, that’s when it’s over.
④ At the bottom, watch volume for consistency
One spike could be a false move. Only after several consecutive ones does it mean a consensus is forming—and then the market is more stable.
⑤ Don’t worship indicators—watch volume, that’s enough
The essence of the market is a battle of human nature. Emotions can’t be hidden; volume is the most honest. If you understand volume, you understand most of the order book.
⑥ Learn to go to cash—only then do you deserve the big opportunities
Don’t be greedy, don’t be afraid. Only those who can wait can hold on to the truly big行情.
One last line: the biggest enemy of trading isn’t the news—it’s you. The market always has variables. Stay calm and control your hands, and only then do you have the资格 to survive to the end
2
113
·
--
#multiversx计划协调硬分叉恢复
MultiversX has confirmed that someone exploited the “atomicity” vulnerability in a virtual machine and wrote invalid states onto the blockchain. The team’s response isn’t a patch-and-restart; instead, they’re preparing for a “coordinated hard fork”—restarting the chain from a verified clean checkpoint, which effectively means rolling the ledger back.
There are two things here: fixing the code and rolling back the ledger. The patch is about how the system should run going forward; the rollback is about the portion that has already been recorded. The former is an engineering issue, while the latter is more like setting rules for a chain that shouldn’t need to be rewritten.
So I’d like to ask one question: when it comes to this kind of “rewind” done to recover losses, would you rather treat it as an emergency measure—or as a precedent that shouldn’t be set?
One detail worth paying attention to: after this block-production pause, the 26 protocols in the MultiversX ecosystem have a combined total fund size of less than $10 million. The ledger can be rolled back, but once trust has been rolled back once, can it be rolled back again?
#multiversx计划协调硬分叉恢复
MultiversX has confirmed that someone exploited the “atomicity” vulnerability in a virtual machine and wrote invalid states onto the blockchain. The team’s response isn’t a patch-and-restart; instead, they’re preparing for a “coordinated hard fork”—restarting the chain from a verified clean checkpoint, which effectively means rolling the ledger back.
There are two things here: fixing the code and rolling back the ledger. The patch is about how the system should run going forward; the rollback is about the portion that has already been recorded. The former is an engineering issue, while the latter is more like setting rules for a chain that shouldn’t need to be rewritten.
So I’d like to ask one question: when it comes to this kind of “rewind” done to recover losses, would you rather treat it as an emergency measure—or as a precedent that shouldn’t be set?
One detail worth paying attention to: after this block-production pause, the 26 protocols in the MultiversX ecosystem have a combined total fund size of less than $10 million. The ledger can be rolled back, but once trust has been rolled back once, can it be rolled back again?
MultiversX has confirmed that someone exploited the “atomicity” vulnerability in a virtual machine and wrote invalid states onto the blockchain. The team’s response isn’t a patch-and-restart; instead, they’re preparing for a “coordinated hard fork”—restarting the chain from a verified clean checkpoint, which effectively means rolling the ledger back.
There are two things here: fixing the code and rolling back the ledger. The patch is about how the system should run going forward; the rollback is about the portion that has already been recorded. The former is an engineering issue, while the latter is more like setting rules for a chain that shouldn’t need to be rewritten.
So I’d like to ask one question: when it comes to this kind of “rewind” done to recover losses, would you rather treat it as an emergency measure—or as a precedent that shouldn’t be set?
One detail worth paying attention to: after this block-production pause, the 26 protocols in the MultiversX ecosystem have a combined total fund size of less than $10 million. The ledger can be rolled back, but once trust has been rolled back once, can it be rolled back again?
1
830
·
--
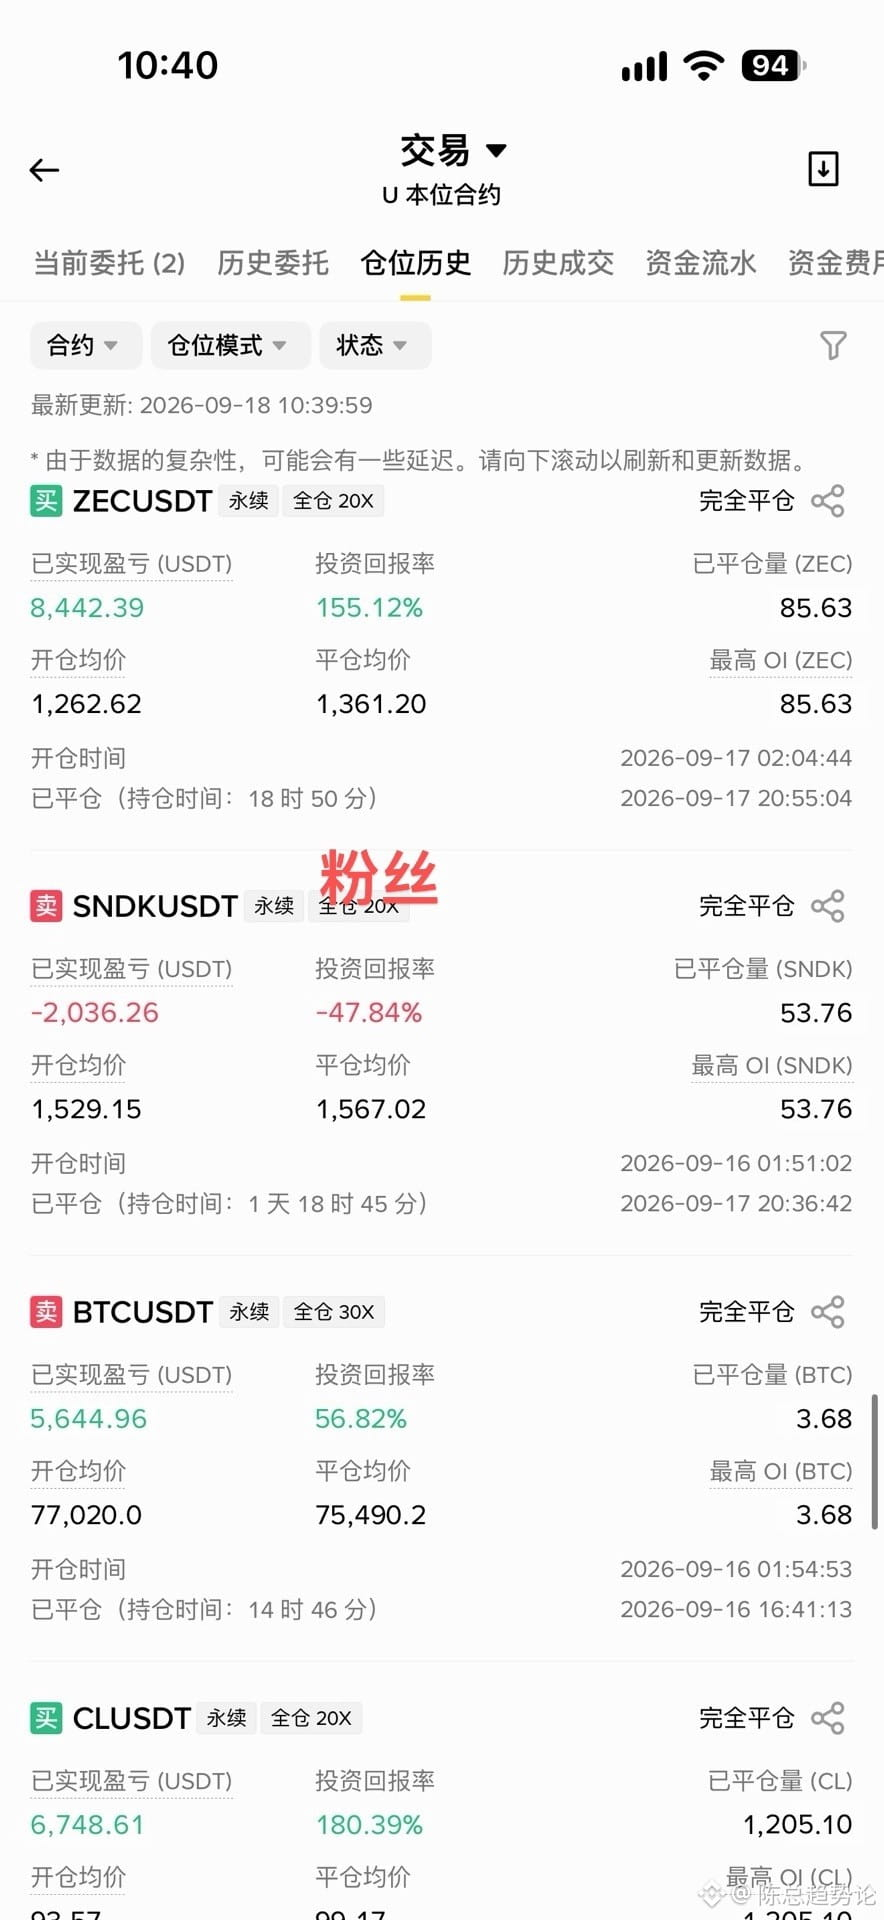
How long can a contract last? Don’t look at how much you make—look at how fast you cut losses$ZEC
In the crypto market, most people don’t die from the price action—they die from the line in their head: “Wait a bit more. It should come back.”$NEAR
Most people who just start with futures get trapped like this: they take the wrong direction and refuse to move; when they’re stuck in a losing position, they stubbornly hold on. A small loss slowly drags into a big loss, and in the end they’re forced to wipe out the account to zero.
Mature traders don’t think about how much this trade can profit before placing it. They think: if I’m wrong, what’s the maximum I can lose? Set the limit first, then decide the position size.
Typically, risk only 1%-2% of your principal per trade. Once you hit the stop-loss, you exit—no fantasies, no hard-headed fighting to the end.
Here’s a cruel fact: if your entry price is wrong, you can redo it. If you miss the move, there’s still another round. But once your principal is hurt too badly, even the best opportunities won’t be able to get you a seat at the table.
Many people, without realizing it, turn short-term trading into an endless “recovery” grind. It should’ve been a quick trade, but when they get stuck, they hope for a long-term turnaround. While losing, they comfort themselves: just hold on a bit longer. What they wear down isn’t only money—it’s their mindset.
The truly formidable aren’t those who only ever win—they’re the ones who dare to admit when they’re wrong. Accept small losses as the cost of doing business, and never let one mistake break through your entire account.
Futures trading isn’t about who can make the most—it’s about who can stay alive steadily. As long as your principal is there, opportunities will come. Control your risk, and only then will your market move finally be your turn#NEAR一周涨近80%
How long can a contract last? Don’t look at how much you make—look at how fast you cut losses$ZEC
In the crypto market, most people don’t die from the price action—they die from the line in their head: “Wait a bit more. It should come back.”$NEAR
Most people who just start with futures get trapped like this: they take the wrong direction and refuse to move; when they’re stuck in a losing position, they stubbornly hold on. A small loss slowly drags into a big loss, and in the end they’re forced to wipe out the account to zero.
Mature traders don’t think about how much this trade can profit before placing it. They think: if I’m wrong, what’s the maximum I can lose? Set the limit first, then decide the position size.
Typically, risk only 1%-2% of your principal per trade. Once you hit the stop-loss, you exit—no fantasies, no hard-headed fighting to the end.
Here’s a cruel fact: if your entry price is wrong, you can redo it. If you miss the move, there’s still another round. But once your principal is hurt too badly, even the best opportunities won’t be able to get you a seat at the table.
Many people, without realizing it, turn short-term trading into an endless “recovery” grind. It should’ve been a quick trade, but when they get stuck, they hope for a long-term turnaround. While losing, they comfort themselves: just hold on a bit longer. What they wear down isn’t only money—it’s their mindset.
The truly formidable aren’t those who only ever win—they’re the ones who dare to admit when they’re wrong. Accept small losses as the cost of doing business, and never let one mistake break through your entire account.
Futures trading isn’t about who can make the most—it’s about who can stay alive steadily. As long as your principal is there, opportunities will come. Control your risk, and only then will your market move finally be your turn#NEAR一周涨近80%
In the crypto market, most people don’t die from the price action—they die from the line in their head: “Wait a bit more. It should come back.”$NEAR
Most people who just start with futures get trapped like this: they take the wrong direction and refuse to move; when they’re stuck in a losing position, they stubbornly hold on. A small loss slowly drags into a big loss, and in the end they’re forced to wipe out the account to zero.
Mature traders don’t think about how much this trade can profit before placing it. They think: if I’m wrong, what’s the maximum I can lose? Set the limit first, then decide the position size.
Typically, risk only 1%-2% of your principal per trade. Once you hit the stop-loss, you exit—no fantasies, no hard-headed fighting to the end.
Here’s a cruel fact: if your entry price is wrong, you can redo it. If you miss the move, there’s still another round. But once your principal is hurt too badly, even the best opportunities won’t be able to get you a seat at the table.
Many people, without realizing it, turn short-term trading into an endless “recovery” grind. It should’ve been a quick trade, but when they get stuck, they hope for a long-term turnaround. While losing, they comfort themselves: just hold on a bit longer. What they wear down isn’t only money—it’s their mindset.
The truly formidable aren’t those who only ever win—they’re the ones who dare to admit when they’re wrong. Accept small losses as the cost of doing business, and never let one mistake break through your entire account.
Futures trading isn’t about who can make the most—it’s about who can stay alive steadily. As long as your principal is there, opportunities will come. Control your risk, and only then will your market move finally be your turn#NEAR一周涨近80%
1
49
·
--
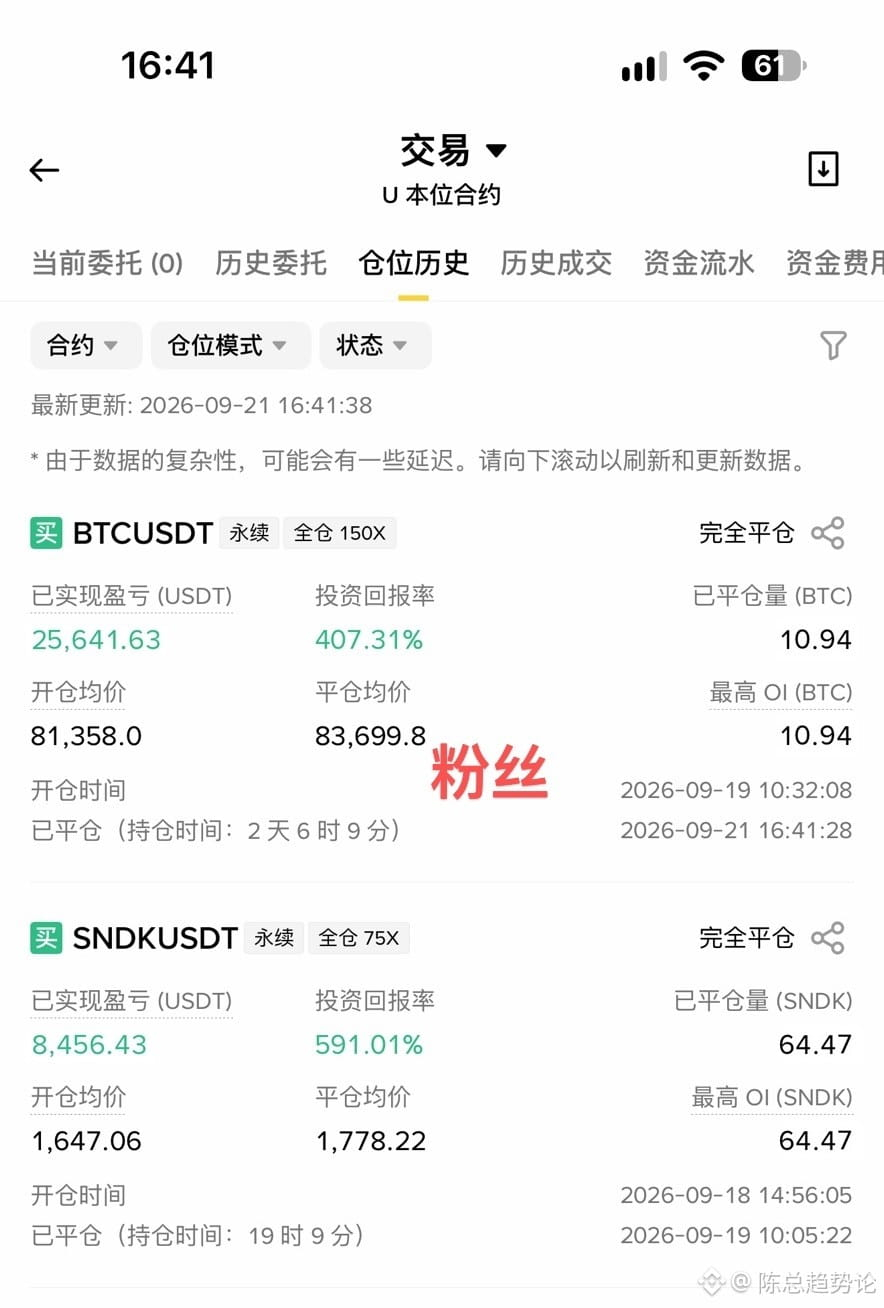
I’ve also gone through a few blowups. That’s when it finally clicked for me: if you want to keep trading for the long run, it’s never about how precise your prediction is in a single moment. It’s about whether, when you make a mistake, you can respond in time and contain the loss.
Back then, like most traders, once I thought I had the direction right, I’d get carried away. I’d be convinced my analysis couldn’t be wrong, and when opening a trade I’d almost want to go all-in—betting everything on a single position, thinking one trade could maximize the gains.
But the market never follows your expectations. Even if you eventually get the direction right, one routine fluctuation in the middle—especially with positions that are too heavy—can smash both your mindset and your account.
Later, I gradually adjusted my trading pace. I stopped forcing every single trade to yield huge returns. My first priority became ensuring I could stay at the table for good.
Now, before I place any trade, risk management comes first. My first entry uses a small position to test and validate. If my direction is wrong, I strictly follow the plan to cut losses and lock the loss within a range I can tolerate, so one mistake doesn’t throw off the rhythm of my future trades.
If the price moves in line with expectations, I don’t rush to add size either. I wait until the trend becomes fully clear and the profits are steadily locked in, then consider adding positions in batches. The stronger the market, the more meaningful the add-on trades. And if the price starts acting abnormally, I proactively reduce exposure immediately to protect the profits I’ve already secured.
Most people fail not because they don’t have methods, but because, during execution, they’re constantly being led by emotions. When they win, they get greedy, convinced the price can go even higher, and they refuse to take profit. When they lose, they stubbornly refuse to admit fault, hoping the market will turn around—until a small loss grows into an unmanageable disaster.
In the end, trading isn’t about who can predict the market best. It’s about who can hold firmly to their trading rules in the face of the market’s countless temptations.
These lessons may sound simple, but actually doing them in practice is not easy. Control your position size well, accept small losses calmly, and actively protect your profits. Make every trade strictly according to plan—that’s the core reason an ordinary trader can survive in the market long term.
The market never lacks new opportunities, but the prerequisite is that your account is still alive. Learn first how to manage yourself, and only then talk about how to grow your capital step by step.
I’ve also gone through a few blowups. That’s when it finally clicked for me: if you want to keep trading for the long run, it’s never about how precise your prediction is in a single moment. It’s about whether, when you make a mistake, you can respond in time and contain the loss.
Back then, like most traders, once I thought I had the direction right, I’d get carried away. I’d be convinced my analysis couldn’t be wrong, and when opening a trade I’d almost want to go all-in—betting everything on a single position, thinking one trade could maximize the gains.
But the market never follows your expectations. Even if you eventually get the direction right, one routine fluctuation in the middle—especially with positions that are too heavy—can smash both your mindset and your account.
Later, I gradually adjusted my trading pace. I stopped forcing every single trade to yield huge returns. My first priority became ensuring I could stay at the table for good.
Now, before I place any trade, risk management comes first. My first entry uses a small position to test and validate. If my direction is wrong, I strictly follow the plan to cut losses and lock the loss within a range I can tolerate, so one mistake doesn’t throw off the rhythm of my future trades.
If the price moves in line with expectations, I don’t rush to add size either. I wait until the trend becomes fully clear and the profits are steadily locked in, then consider adding positions in batches. The stronger the market, the more meaningful the add-on trades. And if the price starts acting abnormally, I proactively reduce exposure immediately to protect the profits I’ve already secured.
Most people fail not because they don’t have methods, but because, during execution, they’re constantly being led by emotions. When they win, they get greedy, convinced the price can go even higher, and they refuse to take profit. When they lose, they stubbornly refuse to admit fault, hoping the market will turn around—until a small loss grows into an unmanageable disaster.
In the end, trading isn’t about who can predict the market best. It’s about who can hold firmly to their trading rules in the face of the market’s countless temptations.
These lessons may sound simple, but actually doing them in practice is not easy. Control your position size well, accept small losses calmly, and actively protect your profits. Make every trade strictly according to plan—that’s the core reason an ordinary trader can survive in the market long term.
The market never lacks new opportunities, but the prerequisite is that your account is still alive. Learn first how to manage yourself, and only then talk about how to grow your capital step by step.
Back then, like most traders, once I thought I had the direction right, I’d get carried away. I’d be convinced my analysis couldn’t be wrong, and when opening a trade I’d almost want to go all-in—betting everything on a single position, thinking one trade could maximize the gains.
But the market never follows your expectations. Even if you eventually get the direction right, one routine fluctuation in the middle—especially with positions that are too heavy—can smash both your mindset and your account.
Later, I gradually adjusted my trading pace. I stopped forcing every single trade to yield huge returns. My first priority became ensuring I could stay at the table for good.
Now, before I place any trade, risk management comes first. My first entry uses a small position to test and validate. If my direction is wrong, I strictly follow the plan to cut losses and lock the loss within a range I can tolerate, so one mistake doesn’t throw off the rhythm of my future trades.
If the price moves in line with expectations, I don’t rush to add size either. I wait until the trend becomes fully clear and the profits are steadily locked in, then consider adding positions in batches. The stronger the market, the more meaningful the add-on trades. And if the price starts acting abnormally, I proactively reduce exposure immediately to protect the profits I’ve already secured.
Most people fail not because they don’t have methods, but because, during execution, they’re constantly being led by emotions. When they win, they get greedy, convinced the price can go even higher, and they refuse to take profit. When they lose, they stubbornly refuse to admit fault, hoping the market will turn around—until a small loss grows into an unmanageable disaster.
In the end, trading isn’t about who can predict the market best. It’s about who can hold firmly to their trading rules in the face of the market’s countless temptations.
These lessons may sound simple, but actually doing them in practice is not easy. Control your position size well, accept small losses calmly, and actively protect your profits. Make every trade strictly according to plan—that’s the core reason an ordinary trader can survive in the market long term.
The market never lacks new opportunities, but the prerequisite is that your account is still alive. Learn first how to manage yourself, and only then talk about how to grow your capital step by step.
1
143
·
--
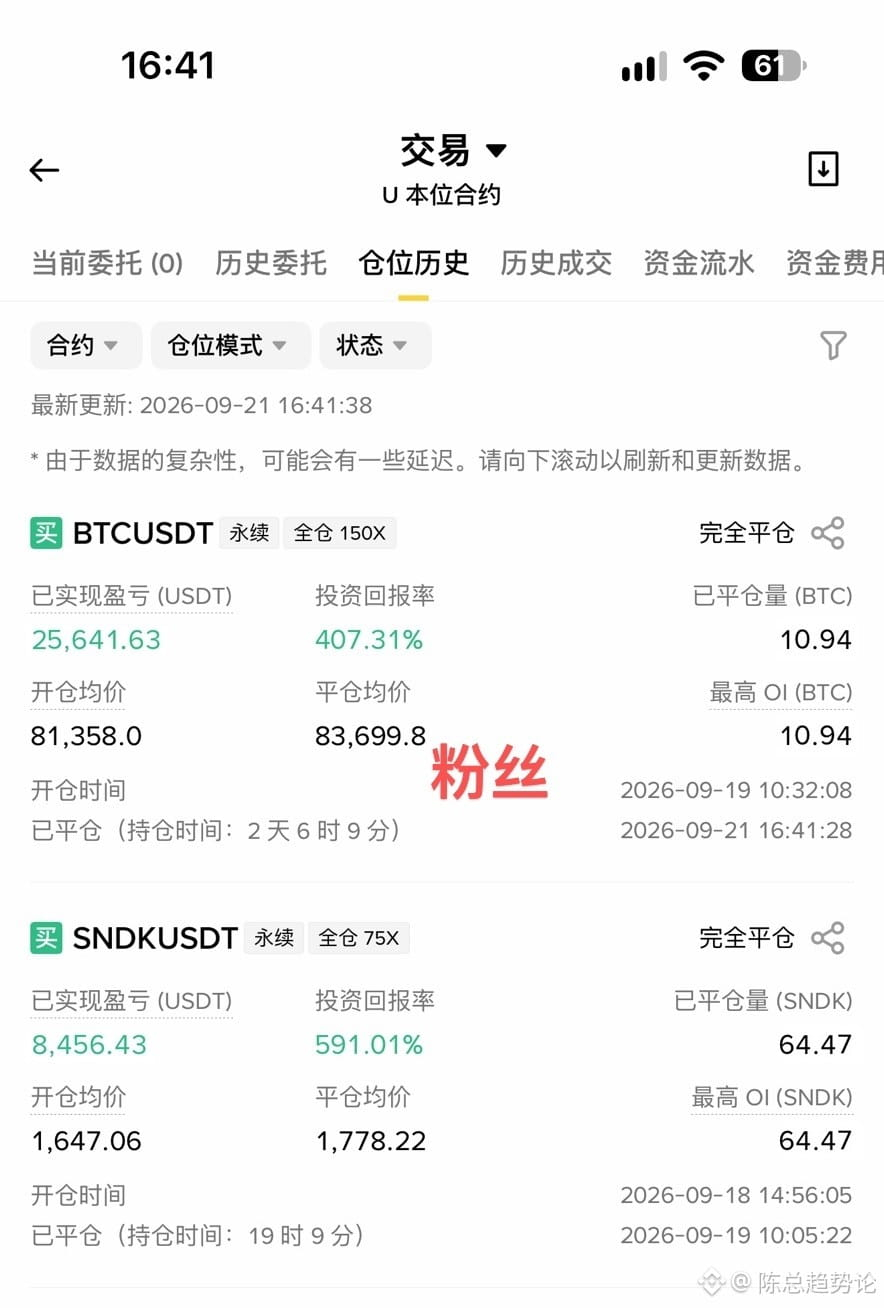
Many traders feel that losing money is simply because their direction was wrong.
But people who can’t stick with it long-term usually aren’t bad at technicals. More often, they just can’t control themselves at crucial moments. I had a follower who was extremely good at reading charts—support and resistance levels, he could hit them precisely. Yet his account never really took off. When he lost, he would stubbornly hold on and refuse to cut losses. When he won, he was greedy and wouldn’t take profit. In the end, all his gains were given back to the market.
He asked me how to quickly grow with a small amount of capital. I told him: Making money is not a problem, but the most dangerous thing is being too eager to make it.
When many people first enter the market, their execution is still solid. They understand light sizing and know how to wait for opportunities. But after a few rounds of wins and losses, their mindset goes off track: losing makes them want to break even, while winning makes them want more. After making a few mistakes, they start placing revenge trades.
What the market truly tests is never just your judgment—it’s your self-control. In the end, trading isn’t about who knows more indicators, but about who can hold on to the rules in the face of temptation. Crypto opportunities are always there, but not every wave of the market belongs to you.
A small account doesn’t need to chase big moves every day. First protect your principal, control your position size, and keep executing consistently. If you can manage your hands, then you truly know how to trade. The market always rewards the patient—not the gamblers who are desperate to get rich overnight.
Many traders feel that losing money is simply because their direction was wrong.
But people who can’t stick with it long-term usually aren’t bad at technicals. More often, they just can’t control themselves at crucial moments. I had a follower who was extremely good at reading charts—support and resistance levels, he could hit them precisely. Yet his account never really took off. When he lost, he would stubbornly hold on and refuse to cut losses. When he won, he was greedy and wouldn’t take profit. In the end, all his gains were given back to the market.
He asked me how to quickly grow with a small amount of capital. I told him: Making money is not a problem, but the most dangerous thing is being too eager to make it.
When many people first enter the market, their execution is still solid. They understand light sizing and know how to wait for opportunities. But after a few rounds of wins and losses, their mindset goes off track: losing makes them want to break even, while winning makes them want more. After making a few mistakes, they start placing revenge trades.
What the market truly tests is never just your judgment—it’s your self-control. In the end, trading isn’t about who knows more indicators, but about who can hold on to the rules in the face of temptation. Crypto opportunities are always there, but not every wave of the market belongs to you.
A small account doesn’t need to chase big moves every day. First protect your principal, control your position size, and keep executing consistently. If you can manage your hands, then you truly know how to trade. The market always rewards the patient—not the gamblers who are desperate to get rich overnight.
But people who can’t stick with it long-term usually aren’t bad at technicals. More often, they just can’t control themselves at crucial moments. I had a follower who was extremely good at reading charts—support and resistance levels, he could hit them precisely. Yet his account never really took off. When he lost, he would stubbornly hold on and refuse to cut losses. When he won, he was greedy and wouldn’t take profit. In the end, all his gains were given back to the market.
He asked me how to quickly grow with a small amount of capital. I told him: Making money is not a problem, but the most dangerous thing is being too eager to make it.
When many people first enter the market, their execution is still solid. They understand light sizing and know how to wait for opportunities. But after a few rounds of wins and losses, their mindset goes off track: losing makes them want to break even, while winning makes them want more. After making a few mistakes, they start placing revenge trades.
What the market truly tests is never just your judgment—it’s your self-control. In the end, trading isn’t about who knows more indicators, but about who can hold on to the rules in the face of temptation. Crypto opportunities are always there, but not every wave of the market belongs to you.
A small account doesn’t need to chase big moves every day. First protect your principal, control your position size, and keep executing consistently. If you can manage your hands, then you truly know how to trade. The market always rewards the patient—not the gamblers who are desperate to get rich overnight.
1
184
·
--
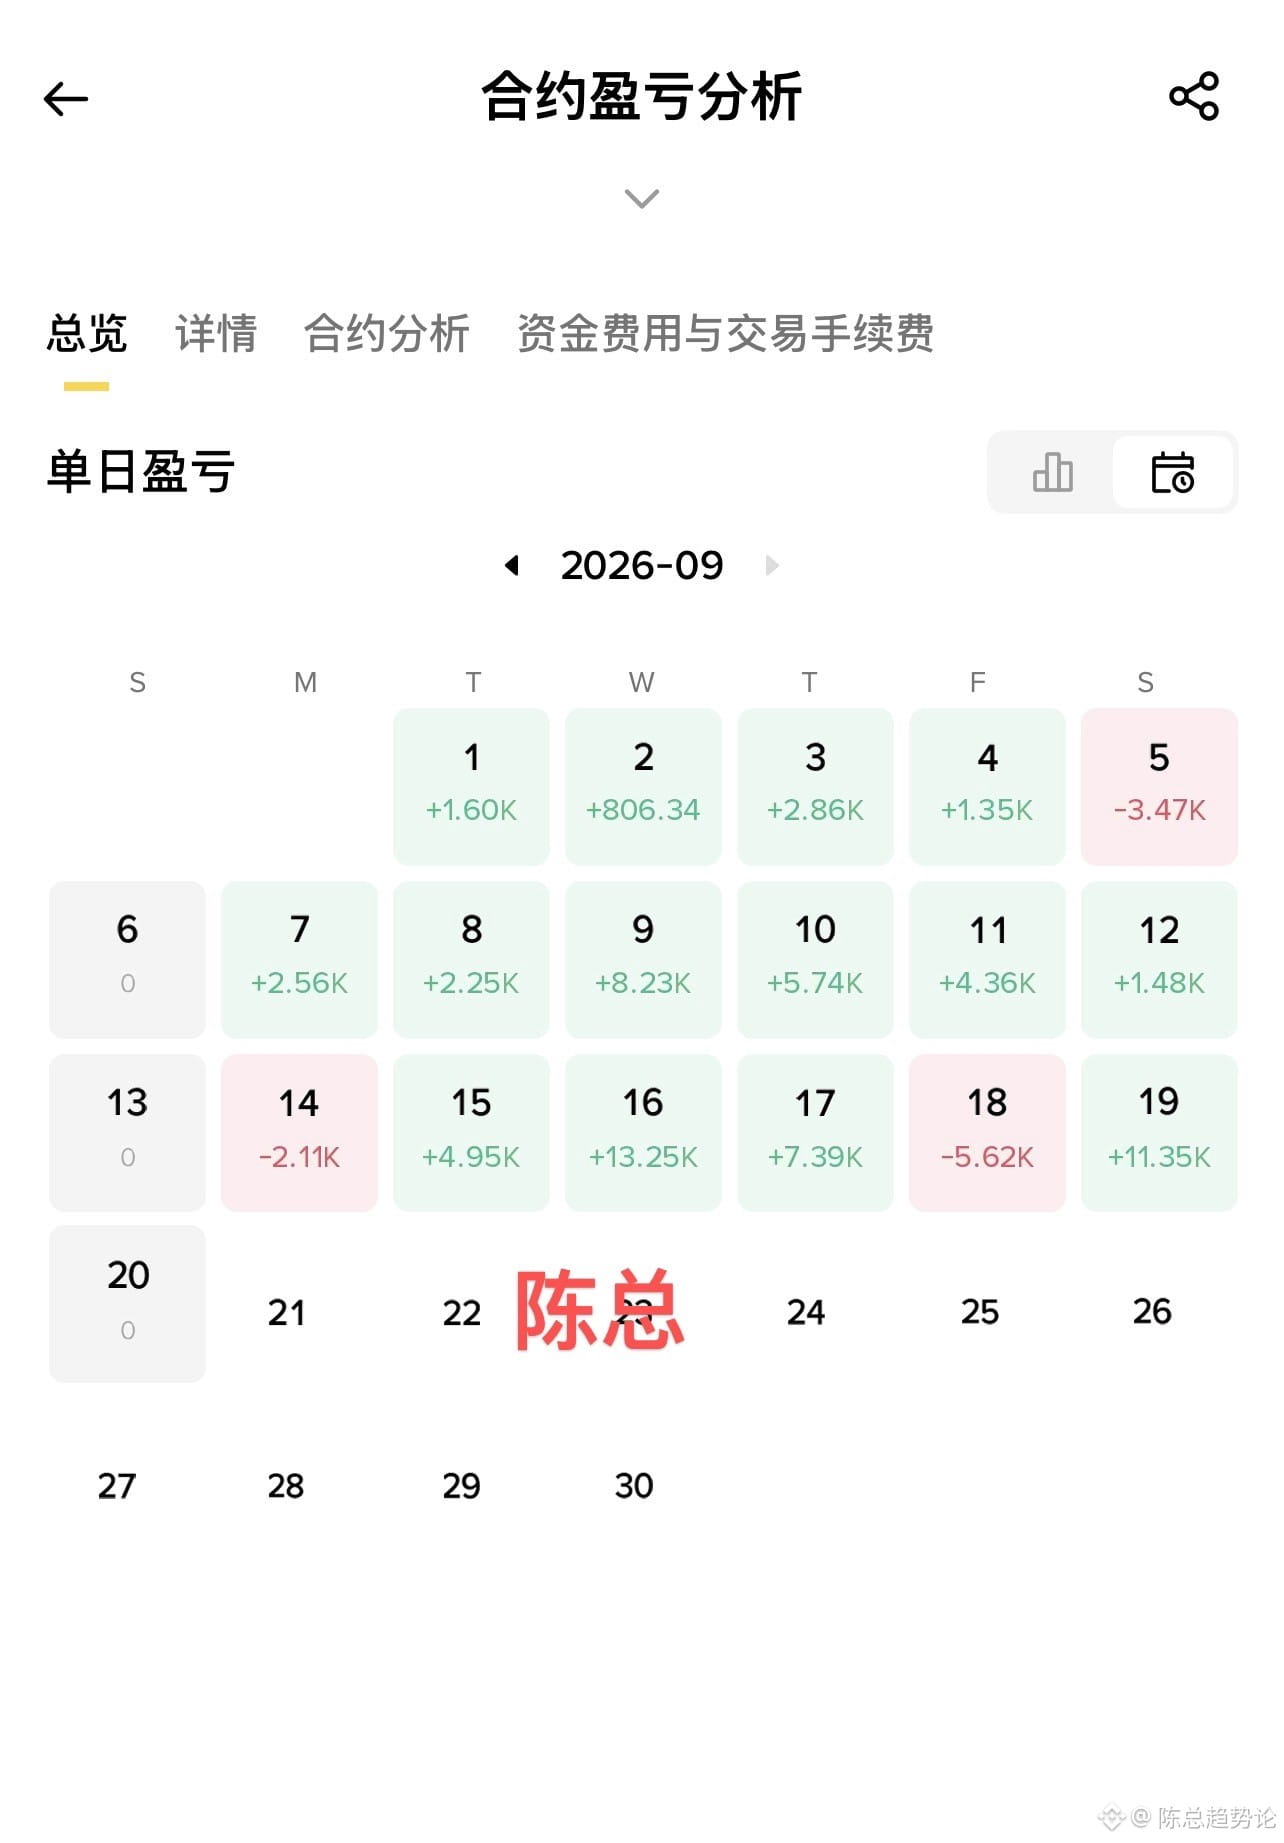
Just entered the crypto circle, and you always end up blaming bad luck for losing money—missing the big breakout opportunity.
But what most people lack isn’t opportunities. It’s not figuring out what trading style matches their own funds and personality. The market is never short of opportunities. What’s missing is a trading method you can put into practice over the long term.
If your funds are more conservative, then scale into mainstream assets in batches. Stretch the timeline and rely on compounding to make steady money—you don’t have to guess tops and bottoms every day.
If you want to boost returns, anchor yourself to the market’s main narrative and dig deep into one sector, instead of chasing random small coins and going on a killing spree everywhere.
If you like trading, do it with the trend. When the market gets messy, open fewer positions—don’t burn through your principal with constant, frequent trades.
Don’t gamble with futures. It’s only an amplifier. Position sizing, low leverage, and strict stop-loss discipline are the core.
In crypto, there’s no universal playbook. Don’t be fixated on becoming wildly rich with a small account, and don’t stubbornly hold on through high-risk moves with a large one. Do layered position management: hold core positions long-term, follow the trend in the medium term, and capture opportunities in the short term.
Remember these three iron rules: never go all-in, never follow the crowd, and never stop updating your understanding. Opportunities are always there. Whoever can catch them is the one who’s prepared in advance and can control themselves.
Just entered the crypto circle, and you always end up blaming bad luck for losing money—missing the big breakout opportunity.
But what most people lack isn’t opportunities. It’s not figuring out what trading style matches their own funds and personality. The market is never short of opportunities. What’s missing is a trading method you can put into practice over the long term.
If your funds are more conservative, then scale into mainstream assets in batches. Stretch the timeline and rely on compounding to make steady money—you don’t have to guess tops and bottoms every day.
If you want to boost returns, anchor yourself to the market’s main narrative and dig deep into one sector, instead of chasing random small coins and going on a killing spree everywhere.
If you like trading, do it with the trend. When the market gets messy, open fewer positions—don’t burn through your principal with constant, frequent trades.
Don’t gamble with futures. It’s only an amplifier. Position sizing, low leverage, and strict stop-loss discipline are the core.
In crypto, there’s no universal playbook. Don’t be fixated on becoming wildly rich with a small account, and don’t stubbornly hold on through high-risk moves with a large one. Do layered position management: hold core positions long-term, follow the trend in the medium term, and capture opportunities in the short term.
Remember these three iron rules: never go all-in, never follow the crowd, and never stop updating your understanding. Opportunities are always there. Whoever can catch them is the one who’s prepared in advance and can control themselves.
But what most people lack isn’t opportunities. It’s not figuring out what trading style matches their own funds and personality. The market is never short of opportunities. What’s missing is a trading method you can put into practice over the long term.
If your funds are more conservative, then scale into mainstream assets in batches. Stretch the timeline and rely on compounding to make steady money—you don’t have to guess tops and bottoms every day.
If you want to boost returns, anchor yourself to the market’s main narrative and dig deep into one sector, instead of chasing random small coins and going on a killing spree everywhere.
If you like trading, do it with the trend. When the market gets messy, open fewer positions—don’t burn through your principal with constant, frequent trades.
Don’t gamble with futures. It’s only an amplifier. Position sizing, low leverage, and strict stop-loss discipline are the core.
In crypto, there’s no universal playbook. Don’t be fixated on becoming wildly rich with a small account, and don’t stubbornly hold on through high-risk moves with a large one. Do layered position management: hold core positions long-term, follow the trend in the medium term, and capture opportunities in the short term.
Remember these three iron rules: never go all-in, never follow the crowd, and never stop updating your understanding. Opportunities are always there. Whoever can catch them is the one who’s prepared in advance and can control themselves.
1
12
·
--
In the crypto market, there’s a seemingly clumsy method that many veteran traders—those who have successfully made it through several bull-and-bear cycles—are quietly following.
Most people don’t lose money because they can’t read the charts. It’s because their trading habits are a complete mess: when prices rise, they’re afraid of missing out and rush in chasing; when the market pulls back, they panic and average down; once trapped, they stubbornly hold without cutting losses, turning a small loss into a much larger “death by a thousand cuts.”
If you want to survive in the market for a long time, the first step is not to dig for a shortcut to get rich. It’s to first eliminate these basic, low-level mistakes.
Don’t chase a frenzy that’s already run wild. The strength you see as a powerful breakout is often a “harvest” move that someone else has already set up and planned in advance. When market sentiment is at its most overheated, it’s usually also when risk has been piled up to the peak.
The truly comfortable opportunities to act are hidden in the price after sufficient adjustment, in the emotion “ice point” when everyone has lost confidence. Patience is far more useful than blindly chasing rallies.
If you’re in a loss, don’t keep adding positions to rescue a trade. Many people think averaging down can help them get back to breakeven quickly—but when you’ve been wrong about the direction at the root, averaging down only makes the risk grow bigger and bigger. Sensible adding is always based on trend confirmation and the trading logic remaining intact; it’s never for forcing a wrong trade back to life.
And don’t “hold to the end” either. Cutting losses isn’t admitting defeat—it’s leaving room for the next opportunity. Nobody can always be right in the market. Great traders are not those who never lose; they’re the ones who can lock in a single loss so that one wrong trade doesn’t wipe out the entire account.
Trading really doesn’t have that many tricks: find a good margin of safety, test with a small position, add gradually once the trend is clear, and when you reach your targets, lock in profits in batches. These simple rules are precisely what most people find hardest to stick to.
Many people hope to catch a doubling-type move every day. But those who actually roll their accounts up do it entirely by repeatedly controlling risk and strictly following discipline.
The crypto market has never been about who’s braver. It’s about who can stay calm and endure through multiple cycles. Moving slower is fine. As long as your principal is still there, opportunities will never be absent.
In the crypto market, there’s a seemingly clumsy method that many veteran traders—those who have successfully made it through several bull-and-bear cycles—are quietly following.
Most people don’t lose money because they can’t read the charts. It’s because their trading habits are a complete mess: when prices rise, they’re afraid of missing out and rush in chasing; when the market pulls back, they panic and average down; once trapped, they stubbornly hold without cutting losses, turning a small loss into a much larger “death by a thousand cuts.”
If you want to survive in the market for a long time, the first step is not to dig for a shortcut to get rich. It’s to first eliminate these basic, low-level mistakes.
Don’t chase a frenzy that’s already run wild. The strength you see as a powerful breakout is often a “harvest” move that someone else has already set up and planned in advance. When market sentiment is at its most overheated, it’s usually also when risk has been piled up to the peak.
The truly comfortable opportunities to act are hidden in the price after sufficient adjustment, in the emotion “ice point” when everyone has lost confidence. Patience is far more useful than blindly chasing rallies.
If you’re in a loss, don’t keep adding positions to rescue a trade. Many people think averaging down can help them get back to breakeven quickly—but when you’ve been wrong about the direction at the root, averaging down only makes the risk grow bigger and bigger. Sensible adding is always based on trend confirmation and the trading logic remaining intact; it’s never for forcing a wrong trade back to life.
And don’t “hold to the end” either. Cutting losses isn’t admitting defeat—it’s leaving room for the next opportunity. Nobody can always be right in the market. Great traders are not those who never lose; they’re the ones who can lock in a single loss so that one wrong trade doesn’t wipe out the entire account.
Trading really doesn’t have that many tricks: find a good margin of safety, test with a small position, add gradually once the trend is clear, and when you reach your targets, lock in profits in batches. These simple rules are precisely what most people find hardest to stick to.
Many people hope to catch a doubling-type move every day. But those who actually roll their accounts up do it entirely by repeatedly controlling risk and strictly following discipline.
The crypto market has never been about who’s braver. It’s about who can stay calm and endure through multiple cycles. Moving slower is fine. As long as your principal is still there, opportunities will never be absent.
Most people don’t lose money because they can’t read the charts. It’s because their trading habits are a complete mess: when prices rise, they’re afraid of missing out and rush in chasing; when the market pulls back, they panic and average down; once trapped, they stubbornly hold without cutting losses, turning a small loss into a much larger “death by a thousand cuts.”
If you want to survive in the market for a long time, the first step is not to dig for a shortcut to get rich. It’s to first eliminate these basic, low-level mistakes.
Don’t chase a frenzy that’s already run wild. The strength you see as a powerful breakout is often a “harvest” move that someone else has already set up and planned in advance. When market sentiment is at its most overheated, it’s usually also when risk has been piled up to the peak.
The truly comfortable opportunities to act are hidden in the price after sufficient adjustment, in the emotion “ice point” when everyone has lost confidence. Patience is far more useful than blindly chasing rallies.
If you’re in a loss, don’t keep adding positions to rescue a trade. Many people think averaging down can help them get back to breakeven quickly—but when you’ve been wrong about the direction at the root, averaging down only makes the risk grow bigger and bigger. Sensible adding is always based on trend confirmation and the trading logic remaining intact; it’s never for forcing a wrong trade back to life.
And don’t “hold to the end” either. Cutting losses isn’t admitting defeat—it’s leaving room for the next opportunity. Nobody can always be right in the market. Great traders are not those who never lose; they’re the ones who can lock in a single loss so that one wrong trade doesn’t wipe out the entire account.
Trading really doesn’t have that many tricks: find a good margin of safety, test with a small position, add gradually once the trend is clear, and when you reach your targets, lock in profits in batches. These simple rules are precisely what most people find hardest to stick to.
Many people hope to catch a doubling-type move every day. But those who actually roll their accounts up do it entirely by repeatedly controlling risk and strictly following discipline.
The crypto market has never been about who’s braver. It’s about who can stay calm and endure through multiple cycles. Moving slower is fine. As long as your principal is still there, opportunities will never be absent.
1
56
·
--
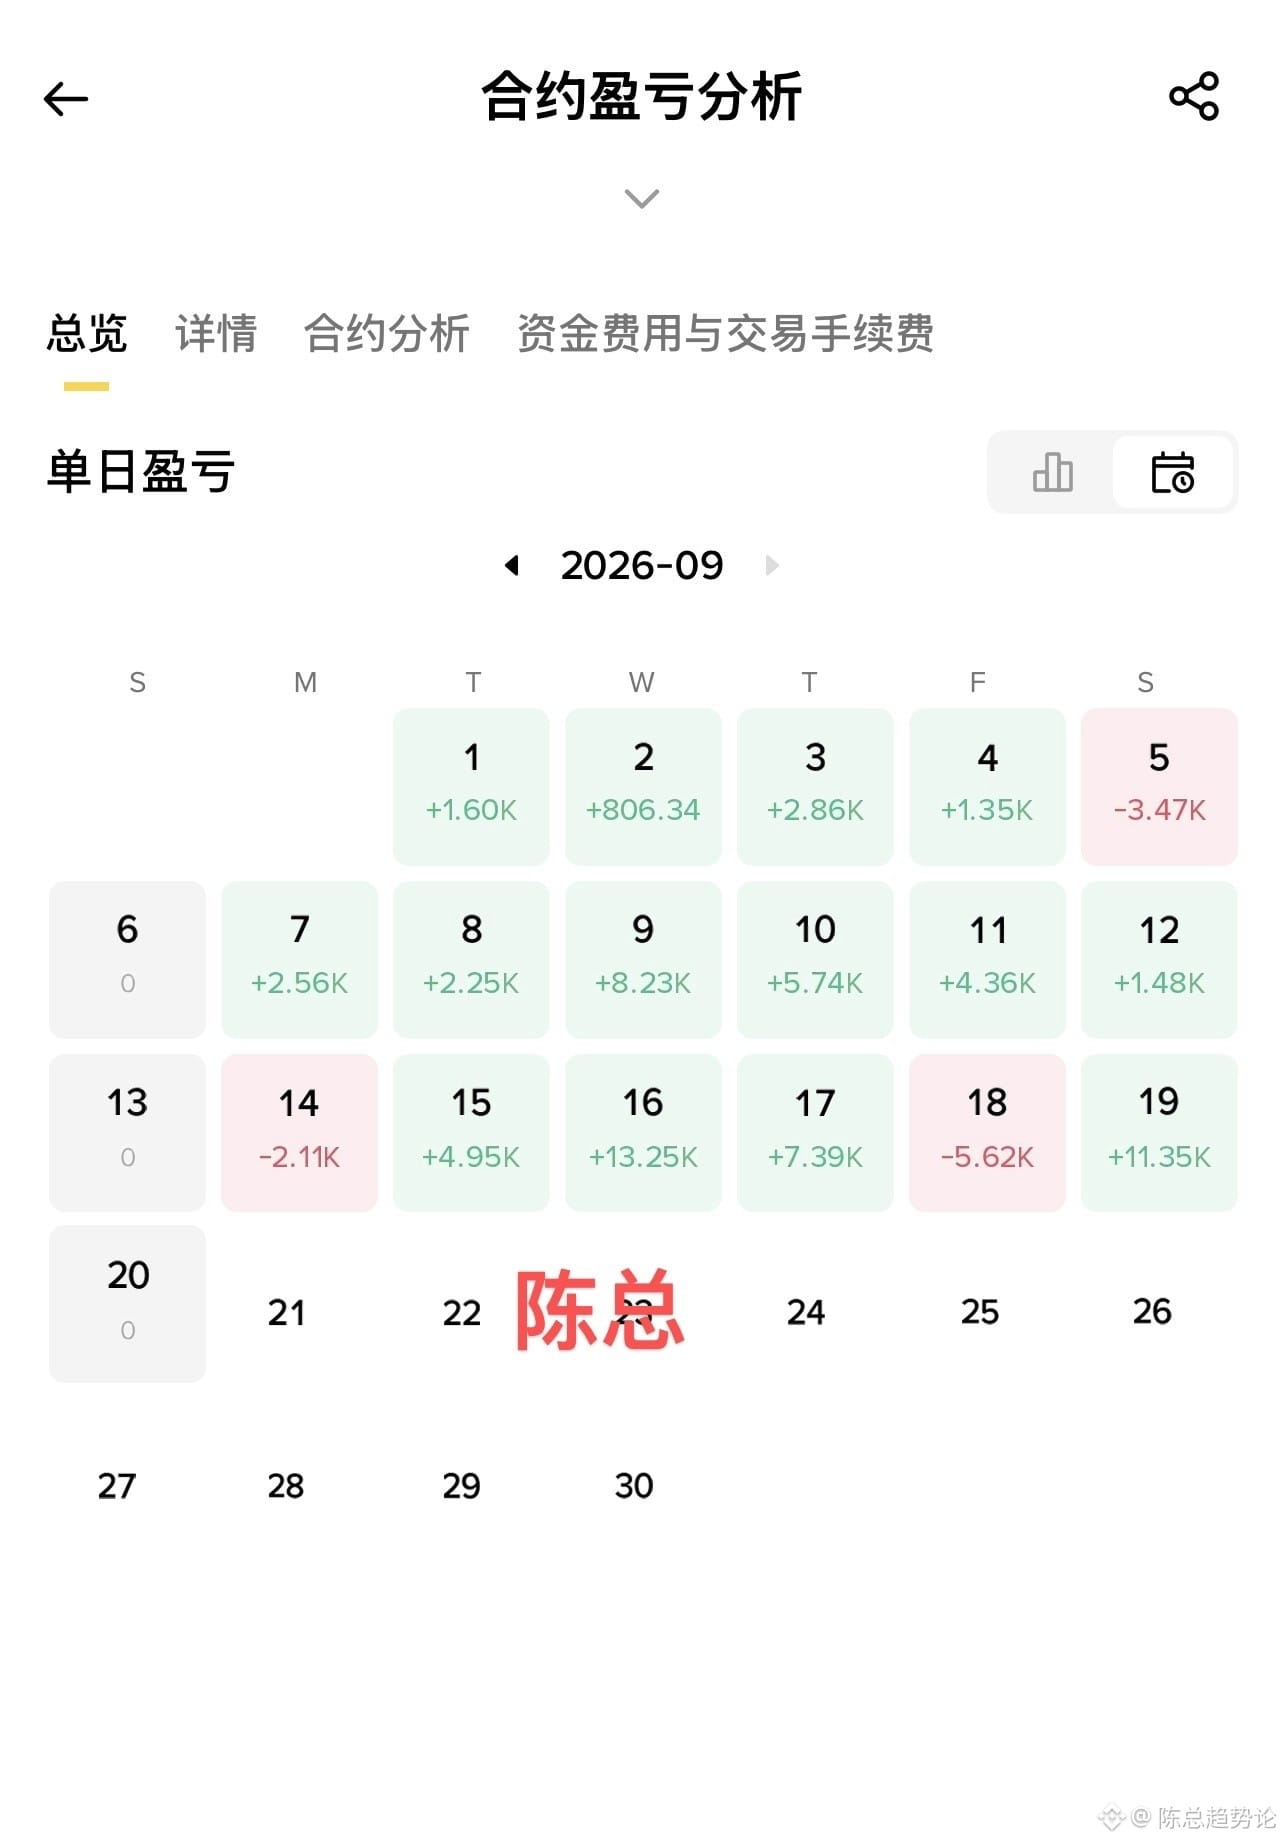
Say something that stings but is true: many people lose money on futures contracts—not because the technology isn’t good, but because they didn’t understand what they’re doing from the very first step of placing an order.
Opening trades on a whim without looking at supporting and resistance levels, not calculating how much loss you can truly withstand; when you win you get greedy and refuse to exit, and when you lose you just stubbornly wait for a rebound. After a few rounds of this, the account gets thinner and thinner.
If you’re still repeatedly losing in futures, first fix these bad habits:
First, lock in your plan before placing a trade. Don’t start by thinking about how much you can profit from this single trade; instead, think about how you’ll cover your mistakes. Take-profit to curb greed, stop-loss to protect principal. The market will always have another opportunity—once your principal is gone, you have no chance at all.
Second, don’t get addicted to high-frequency trading. Many people think the more trades you make, the more you’ll earn. After a day of rushing around, you end up paying a pile of fees, with no real profit to show for it. Trading isn’t about how many times you place orders—it’s about whether you can wait for high-confidence opportunities.
Third, if you don’t understand, stay out of the market and wait. Being in cash isn’t being timid; it’s protecting your capital. The market moves every day, but not every move is worth you jumping in. A lot of losses come from being afraid to miss out—hard-chasing into positions you don’t even understand.
Fourth, don’t always think you can flip everything with an all-in move. Growing a small account gradually comes from controlling risk and compounding steadily—not from betting your luck with all in.
The people who manage to survive in futures contracts aren’t the most daring gamblers. They’re the ones who know when to act and when to stop.
The biggest enemy in futures contracts is never the market—it’s the you without rules. First make sure your account can keep staying at the table, then talk about how to amplify returns.
Say something that stings but is true: many people lose money on futures contracts—not because the technology isn’t good, but because they didn’t understand what they’re doing from the very first step of placing an order.
Opening trades on a whim without looking at supporting and resistance levels, not calculating how much loss you can truly withstand; when you win you get greedy and refuse to exit, and when you lose you just stubbornly wait for a rebound. After a few rounds of this, the account gets thinner and thinner.
If you’re still repeatedly losing in futures, first fix these bad habits:
First, lock in your plan before placing a trade. Don’t start by thinking about how much you can profit from this single trade; instead, think about how you’ll cover your mistakes. Take-profit to curb greed, stop-loss to protect principal. The market will always have another opportunity—once your principal is gone, you have no chance at all.
Second, don’t get addicted to high-frequency trading. Many people think the more trades you make, the more you’ll earn. After a day of rushing around, you end up paying a pile of fees, with no real profit to show for it. Trading isn’t about how many times you place orders—it’s about whether you can wait for high-confidence opportunities.
Third, if you don’t understand, stay out of the market and wait. Being in cash isn’t being timid; it’s protecting your capital. The market moves every day, but not every move is worth you jumping in. A lot of losses come from being afraid to miss out—hard-chasing into positions you don’t even understand.
Fourth, don’t always think you can flip everything with an all-in move. Growing a small account gradually comes from controlling risk and compounding steadily—not from betting your luck with all in.
The people who manage to survive in futures contracts aren’t the most daring gamblers. They’re the ones who know when to act and when to stop.
The biggest enemy in futures contracts is never the market—it’s the you without rules. First make sure your account can keep staying at the table, then talk about how to amplify returns.
Opening trades on a whim without looking at supporting and resistance levels, not calculating how much loss you can truly withstand; when you win you get greedy and refuse to exit, and when you lose you just stubbornly wait for a rebound. After a few rounds of this, the account gets thinner and thinner.
If you’re still repeatedly losing in futures, first fix these bad habits:
First, lock in your plan before placing a trade. Don’t start by thinking about how much you can profit from this single trade; instead, think about how you’ll cover your mistakes. Take-profit to curb greed, stop-loss to protect principal. The market will always have another opportunity—once your principal is gone, you have no chance at all.
Second, don’t get addicted to high-frequency trading. Many people think the more trades you make, the more you’ll earn. After a day of rushing around, you end up paying a pile of fees, with no real profit to show for it. Trading isn’t about how many times you place orders—it’s about whether you can wait for high-confidence opportunities.
Third, if you don’t understand, stay out of the market and wait. Being in cash isn’t being timid; it’s protecting your capital. The market moves every day, but not every move is worth you jumping in. A lot of losses come from being afraid to miss out—hard-chasing into positions you don’t even understand.
Fourth, don’t always think you can flip everything with an all-in move. Growing a small account gradually comes from controlling risk and compounding steadily—not from betting your luck with all in.
The people who manage to survive in futures contracts aren’t the most daring gamblers. They’re the ones who know when to act and when to stop.
The biggest enemy in futures contracts is never the market—it’s the you without rules. First make sure your account can keep staying at the table, then talk about how to amplify returns.
1
570
·
--
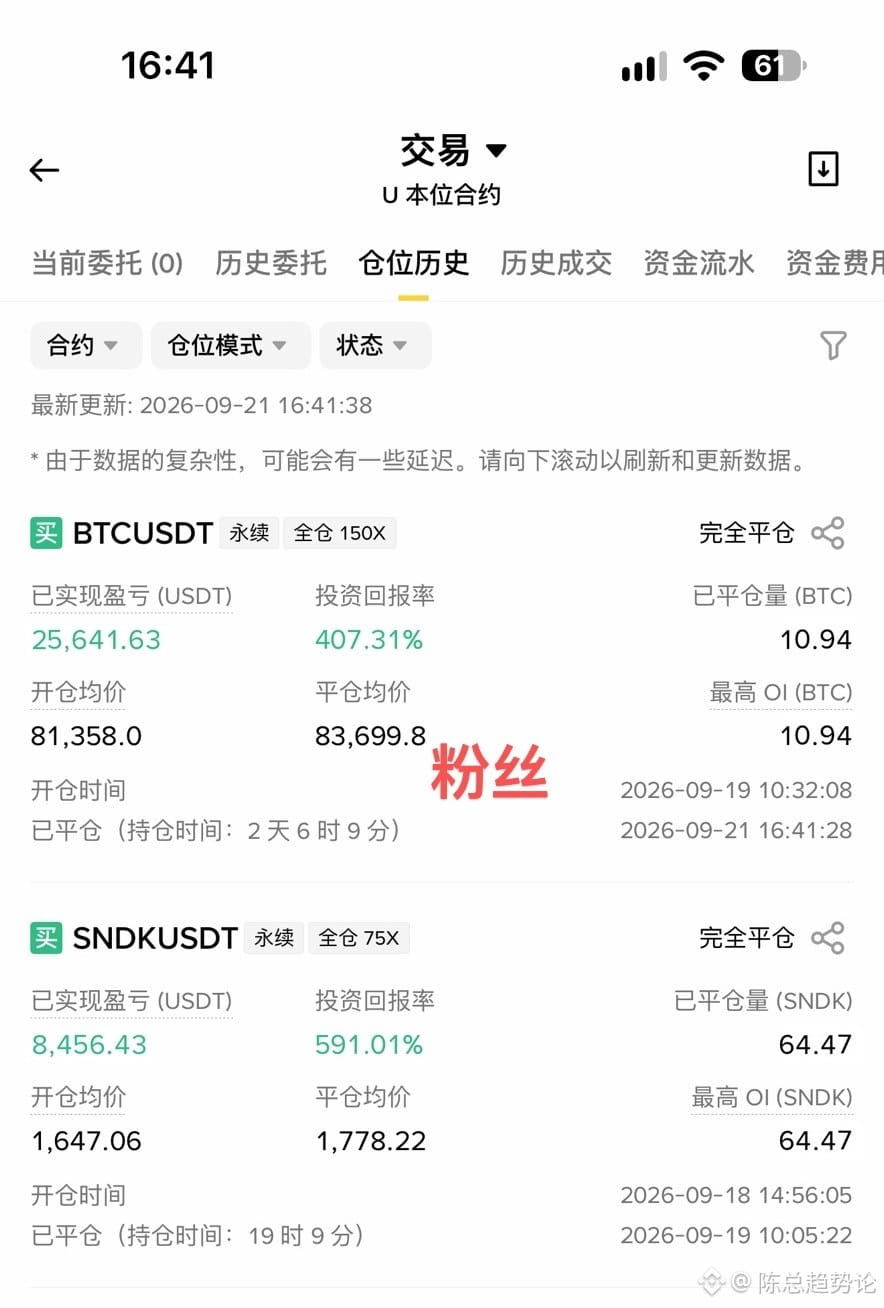
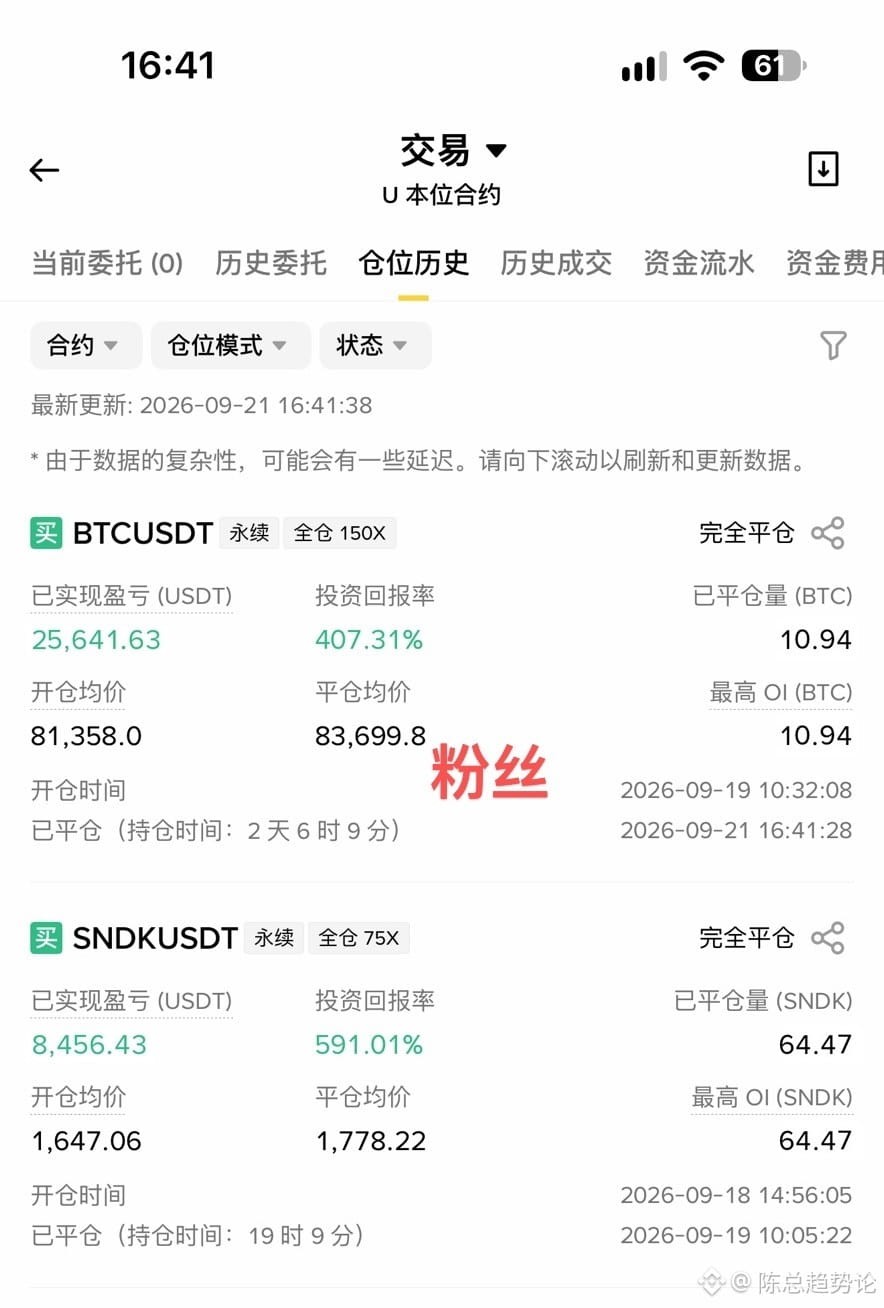
Many people lose money in trading. It’s not that they can’t spot opportunities—it’s that they hold onto unrealized gains, and in the end they give them all back.
I’ve seen too many traders: the direction is right, the market moves exactly as expected, and their account unrealized profits once climb to a comfortable high. But they just can’t bear to exit. Their heads are full of, “It can still rise a bit more.”
Then the market goes through a normal pullback. Little by little, the profit gets erased. Those originally big-winning trades end up as small gains, break-even, or even cutting losses and exiting while down.
There’s a painful truth in trading: unrealized profit is just a number on the books. The money that’s actually banked and put into your pocket—that’s the part that truly belongs to you.
My own trading approach has always been simple: as long as the price moves according to plan, once profit touches the target level, I immediately move my stop-loss up. First, I completely cover the risk, and then I look for opportunities to lock in gains in stages.
This isn’t because I don’t believe in what comes next—it’s because I don’t want a trade that was set up to be a sure win to end up like a “bamboo basket catching water,” wasted in the end.
Many people fear getting stopped out after raising the stop, thinking that making a little less is the same as losing. But the real core issue is this: you simply don’t have the ability to reliably keep the money you’ve already earned.
Those who can achieve consistent profitability are never the ones who buy exactly at the lowest point and sell exactly at the highest. They’re the ones who know how to proactively control risk, protect capital, and steadily pocket the收益 they should have taken.
Opening a position is just the starting point. How to protect and keep the profits you’ve earned—that’s the essential lesson in trading that you should fix first.
The market never lacks new opportunities. But if you don’t hold on to the profit you’ve just taken this time, you may not get the same level of certainty next time.
Many people lose money in trading. It’s not that they can’t spot opportunities—it’s that they hold onto unrealized gains, and in the end they give them all back.
I’ve seen too many traders: the direction is right, the market moves exactly as expected, and their account unrealized profits once climb to a comfortable high. But they just can’t bear to exit. Their heads are full of, “It can still rise a bit more.”
Then the market goes through a normal pullback. Little by little, the profit gets erased. Those originally big-winning trades end up as small gains, break-even, or even cutting losses and exiting while down.
There’s a painful truth in trading: unrealized profit is just a number on the books. The money that’s actually banked and put into your pocket—that’s the part that truly belongs to you.
My own trading approach has always been simple: as long as the price moves according to plan, once profit touches the target level, I immediately move my stop-loss up. First, I completely cover the risk, and then I look for opportunities to lock in gains in stages.
This isn’t because I don’t believe in what comes next—it’s because I don’t want a trade that was set up to be a sure win to end up like a “bamboo basket catching water,” wasted in the end.
Many people fear getting stopped out after raising the stop, thinking that making a little less is the same as losing. But the real core issue is this: you simply don’t have the ability to reliably keep the money you’ve already earned.
Those who can achieve consistent profitability are never the ones who buy exactly at the lowest point and sell exactly at the highest. They’re the ones who know how to proactively control risk, protect capital, and steadily pocket the收益 they should have taken.
Opening a position is just the starting point. How to protect and keep the profits you’ve earned—that’s the essential lesson in trading that you should fix first.
The market never lacks new opportunities. But if you don’t hold on to the profit you’ve just taken this time, you may not get the same level of certainty next time.
I’ve seen too many traders: the direction is right, the market moves exactly as expected, and their account unrealized profits once climb to a comfortable high. But they just can’t bear to exit. Their heads are full of, “It can still rise a bit more.”
Then the market goes through a normal pullback. Little by little, the profit gets erased. Those originally big-winning trades end up as small gains, break-even, or even cutting losses and exiting while down.
There’s a painful truth in trading: unrealized profit is just a number on the books. The money that’s actually banked and put into your pocket—that’s the part that truly belongs to you.
My own trading approach has always been simple: as long as the price moves according to plan, once profit touches the target level, I immediately move my stop-loss up. First, I completely cover the risk, and then I look for opportunities to lock in gains in stages.
This isn’t because I don’t believe in what comes next—it’s because I don’t want a trade that was set up to be a sure win to end up like a “bamboo basket catching water,” wasted in the end.
Many people fear getting stopped out after raising the stop, thinking that making a little less is the same as losing. But the real core issue is this: you simply don’t have the ability to reliably keep the money you’ve already earned.
Those who can achieve consistent profitability are never the ones who buy exactly at the lowest point and sell exactly at the highest. They’re the ones who know how to proactively control risk, protect capital, and steadily pocket the收益 they should have taken.
Opening a position is just the starting point. How to protect and keep the profits you’ve earned—that’s the essential lesson in trading that you should fix first.
The market never lacks new opportunities. But if you don’t hold on to the profit you’ve just taken this time, you may not get the same level of certainty next time.
1
231
·
--
陈总趋势论
·
--
#道指下跌超600点
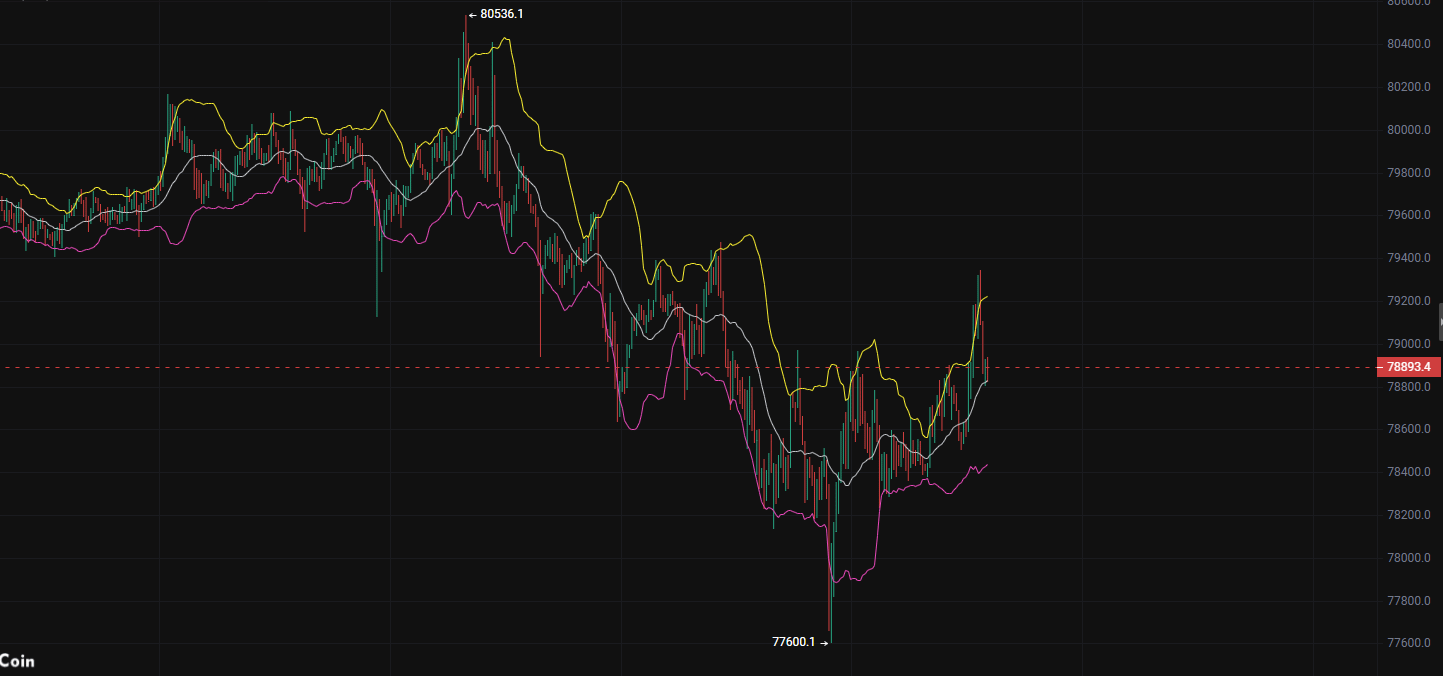
The Dow just fell again by nearly 600 points. The Nasdaq and the S&P followed the plunge. My long BTC position is still open—I’m holding around the 78k area without moving.
Why didn’t I cut (sell)? Because this U.S. stock selloff happened after Powell said inflation is too stubborn and rate cuts have to be pushed back. Capital withdrew from equities; some of that money actually flowed into crypto ETFs. BlackRock’s spot BTC and ETH ETFs recorded a net inflow of 340 million USD just a couple of days ago. What does that indicate? When institutions were dumping the U.S. stocks, they treated BTC as a hedge asset.
Why bullish on BTC? The correlation between BTC and the S&P has fallen to the lowest level since 2015. The 260-day rolling correlation is at -0.6. The last time it looked like this was in 2015. After that, BTC saw a 98.00x (9800%) rally. Of course, you can’t treat it as a copy-paste of history, but it suggests the “digital gold” thesis is starting to play out.
Why not add more? The RSI hasn’t reached extreme oversold yet, and the buy-the-dip strength around 78k is only so-so. I’ll add another tranche when price reaches 75k–76k, and I’ll place the stop-loss below the previous low at 73k. The position size is only two-tenths (20%)—not heavy. It can be held through.
I won’t touch altcoins. After traditional finance and crypto are connected, cross-market capital linkage is faster: when U.S. stocks dump, institutions’ first reaction is to cut alts to free up margin. Those smaller coins don’t have much of a floor when they start falling.
As the saying goes: make the plan ahead of time, and leave the rest to the market. $BTC $ETH
The Dow just fell again by nearly 600 points. The Nasdaq and the S&P followed the plunge. My long BTC position is still open—I’m holding around the 78k area without moving.
Why didn’t I cut (sell)? Because this U.S. stock selloff happened after Powell said inflation is too stubborn and rate cuts have to be pushed back. Capital withdrew from equities; some of that money actually flowed into crypto ETFs. BlackRock’s spot BTC and ETH ETFs recorded a net inflow of 340 million USD just a couple of days ago. What does that indicate? When institutions were dumping the U.S. stocks, they treated BTC as a hedge asset.
Why bullish on BTC? The correlation between BTC and the S&P has fallen to the lowest level since 2015. The 260-day rolling correlation is at -0.6. The last time it looked like this was in 2015. After that, BTC saw a 98.00x (9800%) rally. Of course, you can’t treat it as a copy-paste of history, but it suggests the “digital gold” thesis is starting to play out.
Why not add more? The RSI hasn’t reached extreme oversold yet, and the buy-the-dip strength around 78k is only so-so. I’ll add another tranche when price reaches 75k–76k, and I’ll place the stop-loss below the previous low at 73k. The position size is only two-tenths (20%)—not heavy. It can be held through.
I won’t touch altcoins. After traditional finance and crypto are connected, cross-market capital linkage is faster: when U.S. stocks dump, institutions’ first reaction is to cut alts to free up margin. Those smaller coins don’t have much of a floor when they start falling.
As the saying goes: make the plan ahead of time, and leave the rest to the market. $BTC $ETH
1
376
·
--
A big pancake says a pin is inserted and that it isn’t scary—fake, hahaha. If you can’t hold it for long, the fans themselves level it out. But then again, it’s also satisfying to enjoy this bite. $BTC #小牛向前冲
#南非拟将加密纳入外汇管制
#以太坊突破2700美元
A big pancake says a pin is inserted and that it isn’t scary—fake, hahaha. If you can’t hold it for long, the fans themselves level it out. But then again, it’s also satisfying to enjoy this bite. $BTC #小牛向前冲
#南非拟将加密纳入外汇管制
#以太坊突破2700美元
#南非拟将加密纳入外汇管制
#以太坊突破2700美元
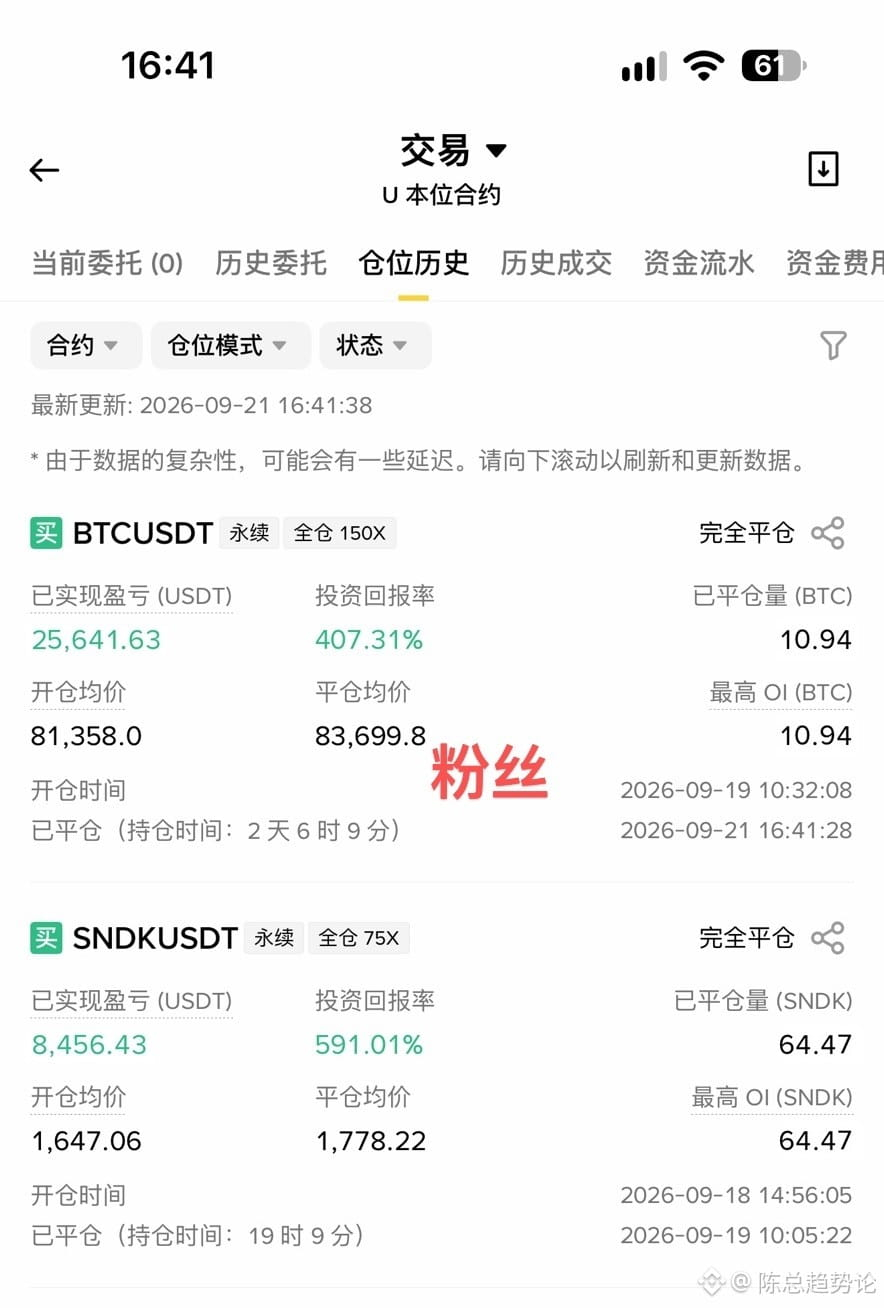
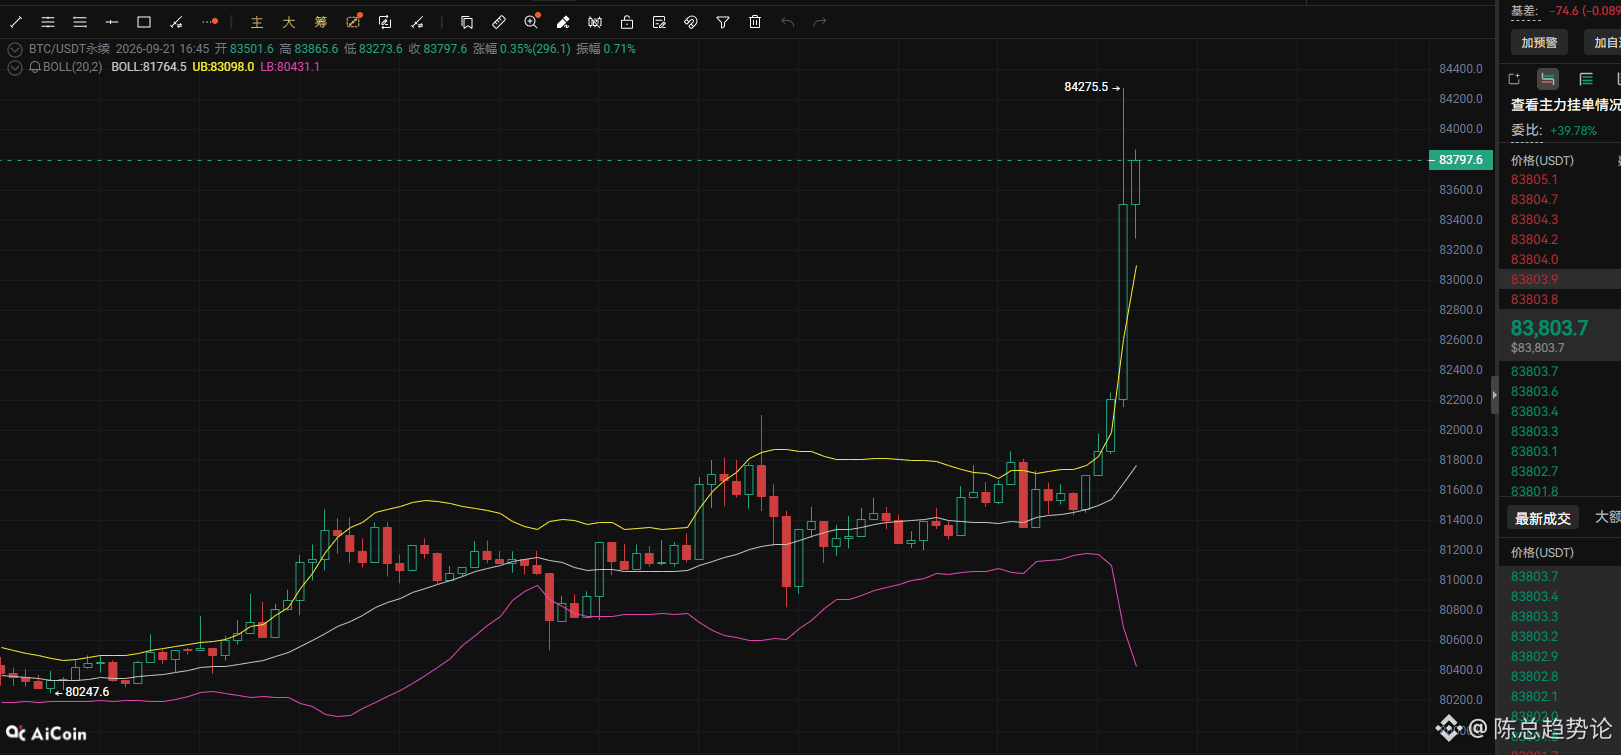
1
260
·
--
90% of people in the crypto market lose money. It’s never because they can’t read the charts—it’s because once they see unrealized profit, they simply don’t have the skill to keep their gains.
Before, a friend caught a trend. His account went from 2000 USDT to 2600 USDT, with 600 USDT in unrealized profit. He got excited, convinced the market would push even higher, and kept holding without being willing to exit.
Then a pullback came. The profit started to shrink, but he kept comforting himself: “It will rebound soon.” In the end, the entire 600 USDT profit was wiped out, and he even ended up cutting his position at a loss and leaving the trade.
The hardest part in trading is never simply getting the entry right. It’s holding onto your greed once unrealized profit is in your hands.
Many people mistakenly think unrealized profit is “money that’s already taken.” But as long as you haven’t closed the position, the market can take back your book gains at any time.
My own approach has always been simple: if the market follows the plan, once the profit reaches your target line, move your stop loss up immediately. Gradually reduce risk to zero, and when necessary, lock in part of the gains.
Some say this makes it easier to get stopped out on a sweep, and you might earn less. But after trading for a long time, you’ll understand: missing out on a bit of profit isn’t scary. What’s scary is finally catching a big chunk of profit, only to give it back to the market because of greed.
A truly mature trader isn’t someone who bottoms and tops perfectly every time. It’s someone who knows how to “weld” the profits they’ve earned into their account—rolling out compound gains with steady, small wins again and again.
#Canary二次修订质押SEI现货ETF申请
There’s always another train on the market. But if you’ve wiped out your principal, there won’t be a next one.
If you’re still chasing price up and cutting when down—getting euphoric when you make a little, and stubbornly holding when you lose—make “protecting profits” a habit first. Trading can at least save you half the detours.
90% of people in the crypto market lose money. It’s never because they can’t read the charts—it’s because once they see unrealized profit, they simply don’t have the skill to keep their gains.
Before, a friend caught a trend. His account went from 2000 USDT to 2600 USDT, with 600 USDT in unrealized profit. He got excited, convinced the market would push even higher, and kept holding without being willing to exit.
Then a pullback came. The profit started to shrink, but he kept comforting himself: “It will rebound soon.” In the end, the entire 600 USDT profit was wiped out, and he even ended up cutting his position at a loss and leaving the trade.
The hardest part in trading is never simply getting the entry right. It’s holding onto your greed once unrealized profit is in your hands.
Many people mistakenly think unrealized profit is “money that’s already taken.” But as long as you haven’t closed the position, the market can take back your book gains at any time.
My own approach has always been simple: if the market follows the plan, once the profit reaches your target line, move your stop loss up immediately. Gradually reduce risk to zero, and when necessary, lock in part of the gains.
Some say this makes it easier to get stopped out on a sweep, and you might earn less. But after trading for a long time, you’ll understand: missing out on a bit of profit isn’t scary. What’s scary is finally catching a big chunk of profit, only to give it back to the market because of greed.
A truly mature trader isn’t someone who bottoms and tops perfectly every time. It’s someone who knows how to “weld” the profits they’ve earned into their account—rolling out compound gains with steady, small wins again and again.
#Canary二次修订质押SEI现货ETF申请
There’s always another train on the market. But if you’ve wiped out your principal, there won’t be a next one.
If you’re still chasing price up and cutting when down—getting euphoric when you make a little, and stubbornly holding when you lose—make “protecting profits” a habit first. Trading can at least save you half the detours.
Before, a friend caught a trend. His account went from 2000 USDT to 2600 USDT, with 600 USDT in unrealized profit. He got excited, convinced the market would push even higher, and kept holding without being willing to exit.
Then a pullback came. The profit started to shrink, but he kept comforting himself: “It will rebound soon.” In the end, the entire 600 USDT profit was wiped out, and he even ended up cutting his position at a loss and leaving the trade.
The hardest part in trading is never simply getting the entry right. It’s holding onto your greed once unrealized profit is in your hands.
Many people mistakenly think unrealized profit is “money that’s already taken.” But as long as you haven’t closed the position, the market can take back your book gains at any time.
My own approach has always been simple: if the market follows the plan, once the profit reaches your target line, move your stop loss up immediately. Gradually reduce risk to zero, and when necessary, lock in part of the gains.
Some say this makes it easier to get stopped out on a sweep, and you might earn less. But after trading for a long time, you’ll understand: missing out on a bit of profit isn’t scary. What’s scary is finally catching a big chunk of profit, only to give it back to the market because of greed.
A truly mature trader isn’t someone who bottoms and tops perfectly every time. It’s someone who knows how to “weld” the profits they’ve earned into their account—rolling out compound gains with steady, small wins again and again.
#Canary二次修订质押SEI现货ETF申请
There’s always another train on the market. But if you’ve wiped out your principal, there won’t be a next one.
If you’re still chasing price up and cutting when down—getting euphoric when you make a little, and stubbornly holding when you lose—make “protecting profits” a habit first. Trading can at least save you half the detours.
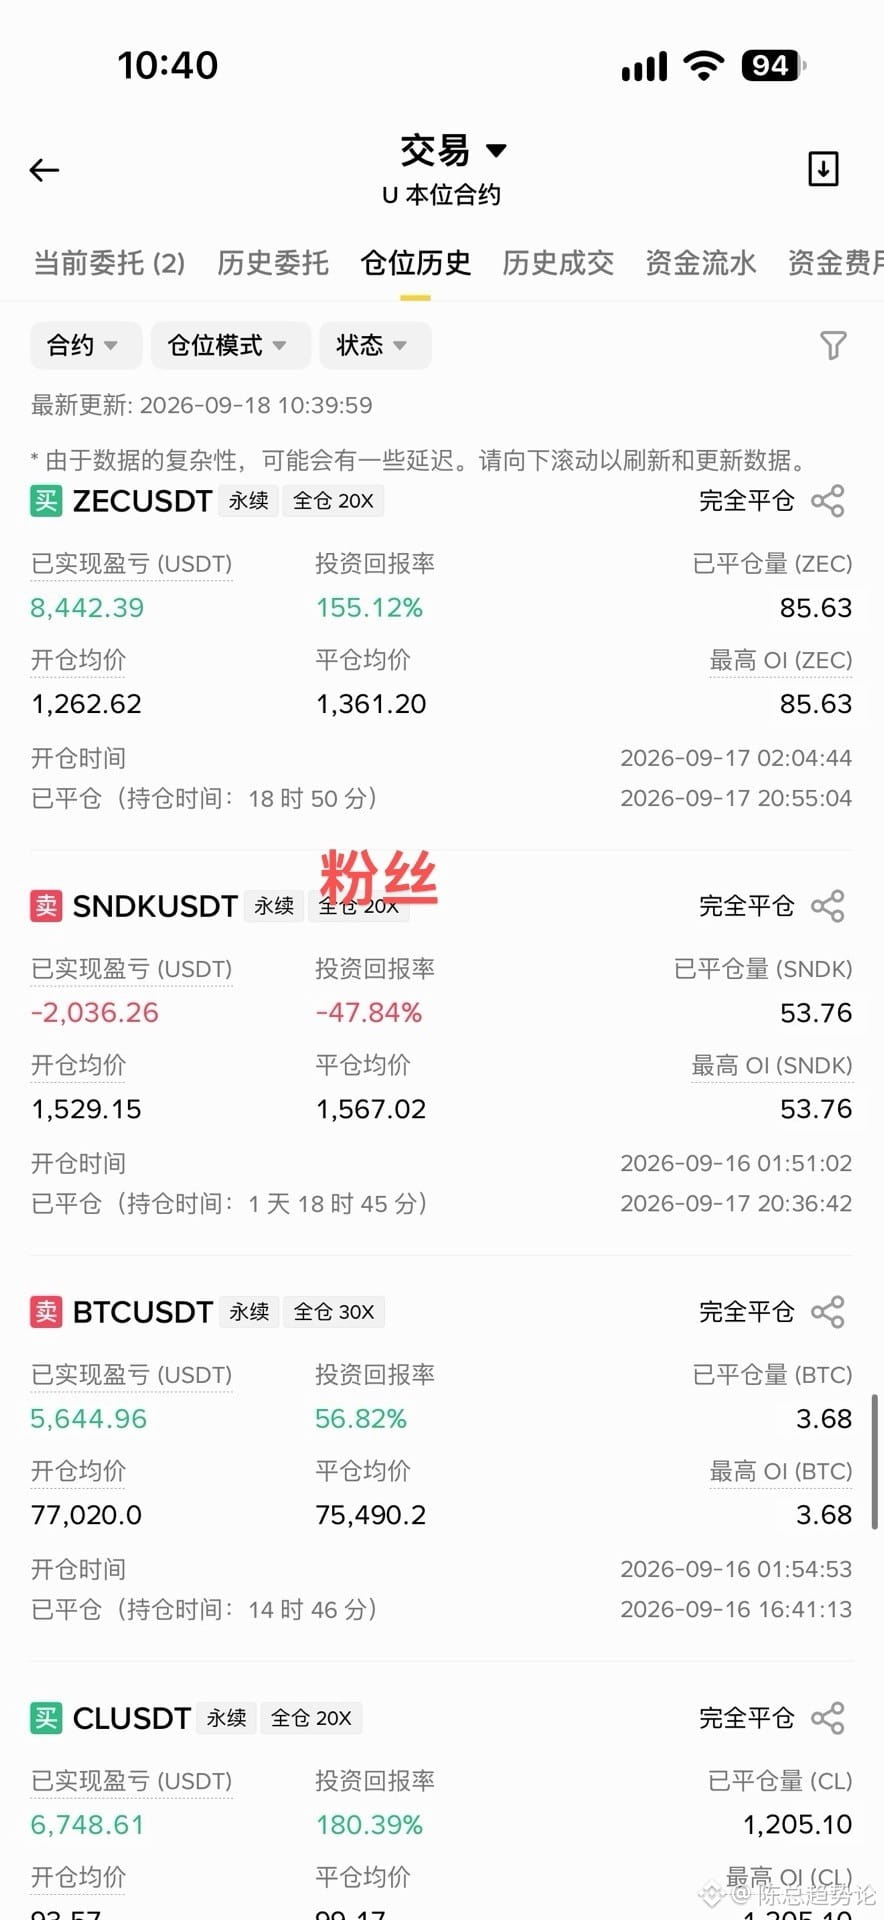
1
642
·
--
The less principal you have, the easier it is to fall into a vicious cycle: you’re so convinced that the next trade will be a direct turnaround.
Many people ask me: if they clearly know the market conditions are not right, why can’t they control themselves and still feel compelled to place trades?
It’s not really a lack of self-control. The root cause is that the principal is too small—so their whole mind is consumed with rushing to grow the account quickly.
When you only have a few thousand U, any small fluctuation feels like an opportunity delivered to your door. When it goes up, you fear missing out; when it goes down, you fear you’ll never catch the bottom. You end up placing a dozen or more trades a day, nonstop—busy as can be, but the account shows no real improvement.
I have a friend who used to be just like that. He would stay in the charts all day—when he made a little profit, he immediately opened the next trade; when he lost a bit, he desperately tried to recoup the principal right away. Later, after reviewing his trades, he finally saw it: the real reason his account was dragged down wasn’t any single massive loss. It was those pointless trades—no plan, no logic—that slowly and steadily ate away at his principal.
After that, he completely changed his approach. He no longer traded just to trade. He waited in dead certainty for opportunities.
If the trend hadn’t unfolded, he stayed flat. If the entry wasn’t right, he kept waiting. Only when a real opportunity that met his standards appeared did he use a small position to test. When the direction was correct, he stayed patient and held. When the direction was wrong, he cut losses immediately—never allowing one wrong trade to throw off the rhythm of everything that followed.
The number of trades became visibly fewer, and the account steadied step by step.
Many people constantly hope to catch a big move and flip the account in one go—but they forget the most critical thing: market opportunities are never scarce. The only limitation is that your principal is just one share. By the time a big opportunity actually arrives, you’ve already burned through most of your funds. Even the best opportunity has nothing to do with you then.
Trading is never about who opens more trades. It’s about who can stay calm and hold their nerve.
First learn not to keep stepping into traps, then talk about making big money. First protect your principal, then wait for the market that truly belongs to you.
People who can grow small capital little by little don’t rely on luck. They rely on being willing to wait for opportunities, being decisive about stopping losses, and sticking firmly to their own trading rules.
The less principal you have, the easier it is to fall into a vicious cycle: you’re so convinced that the next trade will be a direct turnaround.
Many people ask me: if they clearly know the market conditions are not right, why can’t they control themselves and still feel compelled to place trades?
It’s not really a lack of self-control. The root cause is that the principal is too small—so their whole mind is consumed with rushing to grow the account quickly.
When you only have a few thousand U, any small fluctuation feels like an opportunity delivered to your door. When it goes up, you fear missing out; when it goes down, you fear you’ll never catch the bottom. You end up placing a dozen or more trades a day, nonstop—busy as can be, but the account shows no real improvement.
I have a friend who used to be just like that. He would stay in the charts all day—when he made a little profit, he immediately opened the next trade; when he lost a bit, he desperately tried to recoup the principal right away. Later, after reviewing his trades, he finally saw it: the real reason his account was dragged down wasn’t any single massive loss. It was those pointless trades—no plan, no logic—that slowly and steadily ate away at his principal.
After that, he completely changed his approach. He no longer traded just to trade. He waited in dead certainty for opportunities.
If the trend hadn’t unfolded, he stayed flat. If the entry wasn’t right, he kept waiting. Only when a real opportunity that met his standards appeared did he use a small position to test. When the direction was correct, he stayed patient and held. When the direction was wrong, he cut losses immediately—never allowing one wrong trade to throw off the rhythm of everything that followed.
The number of trades became visibly fewer, and the account steadied step by step.
Many people constantly hope to catch a big move and flip the account in one go—but they forget the most critical thing: market opportunities are never scarce. The only limitation is that your principal is just one share. By the time a big opportunity actually arrives, you’ve already burned through most of your funds. Even the best opportunity has nothing to do with you then.
Trading is never about who opens more trades. It’s about who can stay calm and hold their nerve.
First learn not to keep stepping into traps, then talk about making big money. First protect your principal, then wait for the market that truly belongs to you.
People who can grow small capital little by little don’t rely on luck. They rely on being willing to wait for opportunities, being decisive about stopping losses, and sticking firmly to their own trading rules.
Many people ask me: if they clearly know the market conditions are not right, why can’t they control themselves and still feel compelled to place trades?
It’s not really a lack of self-control. The root cause is that the principal is too small—so their whole mind is consumed with rushing to grow the account quickly.
When you only have a few thousand U, any small fluctuation feels like an opportunity delivered to your door. When it goes up, you fear missing out; when it goes down, you fear you’ll never catch the bottom. You end up placing a dozen or more trades a day, nonstop—busy as can be, but the account shows no real improvement.
I have a friend who used to be just like that. He would stay in the charts all day—when he made a little profit, he immediately opened the next trade; when he lost a bit, he desperately tried to recoup the principal right away. Later, after reviewing his trades, he finally saw it: the real reason his account was dragged down wasn’t any single massive loss. It was those pointless trades—no plan, no logic—that slowly and steadily ate away at his principal.
After that, he completely changed his approach. He no longer traded just to trade. He waited in dead certainty for opportunities.
If the trend hadn’t unfolded, he stayed flat. If the entry wasn’t right, he kept waiting. Only when a real opportunity that met his standards appeared did he use a small position to test. When the direction was correct, he stayed patient and held. When the direction was wrong, he cut losses immediately—never allowing one wrong trade to throw off the rhythm of everything that followed.
The number of trades became visibly fewer, and the account steadied step by step.
Many people constantly hope to catch a big move and flip the account in one go—but they forget the most critical thing: market opportunities are never scarce. The only limitation is that your principal is just one share. By the time a big opportunity actually arrives, you’ve already burned through most of your funds. Even the best opportunity has nothing to do with you then.
Trading is never about who opens more trades. It’s about who can stay calm and hold their nerve.
First learn not to keep stepping into traps, then talk about making big money. First protect your principal, then wait for the market that truly belongs to you.
People who can grow small capital little by little don’t rely on luck. They rely on being willing to wait for opportunities, being decisive about stopping losses, and sticking firmly to their own trading rules.
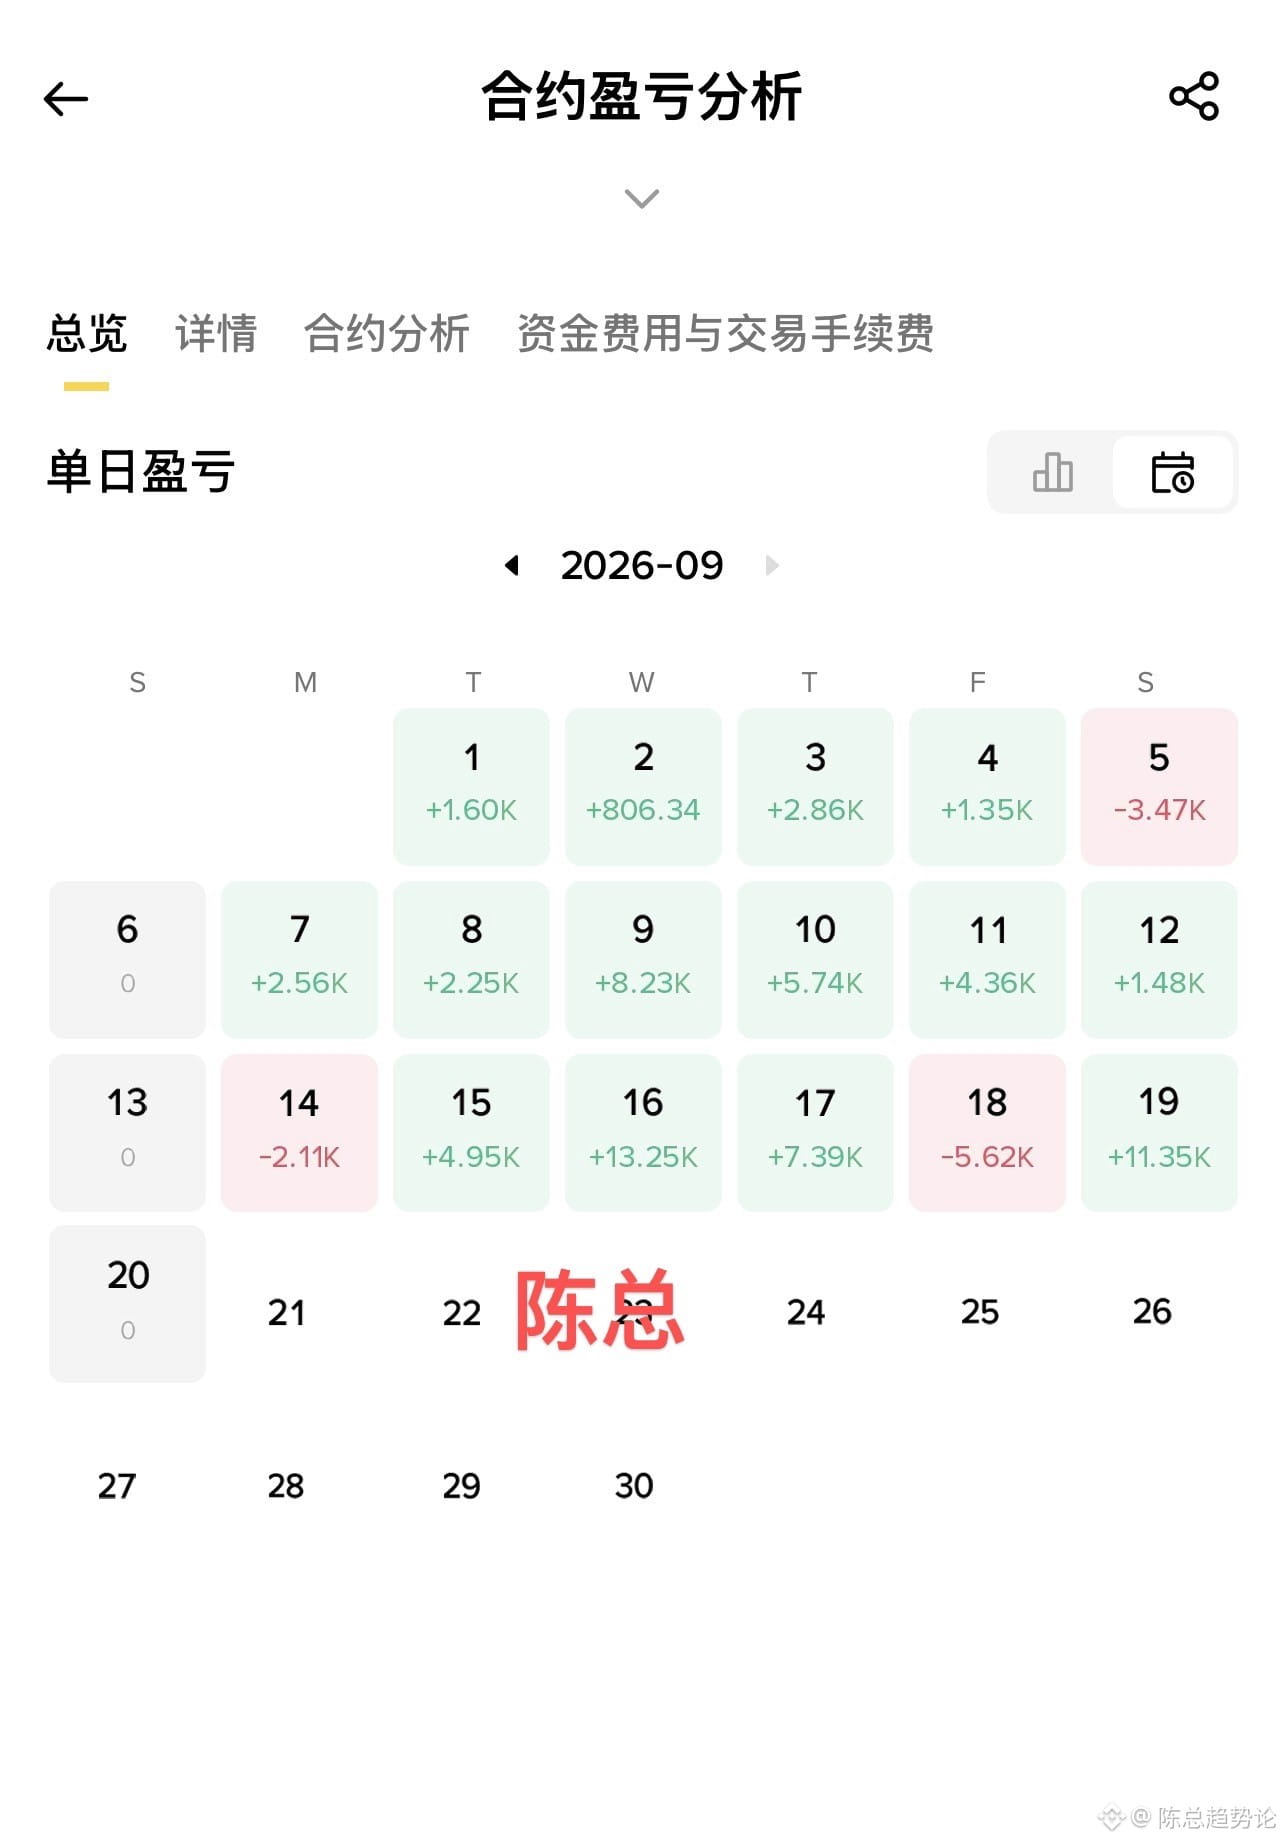
1
62
·
--
The biggest pitfall for small-capital traders—the one you’re most likely to fall into—is being so fixated on making a single trade that you think you can turn fate around in one shot.
When your account only has a few thousand USDT (U), many people don’t spend their days thinking about how to steadily accumulate gains. Instead, they obsess over how to quickly multiply by ten. The more urgently you chase speed, the more likely you are to chase high after it’s already pumped, go all-in and gamble, and constantly switch coins and tinker at random. In the end, you miss the big opportunities, and your principal gets whittled down to almost nothing.
I know a friend who trades. When he first entered, his principal wasn’t much either. Later, he managed to grow his account little by little—not because he caught some 100x miracle coin, but because he set himself an extremely practical small goal: first, steadily grow the account to 10,000 U.
The reason is simple. When your capital base is too small, what you should “fight for” is not an ultra-high return rate—you should focus on staying alive. Once your account has a foundation, position management becomes easier to implement, your margin for error increases, and you won’t get crippled by one or two bad trades.
His trading approach has always been straightforward: he doesn’t chase popular coins that have already surged to the sky. Instead, he waits and monitors in advance for new directions that are still in the low range and where capital has quietly started to build positions. When the market isn’t paying attention, he observes quietly. Only after the trend becomes clearly established does he enter—he never waits until the whole internet is calling out trades before rushing in to take the bag.
He never puts all his capital into a full position. Each time, he uses only part of the funds to test. If the direction is correct, he gradually adds. If the price action and his prediction diverge, he cuts losses immediately to lock in the loss, keeping his “ammo” for the next opportunity.
He also has a particularly steady habit: he never ties all his hopes to a single coin. After taking a wave of profits, he puts some of it in his pocket first, then turns around to look for the next certainty-driven opportunity. His account grows slowly through compounding, and he’s never fantasized about achieving financial freedom with just one trade.
The crypto market is never short of myths about a sudden overnight explosion—but for the people who truly grow small capital into a larger one, it’s never a matter of gambling your luck. It’s all about steady timing and disciplined execution.
Guard your principal, manage your positions, take profit when you earn it, admit mistakes when you lose—repeatedly putting simple rules into practice is far more likely to take you to the end than daydreaming about getting rich overnight.
The biggest pitfall for small-capital traders—the one you’re most likely to fall into—is being so fixated on making a single trade that you think you can turn fate around in one shot.
When your account only has a few thousand USDT (U), many people don’t spend their days thinking about how to steadily accumulate gains. Instead, they obsess over how to quickly multiply by ten. The more urgently you chase speed, the more likely you are to chase high after it’s already pumped, go all-in and gamble, and constantly switch coins and tinker at random. In the end, you miss the big opportunities, and your principal gets whittled down to almost nothing.
I know a friend who trades. When he first entered, his principal wasn’t much either. Later, he managed to grow his account little by little—not because he caught some 100x miracle coin, but because he set himself an extremely practical small goal: first, steadily grow the account to 10,000 U.
The reason is simple. When your capital base is too small, what you should “fight for” is not an ultra-high return rate—you should focus on staying alive. Once your account has a foundation, position management becomes easier to implement, your margin for error increases, and you won’t get crippled by one or two bad trades.
His trading approach has always been straightforward: he doesn’t chase popular coins that have already surged to the sky. Instead, he waits and monitors in advance for new directions that are still in the low range and where capital has quietly started to build positions. When the market isn’t paying attention, he observes quietly. Only after the trend becomes clearly established does he enter—he never waits until the whole internet is calling out trades before rushing in to take the bag.
He never puts all his capital into a full position. Each time, he uses only part of the funds to test. If the direction is correct, he gradually adds. If the price action and his prediction diverge, he cuts losses immediately to lock in the loss, keeping his “ammo” for the next opportunity.
He also has a particularly steady habit: he never ties all his hopes to a single coin. After taking a wave of profits, he puts some of it in his pocket first, then turns around to look for the next certainty-driven opportunity. His account grows slowly through compounding, and he’s never fantasized about achieving financial freedom with just one trade.
The crypto market is never short of myths about a sudden overnight explosion—but for the people who truly grow small capital into a larger one, it’s never a matter of gambling your luck. It’s all about steady timing and disciplined execution.
Guard your principal, manage your positions, take profit when you earn it, admit mistakes when you lose—repeatedly putting simple rules into practice is far more likely to take you to the end than daydreaming about getting rich overnight.
When your account only has a few thousand USDT (U), many people don’t spend their days thinking about how to steadily accumulate gains. Instead, they obsess over how to quickly multiply by ten. The more urgently you chase speed, the more likely you are to chase high after it’s already pumped, go all-in and gamble, and constantly switch coins and tinker at random. In the end, you miss the big opportunities, and your principal gets whittled down to almost nothing.
I know a friend who trades. When he first entered, his principal wasn’t much either. Later, he managed to grow his account little by little—not because he caught some 100x miracle coin, but because he set himself an extremely practical small goal: first, steadily grow the account to 10,000 U.
The reason is simple. When your capital base is too small, what you should “fight for” is not an ultra-high return rate—you should focus on staying alive. Once your account has a foundation, position management becomes easier to implement, your margin for error increases, and you won’t get crippled by one or two bad trades.
His trading approach has always been straightforward: he doesn’t chase popular coins that have already surged to the sky. Instead, he waits and monitors in advance for new directions that are still in the low range and where capital has quietly started to build positions. When the market isn’t paying attention, he observes quietly. Only after the trend becomes clearly established does he enter—he never waits until the whole internet is calling out trades before rushing in to take the bag.
He never puts all his capital into a full position. Each time, he uses only part of the funds to test. If the direction is correct, he gradually adds. If the price action and his prediction diverge, he cuts losses immediately to lock in the loss, keeping his “ammo” for the next opportunity.
He also has a particularly steady habit: he never ties all his hopes to a single coin. After taking a wave of profits, he puts some of it in his pocket first, then turns around to look for the next certainty-driven opportunity. His account grows slowly through compounding, and he’s never fantasized about achieving financial freedom with just one trade.
The crypto market is never short of myths about a sudden overnight explosion—but for the people who truly grow small capital into a larger one, it’s never a matter of gambling your luck. It’s all about steady timing and disciplined execution.
Guard your principal, manage your positions, take profit when you earn it, admit mistakes when you lose—repeatedly putting simple rules into practice is far more likely to take you to the end than daydreaming about getting rich overnight.
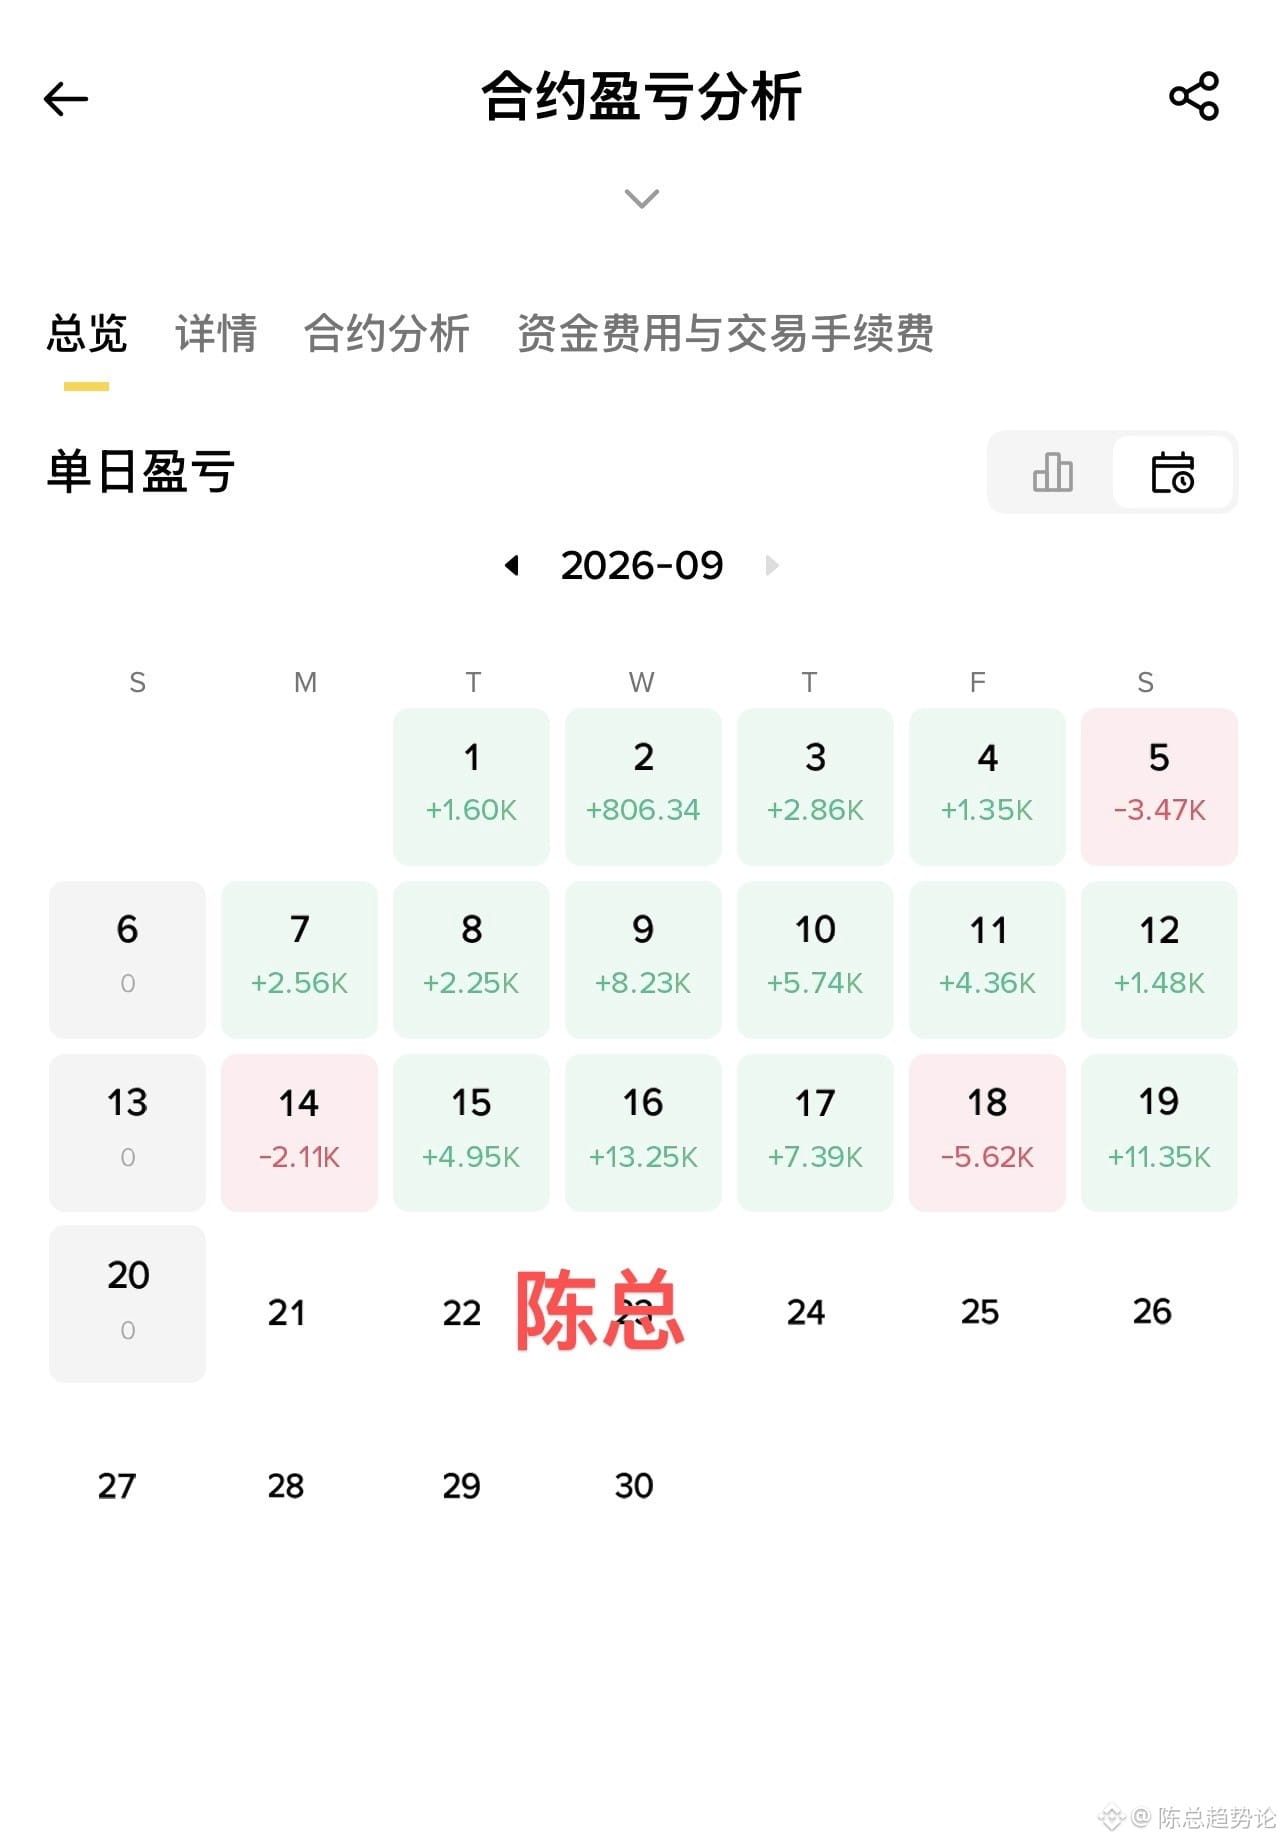
1
39
·
--
#日本央行加息至31年高位
$XAU Another brother who got liquidated found me and asked if I can get it back. Of course it’s no problem. Last week I saw that gold was in a bearish trend, and I’m currently in profit. I’ll see whether it gives me a chance to take profit later.🤑🤑🤑#比特币市值超越特斯拉
#日本央行加息至31年高位
$XAU Another brother who got liquidated found me and asked if I can get it back. Of course it’s no problem. Last week I saw that gold was in a bearish trend, and I’m currently in profit. I’ll see whether it gives me a chance to take profit later.🤑🤑🤑#比特币市值超越特斯拉
$XAU Another brother who got liquidated found me and asked if I can get it back. Of course it’s no problem. Last week I saw that gold was in a bearish trend, and I’m currently in profit. I’ll see whether it gives me a chance to take profit later.🤑🤑🤑#比特币市值超越特斯拉
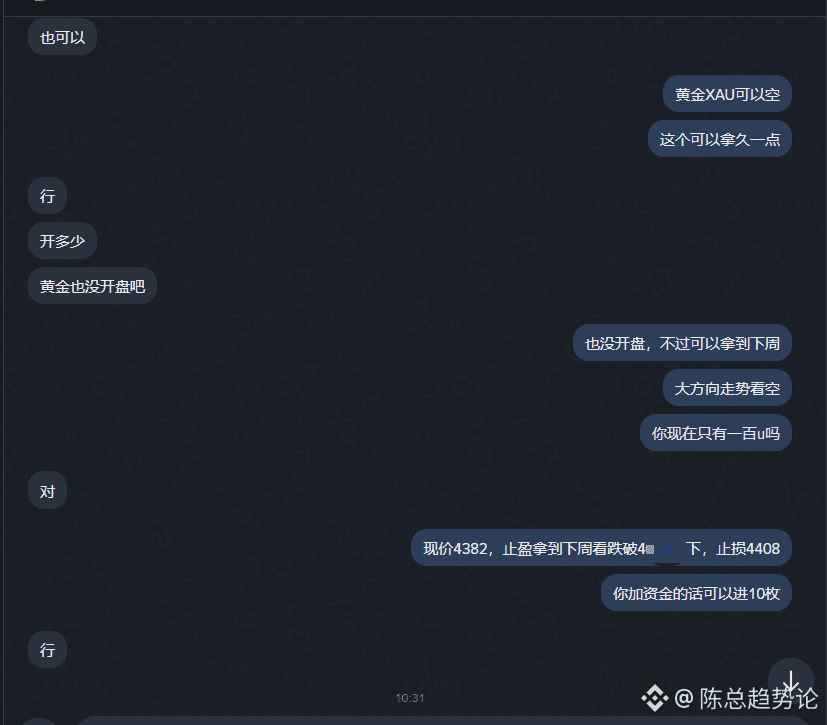
1
154
·
--
In a one-sided market, small funds want to grow big—not by having a bigger nerve, but by sticking to a few simple rules.
I know a brother who started with 20k U. When the trend kicks in, he doesn’t rush to go all-in. He starts with a small position to test and confirm the direction. If it goes smoothly, he adds. When his floating profit hits his target, he takes some off the table first, and the rest he lets ride with the market.
In the same wave of the market, while other people chase and sell back and forth—getting shaken out and ground up—he steadily builds his account up.
Most people don’t lose money because they don’t know the direction. They lose because the market drags them around: it goes up and they chase; it drops and they short. They grab a little profit and run, get trapped and stubbornly hold on. By the end of the whole trend, they’re just busy paying tuition to the market.
The core of a one-sided market is four things:
1. Don’t go all-in from the start. When you enter, don’t block your exit. If the trend reverses, you’ll have no adjustment opportunities.
2. Only trade along the clearly defined direction. If the trend is up, add more; if it goes bad, wait. Don’t keep guessing “long or short,” trying to outsmart the market back and forth.
3. Cut losses decisively. If you’re wrong, admit it immediately—don’t stubbornly hold out and wait for a rebound. Big losses are always dragged out.
4. Don’t get greedy with take-profit. When you reach your target, take some profit off first. Leave the rest to the trend. Don’t fantasize about capturing the entire move.
People who can grow small capital don’t have flashy ways. They just repeatedly get the following right: position sizing, stop-loss, take-profit, and pacing.
Trading isn’t that complicated: get the direction right, control your position size, recognize losses and close, take profits and don’t get greedy. Don’t panic or stay too stiff. If you do that, your account will naturally grow step by step.
In a one-sided market, small funds want to grow big—not by having a bigger nerve, but by sticking to a few simple rules.
I know a brother who started with 20k U. When the trend kicks in, he doesn’t rush to go all-in. He starts with a small position to test and confirm the direction. If it goes smoothly, he adds. When his floating profit hits his target, he takes some off the table first, and the rest he lets ride with the market.
In the same wave of the market, while other people chase and sell back and forth—getting shaken out and ground up—he steadily builds his account up.
Most people don’t lose money because they don’t know the direction. They lose because the market drags them around: it goes up and they chase; it drops and they short. They grab a little profit and run, get trapped and stubbornly hold on. By the end of the whole trend, they’re just busy paying tuition to the market.
The core of a one-sided market is four things:
1. Don’t go all-in from the start. When you enter, don’t block your exit. If the trend reverses, you’ll have no adjustment opportunities.
2. Only trade along the clearly defined direction. If the trend is up, add more; if it goes bad, wait. Don’t keep guessing “long or short,” trying to outsmart the market back and forth.
3. Cut losses decisively. If you’re wrong, admit it immediately—don’t stubbornly hold out and wait for a rebound. Big losses are always dragged out.
4. Don’t get greedy with take-profit. When you reach your target, take some profit off first. Leave the rest to the trend. Don’t fantasize about capturing the entire move.
People who can grow small capital don’t have flashy ways. They just repeatedly get the following right: position sizing, stop-loss, take-profit, and pacing.
Trading isn’t that complicated: get the direction right, control your position size, recognize losses and close, take profits and don’t get greedy. Don’t panic or stay too stiff. If you do that, your account will naturally grow step by step.
I know a brother who started with 20k U. When the trend kicks in, he doesn’t rush to go all-in. He starts with a small position to test and confirm the direction. If it goes smoothly, he adds. When his floating profit hits his target, he takes some off the table first, and the rest he lets ride with the market.
In the same wave of the market, while other people chase and sell back and forth—getting shaken out and ground up—he steadily builds his account up.
Most people don’t lose money because they don’t know the direction. They lose because the market drags them around: it goes up and they chase; it drops and they short. They grab a little profit and run, get trapped and stubbornly hold on. By the end of the whole trend, they’re just busy paying tuition to the market.
The core of a one-sided market is four things:
1. Don’t go all-in from the start. When you enter, don’t block your exit. If the trend reverses, you’ll have no adjustment opportunities.
2. Only trade along the clearly defined direction. If the trend is up, add more; if it goes bad, wait. Don’t keep guessing “long or short,” trying to outsmart the market back and forth.
3. Cut losses decisively. If you’re wrong, admit it immediately—don’t stubbornly hold out and wait for a rebound. Big losses are always dragged out.
4. Don’t get greedy with take-profit. When you reach your target, take some profit off first. Leave the rest to the trend. Don’t fantasize about capturing the entire move.
People who can grow small capital don’t have flashy ways. They just repeatedly get the following right: position sizing, stop-loss, take-profit, and pacing.
Trading isn’t that complicated: get the direction right, control your position size, recognize losses and close, take profits and don’t get greedy. Don’t panic or stay too stiff. If you do that, your account will naturally grow step by step.
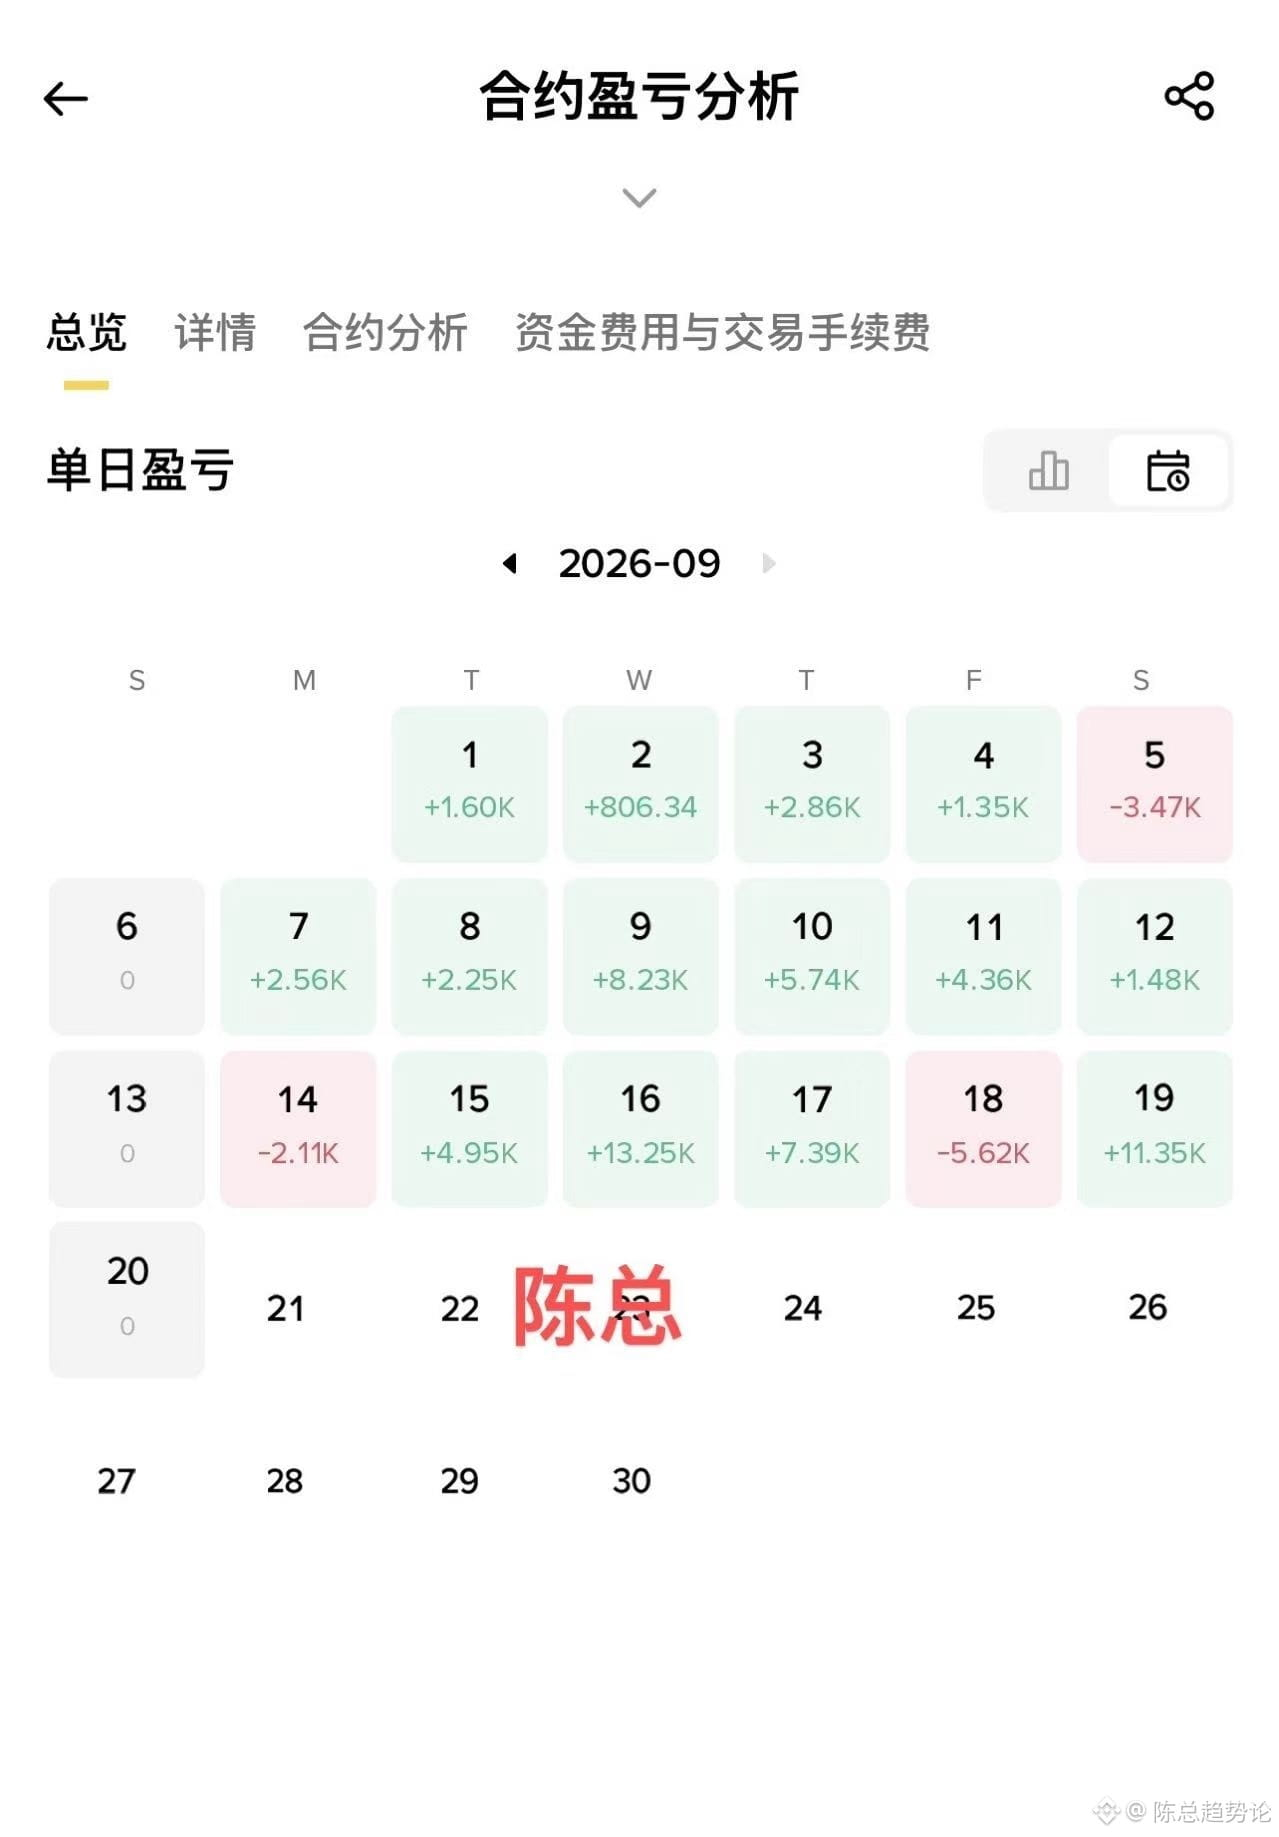
1
58
Log in to explore more content
Join global crypto users on Binance Square
⚡️ Get latest and useful information about crypto.
💬 Trusted by the world’s largest crypto exchange.
👍 Discover real insights from verified creators.
Email / Phone number
Trending Topics
PolymarketBankFailureBetsDrawFDICConcern
4,212 views
187 Discussing
#polymarketbankfailurebetsdrawfdicconcern
🚨 Market Alert: Bank Failure Bets on Polymarket Draw FDIC Concern
The Situation: The financial world is buzzing as a high-stakes prediction market on Polymarket—specifically betting on the probability of major bank failures—has drawn serious attention and concern from regulators, including the FDIC. This has created a volatile feedback loop where market sentiment directly influences regulatory scrutiny, driving massive volume and volatility across the sector.
What This Means for Traders: When prediction markets for financial distress gain this much traction, it signals extreme market stress and elevated systemic risk. Traders are closely monitoring contagion risk across the banking sector, making it a critical moment for risk management and sector rotation.
Highlighted Tradeable Coins to Watch:
$BTC (Bitcoin): The ultimate macro hedge. As concerns over fiat banking stability rise, traders frequently rotate capital into Bitcoin as a decentralized, non-sovereign store of value.
$ETH (Ethereum): Leading the decentralized finance (DeFi) ecosystem. If the traditional banking sector faces pressure, increased attention often turns to on-chain finance and lending protocols built on Ethereum.
$BNB (Binance Coin): As a proxy for exchange health and broader market sentiment, tracking how major exchange tokens react to sudden financial news provides insights into overall market liquidity and trader confidence.
Are you hedging against systemic risk or watching from the sidelines? Let's discuss your strategy in the comments below! 👇
#Polymarket #FDIC #BankingSector #PredictionMarkets
Axiom AlphA
·0 Likes
·2.5k views
BlackRockBuildsTokenizedPortfoliosForOndo
2,788 views
120 Discussing
BitwiseFilesToListNEARETFOnNYSEArca
4,238 views
154 Discussing