
BitsToToken
431 Posts

BitsToToken
Report
Block User
Frequent Trader
2.6 Years
7 Following
89 Followers
613 Liked
Posts
All
Quotes







·
--
🧠 High Trading Volume Doesn't Always Mean Real Buying Demand
Ever noticed a crypto coin experiencing massive trading volume, yet its price struggles to move higher?
Here's something worth paying attention to. 👀
Not all trading volume tells the same story.
There are two important markets to understand:
🔹 Spot Market
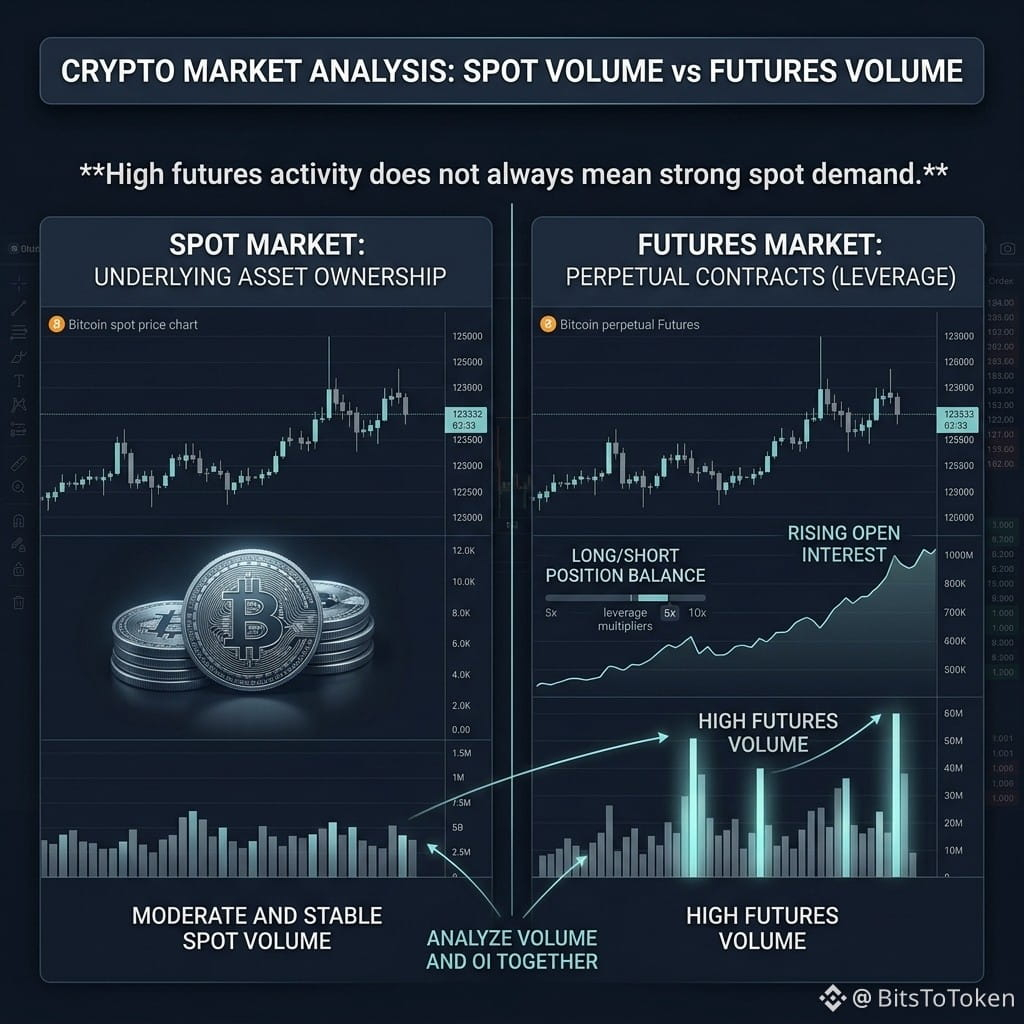
Traders buy and sell the actual asset. Spot activity can help reveal whether demand for the underlying asset is supporting a price move.
🔹 Futures Market
Traders trade derivative contracts, often using leverage. High futures volume can reflect speculation, hedging, and frequent position changes—not just investors buying the asset.
Now, imagine this scenario:
📈 Futures volume surges.
📊 Open Interest increases.
🤔 But spot buying activity remains relatively weak.
This suggests derivatives activity is heating up, but the move may not be supported by equally strong spot-market participation.
However, this doesn't automatically mean the price will fall. Futures activity can lead price discovery, and spot volume alone cannot reveal the full picture either.
That's why comparing Spot Volume + Futures Volume + Open Interest can provide more context than looking at any single metric.
The key question is:
Is the market moving with broad spot participation, or is most of the action happening in derivatives?
Understanding that difference can help you interpret market strength more carefully.
I hope this gives you a useful new perspective on crypto market analysis. Keep learning, stay curious, and trade responsibly! 📊
$SOL $BTC $ESPORTS
#USADPAdds90000JobsInSeptember #AltcoinSeasonIndexHoldsAbove60For5Days
🧠 High Trading Volume Doesn't Always Mean Real Buying Demand
Ever noticed a crypto coin experiencing massive trading volume, yet its price struggles to move higher?
Here's something worth paying attention to. 👀
Not all trading volume tells the same story.
There are two important markets to understand:
🔹 Spot Market
Traders buy and sell the actual asset. Spot activity can help reveal whether demand for the underlying asset is supporting a price move.
🔹 Futures Market
Traders trade derivative contracts, often using leverage. High futures volume can reflect speculation, hedging, and frequent position changes—not just investors buying the asset.
Now, imagine this scenario:
📈 Futures volume surges.
📊 Open Interest increases.
🤔 But spot buying activity remains relatively weak.
This suggests derivatives activity is heating up, but the move may not be supported by equally strong spot-market participation.
However, this doesn't automatically mean the price will fall. Futures activity can lead price discovery, and spot volume alone cannot reveal the full picture either.
That's why comparing Spot Volume + Futures Volume + Open Interest can provide more context than looking at any single metric.
The key question is:
Is the market moving with broad spot participation, or is most of the action happening in derivatives?
Understanding that difference can help you interpret market strength more carefully.
I hope this gives you a useful new perspective on crypto market analysis. Keep learning, stay curious, and trade responsibly! 📊
$SOL $BTC $ESPORTS
#USADPAdds90000JobsInSeptember #AltcoinSeasonIndexHoldsAbove60For5Days
Ever noticed a crypto coin experiencing massive trading volume, yet its price struggles to move higher?
Here's something worth paying attention to. 👀
Not all trading volume tells the same story.
There are two important markets to understand:
🔹 Spot Market
Traders buy and sell the actual asset. Spot activity can help reveal whether demand for the underlying asset is supporting a price move.
🔹 Futures Market
Traders trade derivative contracts, often using leverage. High futures volume can reflect speculation, hedging, and frequent position changes—not just investors buying the asset.
Now, imagine this scenario:
📈 Futures volume surges.
📊 Open Interest increases.
🤔 But spot buying activity remains relatively weak.
This suggests derivatives activity is heating up, but the move may not be supported by equally strong spot-market participation.
However, this doesn't automatically mean the price will fall. Futures activity can lead price discovery, and spot volume alone cannot reveal the full picture either.
That's why comparing Spot Volume + Futures Volume + Open Interest can provide more context than looking at any single metric.
The key question is:
Is the market moving with broad spot participation, or is most of the action happening in derivatives?
Understanding that difference can help you interpret market strength more carefully.
I hope this gives you a useful new perspective on crypto market analysis. Keep learning, stay curious, and trade responsibly! 📊
$SOL $BTC $ESPORTS
#USADPAdds90000JobsInSeptember #AltcoinSeasonIndexHoldsAbove60For5Days
1
124
·
--
🧠 High Funding Rates Don't Always Mean a Market Top
When funding rates become extremely positive, many traders immediately assume the market is overheated and a correction is coming.
But is it really that simple? 👀
Not necessarily.
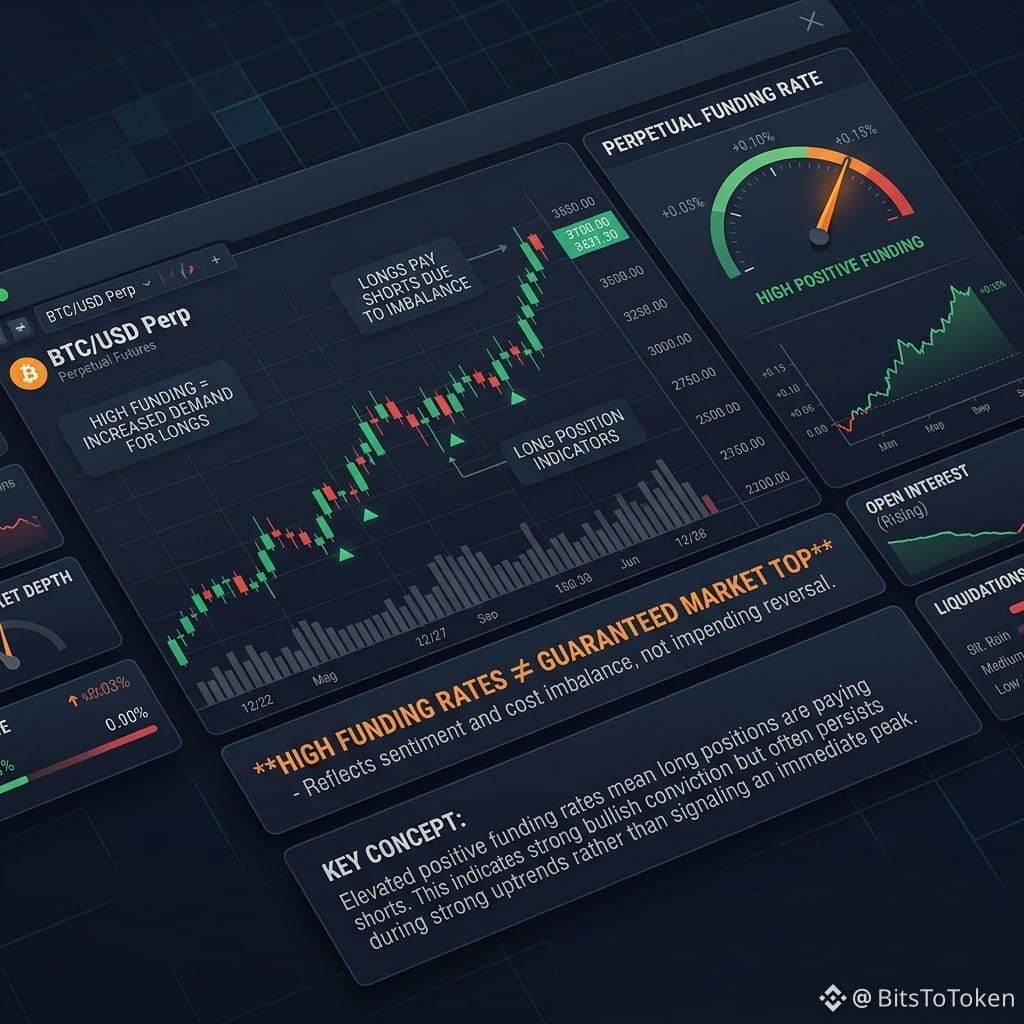
Funding rates help balance the price difference between perpetual futures and their underlying reference market. Positive funding generally means longs pay shorts, while negative funding means shorts pay longs.
Here's what many traders overlook:
An expensive long position doesn't automatically mean the market must reverse.
Consider these three scenarios:
🔹 High funding + rising price
Long positions are paying a premium, but strong buying pressure can still push prices higher.
🔹 High funding + sideways price
Crowded positioning may be building while price struggles to make progress. This deserves closer attention, but it doesn't guarantee a reversal.
🔹 High funding + falling price
Longs may face increasing pressure as the market moves against them, potentially triggering liquidations if their positions are highly leveraged.
The key is to understand that funding rates describe the cost of holding perpetual futures positions—not the market's next direction.
Instead of asking, “Is funding too high?”
Ask yourself:
“Is price still making progress despite the cost of holding these positions?”
Combine funding rates with price action, open interest, and liquidation data for a more complete picture.
I hope this helps you interpret market conditions more carefully and avoid jumping to conclusions based on a single indicator.
Keep learning, stay patient, and trade responsibly. 📊
$BTC $US $NVDAB
#CryptoAnalysis #TrumpSaysLastUSTroopsLeavingIraq #AltcoinSeasonIndexHoldsAbove60For5Days
🧠 High Funding Rates Don't Always Mean a Market Top
When funding rates become extremely positive, many traders immediately assume the market is overheated and a correction is coming.
But is it really that simple? 👀
Not necessarily.
Funding rates help balance the price difference between perpetual futures and their underlying reference market. Positive funding generally means longs pay shorts, while negative funding means shorts pay longs.
Here's what many traders overlook:
An expensive long position doesn't automatically mean the market must reverse.
Consider these three scenarios:
🔹 High funding + rising price
Long positions are paying a premium, but strong buying pressure can still push prices higher.
🔹 High funding + sideways price
Crowded positioning may be building while price struggles to make progress. This deserves closer attention, but it doesn't guarantee a reversal.
🔹 High funding + falling price
Longs may face increasing pressure as the market moves against them, potentially triggering liquidations if their positions are highly leveraged.
The key is to understand that funding rates describe the cost of holding perpetual futures positions—not the market's next direction.
Instead of asking, “Is funding too high?”
Ask yourself:
“Is price still making progress despite the cost of holding these positions?”
Combine funding rates with price action, open interest, and liquidation data for a more complete picture.
I hope this helps you interpret market conditions more carefully and avoid jumping to conclusions based on a single indicator.
Keep learning, stay patient, and trade responsibly. 📊
$BTC $US $NVDAB
#CryptoAnalysis #TrumpSaysLastUSTroopsLeavingIraq #AltcoinSeasonIndexHoldsAbove60For5Days
When funding rates become extremely positive, many traders immediately assume the market is overheated and a correction is coming.
But is it really that simple? 👀
Not necessarily.
Funding rates help balance the price difference between perpetual futures and their underlying reference market. Positive funding generally means longs pay shorts, while negative funding means shorts pay longs.
Here's what many traders overlook:
An expensive long position doesn't automatically mean the market must reverse.
Consider these three scenarios:
🔹 High funding + rising price
Long positions are paying a premium, but strong buying pressure can still push prices higher.
🔹 High funding + sideways price
Crowded positioning may be building while price struggles to make progress. This deserves closer attention, but it doesn't guarantee a reversal.
🔹 High funding + falling price
Longs may face increasing pressure as the market moves against them, potentially triggering liquidations if their positions are highly leveraged.
The key is to understand that funding rates describe the cost of holding perpetual futures positions—not the market's next direction.
Instead of asking, “Is funding too high?”
Ask yourself:
“Is price still making progress despite the cost of holding these positions?”
Combine funding rates with price action, open interest, and liquidation data for a more complete picture.
I hope this helps you interpret market conditions more carefully and avoid jumping to conclusions based on a single indicator.
Keep learning, stay patient, and trade responsibly. 📊
$BTC $US $NVDAB
#CryptoAnalysis #TrumpSaysLastUSTroopsLeavingIraq #AltcoinSeasonIndexHoldsAbove60For5Days
1
127
·
--
🧠 Why Do High Volume Breakouts Still Fail?
A breakout with strong volume looks convincing, right?
Price breaks resistance, volume spikes, and everyone starts expecting continuation.
But sometimes, the price suddenly reverses and falls back into the previous range. 👀
Why does this happen?
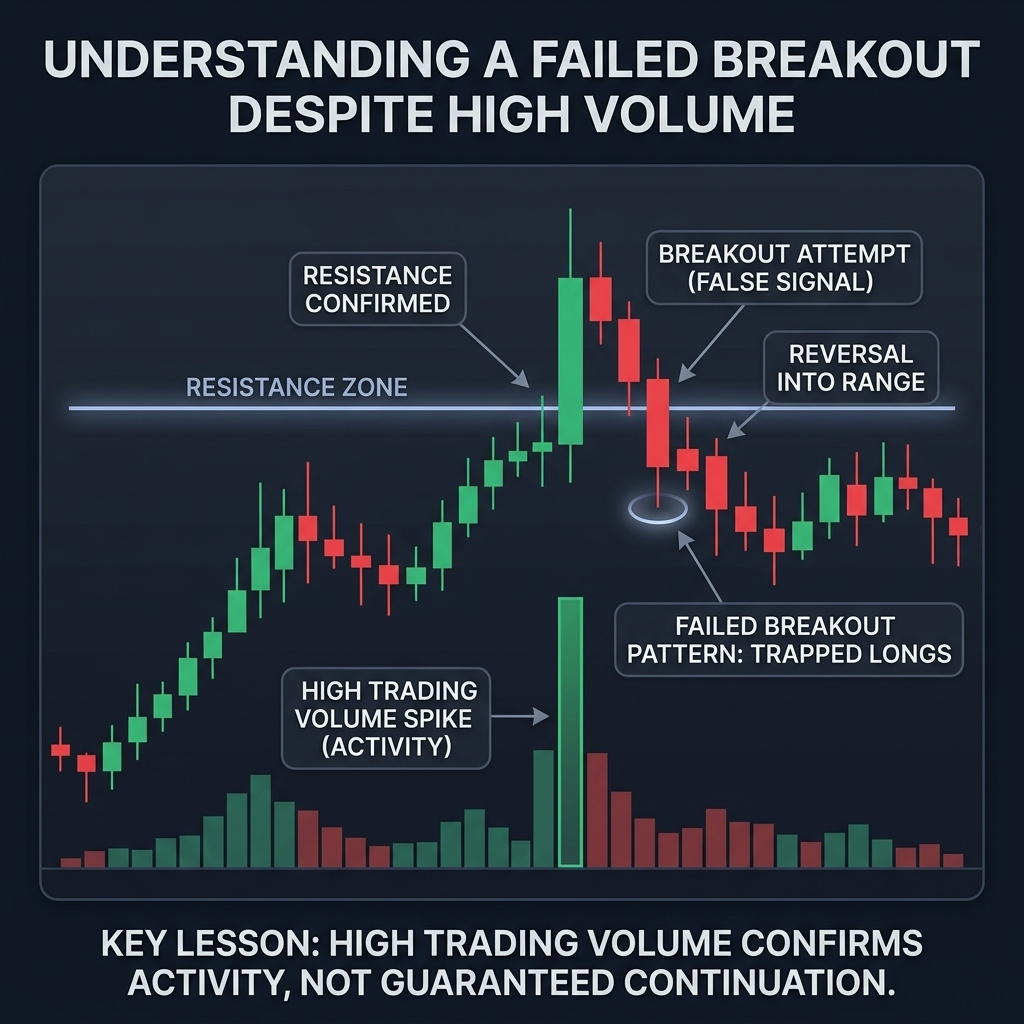
One important thing to understand is that volume confirms activity, not direction.
A volume spike tells us that significant trading activity is taking place. It doesn't guarantee that buyers will remain in control.
Here are three reasons a breakout might fail:
🔹 1. Lack of follow through
Price breaks resistance, but buyers cannot sustain the upward momentum.
🔹 2. Absorption
Aggressive buying meets enough passive selling to prevent price from moving significantly higher.
🔹 3. Trapped breakout traders
When price falls back below resistance, traders who entered the breakout may exit their positions, adding selling pressure.
So, instead of judging a breakout by volume alone, pay attention to what happens after the breakout.
Does price hold above the level? Does momentum continue? Or does it quickly return to the previous range?
Remember, a strong breakout is not just about how price breaks a level, but how it behaves afterward.
I hope this insight helps you read market movements more carefully and make better-informed trading decisions. 📊
Keep learning, stay patient, and trade responsibly!
$ARK $SOON $AGT
#CryptoAnalysis #SECToClarifyOnChainFundraisingRules #UKFCAOpensCryptoFirmAuthorization
🧠 Why Do High Volume Breakouts Still Fail?
A breakout with strong volume looks convincing, right?
Price breaks resistance, volume spikes, and everyone starts expecting continuation.
But sometimes, the price suddenly reverses and falls back into the previous range. 👀
Why does this happen?
One important thing to understand is that volume confirms activity, not direction.
A volume spike tells us that significant trading activity is taking place. It doesn't guarantee that buyers will remain in control.
Here are three reasons a breakout might fail:
🔹 1. Lack of follow through
Price breaks resistance, but buyers cannot sustain the upward momentum.
🔹 2. Absorption
Aggressive buying meets enough passive selling to prevent price from moving significantly higher.
🔹 3. Trapped breakout traders
When price falls back below resistance, traders who entered the breakout may exit their positions, adding selling pressure.
So, instead of judging a breakout by volume alone, pay attention to what happens after the breakout.
Does price hold above the level? Does momentum continue? Or does it quickly return to the previous range?
Remember, a strong breakout is not just about how price breaks a level, but how it behaves afterward.
I hope this insight helps you read market movements more carefully and make better-informed trading decisions. 📊
Keep learning, stay patient, and trade responsibly!
$ARK $SOON $AGT
#CryptoAnalysis #SECToClarifyOnChainFundraisingRules #UKFCAOpensCryptoFirmAuthorization
A breakout with strong volume looks convincing, right?
Price breaks resistance, volume spikes, and everyone starts expecting continuation.
But sometimes, the price suddenly reverses and falls back into the previous range. 👀
Why does this happen?
One important thing to understand is that volume confirms activity, not direction.
A volume spike tells us that significant trading activity is taking place. It doesn't guarantee that buyers will remain in control.
Here are three reasons a breakout might fail:
🔹 1. Lack of follow through
Price breaks resistance, but buyers cannot sustain the upward momentum.
🔹 2. Absorption
Aggressive buying meets enough passive selling to prevent price from moving significantly higher.
🔹 3. Trapped breakout traders
When price falls back below resistance, traders who entered the breakout may exit their positions, adding selling pressure.
So, instead of judging a breakout by volume alone, pay attention to what happens after the breakout.
Does price hold above the level? Does momentum continue? Or does it quickly return to the previous range?
Remember, a strong breakout is not just about how price breaks a level, but how it behaves afterward.
I hope this insight helps you read market movements more carefully and make better-informed trading decisions. 📊
Keep learning, stay patient, and trade responsibly!
$ARK $SOON $AGT
#CryptoAnalysis #SECToClarifyOnChainFundraisingRules #UKFCAOpensCryptoFirmAuthorization
1
323
·
--
🧠 Bitcoin Is Rising, So Why Are Altcoins Still Falling?
One of the most confusing things in crypto is watching Bitcoin move higher while many altcoins continue to bleed.
Shouldn't the whole market rise together?
Not necessarily. 👀
Here's what many traders overlook:
A rising Bitcoin doesn't automatically mean a bullish altcoin market.
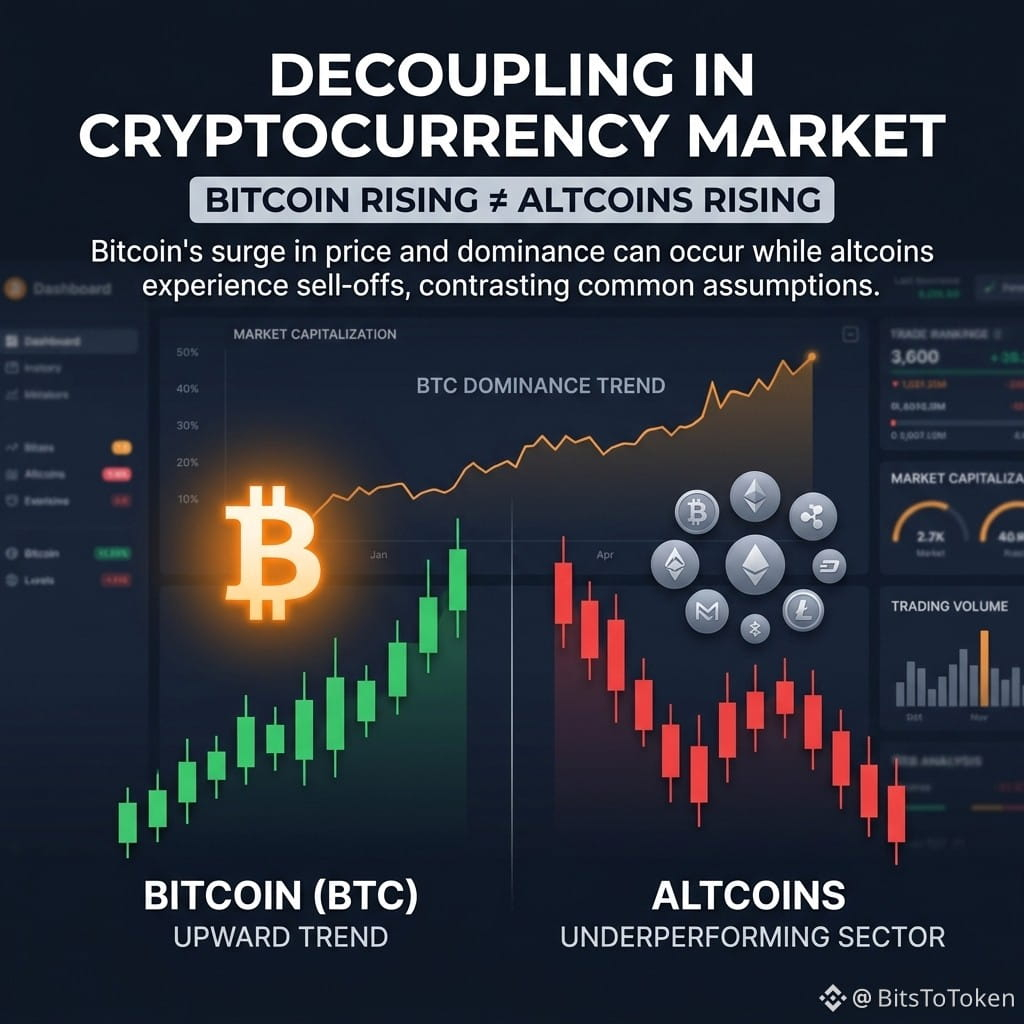
When Bitcoin outperforms the rest of the market, its dominance can increase. This means Bitcoin is gaining a larger share of the total crypto market capitalization.
But here's where it gets interesting.
🔹 Bitcoin rises + BTC Dominance rises: Altcoins may be underperforming BTC.
🔹 Bitcoin moves sideways + BTC Dominance falls: Some altcoins may be gaining relative strength.
🔹 Bitcoin falls + BTC Dominance rises: Altcoins may be falling even harder than Bitcoin.
However, dominance alone doesn't tell us exactly where the money is flowing. It measures relative market capitalization, not actual capital transfers.
So, before assuming an altcoin season is coming, look beyond Bitcoin's price.
Pay attention to BTC Dominance, ETH/BTC, and altcoin market breadth to understand whether strength is spreading across the market or remaining concentrated in Bitcoin.
The real question isn't just whether crypto is going up.
It's this:
*Is the rest of the market actually keeping up with Bitcoin?* 📊
$BTC $ETH $PUMP
#CryptoAnalysis #JapanMOFStudyGroupOnTokenizedGovtBonds #Altcoins
🧠 Bitcoin Is Rising, So Why Are Altcoins Still Falling?
One of the most confusing things in crypto is watching Bitcoin move higher while many altcoins continue to bleed.
Shouldn't the whole market rise together?
Not necessarily. 👀
Here's what many traders overlook:
A rising Bitcoin doesn't automatically mean a bullish altcoin market.
When Bitcoin outperforms the rest of the market, its dominance can increase. This means Bitcoin is gaining a larger share of the total crypto market capitalization.
But here's where it gets interesting.
🔹 Bitcoin rises + BTC Dominance rises: Altcoins may be underperforming BTC.
🔹 Bitcoin moves sideways + BTC Dominance falls: Some altcoins may be gaining relative strength.
🔹 Bitcoin falls + BTC Dominance rises: Altcoins may be falling even harder than Bitcoin.
However, dominance alone doesn't tell us exactly where the money is flowing. It measures relative market capitalization, not actual capital transfers.
So, before assuming an altcoin season is coming, look beyond Bitcoin's price.
Pay attention to BTC Dominance, ETH/BTC, and altcoin market breadth to understand whether strength is spreading across the market or remaining concentrated in Bitcoin.
The real question isn't just whether crypto is going up.
It's this:
*Is the rest of the market actually keeping up with Bitcoin?* 📊
$BTC $ETH $PUMP
#CryptoAnalysis #JapanMOFStudyGroupOnTokenizedGovtBonds #Altcoins
One of the most confusing things in crypto is watching Bitcoin move higher while many altcoins continue to bleed.
Shouldn't the whole market rise together?
Not necessarily. 👀
Here's what many traders overlook:
A rising Bitcoin doesn't automatically mean a bullish altcoin market.
When Bitcoin outperforms the rest of the market, its dominance can increase. This means Bitcoin is gaining a larger share of the total crypto market capitalization.
But here's where it gets interesting.
🔹 Bitcoin rises + BTC Dominance rises: Altcoins may be underperforming BTC.
🔹 Bitcoin moves sideways + BTC Dominance falls: Some altcoins may be gaining relative strength.
🔹 Bitcoin falls + BTC Dominance rises: Altcoins may be falling even harder than Bitcoin.
However, dominance alone doesn't tell us exactly where the money is flowing. It measures relative market capitalization, not actual capital transfers.
So, before assuming an altcoin season is coming, look beyond Bitcoin's price.
Pay attention to BTC Dominance, ETH/BTC, and altcoin market breadth to understand whether strength is spreading across the market or remaining concentrated in Bitcoin.
The real question isn't just whether crypto is going up.
It's this:
*Is the rest of the market actually keeping up with Bitcoin?* 📊
$BTC $ETH $PUMP
#CryptoAnalysis #JapanMOFStudyGroupOnTokenizedGovtBonds #Altcoins
1
171
·
--
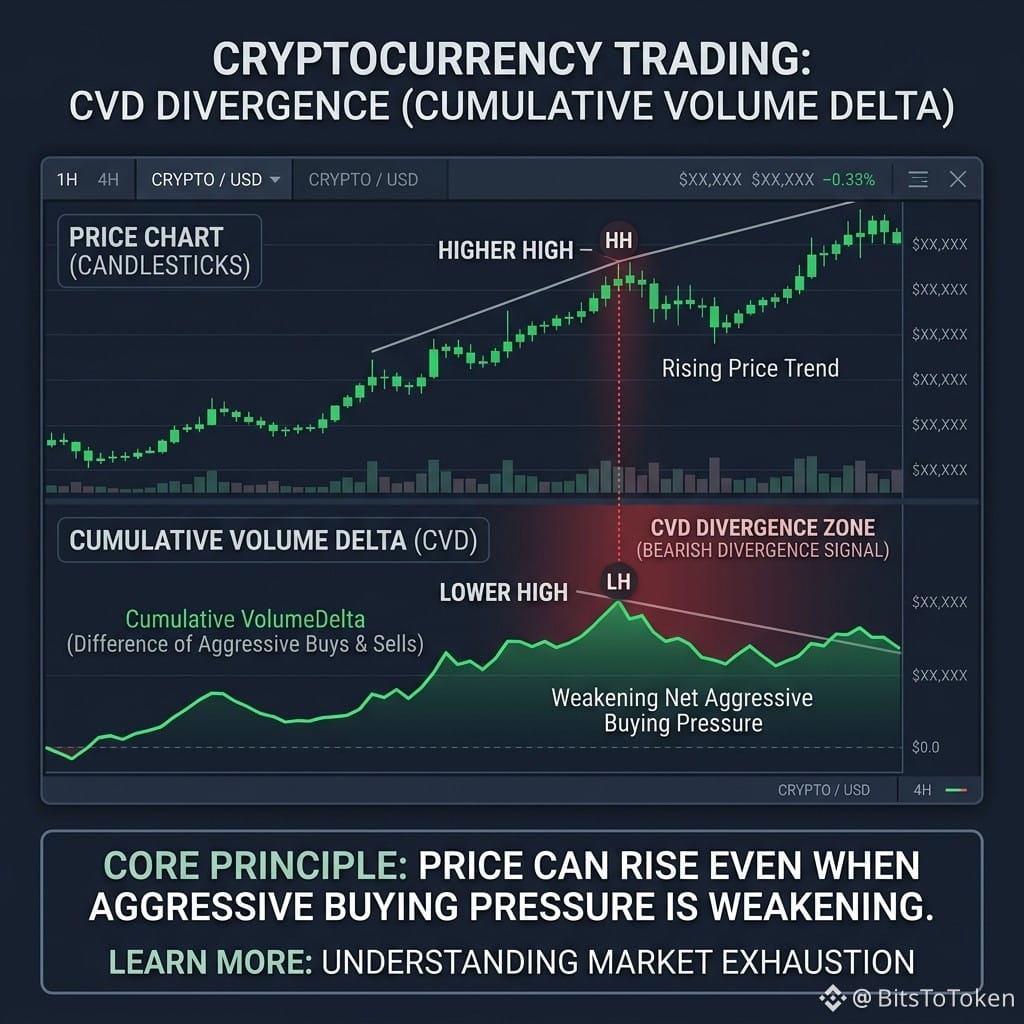
🧠 What if price is moving up, but buying pressure is actually weakening?
This is where CVD Divergence becomes interesting. 👀
Cumulative Volume Delta (CVD) tracks the difference between aggressive buying and aggressive selling over time.
Now, imagine this scenario:
📈 Price makes a new high.
📉 But CVD fails to make a new high.
What could this mean?
It suggests that price is moving higher without the same level of net aggressive buying seen during the previous move.
One possible explanation is that passive sellers are absorbing aggressive buy orders.
But here's the catch:
A divergence doesn't automatically mean a reversal is coming.
Sometimes, the market reverses. Other times, buyers regain control and price continues higher.
That's why CVD is more useful when combined with price structure, key levels, and other order-flow data.
The real question isn't simply whether buyers are aggressive.
It's this:
How much price movement are those buyers actually getting for their effort? 👀
Because in the market, aggressive buying and upward price movement aren't always the same thing.
$MOVR $QNT $PUMP
#CryptoAnalysis #EarningsSeason #BitMineETHHoldingsTop6Million
🧠 What if price is moving up, but buying pressure is actually weakening?
This is where CVD Divergence becomes interesting. 👀
Cumulative Volume Delta (CVD) tracks the difference between aggressive buying and aggressive selling over time.
Now, imagine this scenario:
📈 Price makes a new high.
📉 But CVD fails to make a new high.
What could this mean?
It suggests that price is moving higher without the same level of net aggressive buying seen during the previous move.
One possible explanation is that passive sellers are absorbing aggressive buy orders.
But here's the catch:
A divergence doesn't automatically mean a reversal is coming.
Sometimes, the market reverses. Other times, buyers regain control and price continues higher.
That's why CVD is more useful when combined with price structure, key levels, and other order-flow data.
The real question isn't simply whether buyers are aggressive.
It's this:
How much price movement are those buyers actually getting for their effort? 👀
Because in the market, aggressive buying and upward price movement aren't always the same thing.
$MOVR $QNT $PUMP
#CryptoAnalysis #EarningsSeason #BitMineETHHoldingsTop6Million
This is where CVD Divergence becomes interesting. 👀
Cumulative Volume Delta (CVD) tracks the difference between aggressive buying and aggressive selling over time.
Now, imagine this scenario:
📈 Price makes a new high.
📉 But CVD fails to make a new high.
What could this mean?
It suggests that price is moving higher without the same level of net aggressive buying seen during the previous move.
One possible explanation is that passive sellers are absorbing aggressive buy orders.
But here's the catch:
A divergence doesn't automatically mean a reversal is coming.
Sometimes, the market reverses. Other times, buyers regain control and price continues higher.
That's why CVD is more useful when combined with price structure, key levels, and other order-flow data.
The real question isn't simply whether buyers are aggressive.
It's this:
How much price movement are those buyers actually getting for their effort? 👀
Because in the market, aggressive buying and upward price movement aren't always the same thing.
$MOVR $QNT $PUMP
#CryptoAnalysis #EarningsSeason #BitMineETHHoldingsTop6Million
1
1
622
·
--
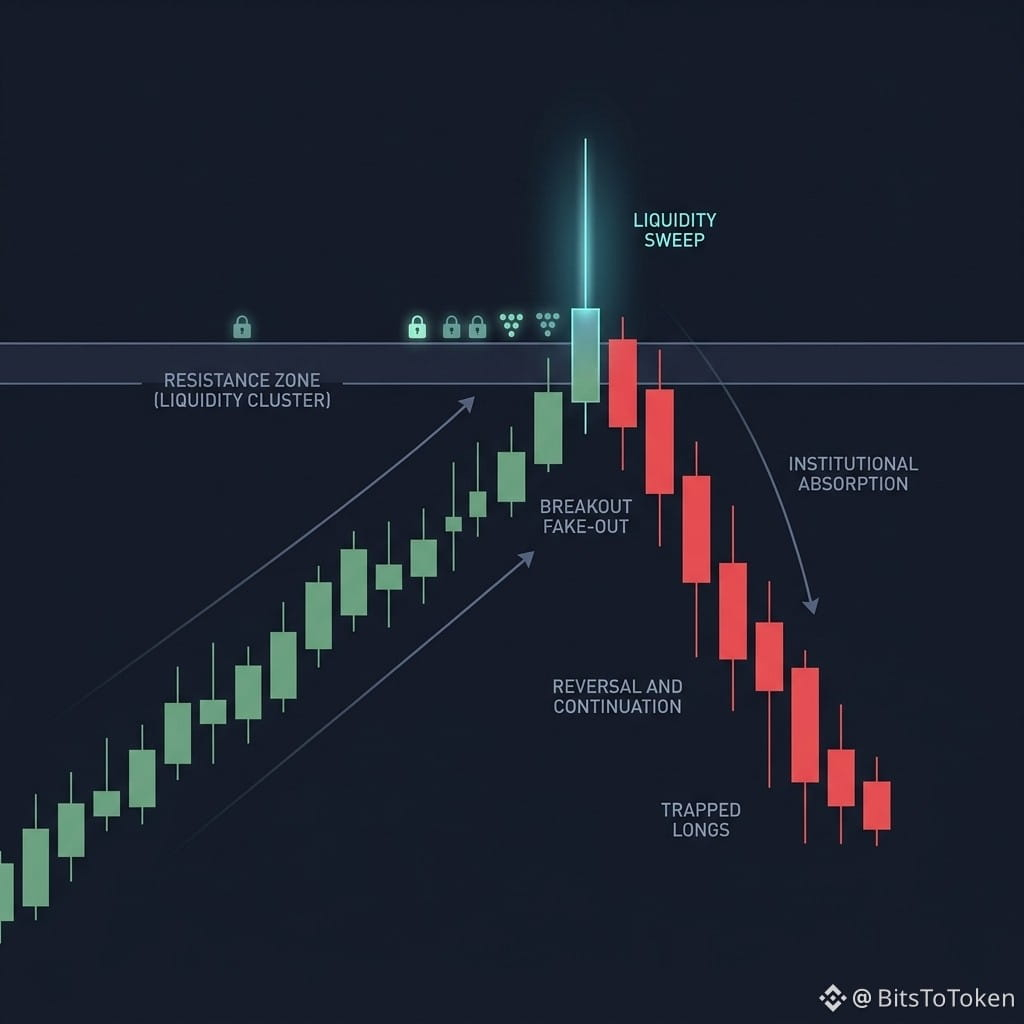
🧠 Ever wondered why price breaks a key level, triggers stop losses, and then suddenly reverses?
This is where liquidity sweeps become interesting. 👀
In financial markets, many traders place stop-loss orders around obvious support and resistance levels.
When price moves beyond these levels, those orders can become market orders, creating a sudden burst of buying or selling activity.
But here's the important part:
A breakout doesn't always mean continuation.
Sometimes, price moves beyond a key level, triggers clustered orders, and then quickly returns to its previous range.
This can be a sign that the breakout failed — but context matters.
So, instead of immediately chasing every breakout, pay attention to:
🔹 How price behaves after breaking the level
🔹 Whether it can hold beyond that level
🔹 The strength of the move and what happens afterward
The real clue isn't just that price broke a level.
It's what price does next.
Because in trading, the reaction after the breakout can tell you more than the breakout itself. 📊
$BTC $ETH $SOL
#EarningsSeason #BitwiseLaunchesFirstSpotNEARETF #USJobOpeningsFallToFiveMonthLow
🧠 Ever wondered why price breaks a key level, triggers stop losses, and then suddenly reverses?
This is where liquidity sweeps become interesting. 👀
In financial markets, many traders place stop-loss orders around obvious support and resistance levels.
When price moves beyond these levels, those orders can become market orders, creating a sudden burst of buying or selling activity.
But here's the important part:
A breakout doesn't always mean continuation.
Sometimes, price moves beyond a key level, triggers clustered orders, and then quickly returns to its previous range.
This can be a sign that the breakout failed — but context matters.
So, instead of immediately chasing every breakout, pay attention to:
🔹 How price behaves after breaking the level
🔹 Whether it can hold beyond that level
🔹 The strength of the move and what happens afterward
The real clue isn't just that price broke a level.
It's what price does next.
Because in trading, the reaction after the breakout can tell you more than the breakout itself. 📊
$BTC $ETH $SOL
#EarningsSeason #BitwiseLaunchesFirstSpotNEARETF #USJobOpeningsFallToFiveMonthLow
This is where liquidity sweeps become interesting. 👀
In financial markets, many traders place stop-loss orders around obvious support and resistance levels.
When price moves beyond these levels, those orders can become market orders, creating a sudden burst of buying or selling activity.
But here's the important part:
A breakout doesn't always mean continuation.
Sometimes, price moves beyond a key level, triggers clustered orders, and then quickly returns to its previous range.
This can be a sign that the breakout failed — but context matters.
So, instead of immediately chasing every breakout, pay attention to:
🔹 How price behaves after breaking the level
🔹 Whether it can hold beyond that level
🔹 The strength of the move and what happens afterward
The real clue isn't just that price broke a level.
It's what price does next.
Because in trading, the reaction after the breakout can tell you more than the breakout itself. 📊
$BTC $ETH $SOL
#EarningsSeason #BitwiseLaunchesFirstSpotNEARETF #USJobOpeningsFallToFiveMonthLow
1
279
·
--
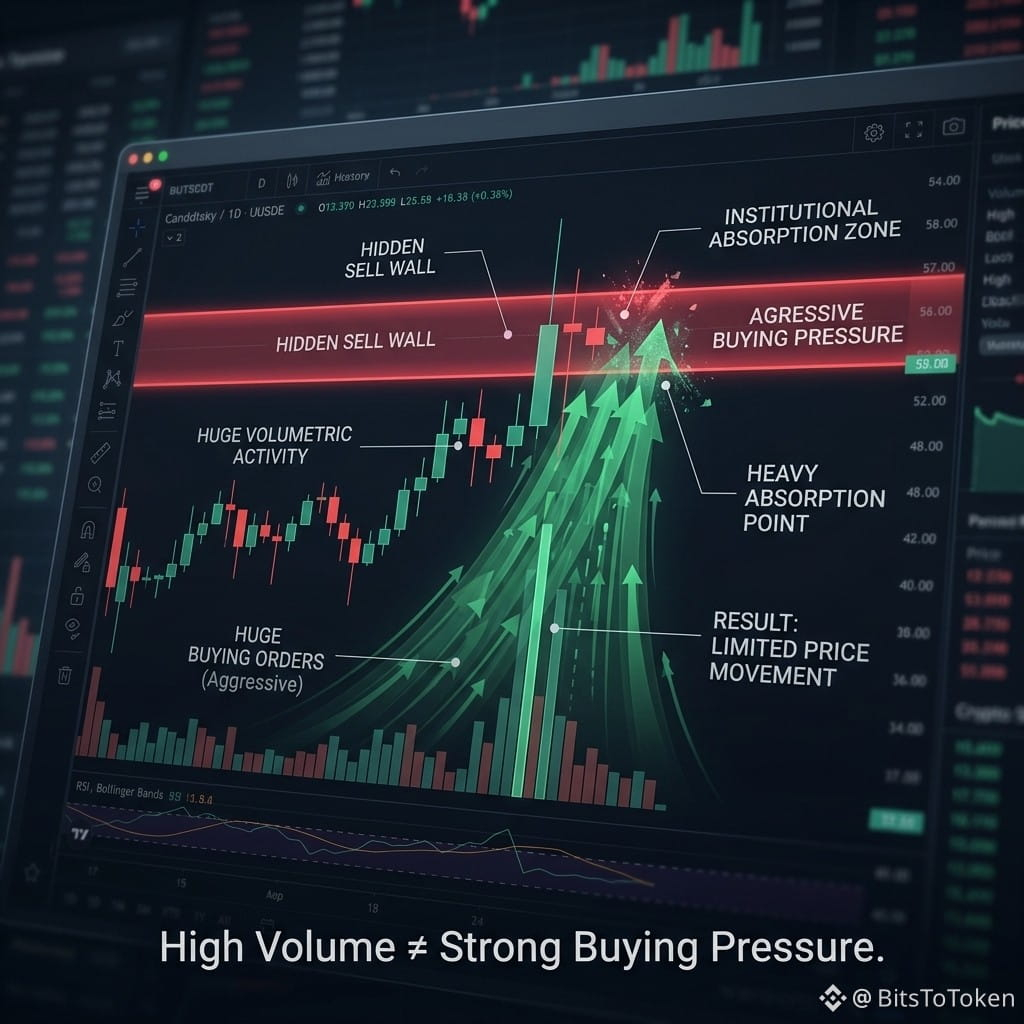
🧠 High volume ≠ strong buying pressure
Have you ever seen a candle with a sudden spike in volume, but the price barely moves?
This is interesting because *volume only shows how much trading activity took place*. It doesn’t tell you who is winning.
For example, aggressive buyers may enter with large orders, but at the same time, sellers continue absorbing that buying pressure.
The result?
Very high volume, but only a small price movement.
This phenomenon is often referred to as *absorption*.
So instead of only asking:
> “Is the volume high or low?”
Try asking:
“With that much volume, how far did the price actually move?”
Sometimes, *high volume + small price movement* can be much more interesting than high volume followed by a huge candle. 👀
$XRP $BTC $DOGE
#CryptoAnalysis #BitgetDetailsSecurityIncidentTimeline #FedProposesPaymentStablecoinRules
🧠 High volume ≠ strong buying pressure
Have you ever seen a candle with a sudden spike in volume, but the price barely moves?
This is interesting because *volume only shows how much trading activity took place*. It doesn’t tell you who is winning.
For example, aggressive buyers may enter with large orders, but at the same time, sellers continue absorbing that buying pressure.
The result?
Very high volume, but only a small price movement.
This phenomenon is often referred to as *absorption*.
So instead of only asking:
> “Is the volume high or low?”
Try asking:
“With that much volume, how far did the price actually move?”
Sometimes, *high volume + small price movement* can be much more interesting than high volume followed by a huge candle. 👀
$XRP $BTC $DOGE
#CryptoAnalysis #BitgetDetailsSecurityIncidentTimeline #FedProposesPaymentStablecoinRules
Have you ever seen a candle with a sudden spike in volume, but the price barely moves?
This is interesting because *volume only shows how much trading activity took place*. It doesn’t tell you who is winning.
For example, aggressive buyers may enter with large orders, but at the same time, sellers continue absorbing that buying pressure.
The result?
Very high volume, but only a small price movement.
This phenomenon is often referred to as *absorption*.
So instead of only asking:
> “Is the volume high or low?”
Try asking:
“With that much volume, how far did the price actually move?”
Sometimes, *high volume + small price movement* can be much more interesting than high volume followed by a huge candle. 👀
$XRP $BTC $DOGE
#CryptoAnalysis #BitgetDetailsSecurityIncidentTimeline #FedProposesPaymentStablecoinRules
1
203
·
--
🧠 A crypto market observation worth paying attention to
Sometimes you’ll see Open Interest (OI) rising while price barely moves.
At first glance, increasing OI might look bullish because it means more positions are entering the market.
But OI alone doesn’t tell you who is in control.
When OI increases while price stays trapped in a narrow range, it can indicate that leverage is building up on both sides of the market.
That creates an interesting situation:
🔹 More leveraged positions
🔹 Price remains relatively stable
🔹 Liquidity accumulates around key levels
🔹 The market becomes increasingly vulnerable to a sharp move
The interesting part comes next.
When the range finally breaks, the move can accelerate because liquidations start adding forced market orders to the existing flow.
This is why I don’t look at OI in isolation.
Price + OI + Funding Rate + Liquidation Data can tell a much more complete story.
Sometimes, the most dangerous market isn’t the one moving violently.
It’s the one that looks too quiet while leverage keeps building underneath. 👀
$QNT $ONE $MARSCOIN
#CryptoAnalysis #FedProposesPaymentStablecoinRules #BitwiseFilesFinalNEARSpotETFProspectus
🧠 A crypto market observation worth paying attention to
Sometimes you’ll see Open Interest (OI) rising while price barely moves.
At first glance, increasing OI might look bullish because it means more positions are entering the market.
But OI alone doesn’t tell you who is in control.
When OI increases while price stays trapped in a narrow range, it can indicate that leverage is building up on both sides of the market.
That creates an interesting situation:
🔹 More leveraged positions
🔹 Price remains relatively stable
🔹 Liquidity accumulates around key levels
🔹 The market becomes increasingly vulnerable to a sharp move
The interesting part comes next.
When the range finally breaks, the move can accelerate because liquidations start adding forced market orders to the existing flow.
This is why I don’t look at OI in isolation.
Price + OI + Funding Rate + Liquidation Data can tell a much more complete story.
Sometimes, the most dangerous market isn’t the one moving violently.
It’s the one that looks too quiet while leverage keeps building underneath. 👀
$QNT $ONE $MARSCOIN
#CryptoAnalysis #FedProposesPaymentStablecoinRules #BitwiseFilesFinalNEARSpotETFProspectus
Sometimes you’ll see Open Interest (OI) rising while price barely moves.
At first glance, increasing OI might look bullish because it means more positions are entering the market.
But OI alone doesn’t tell you who is in control.
When OI increases while price stays trapped in a narrow range, it can indicate that leverage is building up on both sides of the market.
That creates an interesting situation:
🔹 More leveraged positions
🔹 Price remains relatively stable
🔹 Liquidity accumulates around key levels
🔹 The market becomes increasingly vulnerable to a sharp move
The interesting part comes next.
When the range finally breaks, the move can accelerate because liquidations start adding forced market orders to the existing flow.
This is why I don’t look at OI in isolation.
Price + OI + Funding Rate + Liquidation Data can tell a much more complete story.
Sometimes, the most dangerous market isn’t the one moving violently.
It’s the one that looks too quiet while leverage keeps building underneath. 👀
$QNT $ONE $MARSCOIN
#CryptoAnalysis #FedProposesPaymentStablecoinRules #BitwiseFilesFinalNEARSpotETFProspectus

1
366
·
--
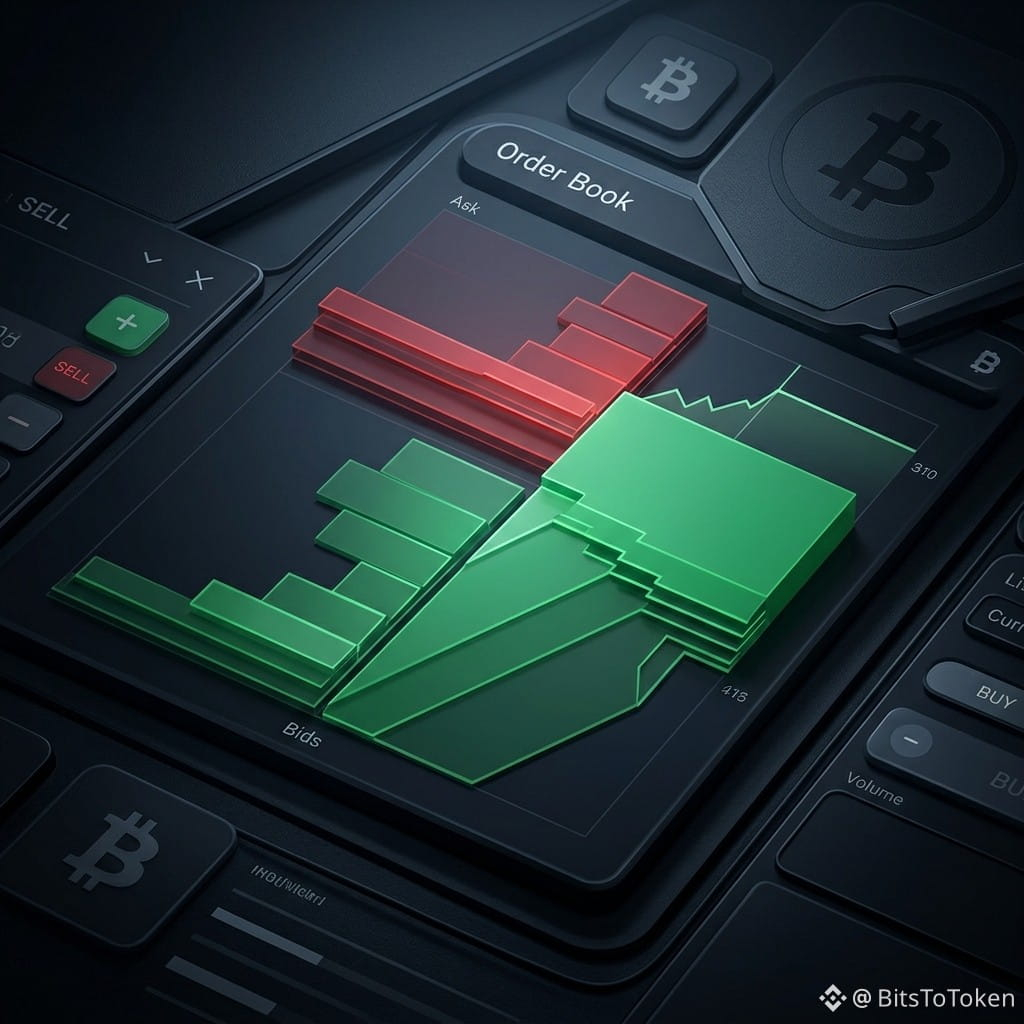
🧠 A little crypto knowledge that might surprise you...
Have you ever wondered why a coin’s price can suddenly rise so quickly?
It’s not simply because “a lot of people are buying.” There’s another important factor that is often overlooked: liquidity.
Think of the order book like a marketplace. If there are only a few sell orders available at a certain price level, a large buy order can consume those sell orders and push the price to the next level. 📈
That’s why markets with thin liquidity can move very quickly.
On the other hand, markets with deep liquidity usually require much larger transactions to move the price significantly.
So before looking at a coin and thinking:
> “Wow, the volume is huge. It must be going up.”
Try looking at these things too:
🔹 How deep is the order book?
🔹 How does the trading volume compare to liquidity?
🔹 Is the price movement supported by healthy market activity?
High volume ≠ automatically means the price will rise.
The more we understand how the market works, the less likely we are to get carried away by price movements. 🧠
Learn a little every day. 🚀
$NVDAB $ONG $BTC
#CryptoEducation4All #TradingTips #BitwiseFilesFinalNEARSpotETFProspectus
🧠 A little crypto knowledge that might surprise you...
Have you ever wondered why a coin’s price can suddenly rise so quickly?
It’s not simply because “a lot of people are buying.” There’s another important factor that is often overlooked: liquidity.
Think of the order book like a marketplace. If there are only a few sell orders available at a certain price level, a large buy order can consume those sell orders and push the price to the next level. 📈
That’s why markets with thin liquidity can move very quickly.
On the other hand, markets with deep liquidity usually require much larger transactions to move the price significantly.
So before looking at a coin and thinking:
> “Wow, the volume is huge. It must be going up.”
Try looking at these things too:
🔹 How deep is the order book?
🔹 How does the trading volume compare to liquidity?
🔹 Is the price movement supported by healthy market activity?
High volume ≠ automatically means the price will rise.
The more we understand how the market works, the less likely we are to get carried away by price movements. 🧠
Learn a little every day. 🚀
$NVDAB $ONG $BTC
#CryptoEducation4All #TradingTips #BitwiseFilesFinalNEARSpotETFProspectus
Have you ever wondered why a coin’s price can suddenly rise so quickly?
It’s not simply because “a lot of people are buying.” There’s another important factor that is often overlooked: liquidity.
Think of the order book like a marketplace. If there are only a few sell orders available at a certain price level, a large buy order can consume those sell orders and push the price to the next level. 📈
That’s why markets with thin liquidity can move very quickly.
On the other hand, markets with deep liquidity usually require much larger transactions to move the price significantly.
So before looking at a coin and thinking:
> “Wow, the volume is huge. It must be going up.”
Try looking at these things too:
🔹 How deep is the order book?
🔹 How does the trading volume compare to liquidity?
🔹 Is the price movement supported by healthy market activity?
High volume ≠ automatically means the price will rise.
The more we understand how the market works, the less likely we are to get carried away by price movements. 🧠
Learn a little every day. 🚀
$NVDAB $ONG $BTC
#CryptoEducation4All #TradingTips #BitwiseFilesFinalNEARSpotETFProspectus
1
592
·
--
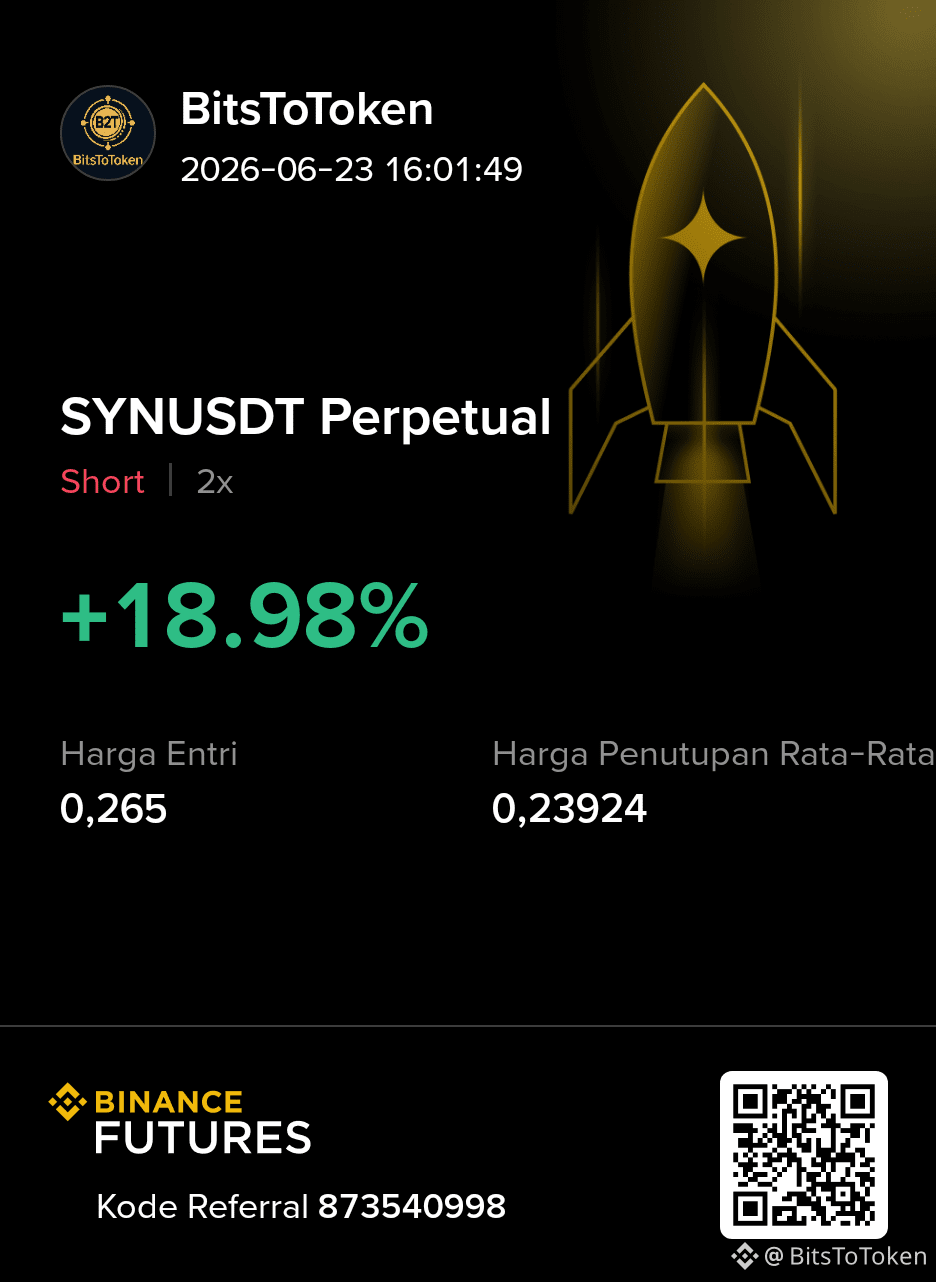
thank you again $SYN
you are the best
I'll be back later
random tag : $DEXE $UB
thank you again $SYN
you are the best
I'll be back later
random tag : $DEXE $UB
you are the best
I'll be back later
random tag : $DEXE $UB
1
44
·
--
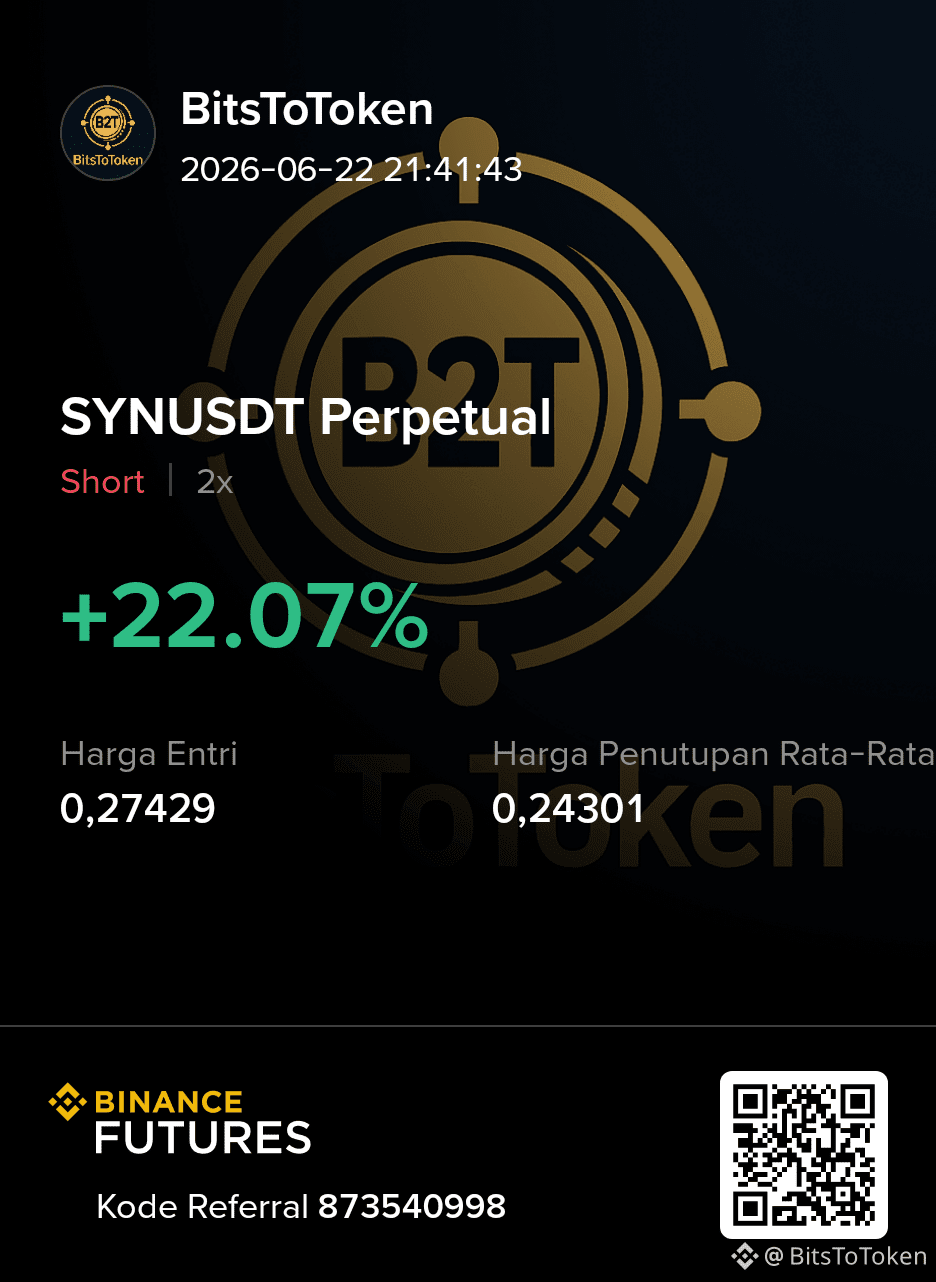
thank God for another profit
thank you $SYN
I"ll be back to you later
random tag :
$ETH $BTC
{future}(SYNUSDT)
thank God for another profit
thank you $SYN
I"ll be back to you later
random tag :
$ETH $BTC
thank you $SYN
I"ll be back to you later
random tag :
$ETH $BTC
1
60
·
--
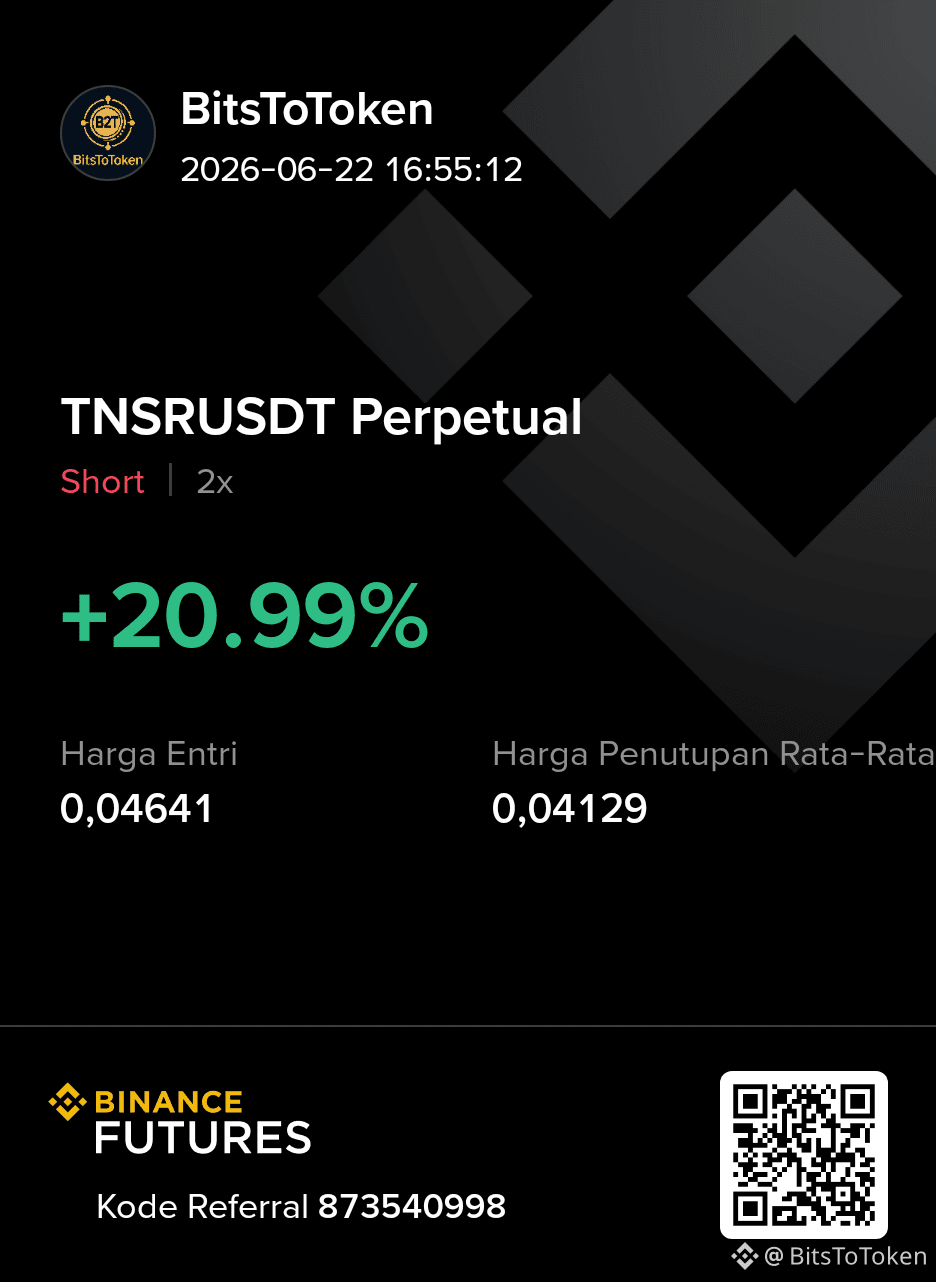
thank you $TNSR
I'll come to you later
$BTC $ETH
thank you $TNSR
I'll come to you later
$BTC $ETH
I'll come to you later
$BTC $ETH
1
28
·
--
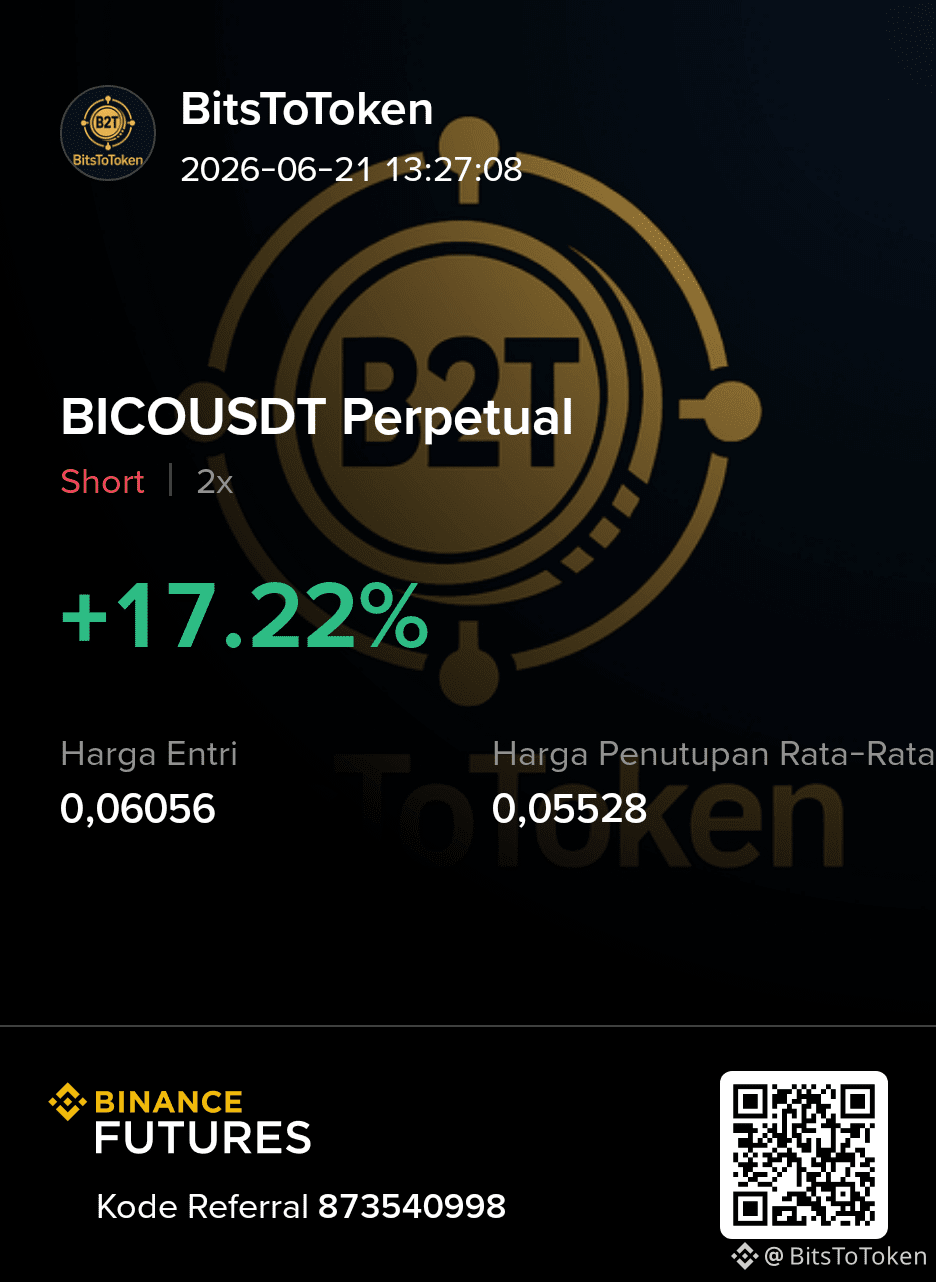
thank you $BICO
I'll come to you later
random tag :
$BTC $SPCX
thank you $BICO
I'll come to you later
random tag :
$BTC $SPCX
I'll come to you later
random tag :
$BTC $SPCX
1
38
Log in to explore more content
Join global crypto users on Binance Square
⚡️ Get latest and useful information about crypto.
💬 Trusted by the world’s largest crypto exchange.
👍 Discover real insights from verified creators.
Email / Phone number
Trending Topics
CryptoSelloffTriggersMultipleWhaleLiquidations
8 views
24 Discussing
Crypto Liquidations Top $2B in 24 Hours as 329,000 Traders Are Wiped Out
Binance News
·2 Likes
·677 views
WillFOMCMinutesReinforceRateHikeExpectations?
0 views
0 Discussing
USSpotXRPETFsSeeLargestWeeklyOutflowIn8Months
41,445 views
477 Discussing