

靠谱哥目标10BTC
101 Posts

靠谱哥目标10BTC
Report
Block User
31 Following
180 Followers
76 Liked
Posts
All
Quotes
Videos
·
--
Verified
FOMC holds rates steady: Five coins rebound—who can break through resistance first?
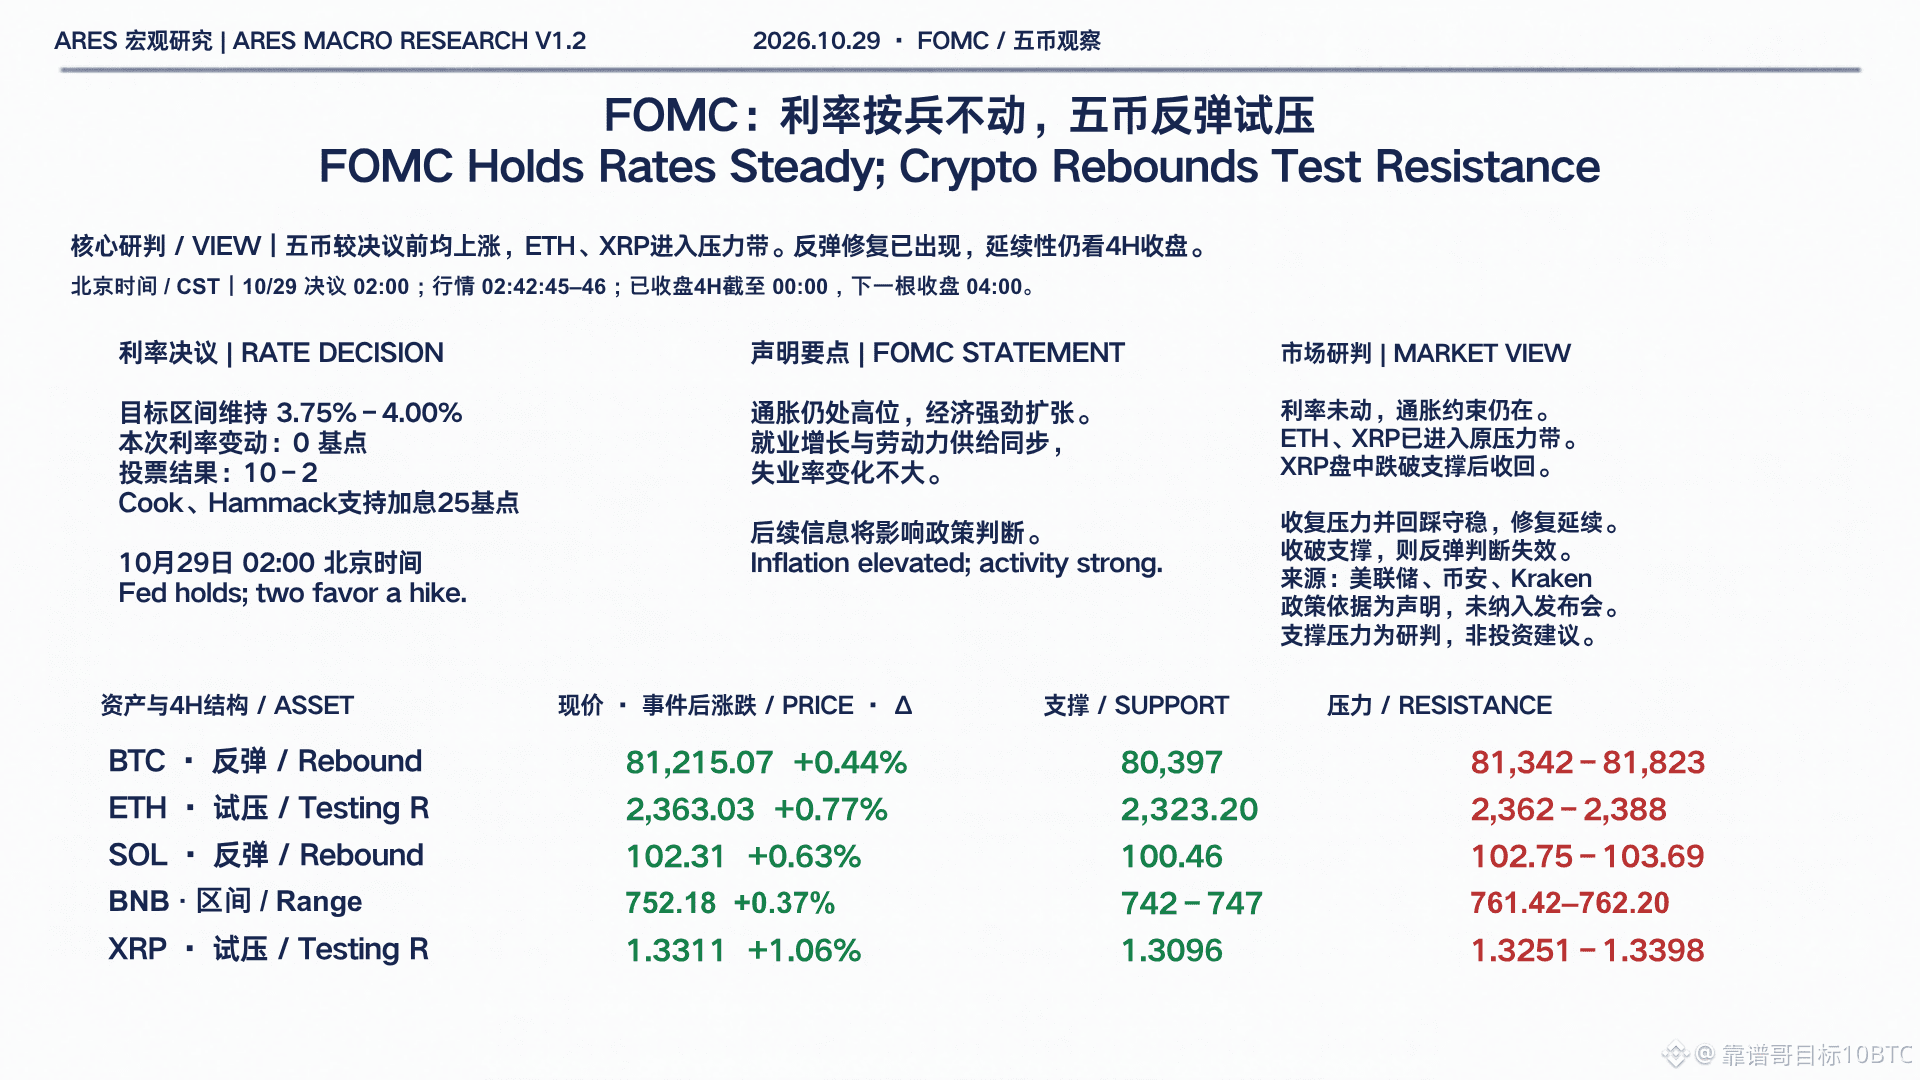
The Fed kept the federal funds target rate at 3.75%–4.00%, with a 10–2 vote; Cook and Hammack favored a 25-basis-point hike. The statement noted that economic activity has been expanding at a solid pace, inflation remains elevated, job gains and labor supply have continued to move in tandem, and the unemployment rate has changed little. Holding rates steady does not necessarily mean a shift toward easing; that is our interpretation of the statement.
【Market snapshot | Beijing time 10/29 02:42:45–46】
The following are Binance spot USDT quotes; changes are relative to the 01:59 close before the decision, not 24-hour changes.
BTC 81,215.07, +0.44%
ETH 2,363.03, +0.77%
SOL 102.31, +0.63%
BNB 752.18, +0.37%
XRP 1.3311, +1.06%
【Four-hour structure and conditional outlook】
BTC: The rebound has yet to reclaim the 81,342–81,823 resistance zone; structural support below is 80,397.
ETH: Price has entered the 2,362–2,388 resistance zone. A four-hour close above it followed by a successful retest is needed to confirm that this zone has flipped from resistance to support; the original structural support is 2,323.20.
SOL: The rebound is recovering, but price still needs to reclaim 102.75–103.69; structural support below is 100.46.
BNB: Still within its range; support is 742–747, and resistance is 761.42–762.20. The current four-hour candle hit a low of 746.67 intraperiod, then rebounded after reaching the support zone.
XRP: Price has entered the 1.3251–1.3398 resistance zone; the current candle hit an intraperiod low of 1.3078, briefly fell below 1.3096, then recovered. It should not be described as having closed below that level on the four-hour chart. The next key development to watch is how price retests after breaking above resistance.
All five coins are up versus before the decision, and a rebound is underway. ETH and XRP have entered their prior resistance zones first, while BTC and SOL still need to reclaim key levels above. 04:00 Beijing time is the next four-hour close to watch. Reclaiming resistance and holding it on a retest would give the recovery room to continue; a close below support would invalidate the corresponding rebound outlook.
There is no new completed four-hour candle yet, so the original structural levels are not being moved around in response to minute-by-minute price changes. The support and resistance levels above are analytical reference points based on completed four-hour swing points and the daily chart context—not price targets that are guaranteed to be reached. Short-term price movements cannot be attributed to the FOMC alone. The policy section is based on the published statement and does not include the press conference.
Sources: Federal Reserve, Binance; cross-checked against Kraken USD quotes. Prices may differ across exchanges, quote currencies, and timestamps; they are not intended for precise return comparisons.
Fed statement: https://www.federalreserve.gov/newsevents/pressreleases/monetary20261028a.htm
Not investment advice.
Are you watching ETH and XRP break resistance, or waiting for BTC and SOL to follow?
#美联储 #BTC #Crypto Market
1
1
1.5k
·
--
Anthropic’s IPO: Are you buying the company’s value, or the price others may be willing to pay in the future?
Keynes’s “beauty contest” theory is fascinating when applied to AI valuations today: we’re judging the company while also guessing how others will judge it.
My take: revenue growth is worth watching, but ultimately, it comes down to whether profits materialize. Even with a great company, it’s worth asking: Is it worth this price?
#Anthropic #AI #IPO

65
·
--
“Interest rates are the price of borrowing money.”
Higher interest rates → mortgages and business loans may become more expensive → people spend less and businesses invest less → upward pressure on prices may ease.
A small caveat: this takes time and can’t directly solve shortages.
“Interest rates are the price of borrowing money.”
Higher interest rates → mortgages and business loans may become more expensive → people spend less and businesses invest less → upward pressure on prices may ease.
A small caveat: this takes time and can’t directly solve shortages.
Higher interest rates → mortgages and business loans may become more expensive → people spend less and businesses invest less → upward pressure on prices may ease.
A small caveat: this takes time and can’t directly solve shortages.

63
·
--
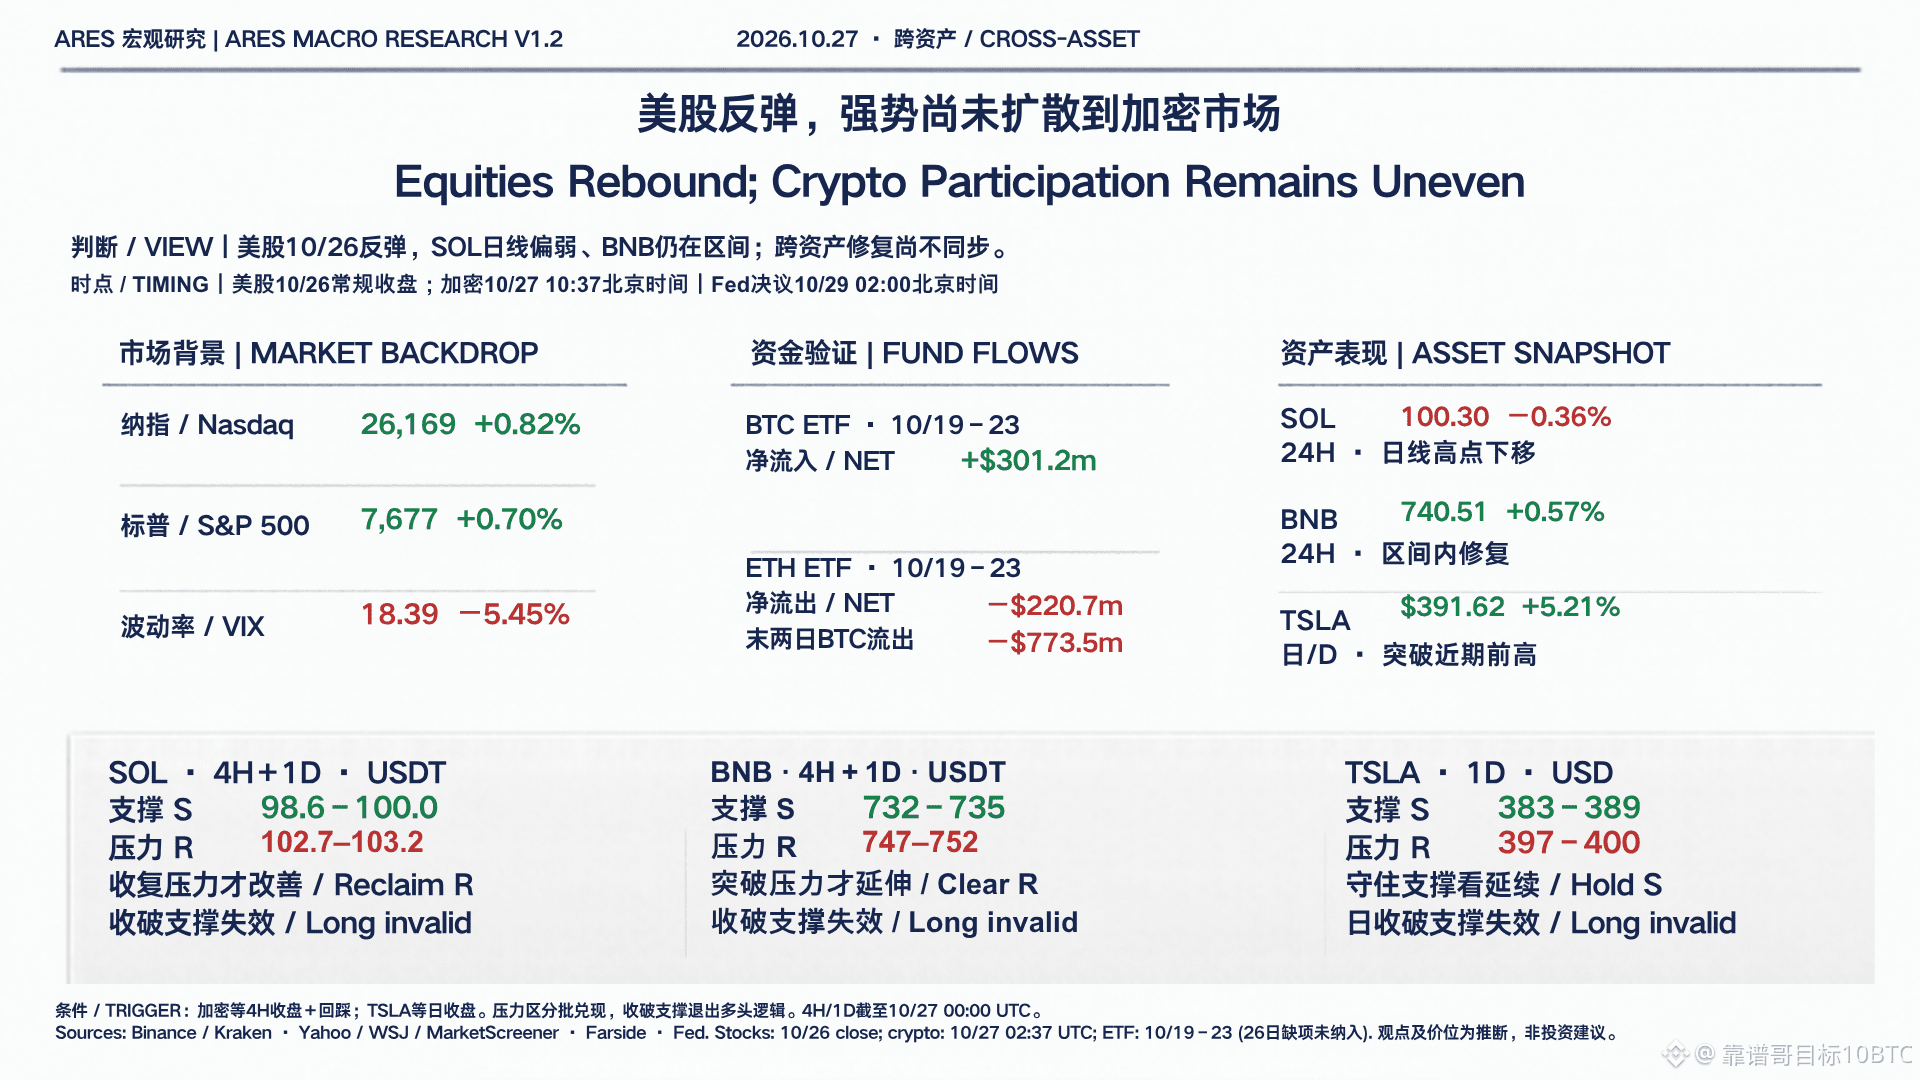
After the US stock rebound, can SOL and BNB keep pace with Tesla’s recovery?
US stocks have recovered, but risk appetite across asset classes has yet to return in tandem. TSLA has reclaimed its recent prior high, while SOL’s daily highs continue to move lower and BNB remains range-bound.
My view: watch whether strength can continue, while using key levels to assess whether the crypto market is following suit.
• SOL: support at 98.6–100.0; resistance at 102.7–103.2 USDT.
• BNB: support at 732–735; resistance at 747–752 USDT.
• TSLA: support at $383–389; resistance at $397–400.
For crypto, wait for a 4-hour close above the level and a successful retest; use daily confirmation for TSLA. Watch for profit-taking near resistance. A close below support invalidates the original long thesis. These key levels are analytically derived zones, not guarantees.
On flows, BTC ETFs saw net inflows of $301.2 million from October 19–23, but a combined $773.5 million in outflows over the final two days; ETH ETFs recorded net outflows of $220.7 million over the same period. Weekly net inflows do not replace an assessment of turning points in flows. Some ETF data for October 26 is still missing and has not been included.
US stock data in the chart reflects the regular-session close on October 26; crypto prices are a snapshot taken at 10:37 Beijing time on October 27. The return periods differ, so the figures should not be ranked directly. Sources: Binance, Kraken, Yahoo Finance, Farside, and the Fed; see the chart for full methodology. This is research commentary, not personalized investment advice.
Which are you watching most closely: SOL reclaiming resistance, BNB breaking out of its range, or TSLA holding support?
390
·
--
ARES Macro Research | Funds retreat first, prices move sideways: How convincing is the rebound at the $80,000 level?
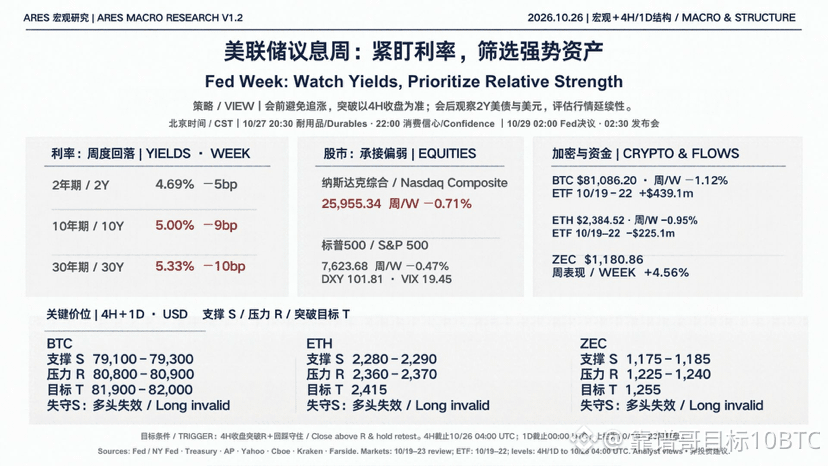
My view: Continue to treat BTC and ETH as recovering within a range. ZEC is stronger in the short term, but localized strength is not enough to confirm a market-wide bull trend. Ahead of the Fed meeting, the key is whether flows and prices can move in the same direction again.
【Facts: Weekly net inflows masked withdrawals ahead of the weekend】
U.S. spot BTC ETFs recorded total net inflows of $301.2 million from October 19–23, but saw net outflows of $635.6 million and $137.9 million on the 22nd and 23rd, respectively—$773.5 million combined over the final two days. ETH ETFs recorded net outflows of $220.7 million for the same week.
This indicates that ETF flows weakened in the latter part of the week. A positive weekly total alone is not enough to conclude that buying pressure is strengthening steadily. ETF creations and redemptions are also not equivalent to spot trades executed at the same moment.
【Market snapshot | October 27, 10:23 Beijing time】
Binance spot USDT: BTC 80,001 (rolling 24-hour change: +0.44%); ETH 2,319 (+0.47%); ZEC 1,227 (+2.26%). Prices vary across exchanges.
【4-hour structure + daily-chart context | USDT】
BTC: Support 79,200–79,450 | Resistance 80,800–81,050.
Daily highs have been declining consecutively, and price has yet to reclaim the upper boundary. A 4-hour close above 81,050 followed by a successful retest would support an extended recovery; a close below 79,200 would invalidate support within the range.
ETH: Support 2,280–2,300 | Resistance 2,345–2,370.
Daily highs have also been moving lower. The quality of the rebound would improve only if ETH reclaims 2,370 on a 4-hour close and holds it on a retest; a close below 2,280 would signal a failed defense.
ZEC: Near-term support 1,210–1,220 | Resistance 1,255–1,270.
Daily lows have been rising consecutively, giving the short-term structure a relative advantage. A 4-hour breakout above 1,270 that holds would support continuation. A close below 1,210 would weaken its relative strength; next, watch 1,175–1,185. Relative strength is not a reason to chase higher prices unconditionally.
【Execution approach | Analytical inference】
The base case is continued back-and-forth trading within the range; avoid chasing a directional move in the middle of it. If trading a breakout, wait for a confirmed 4-hour close and a retest. Take profits in stages near resistance, and exit the long thesis if the corresponding support gives way. If price spikes higher but then closes back below resistance, treat it as a failed breakout and do not carry forward the original bullish view. Account for slippage when considering actual execution and stop-losses; key levels are not guarantees.
【Next verification point】
The Federal Reserve decision is scheduled for October 29 at 02:00 Beijing time, followed by a press conference at 02:30. Watch whether prices can hold above the upper boundary after the decision, and whether subsequent complete ETF data show that outflows are easing. A single news-driven spike does not confirm a trend.
Data methodology: Market prices are snapshots from Binance’s official API, with the magnitude cross-checked against Kraken’s concurrent USD spot prices. The structure analysis uses only completed 4-hour candles up to October 27, 08:00 Beijing time, and complete UTC daily candles. Support and resistance levels are research-derived zones. ETF data are based on the complete October 19–23 figures currently listed by Farside; the 26th is still incomplete and has been excluded. Figures may be revised later.
Sources: api.binance.com; api.kraken.com; farside.co.uk/btc/; farside.co.uk/eth/; federalreserve.gov/monetarypolicy/fomccalendars.htm.
Research opinion; not personalized investment advice.
305
·
--
Bearish
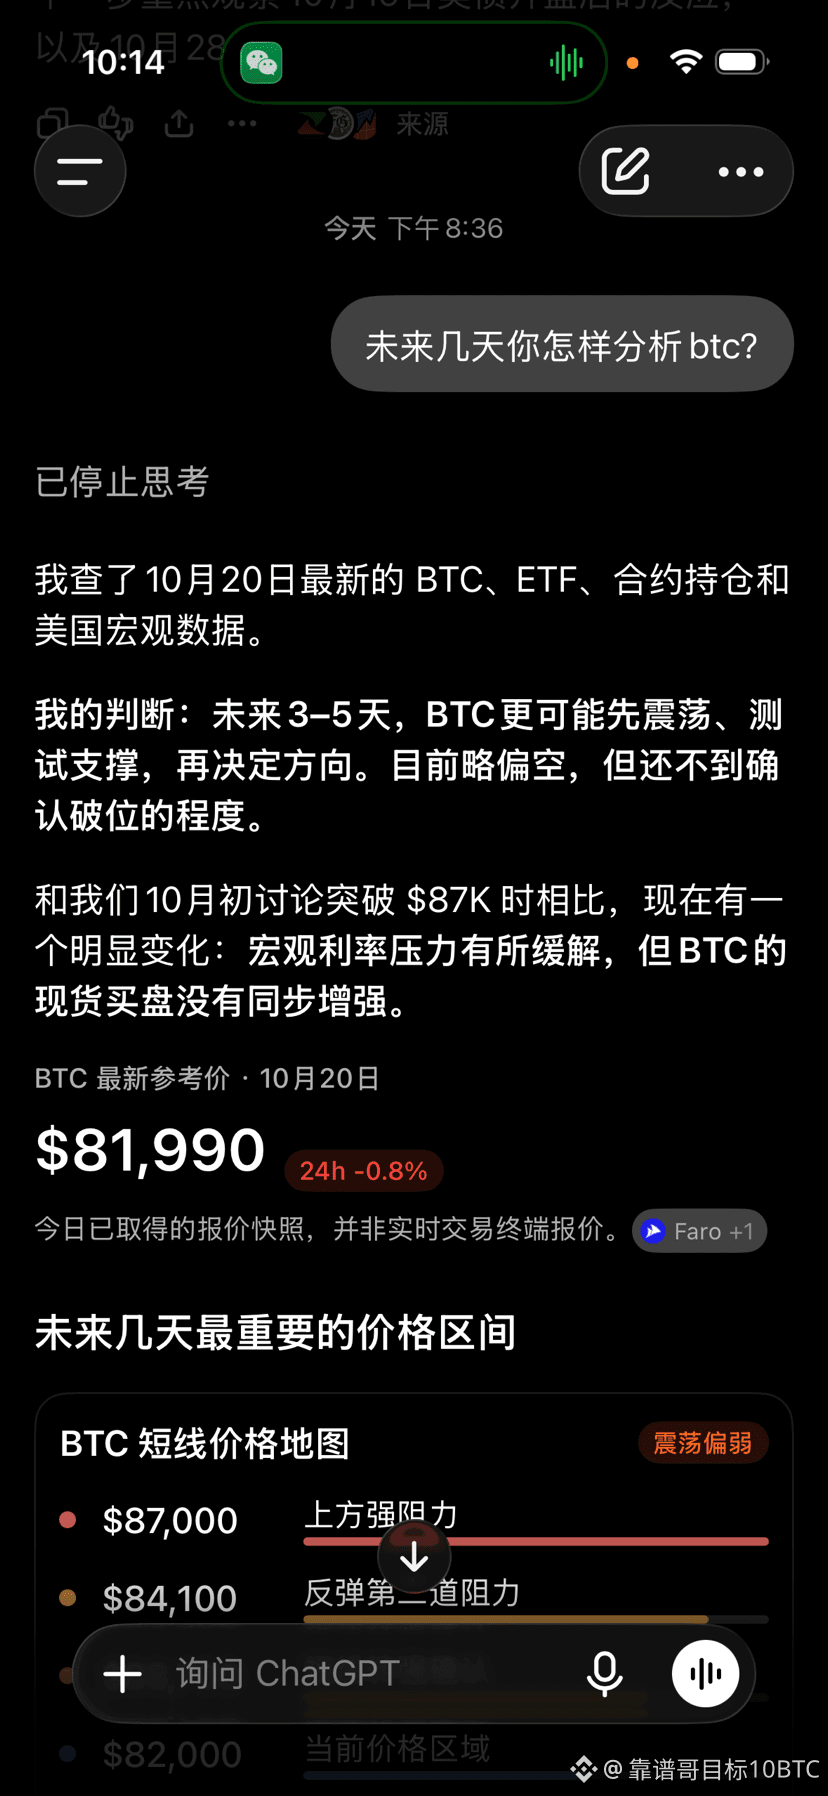
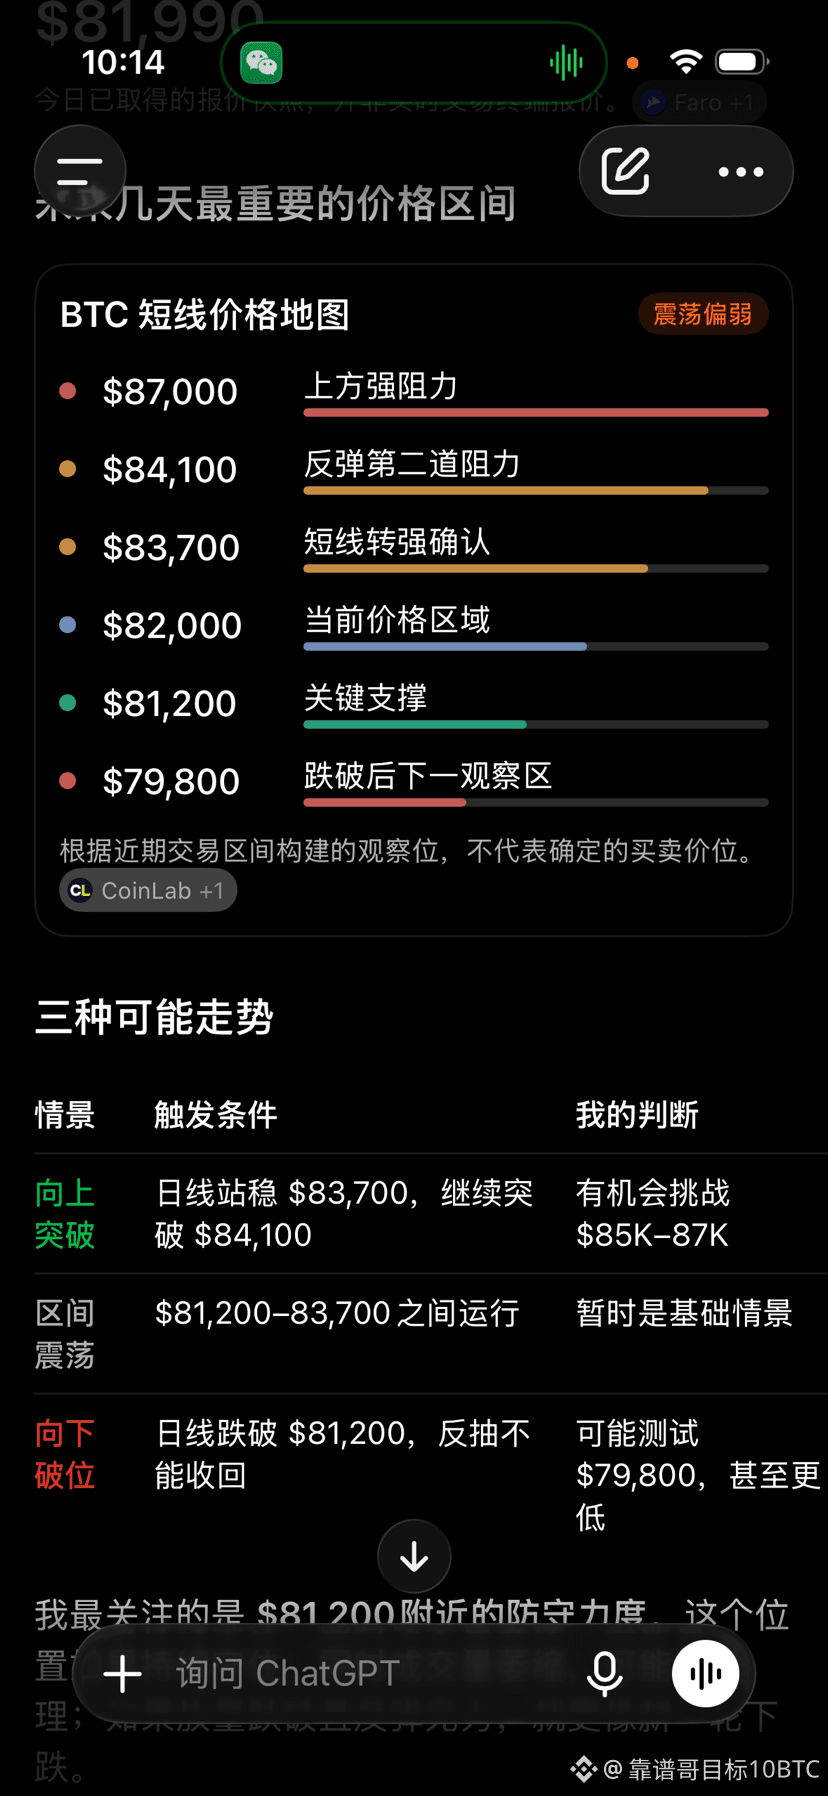
Ares’s exact words last night: My assessment depends on two scenarios:
* If core inflation comes in below market expectations while the dollar and Treasury yields retreat, that would be favorable for BTC. A four-hour close above 84,400 followed by a successful retest would put it in a better position to challenge 86,500–87,300.
* If core inflation comes in above expectations and the dollar and yields strengthen, BTC could come under pressure. If it closes below 82,300, watch for another test of 80,400–81,100. That was the forecast.
靠谱哥目标10BTC
·
--
#一个人量化 #CPI
103
·
--
Bullish
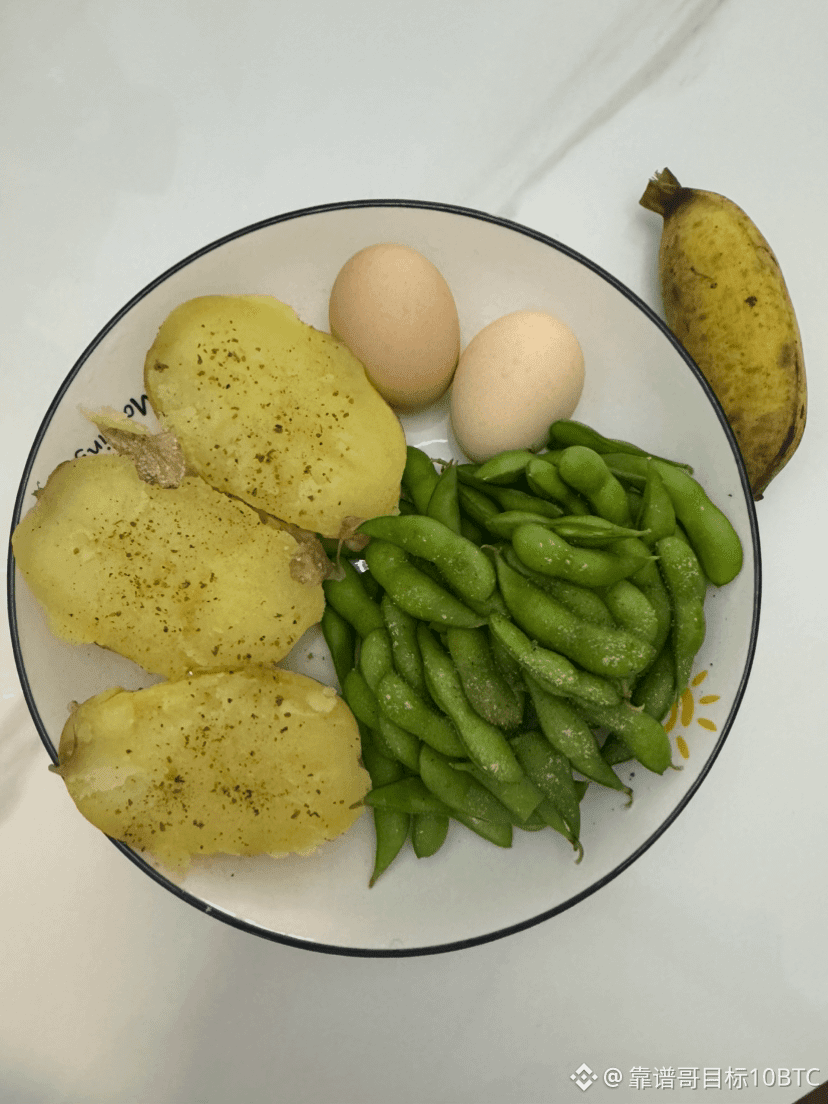
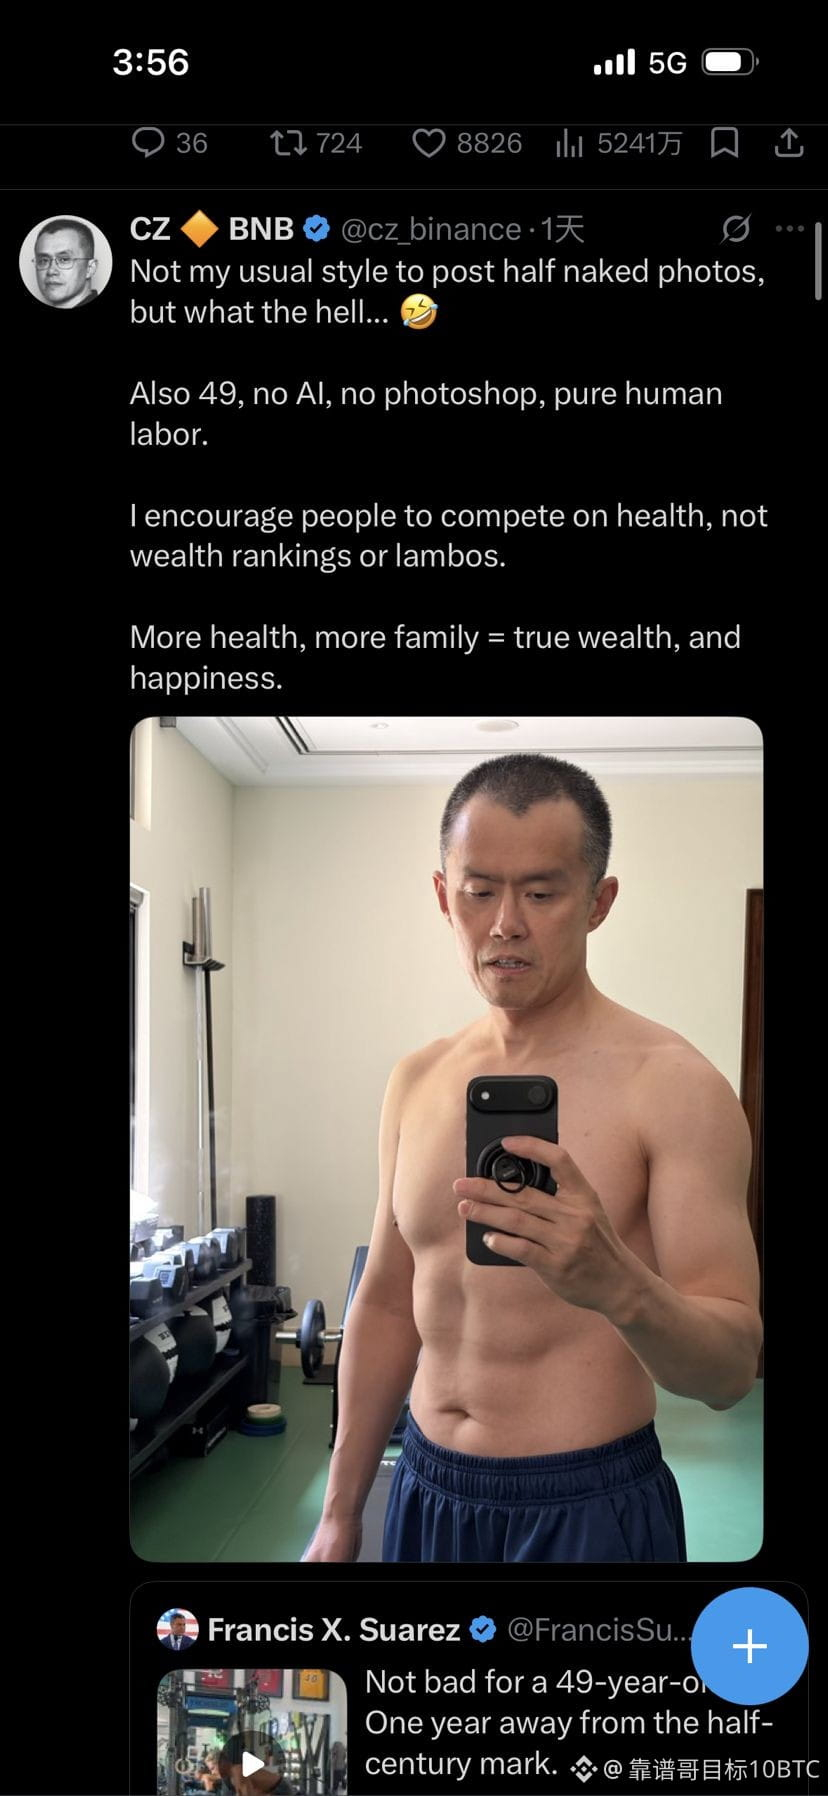
The recently popular #LeanMuscleTheory in Web3 is pretty interesting.
How do I interpret it?
I think it has three layers.
First: a shift from competing over wealth to competing over personal appeal.
In the past, the crypto world often treated wealth, returns, and luxury cars as symbols of success. Now, appearance, physical condition, emotional support, and social skills are becoming another form of competitive edge.
Second: the body becomes a visible signal of self-discipline.
Wealth can come from luck, but maintaining a healthy physique usually takes long-term effort. What a lean, muscular physique conveys is more than just appearance—it also signals discipline, patience, and the ability to manage yourself consistently.
Of course, physique doesn’t define your character, nor does it represent your entire worth as a person.
Third: it’s an attention-driven viral experiment in its own right.
This is the part I find most worth examining.
A concept that originally belonged to the fitness world quickly became a new social narrative through influencer promotion, community imitation, and a sense of identity.
How similar this is to the way meme coins spread.
From an idea, to consensus, to a crowd chasing after it—the underlying force is the attention economy.
Here’s what I’m thinking:
Every era comes up with a new “answer of the moment.” But what truly matters isn’t chasing the answer—it’s understanding why it emerged.
Wealth can compound, knowledge can compound, and so can the benefits of taking care of your body over the long term.
Markets rotate, and narratives come and go.
The one thing always worth investing in for the long term is yourself.
You’ve got this!!![加油][加油][加油]
#薄肌论 #认知复利 #长期主义 #Web3

靠谱哥目标10BTC
·
--
Bullish20x long the body in sync with Cz
123
·
--
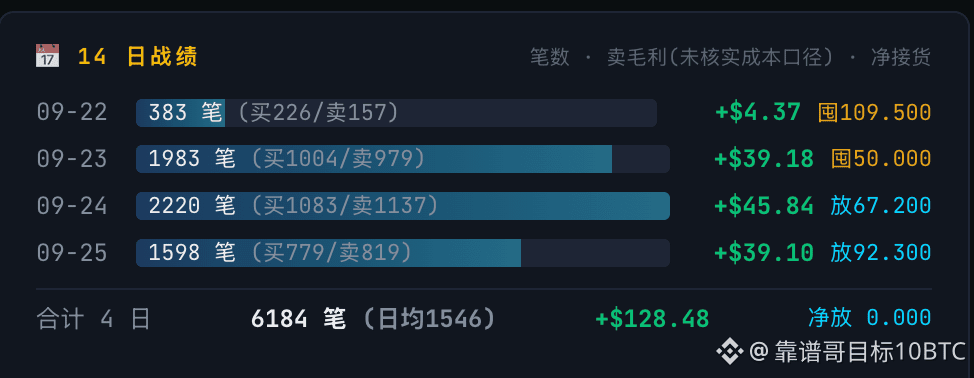
Follow me and build an AI trading ecosystem! Break through 2000 trades 24/7
Follow me and build an AI trading ecosystem! Break through 2000 trades 24/7
101
·
--
Mountains in view, a cool breeze filling my sleeves🍃
For now, I have a moment of peace in the mortal world,
and I can take in the fresh oxygen of the forests.
Investing in the world is much the same—no need to rush at once.
Like a waterfall and fine trickling water flowing steadily,
staying calm is what lets you go far.
记录#AI交易 突破日交易1000笔
For now, I have a moment of peace in the mortal world,
and I can take in the fresh oxygen of the forests.
Investing in the world is much the same—no need to rush at once.
Like a waterfall and fine trickling water flowing steadily,
staying calm is what lets you go far.
记录#AI交易 突破日交易1000笔




106



·
--
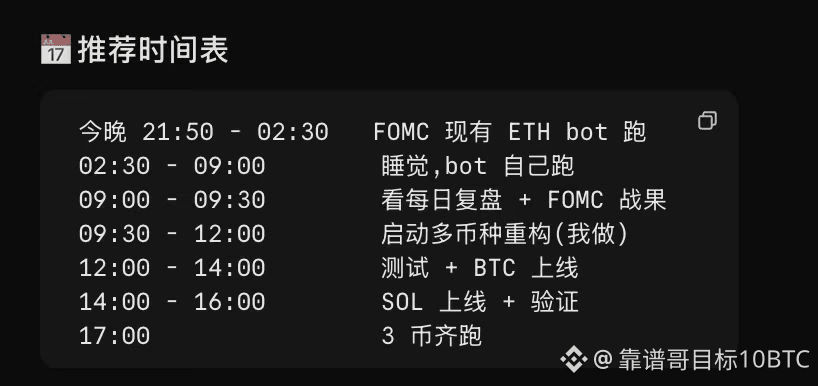
FOMC My Agentic wants me to hit the sack at 2:30💤
FOMC My Agentic wants me to hit the sack at 2:30💤
630
·
--
Finally had the chance to shake hands with Sister He 🤝
Finally had the chance to shake hands with Sister He 🤝

150
·
--
Bearish
63
·
--
Bearish
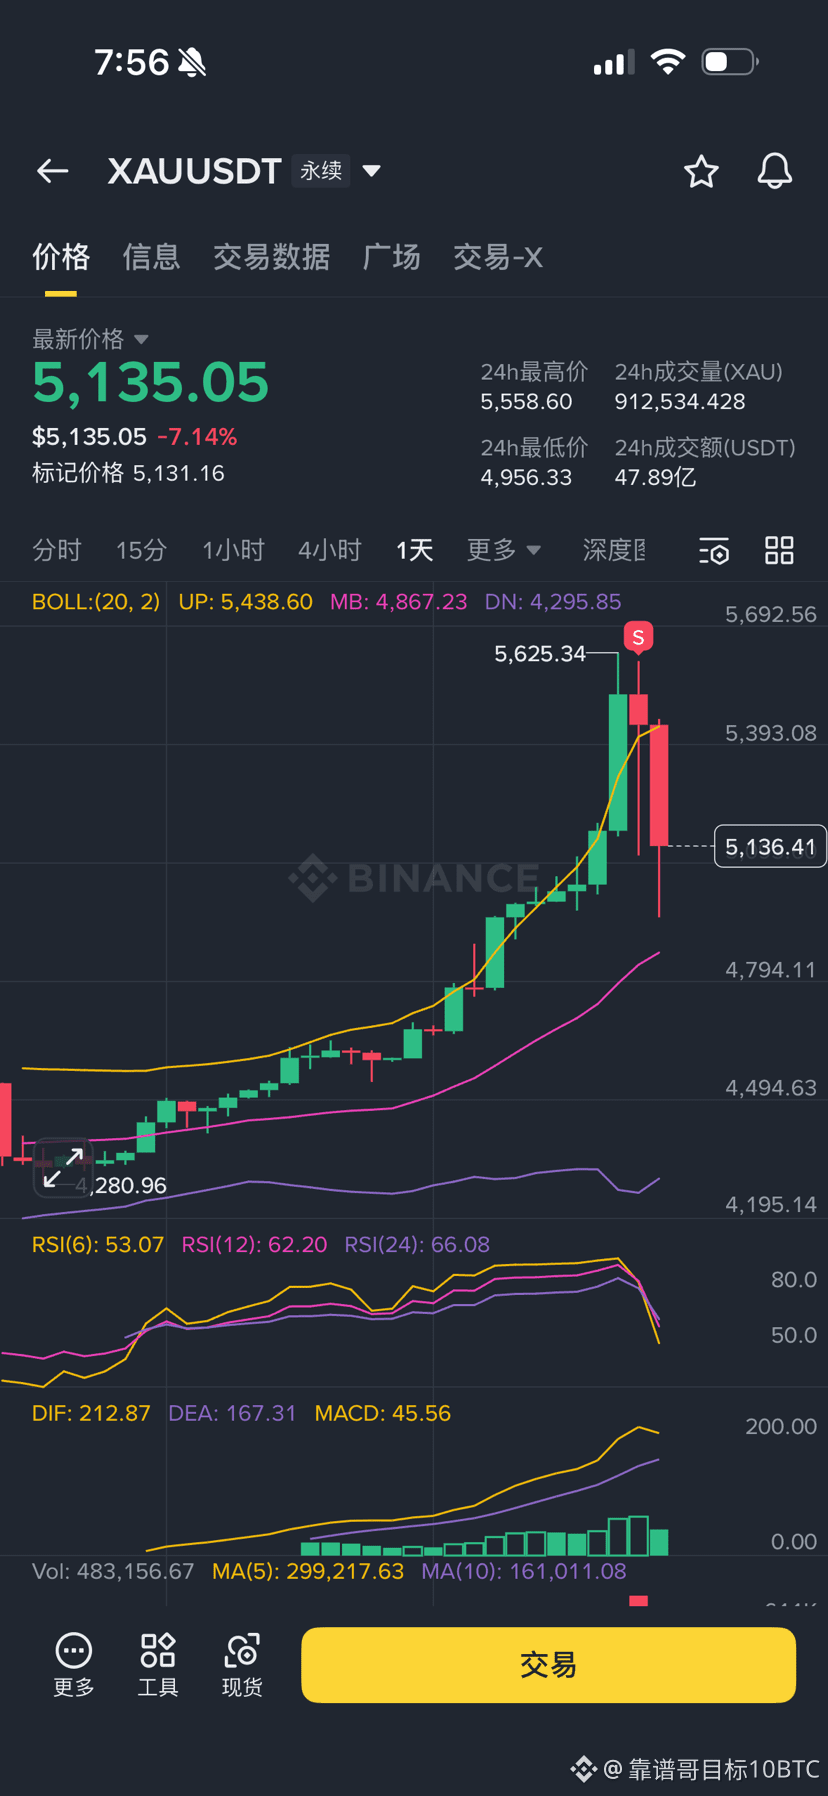
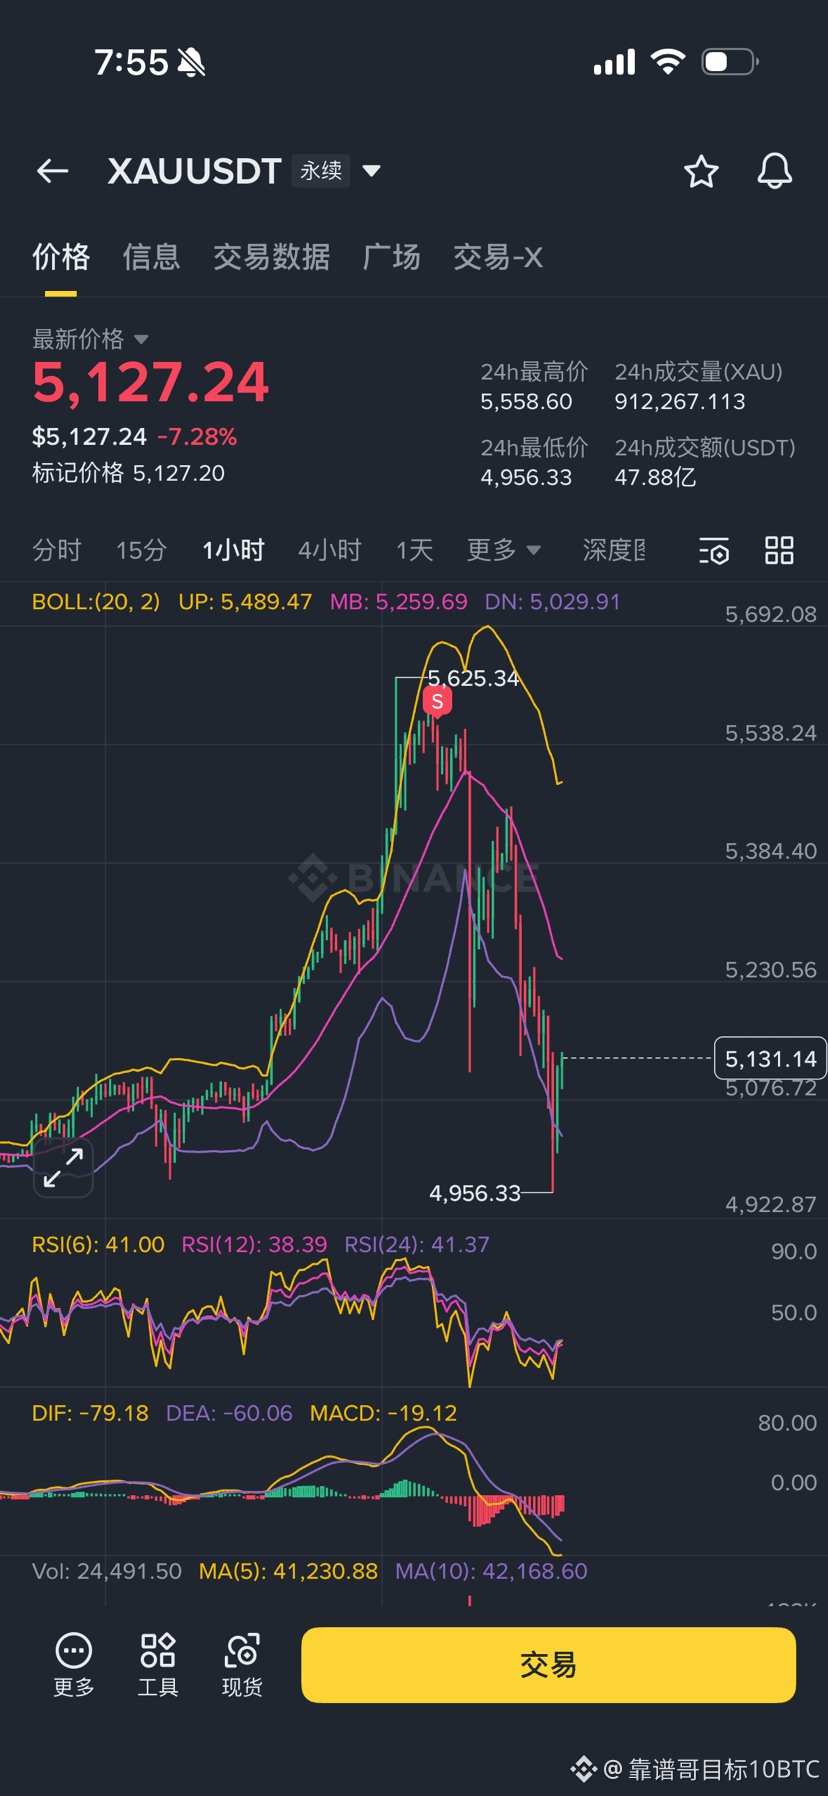
Opened 200u, gold has driven the price down!!!
Opened 200u, gold has driven the price down!!!
317
Log in to explore more content
Join global crypto users on Binance Square
⚡️ Get latest and useful information about crypto.
💬 Trusted by the world’s largest crypto exchange.
👍 Discover real insights from verified creators.
Email / Phone number