After the US stock rebound, can SOL and BNB keep pace with Tesla’s recovery?
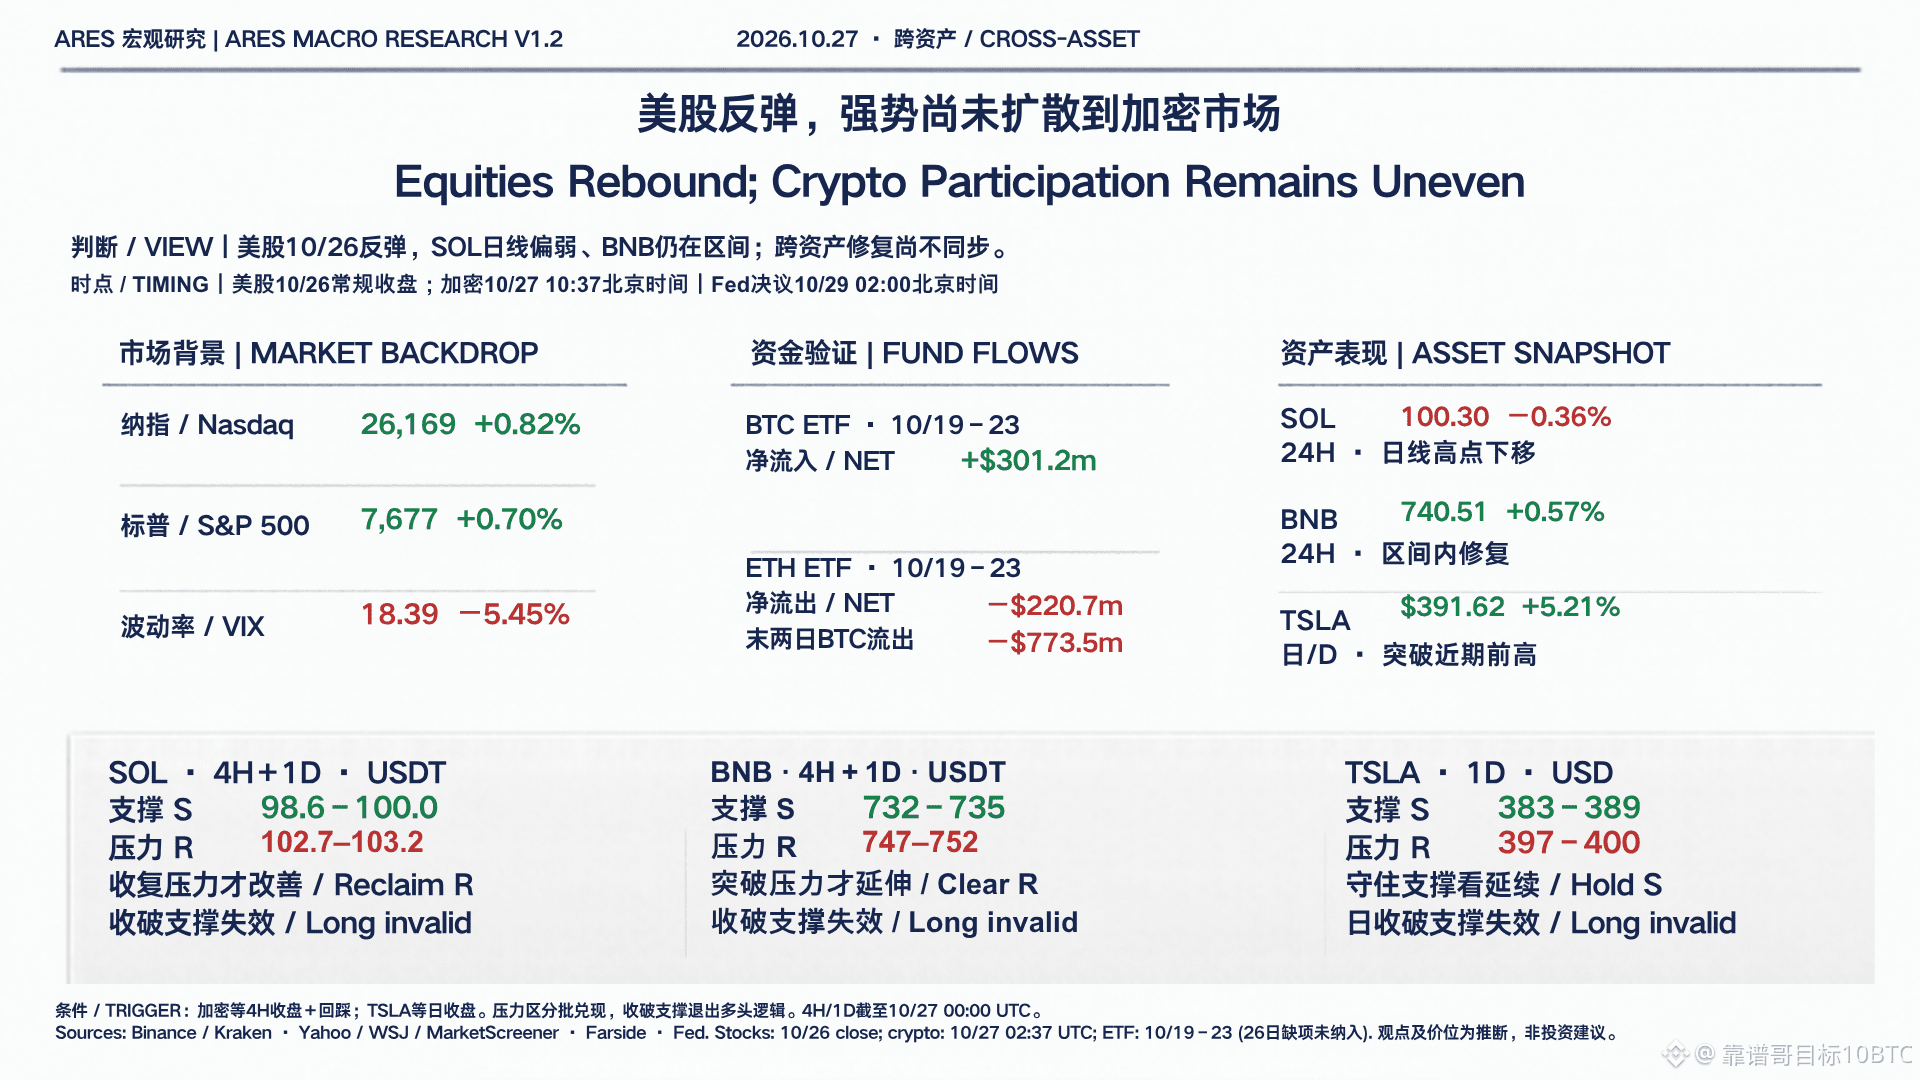
US stocks have recovered, but risk appetite across asset classes has yet to return in tandem. TSLA has reclaimed its recent prior high, while SOL’s daily highs continue to move lower and BNB remains range-bound.
My view: watch whether strength can continue, while using key levels to assess whether the crypto market is following suit.
• SOL: support at 98.6–100.0; resistance at 102.7–103.2 USDT.
• BNB: support at 732–735; resistance at 747–752 USDT.
• TSLA: support at $383–389; resistance at $397–400.
For crypto, wait for a 4-hour close above the level and a successful retest; use daily confirmation for TSLA. Watch for profit-taking near resistance. A close below support invalidates the original long thesis. These key levels are analytically derived zones, not guarantees.
On flows, BTC ETFs saw net inflows of $301.2 million from October 19–23, but a combined $773.5 million in outflows over the final two days; ETH ETFs recorded net outflows of $220.7 million over the same period. Weekly net inflows do not replace an assessment of turning points in flows. Some ETF data for October 26 is still missing and has not been included.
US stock data in the chart reflects the regular-session close on October 26; crypto prices are a snapshot taken at 10:37 Beijing time on October 27. The return periods differ, so the figures should not be ranked directly. Sources: Binance, Kraken, Yahoo Finance, Farside, and the Fed; see the chart for full methodology. This is research commentary, not personalized investment advice.
Which are you watching most closely: SOL reclaiming resistance, BNB breaking out of its range, or TSLA holding support?