

Mr R_W3C
90 Posts

Mr R_W3C
Report
Block User
公众号:Web3C
聚焦Web3领域,投研、推广、社区合作。
Occasional Trader
2.8 Years
17 Following
32 Followers
50 Liked
Posts
All
Quotes
·
--
#zcash24小时上涨8.5%
Up 11%—why is ZEC outperforming BTC and the broader market today?
Today, $ZEC rose approximately 10%–12%, climbing to around $1,250 and significantly outperforming BTC and the broader market.
The main drivers are:
1. The NU7 upgrade decision window is approaching, prompting investors to position early and concentrating buying pressure.
The Zcash development team has finalized the NU7 upgrade timeline and key improvements. The mainnet launch is targeted for November 5. Block times will be shortened from 75 seconds to 25 seconds, increasing confirmation speed by about 3x. The upgrade will also introduce the NSM mechanism and retire the old Sprout pool.
2. Short liquidations added fuel to the rally.
Leveraged short positions had built up after the earlier pullback. The rebound triggered forced liquidations, creating a short squeeze that further amplified the gains.
3. High beta and the privacy narrative provided a boost.
As a high-beta privacy coin, it naturally tends to rise more than BTC when the market recovers;
combined with existing ETFs and the long-term privacy thesis, the sector is showing relative strength.
ZEC price analysis
Technical outlook: The price has broken above some short-term moving averages. Key support is around $1,200, with resistance near $1,292. A decisive breakout could open the way for further gains; otherwise, a pullback is likely.
Fundamentals: If NU7 is implemented on schedule, it should improve confirmation speed and the economic model, which is positive for the medium term. However, actual activation and network performance need to be monitored.
Risks: Event-driven rallies can be large and volatile, making short-term profit-taking likely. If the broader market weakens, its high-beta characteristics could amplify a correction.
Today’s strength is supported by fundamentals, but a trend reversal still needs confirmation through a sustained move above key levels.
Watch whether the price can decisively break above $1,292, as well as the actual data following the upgrade.
{future}(ZECUSDT)
#zcash24小时上涨8.5%
Up 11%—why is ZEC outperforming BTC and the broader market today?
Today, $ZEC rose approximately 10%–12%, climbing to around $1,250 and significantly outperforming BTC and the broader market.
The main drivers are:
1. The NU7 upgrade decision window is approaching, prompting investors to position early and concentrating buying pressure.
The Zcash development team has finalized the NU7 upgrade timeline and key improvements. The mainnet launch is targeted for November 5. Block times will be shortened from 75 seconds to 25 seconds, increasing confirmation speed by about 3x. The upgrade will also introduce the NSM mechanism and retire the old Sprout pool.
2. Short liquidations added fuel to the rally.
Leveraged short positions had built up after the earlier pullback. The rebound triggered forced liquidations, creating a short squeeze that further amplified the gains.
3. High beta and the privacy narrative provided a boost.
As a high-beta privacy coin, it naturally tends to rise more than BTC when the market recovers;
combined with existing ETFs and the long-term privacy thesis, the sector is showing relative strength.
ZEC price analysis
Technical outlook: The price has broken above some short-term moving averages. Key support is around $1,200, with resistance near $1,292. A decisive breakout could open the way for further gains; otherwise, a pullback is likely.
Fundamentals: If NU7 is implemented on schedule, it should improve confirmation speed and the economic model, which is positive for the medium term. However, actual activation and network performance need to be monitored.
Risks: Event-driven rallies can be large and volatile, making short-term profit-taking likely. If the broader market weakens, its high-beta characteristics could amplify a correction.
Today’s strength is supported by fundamentals, but a trend reversal still needs confirmation through a sustained move above key levels.
Watch whether the price can decisively break above $1,292, as well as the actual data following the upgrade.
Up 11%—why is ZEC outperforming BTC and the broader market today?
Today, $ZEC rose approximately 10%–12%, climbing to around $1,250 and significantly outperforming BTC and the broader market.
The main drivers are:
1. The NU7 upgrade decision window is approaching, prompting investors to position early and concentrating buying pressure.
The Zcash development team has finalized the NU7 upgrade timeline and key improvements. The mainnet launch is targeted for November 5. Block times will be shortened from 75 seconds to 25 seconds, increasing confirmation speed by about 3x. The upgrade will also introduce the NSM mechanism and retire the old Sprout pool.
2. Short liquidations added fuel to the rally.
Leveraged short positions had built up after the earlier pullback. The rebound triggered forced liquidations, creating a short squeeze that further amplified the gains.
3. High beta and the privacy narrative provided a boost.
As a high-beta privacy coin, it naturally tends to rise more than BTC when the market recovers;
combined with existing ETFs and the long-term privacy thesis, the sector is showing relative strength.
ZEC price analysis
Technical outlook: The price has broken above some short-term moving averages. Key support is around $1,200, with resistance near $1,292. A decisive breakout could open the way for further gains; otherwise, a pullback is likely.
Fundamentals: If NU7 is implemented on schedule, it should improve confirmation speed and the economic model, which is positive for the medium term. However, actual activation and network performance need to be monitored.
Risks: Event-driven rallies can be large and volatile, making short-term profit-taking likely. If the broader market weakens, its high-beta characteristics could amplify a correction.
Today’s strength is supported by fundamentals, but a trend reversal still needs confirmation through a sustained move above key levels.
Watch whether the price can decisively break above $1,292, as well as the actual data following the upgrade.
206
·
--
Bullish
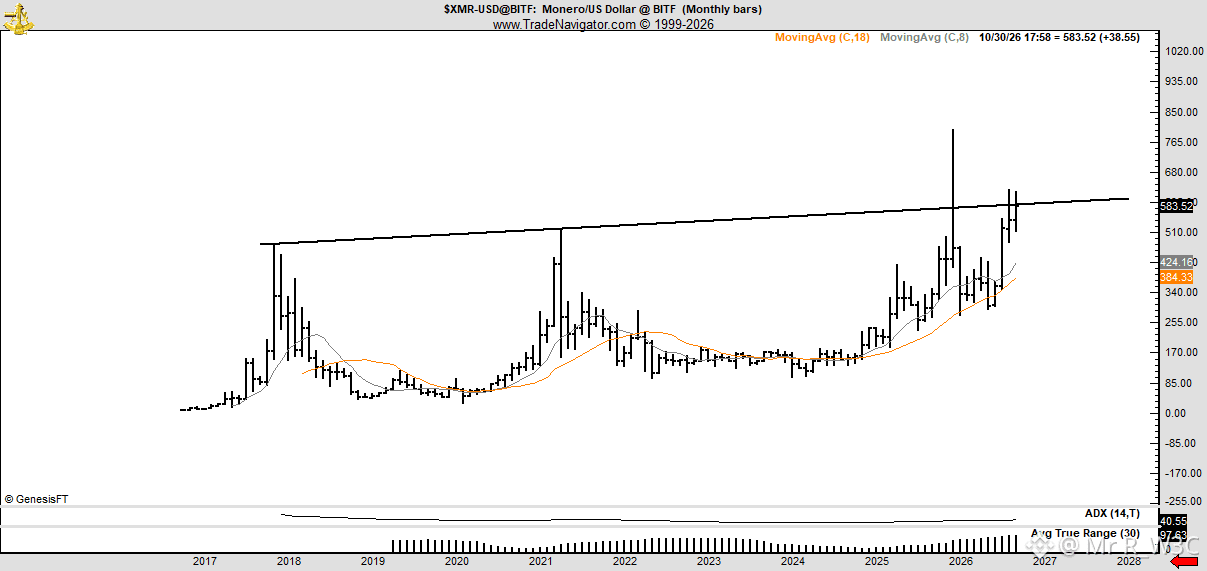
Don’t focus only on ZEC! Monero (XMR) may be gearing up for a major move
Renowned trader Peter Brandt shared a chart this morning, pointing out:
XMR’s monthly chart pattern looks highly similar to silver’s before its surge to $125—after a long consolidation, it repeatedly tested key resistance at 500–600, while the moving averages turned bullish, potentially setting the stage for a similar breakout.
I think the main reasons to be bullish on Monero are:
1. Strong technical structure:
Overhead supply has been largely absorbed. Brandt says it’s his favorite chart among altcoins, with a structure similar to silver’s before its major bull run.
2. Genuine demand for privacy:
It’s anonymous by default, and ransomware operators and hackers favor XMR. Recent on-chain money-laundering incidents have further highlighted its irreplaceable value.
3. Independent resilience:
It often strengthens against the trend within the privacy sector. In 2026, it set an ATH near $800, and after a pullback around $580, it remains in an uptrend.
4. Relative advantages:
Compared with ZEC and others, XMR offers more thorough privacy. Delisting pressure remains, but its real-world use cases are more compelling.
$XMR Price analysis:
In the short term, watch support at 570–580 and resistance at 600–630. A decisive breakout could open the way to the previous high and beyond.
The long-term structure is bullish, but be mindful of regulatory and volatility risks.
{future}(XMRUSDT)
Don’t focus only on ZEC! Monero (XMR) may be gearing up for a major move
Renowned trader Peter Brandt shared a chart this morning, pointing out:
XMR’s monthly chart pattern looks highly similar to silver’s before its surge to $125—after a long consolidation, it repeatedly tested key resistance at 500–600, while the moving averages turned bullish, potentially setting the stage for a similar breakout.
I think the main reasons to be bullish on Monero are:
1. Strong technical structure:
Overhead supply has been largely absorbed. Brandt says it’s his favorite chart among altcoins, with a structure similar to silver’s before its major bull run.
2. Genuine demand for privacy:
It’s anonymous by default, and ransomware operators and hackers favor XMR. Recent on-chain money-laundering incidents have further highlighted its irreplaceable value.
3. Independent resilience:
It often strengthens against the trend within the privacy sector. In 2026, it set an ATH near $800, and after a pullback around $580, it remains in an uptrend.
4. Relative advantages:
Compared with ZEC and others, XMR offers more thorough privacy. Delisting pressure remains, but its real-world use cases are more compelling.
$XMR Price analysis:
In the short term, watch support at 570–580 and resistance at 600–630. A decisive breakout could open the way to the previous high and beyond.
The long-term structure is bullish, but be mindful of regulatory and volatility risks.
Renowned trader Peter Brandt shared a chart this morning, pointing out:
XMR’s monthly chart pattern looks highly similar to silver’s before its surge to $125—after a long consolidation, it repeatedly tested key resistance at 500–600, while the moving averages turned bullish, potentially setting the stage for a similar breakout.
I think the main reasons to be bullish on Monero are:
1. Strong technical structure:
Overhead supply has been largely absorbed. Brandt says it’s his favorite chart among altcoins, with a structure similar to silver’s before its major bull run.
2. Genuine demand for privacy:
It’s anonymous by default, and ransomware operators and hackers favor XMR. Recent on-chain money-laundering incidents have further highlighted its irreplaceable value.
3. Independent resilience:
It often strengthens against the trend within the privacy sector. In 2026, it set an ATH near $800, and after a pullback around $580, it remains in an uptrend.
4. Relative advantages:
Compared with ZEC and others, XMR offers more thorough privacy. Delisting pressure remains, but its real-world use cases are more compelling.
$XMR Price analysis:
In the short term, watch support at 570–580 and resistance at 600–630. A decisive breakout could open the way to the previous high and beyond.
The long-term structure is bullish, but be mindful of regulatory and volatility risks.
156
·
--
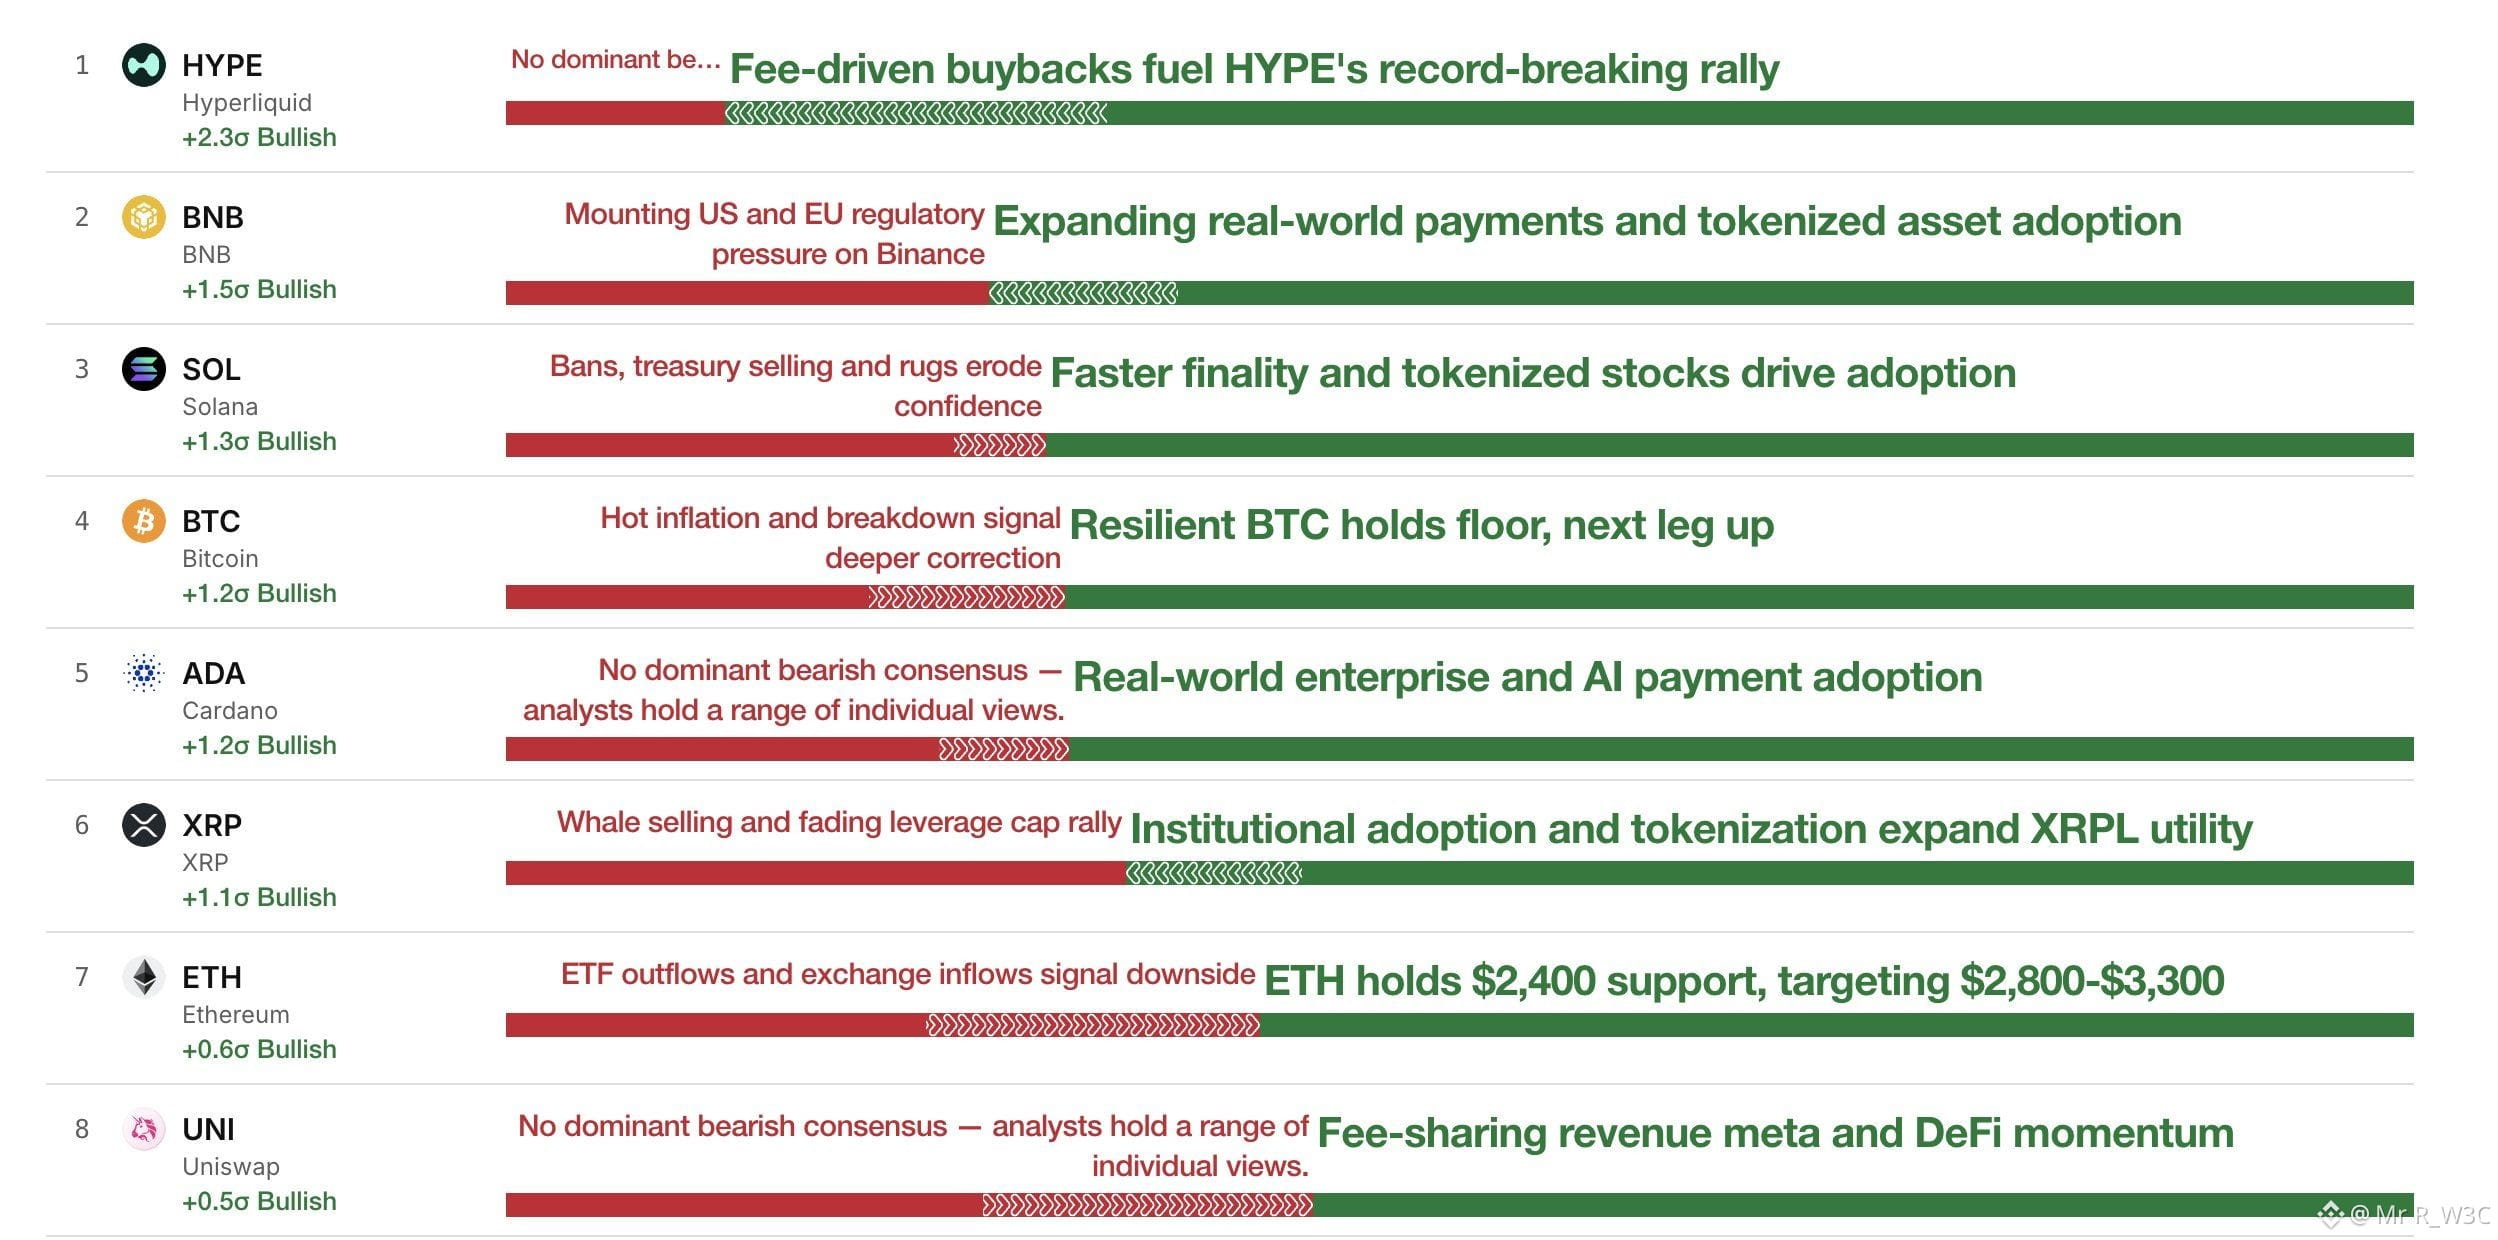
CryptoQuant data shows that the crypto asset currently attracting the most bullish sentiment is $HYPE , followed by BNB, SOL, BTC, ADA, XRP, ETH, and UNI.
As a leading Perp DEX, Hyperliquid directs 97–99% of its fees into the Assistance Fund to buy back HYPE, with cumulative buybacks exceeding $1.2 billion. Combined with USDC yield, this creates a virtuous cycle linking real business activity to token demand, so it’s no surprise that sentiment remains bullish.
$HYPE is under short-term pressure from macroeconomic factors and token unlocks. If trading volume continues to support buybacks, it could challenge $100–$120 over the medium to long term.
{future}(HYPEUSDT)
CryptoQuant data shows that the crypto asset currently attracting the most bullish sentiment is $HYPE , followed by BNB, SOL, BTC, ADA, XRP, ETH, and UNI.
As a leading Perp DEX, Hyperliquid directs 97–99% of its fees into the Assistance Fund to buy back HYPE, with cumulative buybacks exceeding $1.2 billion. Combined with USDC yield, this creates a virtuous cycle linking real business activity to token demand, so it’s no surprise that sentiment remains bullish.
$HYPE is under short-term pressure from macroeconomic factors and token unlocks. If trading volume continues to support buybacks, it could challenge $100–$120 over the medium to long term.
As a leading Perp DEX, Hyperliquid directs 97–99% of its fees into the Assistance Fund to buy back HYPE, with cumulative buybacks exceeding $1.2 billion. Combined with USDC yield, this creates a virtuous cycle linking real business activity to token demand, so it’s no surprise that sentiment remains bullish.
$HYPE is under short-term pressure from macroeconomic factors and token unlocks. If trading volume continues to support buybacks, it could challenge $100–$120 over the medium to long term.
263
·
--
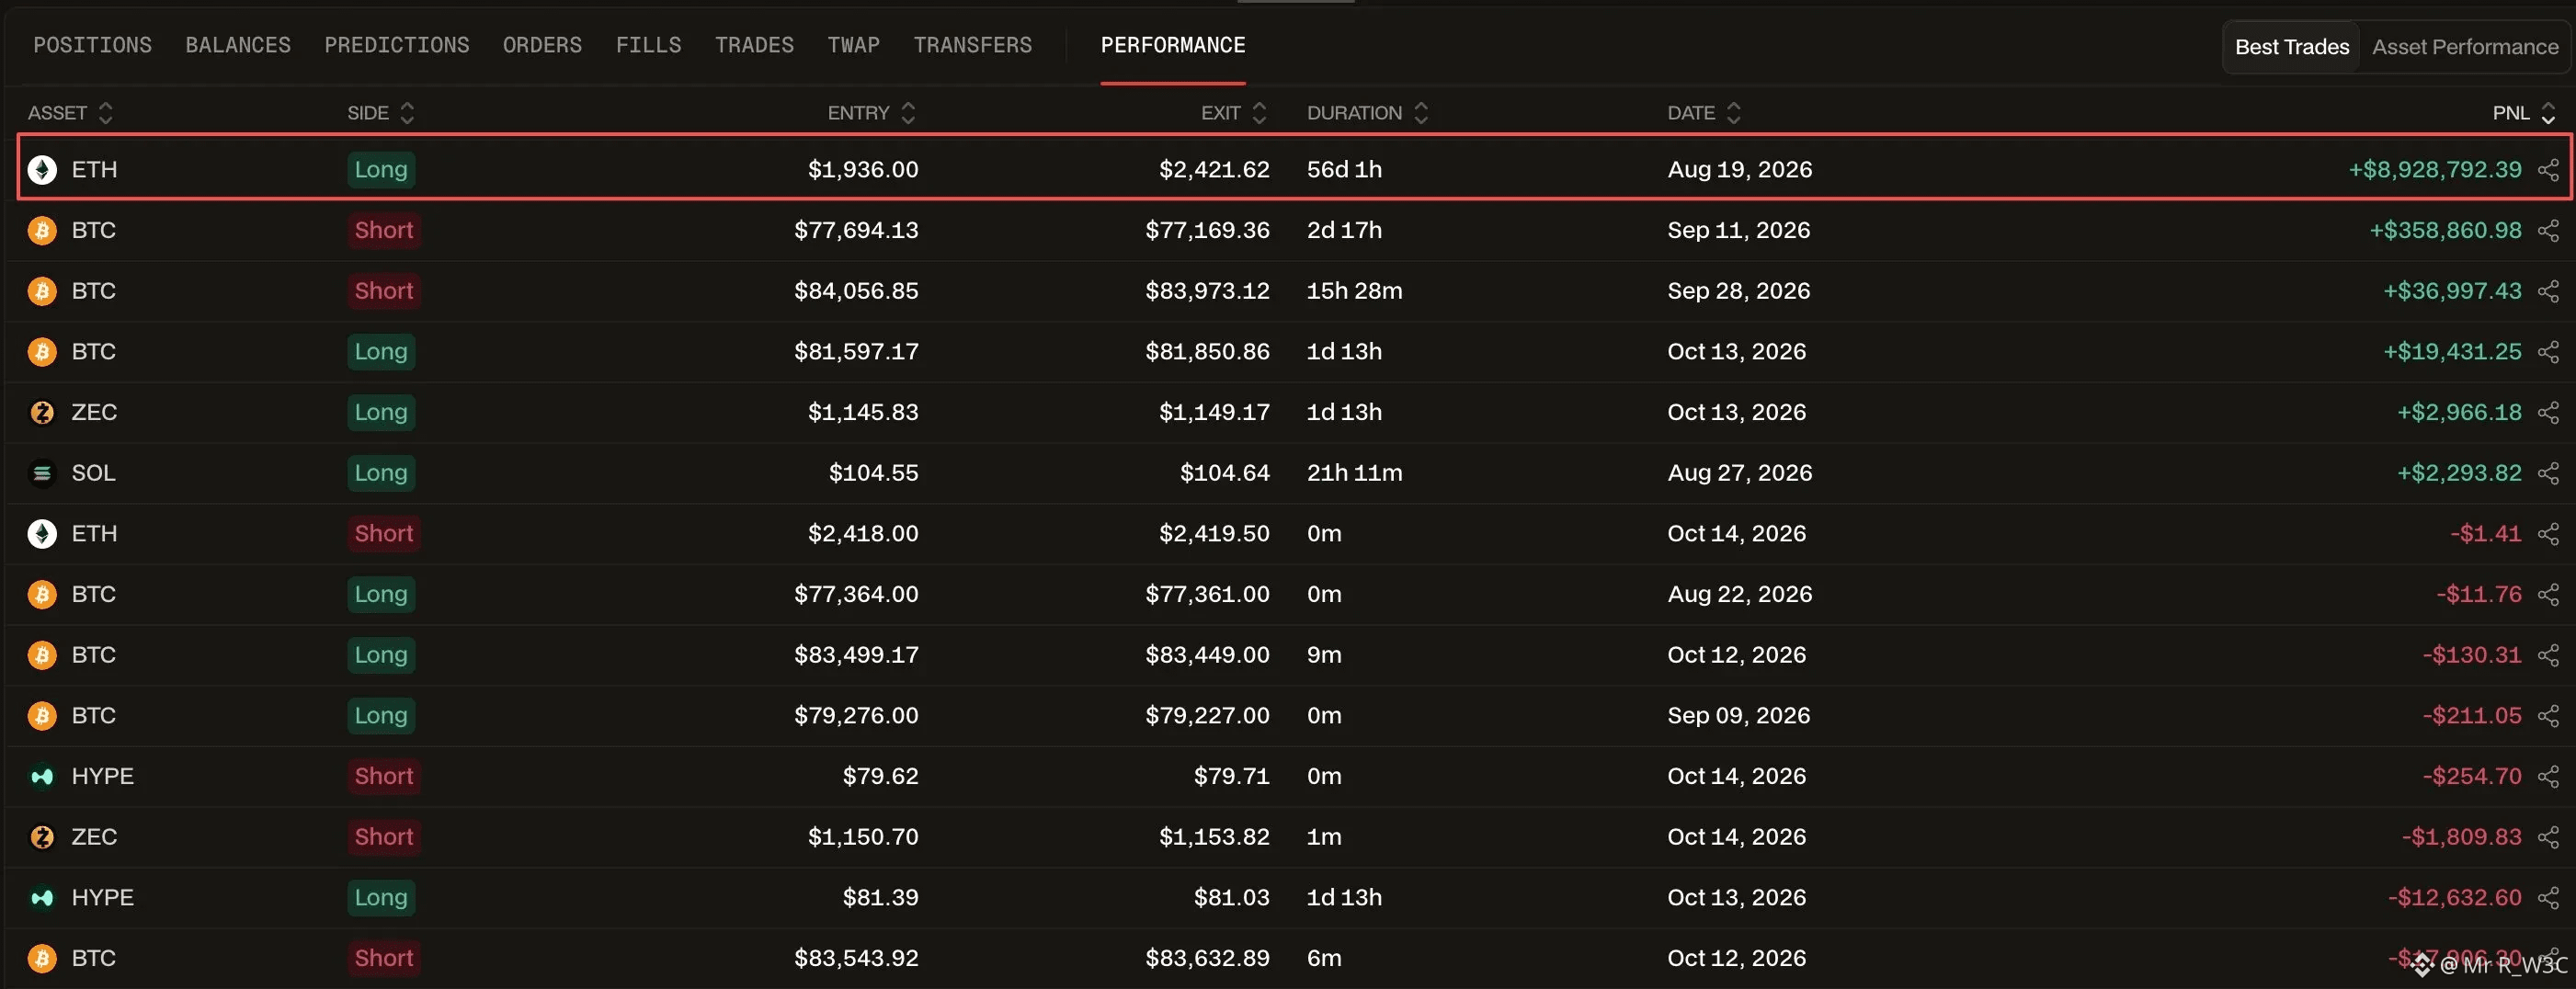
How did the whale trade? From a perfectly timed ETH long to closing the position after CPI
On August 19, a whale opened a 20,000 ETH long position at around $1,936. After holding it for more than 56 days and reaching an unrealized profit of about $17 million at its peak, the whale eventually closed the position after hotter-than-expected CPI triggered a pullback, locking in roughly $8.93 million in profit.
Behind this whale’s textbook trade lies a true trading playbook:
· Position early at low levels rather than chasing the market;
· Hold for the medium term and withstand substantial drawdowns in unrealized profit;
· Use a clear macro event (CPI) as an exit signal instead of stubbornly holding for a target price;
· Prioritize locking in realized profits rather than trying to nail the perfect exit.
Yesterday’s CPI reading really came as a bit of a surprise.
Year-over-year inflation of 3.7%, above expectations, pushed up Treasury yields and rate-hike expectations.
BTC pulled back from nearly 84,000 to around 81,500, while ETH fell to the 2,410–2,430 range, with more long liquidations.
My assessment:
$BTC Support below: 81,000–80,500; a break below could bring 80,000 into view.
Resistance above: 82,500–83,000, with strong resistance at 84,000.
{future}(BTCUSDT)
$ETH Support at 2,380–2,400; a break below could lead to a test of 2,350.
Resistance above: 2,480–2,500, with strong resistance at 2,550.
{future}(ETHUSDT)
Macro factors remain in the driver’s seat in the short term. The whale chose to take profits rather than keep betting on a rebound, putting risk management first.
Watch upcoming inflation data and Fed commentary. If BTC holds above 81,000 and the macro outlook does not deteriorate further, the market may start looking for direction again.
How did the whale trade? From a perfectly timed ETH long to closing the position after CPI
On August 19, a whale opened a 20,000 ETH long position at around $1,936. After holding it for more than 56 days and reaching an unrealized profit of about $17 million at its peak, the whale eventually closed the position after hotter-than-expected CPI triggered a pullback, locking in roughly $8.93 million in profit.
Behind this whale’s textbook trade lies a true trading playbook:
· Position early at low levels rather than chasing the market;
· Hold for the medium term and withstand substantial drawdowns in unrealized profit;
· Use a clear macro event (CPI) as an exit signal instead of stubbornly holding for a target price;
· Prioritize locking in realized profits rather than trying to nail the perfect exit.
Yesterday’s CPI reading really came as a bit of a surprise.
Year-over-year inflation of 3.7%, above expectations, pushed up Treasury yields and rate-hike expectations.
BTC pulled back from nearly 84,000 to around 81,500, while ETH fell to the 2,410–2,430 range, with more long liquidations.
My assessment:
$BTC Support below: 81,000–80,500; a break below could bring 80,000 into view.
Resistance above: 82,500–83,000, with strong resistance at 84,000.
$ETH Support at 2,380–2,400; a break below could lead to a test of 2,350.
Resistance above: 2,480–2,500, with strong resistance at 2,550.
Macro factors remain in the driver’s seat in the short term. The whale chose to take profits rather than keep betting on a rebound, putting risk management first.
Watch upcoming inflation data and Fed commentary. If BTC holds above 81,000 and the macro outlook does not deteriorate further, the market may start looking for direction again.
On August 19, a whale opened a 20,000 ETH long position at around $1,936. After holding it for more than 56 days and reaching an unrealized profit of about $17 million at its peak, the whale eventually closed the position after hotter-than-expected CPI triggered a pullback, locking in roughly $8.93 million in profit.
Behind this whale’s textbook trade lies a true trading playbook:
· Position early at low levels rather than chasing the market;
· Hold for the medium term and withstand substantial drawdowns in unrealized profit;
· Use a clear macro event (CPI) as an exit signal instead of stubbornly holding for a target price;
· Prioritize locking in realized profits rather than trying to nail the perfect exit.
Yesterday’s CPI reading really came as a bit of a surprise.
Year-over-year inflation of 3.7%, above expectations, pushed up Treasury yields and rate-hike expectations.
BTC pulled back from nearly 84,000 to around 81,500, while ETH fell to the 2,410–2,430 range, with more long liquidations.
My assessment:
$BTC Support below: 81,000–80,500; a break below could bring 80,000 into view.
Resistance above: 82,500–83,000, with strong resistance at 84,000.
$ETH Support at 2,380–2,400; a break below could lead to a test of 2,350.
Resistance above: 2,480–2,500, with strong resistance at 2,550.
Macro factors remain in the driver’s seat in the short term. The whale chose to take profits rather than keep betting on a rebound, putting risk management first.
Watch upcoming inflation data and Fed commentary. If BTC holds above 81,000 and the macro outlook does not deteriorate further, the market may start looking for direction again.
87
·
--
Verified
It’s over! After nearly six years of underweighting U.S. Treasuries, BlackRock has officially shifted to buying bonds.
Money is starting to flow back into Treasuries—crypto is in danger!
BlackRock has raised its allocation to short-term Treasuries directly to overweight, while moving long-term Treasuries from underweight back to neutral.
At the same time, it has downgraded U.S. equities from overweight to neutral.
This is a very dangerous signal: one of the world’s largest asset managers is starting to move money back into U.S. Treasuries.
The 10-year yield has already approached 5.25%, and these high yields are drawing money in aggressively.
BlackRock itself acknowledges that this is about locking in yields and managing short-term risk.
When the biggest asset managers start shifting, it can easily trigger a chain reaction.
Institutions follow suit, portfolios rebalance, and liquidity for risk assets tightens.
High-yield Treasuries are attracting money, and funds are flowing back into the Treasury market. The opportunity cost of holding risk assets is rising. Non-yielding assets like U.S. stocks, gold, and crypto are likely to come under pressure next.
My view:
Market sentiment is starting to shift. Don’t focus only on the rebound—you can short at elevated levels!
For crypto assets:
$BTC : Key support is in the 81k–82k range.
If 81k gives way, prices could fall to 80k or even lower in the short term. Tighter liquidity would amplify volatility.
Resistance is at 84k–85k; a breakout will require macro conditions to cooperate.
$ETH : Relatively weaker, currently around 2520.
If BTC comes under pressure, ETH could be the first to break below 2500, with 2450–2400 as the next levels to watch.
With ETF outflows continuing, it has less upside potential.
SOL/XRP and other major altcoins: The weekly chart is already looking weak, and their high-beta nature makes them more vulnerable to sell-offs when risk appetite declines.
$SOL : Watch support at 105–107; XRP is around 1.35.
Altcoins overall will be more sensitive than BTC.
CPI comes out tomorrow and is the biggest short-term variable.
If high-yield Treasuries continue attracting money, crypto is likely to remain defensive in the short term.#贝莱德基金
{future}(BTCUSDT)
It’s over! After nearly six years of underweighting U.S. Treasuries, BlackRock has officially shifted to buying bonds.
Money is starting to flow back into Treasuries—crypto is in danger!
BlackRock has raised its allocation to short-term Treasuries directly to overweight, while moving long-term Treasuries from underweight back to neutral.
At the same time, it has downgraded U.S. equities from overweight to neutral.
This is a very dangerous signal: one of the world’s largest asset managers is starting to move money back into U.S. Treasuries.
The 10-year yield has already approached 5.25%, and these high yields are drawing money in aggressively.
BlackRock itself acknowledges that this is about locking in yields and managing short-term risk.
When the biggest asset managers start shifting, it can easily trigger a chain reaction.
Institutions follow suit, portfolios rebalance, and liquidity for risk assets tightens.
High-yield Treasuries are attracting money, and funds are flowing back into the Treasury market. The opportunity cost of holding risk assets is rising. Non-yielding assets like U.S. stocks, gold, and crypto are likely to come under pressure next.
My view:
Market sentiment is starting to shift. Don’t focus only on the rebound—you can short at elevated levels!
For crypto assets:
$BTC : Key support is in the 81k–82k range.
If 81k gives way, prices could fall to 80k or even lower in the short term. Tighter liquidity would amplify volatility.
Resistance is at 84k–85k; a breakout will require macro conditions to cooperate.
$ETH : Relatively weaker, currently around 2520.
If BTC comes under pressure, ETH could be the first to break below 2500, with 2450–2400 as the next levels to watch.
With ETF outflows continuing, it has less upside potential.
SOL/XRP and other major altcoins: The weekly chart is already looking weak, and their high-beta nature makes them more vulnerable to sell-offs when risk appetite declines.
$SOL : Watch support at 105–107; XRP is around 1.35.
Altcoins overall will be more sensitive than BTC.
CPI comes out tomorrow and is the biggest short-term variable.
If high-yield Treasuries continue attracting money, crypto is likely to remain defensive in the short term.#贝莱德基金
Money is starting to flow back into Treasuries—crypto is in danger!
BlackRock has raised its allocation to short-term Treasuries directly to overweight, while moving long-term Treasuries from underweight back to neutral.
At the same time, it has downgraded U.S. equities from overweight to neutral.
This is a very dangerous signal: one of the world’s largest asset managers is starting to move money back into U.S. Treasuries.
The 10-year yield has already approached 5.25%, and these high yields are drawing money in aggressively.
BlackRock itself acknowledges that this is about locking in yields and managing short-term risk.
When the biggest asset managers start shifting, it can easily trigger a chain reaction.
Institutions follow suit, portfolios rebalance, and liquidity for risk assets tightens.
High-yield Treasuries are attracting money, and funds are flowing back into the Treasury market. The opportunity cost of holding risk assets is rising. Non-yielding assets like U.S. stocks, gold, and crypto are likely to come under pressure next.
My view:
Market sentiment is starting to shift. Don’t focus only on the rebound—you can short at elevated levels!
For crypto assets:
$BTC : Key support is in the 81k–82k range.
If 81k gives way, prices could fall to 80k or even lower in the short term. Tighter liquidity would amplify volatility.
Resistance is at 84k–85k; a breakout will require macro conditions to cooperate.
$ETH : Relatively weaker, currently around 2520.
If BTC comes under pressure, ETH could be the first to break below 2500, with 2450–2400 as the next levels to watch.
With ETF outflows continuing, it has less upside potential.
SOL/XRP and other major altcoins: The weekly chart is already looking weak, and their high-beta nature makes them more vulnerable to sell-offs when risk appetite declines.
$SOL : Watch support at 105–107; XRP is around 1.35.
Altcoins overall will be more sensitive than BTC.
CPI comes out tomorrow and is the biggest short-term variable.
If high-yield Treasuries continue attracting money, crypto is likely to remain defensive in the short term.#贝莱德基金
320
·
--
A friend told me today that he was tired of staying up late every day watching the markets and wanted to start dollar-cost averaging. He asked me for some good recommendations.
That really put me on the spot. It’s not that there aren’t any good coins, but this is the kind of decision you’re better off making for yourself.
Of course, I still offered some advice:
First, dollar-cost averaging has always seemed to me like the most reliable way to make money in crypto, but very few people are willing to do it.
You can see why it’s a reliable way to make money by looking at how much major coins have risen over the years. Simply holding them long term can make you money.
So why aren’t more people willing to do it?
Because people who enter crypto generally fall into two groups: those who have their own trading systems and look down on dollar-cost averaging as a strategy with “no technical skill,” and those who want to make quick money. Dollar-cost averaging is too slow and requires persistence, so they can’t stick with it. The latter group makes up the vast majority.
At its core, dollar-cost averaging is actually well suited to beginners, or people with average risk tolerance—you don’t need to watch the markets or time your trades; you just need to stick to your plan.
The part that really takes skill is choosing what to invest in.
Even with the same dollar-cost averaging strategy, some people earn more than others. That’s where the difference lies.
You don’t necessarily have to choose $BTC or $ETH . Just make sure it can weather both bull and bear markets and has no risk of going to zero; that it has good liquidity and trades on major platforms, with a relatively high market cap; and that it has solid fundamentals. If you hold on until the next bull market, you’ll probably make money.
Dollar-cost averaging isn’t a get-rich-quick strategy. It’s a strategy for trading time for certainty.
It’s suited to people who don’t want to be tormented by the markets every day but still want to benefit from the long-term appreciation of crypto assets.
Choose the right asset and stick with it—that’s enough.#新手必学
{future}(BTCUSDT)
A friend told me today that he was tired of staying up late every day watching the markets and wanted to start dollar-cost averaging. He asked me for some good recommendations.
That really put me on the spot. It’s not that there aren’t any good coins, but this is the kind of decision you’re better off making for yourself.
Of course, I still offered some advice:
First, dollar-cost averaging has always seemed to me like the most reliable way to make money in crypto, but very few people are willing to do it.
You can see why it’s a reliable way to make money by looking at how much major coins have risen over the years. Simply holding them long term can make you money.
So why aren’t more people willing to do it?
Because people who enter crypto generally fall into two groups: those who have their own trading systems and look down on dollar-cost averaging as a strategy with “no technical skill,” and those who want to make quick money. Dollar-cost averaging is too slow and requires persistence, so they can’t stick with it. The latter group makes up the vast majority.
At its core, dollar-cost averaging is actually well suited to beginners, or people with average risk tolerance—you don’t need to watch the markets or time your trades; you just need to stick to your plan.
The part that really takes skill is choosing what to invest in.
Even with the same dollar-cost averaging strategy, some people earn more than others. That’s where the difference lies.
You don’t necessarily have to choose $BTC or $ETH . Just make sure it can weather both bull and bear markets and has no risk of going to zero; that it has good liquidity and trades on major platforms, with a relatively high market cap; and that it has solid fundamentals. If you hold on until the next bull market, you’ll probably make money.
Dollar-cost averaging isn’t a get-rich-quick strategy. It’s a strategy for trading time for certainty.
It’s suited to people who don’t want to be tormented by the markets every day but still want to benefit from the long-term appreciation of crypto assets.
Choose the right asset and stick with it—that’s enough.#新手必学
That really put me on the spot. It’s not that there aren’t any good coins, but this is the kind of decision you’re better off making for yourself.
Of course, I still offered some advice:
First, dollar-cost averaging has always seemed to me like the most reliable way to make money in crypto, but very few people are willing to do it.
You can see why it’s a reliable way to make money by looking at how much major coins have risen over the years. Simply holding them long term can make you money.
So why aren’t more people willing to do it?
Because people who enter crypto generally fall into two groups: those who have their own trading systems and look down on dollar-cost averaging as a strategy with “no technical skill,” and those who want to make quick money. Dollar-cost averaging is too slow and requires persistence, so they can’t stick with it. The latter group makes up the vast majority.
At its core, dollar-cost averaging is actually well suited to beginners, or people with average risk tolerance—you don’t need to watch the markets or time your trades; you just need to stick to your plan.
The part that really takes skill is choosing what to invest in.
Even with the same dollar-cost averaging strategy, some people earn more than others. That’s where the difference lies.
You don’t necessarily have to choose $BTC or $ETH . Just make sure it can weather both bull and bear markets and has no risk of going to zero; that it has good liquidity and trades on major platforms, with a relatively high market cap; and that it has solid fundamentals. If you hold on until the next bull market, you’ll probably make money.
Dollar-cost averaging isn’t a get-rich-quick strategy. It’s a strategy for trading time for certainty.
It’s suited to people who don’t want to be tormented by the markets every day but still want to benefit from the long-term appreciation of crypto assets.
Choose the right asset and stick with it—that’s enough.#新手必学
254
·
--
BTC falls below 83,000? Where did the rebound money go? Altcoins are the first to buckle!
Latest market prices for October 13:
BTC at 82,718 (-1.16%), ETH at 2,488.60 (-1.81%), $SOL at 108.67 (-2.26%), and $XRP at 1.36 (-3.38%).
Major coins are broadly down, while altcoins are under even greater pressure.
Key levels:
$BTC support at 82,096, resistance at 84,284;
$ETH : for now, watch whether it can hold around 2,480.
Fund flows:
For the week ending October 9, BTC spot ETFs saw net outflows of about $681 million, ETH saw net outflows of about $542 million, and SOL ETFs ended their 14-week streak of consecutive net inflows.
More concerning, total market open interest rose 15%, while BTC open interest fell 6%, suggesting leveraged funds are shifting to altcoins.
Short-term outlook: I’m cautious.
$BTC needs to hold 82,096 to establish a basis for a rebound; if it breaks below that level, watch 80,847.
Don’t blindly chase a brief altcoin rally. The more concentrated the leverage, the greater the risk of a liquidation cascade.
Which do you think will rebound first in the next wave: BTC or altcoins? #以太坊现货ETF上周净流出5.42亿美元
{future}(BTCUSDT)
BTC falls below 83,000? Where did the rebound money go? Altcoins are the first to buckle!
Latest market prices for October 13:
BTC at 82,718 (-1.16%), ETH at 2,488.60 (-1.81%), $SOL at 108.67 (-2.26%), and $XRP at 1.36 (-3.38%).
Major coins are broadly down, while altcoins are under even greater pressure.
Key levels:
$BTC support at 82,096, resistance at 84,284;
$ETH : for now, watch whether it can hold around 2,480.
Fund flows:
For the week ending October 9, BTC spot ETFs saw net outflows of about $681 million, ETH saw net outflows of about $542 million, and SOL ETFs ended their 14-week streak of consecutive net inflows.
More concerning, total market open interest rose 15%, while BTC open interest fell 6%, suggesting leveraged funds are shifting to altcoins.
Short-term outlook: I’m cautious.
$BTC needs to hold 82,096 to establish a basis for a rebound; if it breaks below that level, watch 80,847.
Don’t blindly chase a brief altcoin rally. The more concentrated the leverage, the greater the risk of a liquidation cascade.
Which do you think will rebound first in the next wave: BTC or altcoins? #以太坊现货ETF上周净流出5.42亿美元
Latest market prices for October 13:
BTC at 82,718 (-1.16%), ETH at 2,488.60 (-1.81%), $SOL at 108.67 (-2.26%), and $XRP at 1.36 (-3.38%).
Major coins are broadly down, while altcoins are under even greater pressure.
Key levels:
$BTC support at 82,096, resistance at 84,284;
$ETH : for now, watch whether it can hold around 2,480.
Fund flows:
For the week ending October 9, BTC spot ETFs saw net outflows of about $681 million, ETH saw net outflows of about $542 million, and SOL ETFs ended their 14-week streak of consecutive net inflows.
More concerning, total market open interest rose 15%, while BTC open interest fell 6%, suggesting leveraged funds are shifting to altcoins.
Short-term outlook: I’m cautious.
$BTC needs to hold 82,096 to establish a basis for a rebound; if it breaks below that level, watch 80,847.
Don’t blindly chase a brief altcoin rally. The more concentrated the leverage, the greater the risk of a liquidation cascade.
Which do you think will rebound first in the next wave: BTC or altcoins? #以太坊现货ETF上周净流出5.42亿美元
280
·
--
Bullish
Trump is once again using word games to steer the narrative, hyping negotiations that haven’t materialized as an “immediate ceasefire.”
The market is trading ahead of events—watch for short-term swings.
On the 11th, Trump posted that an energy ceasefire between Russia and Ukraine had taken effect immediately and that both sides had agreed.
But Zelenskyy said this was news to him; Ukraine had only said, “If Russia stops too, we’ll stop.” Russia has yet to confirm anything.
And even after Trump’s announcement, Russian forces continued attacking Ukrainian power plants, making him look foolish.
Clearly, Trump wants to use this round of talks with Russia to increase diesel supply and temporarily ease sanctions, while pressuring Ukraine to stop striking refineries—turning oil prices into a tool of domestic politics.
Brent $BZ fell back to around 103 after his statement.
This is a short-term, sentiment-driven pullback, not a reversal in fundamentals.
Diesel futures fell even harder, suggesting the market has priced in a potential increase in supply ahead of time.
But we need to understand that what can sustainably bring prices down is a substantive ceasefire and a recovery in supply—not a social media post.
Trust between Russia and Ukraine is low, and history keeps repeating itself; Middle East risks remain unresolved—the Houthis continue attacking Saudi airports and facilities, oil tankers in the Strait of Hormuz were attacked again over the weekend, and Iran is tightening controls.
If the ceasefire falls through and the Middle East escalates again, prices will rebound quickly.
The outlook for oil remains bullish; any dip is an opportunity.
Go long immediately if Brent falls below 100, with an upside target of 105–110.
$BTC $ETH : You can open a short at the resistance above to capture a short-term pullback.
{future}(BZUSDT)
Trump is once again using word games to steer the narrative, hyping negotiations that haven’t materialized as an “immediate ceasefire.”
The market is trading ahead of events—watch for short-term swings.
On the 11th, Trump posted that an energy ceasefire between Russia and Ukraine had taken effect immediately and that both sides had agreed.
But Zelenskyy said this was news to him; Ukraine had only said, “If Russia stops too, we’ll stop.” Russia has yet to confirm anything.
And even after Trump’s announcement, Russian forces continued attacking Ukrainian power plants, making him look foolish.
Clearly, Trump wants to use this round of talks with Russia to increase diesel supply and temporarily ease sanctions, while pressuring Ukraine to stop striking refineries—turning oil prices into a tool of domestic politics.
Brent $BZ fell back to around 103 after his statement.
This is a short-term, sentiment-driven pullback, not a reversal in fundamentals.
Diesel futures fell even harder, suggesting the market has priced in a potential increase in supply ahead of time.
But we need to understand that what can sustainably bring prices down is a substantive ceasefire and a recovery in supply—not a social media post.
Trust between Russia and Ukraine is low, and history keeps repeating itself; Middle East risks remain unresolved—the Houthis continue attacking Saudi airports and facilities, oil tankers in the Strait of Hormuz were attacked again over the weekend, and Iran is tightening controls.
If the ceasefire falls through and the Middle East escalates again, prices will rebound quickly.
The outlook for oil remains bullish; any dip is an opportunity.
Go long immediately if Brent falls below 100, with an upside target of 105–110.
$BTC $ETH : You can open a short at the resistance above to capture a short-term pullback.
The market is trading ahead of events—watch for short-term swings.
On the 11th, Trump posted that an energy ceasefire between Russia and Ukraine had taken effect immediately and that both sides had agreed.
But Zelenskyy said this was news to him; Ukraine had only said, “If Russia stops too, we’ll stop.” Russia has yet to confirm anything.
And even after Trump’s announcement, Russian forces continued attacking Ukrainian power plants, making him look foolish.
Clearly, Trump wants to use this round of talks with Russia to increase diesel supply and temporarily ease sanctions, while pressuring Ukraine to stop striking refineries—turning oil prices into a tool of domestic politics.
Brent $BZ fell back to around 103 after his statement.
This is a short-term, sentiment-driven pullback, not a reversal in fundamentals.
Diesel futures fell even harder, suggesting the market has priced in a potential increase in supply ahead of time.
But we need to understand that what can sustainably bring prices down is a substantive ceasefire and a recovery in supply—not a social media post.
Trust between Russia and Ukraine is low, and history keeps repeating itself; Middle East risks remain unresolved—the Houthis continue attacking Saudi airports and facilities, oil tankers in the Strait of Hormuz were attacked again over the weekend, and Iran is tightening controls.
If the ceasefire falls through and the Middle East escalates again, prices will rebound quickly.
The outlook for oil remains bullish; any dip is an opportunity.
Go long immediately if Brent falls below 100, with an upside target of 105–110.
$BTC $ETH : You can open a short at the resistance above to capture a short-term pullback.
43
·
--
Bearish
Doubled in 7 days, but don’t rush to chase it: 127 million tokens are on their way to being unlocked!$STRK
This STRK rally is a bet on future technological leadership, but the market has already turned “under consideration” into “about to happen.”
Starknet plans to transition from an Ethereum L2 to an independent L1, with a goal of achieving a quantum-resistant network by 2027.
This narrative is certainly compelling. If the threat from quantum computing draws closer faster than expected, having control over the pace of your own security upgrades will matter even more.
But keep in mind:
Considering a transition is not the same as making a formal decision, and a quantum-resistance target does not mean the technical overhaul is complete.
Becoming an L1 also means taking responsibility for consensus, security, and ecosystem development. Execution is the real test.
In the short term, the more immediate risk is token supply.
Around 127 million STRK tokens are set to unlock around October 15. With the narrative heating up alongside new supply, volatility could increase further.
My advice:
Don’t chase a series of sharp gains. First, see whether the market can absorb selling pressure around the unlock.
If trading volume surges during a rally but the price stalls near the highs, beware of investors taking profits on the positive news.
If the price pulls back on lower volume and holds key support, then consider building a position in stages.
Keep an eye on three things next:
Whether a formal proposal for the L1 transition is submitted, whether the quantum-resistance roadmap makes tangible progress, and whether the price can hold steady after the unlock.
A compelling narrative can fuel a sharp rally, but ultimately, how far it goes depends on execution and genuine buying demand.#strk
{future}(STRKUSDT)
Doubled in 7 days, but don’t rush to chase it: 127 million tokens are on their way to being unlocked!$STRK
This STRK rally is a bet on future technological leadership, but the market has already turned “under consideration” into “about to happen.”
Starknet plans to transition from an Ethereum L2 to an independent L1, with a goal of achieving a quantum-resistant network by 2027.
This narrative is certainly compelling. If the threat from quantum computing draws closer faster than expected, having control over the pace of your own security upgrades will matter even more.
But keep in mind:
Considering a transition is not the same as making a formal decision, and a quantum-resistance target does not mean the technical overhaul is complete.
Becoming an L1 also means taking responsibility for consensus, security, and ecosystem development. Execution is the real test.
In the short term, the more immediate risk is token supply.
Around 127 million STRK tokens are set to unlock around October 15. With the narrative heating up alongside new supply, volatility could increase further.
My advice:
Don’t chase a series of sharp gains. First, see whether the market can absorb selling pressure around the unlock.
If trading volume surges during a rally but the price stalls near the highs, beware of investors taking profits on the positive news.
If the price pulls back on lower volume and holds key support, then consider building a position in stages.
Keep an eye on three things next:
Whether a formal proposal for the L1 transition is submitted, whether the quantum-resistance roadmap makes tangible progress, and whether the price can hold steady after the unlock.
A compelling narrative can fuel a sharp rally, but ultimately, how far it goes depends on execution and genuine buying demand.#strk
This STRK rally is a bet on future technological leadership, but the market has already turned “under consideration” into “about to happen.”
Starknet plans to transition from an Ethereum L2 to an independent L1, with a goal of achieving a quantum-resistant network by 2027.
This narrative is certainly compelling. If the threat from quantum computing draws closer faster than expected, having control over the pace of your own security upgrades will matter even more.
But keep in mind:
Considering a transition is not the same as making a formal decision, and a quantum-resistance target does not mean the technical overhaul is complete.
Becoming an L1 also means taking responsibility for consensus, security, and ecosystem development. Execution is the real test.
In the short term, the more immediate risk is token supply.
Around 127 million STRK tokens are set to unlock around October 15. With the narrative heating up alongside new supply, volatility could increase further.
My advice:
Don’t chase a series of sharp gains. First, see whether the market can absorb selling pressure around the unlock.
If trading volume surges during a rally but the price stalls near the highs, beware of investors taking profits on the positive news.
If the price pulls back on lower volume and holds key support, then consider building a position in stages.
Keep an eye on three things next:
Whether a formal proposal for the L1 transition is submitted, whether the quantum-resistance roadmap makes tangible progress, and whether the price can hold steady after the unlock.
A compelling narrative can fuel a sharp rally, but ultimately, how far it goes depends on execution and genuine buying demand.#strk
51
·
--
October 12 Crypto Brief | Does a rebound mean a bullish reversal? Both sides are waiting to cash in
Market snapshot
As of 09:00 on October 12, BTC was at $83,657, up 0.86%; ETH was at $2,533, up 1.12%; XRP gained 0.47%, and SOL gained 1.06%. BAT rose 13.34% in a day, as speculation in smaller coins picked up.
Liquidation magnets:
Around $58 million in short positions could be liquidated near $84,705 above $BTC , while around $73.6 million in long positions could be liquidated near $82,188 below.
$ETH also has liquidation clusters at $2,562 above and $2,515 below.
Flows and debate:
On October 9, U.S. spot BTC ETFs saw net inflows of $21.1 million, while ETH ETFs recorded net outflows of $56.1 million. ETFs across all categories saw combined net outflows of $22.7 million, marking five consecutive days of outflows. Meanwhile, debate flared over whether AI could threaten the security of wallet keys. Vitalik Buterin urged caution and warned against panic-driven asset transfers.
Short-term outlook: A rebound does not equal a reversal.
BTC needs to hold above $84,705 to have a chance of moving higher;
if it falls toward $82,188, watch out for cascading long liquidations.
Don't rush to chase the rally—leverage is the biggest risk. Do you think this is a bottoming rebound, or are the big players using the bounce to keep selling? #比特币重回8.4万美元
{future}(BTCUSDT)
October 12 Crypto Brief | Does a rebound mean a bullish reversal? Both sides are waiting to cash in
Market snapshot
As of 09:00 on October 12, BTC was at $83,657, up 0.86%; ETH was at $2,533, up 1.12%; XRP gained 0.47%, and SOL gained 1.06%. BAT rose 13.34% in a day, as speculation in smaller coins picked up.
Liquidation magnets:
Around $58 million in short positions could be liquidated near $84,705 above $BTC , while around $73.6 million in long positions could be liquidated near $82,188 below.
$ETH also has liquidation clusters at $2,562 above and $2,515 below.
Flows and debate:
On October 9, U.S. spot BTC ETFs saw net inflows of $21.1 million, while ETH ETFs recorded net outflows of $56.1 million. ETFs across all categories saw combined net outflows of $22.7 million, marking five consecutive days of outflows. Meanwhile, debate flared over whether AI could threaten the security of wallet keys. Vitalik Buterin urged caution and warned against panic-driven asset transfers.
Short-term outlook: A rebound does not equal a reversal.
BTC needs to hold above $84,705 to have a chance of moving higher;
if it falls toward $82,188, watch out for cascading long liquidations.
Don't rush to chase the rally—leverage is the biggest risk. Do you think this is a bottoming rebound, or are the big players using the bounce to keep selling? #比特币重回8.4万美元
Market snapshot
As of 09:00 on October 12, BTC was at $83,657, up 0.86%; ETH was at $2,533, up 1.12%; XRP gained 0.47%, and SOL gained 1.06%. BAT rose 13.34% in a day, as speculation in smaller coins picked up.
Liquidation magnets:
Around $58 million in short positions could be liquidated near $84,705 above $BTC , while around $73.6 million in long positions could be liquidated near $82,188 below.
$ETH also has liquidation clusters at $2,562 above and $2,515 below.
Flows and debate:
On October 9, U.S. spot BTC ETFs saw net inflows of $21.1 million, while ETH ETFs recorded net outflows of $56.1 million. ETFs across all categories saw combined net outflows of $22.7 million, marking five consecutive days of outflows. Meanwhile, debate flared over whether AI could threaten the security of wallet keys. Vitalik Buterin urged caution and warned against panic-driven asset transfers.
Short-term outlook: A rebound does not equal a reversal.
BTC needs to hold above $84,705 to have a chance of moving higher;
if it falls toward $82,188, watch out for cascading long liquidations.
Don't rush to chase the rally—leverage is the biggest risk. Do you think this is a bottoming rebound, or are the big players using the bounce to keep selling? #比特币重回8.4万美元
215
·
--
Was a Ledger hardware wallet tampered with? The $86 million mystery—and the real danger is the trust chain!
#Ledger确认用户设备遭植入未授权硬件
My take:
The most concerning thing about this incident isn’t that hardware wallets are unsafe. It’s that you may think you bought a device through an official channel, but still can’t be sure it wasn’t tampered with between leaving the factory and reaching you.
Ledger has confirmed that one device involved in the incident contained an unauthorized hardware implant. However, it has not yet been confirmed whether the suspected $86 million in losses is all connected to it.
This is also a reminder that the security of a hardware wallet depends on more than its chip and code: the supply chain can also be an entry point for attacks. No matter how secure the device itself is, your assets could still be stolen if the initialization process is compromised or your recovery phrase has been exposed.
If you bought a device through CryptoBilis within the past 90 days and haven’t initialized it yet, don’t use it for now. If you’ve already activated one, promptly check for risks through official channels and consider transferring your assets to a wallet created with a brand-new recovery phrase. The new recovery phrase must be generated on a trusted device. Never enter your old recovery phrase on a website or send it to customer support.
As members of the crypto community, we should pay attention not only to the total losses, but also to the range of affected devices, the attack vector, and whether official channels can establish more reliable tamper-proof verification.
Remember: The essence of self-custody isn’t just hiding your private keys—it’s ensuring that from the moment they’re generated, they remain in your hands alone.
$BTC
{future}(BTCUSDT)
$ETH
{future}(ETHUSDT)
Was a Ledger hardware wallet tampered with? The $86 million mystery—and the real danger is the trust chain!
#Ledger确认用户设备遭植入未授权硬件
My take:
The most concerning thing about this incident isn’t that hardware wallets are unsafe. It’s that you may think you bought a device through an official channel, but still can’t be sure it wasn’t tampered with between leaving the factory and reaching you.
Ledger has confirmed that one device involved in the incident contained an unauthorized hardware implant. However, it has not yet been confirmed whether the suspected $86 million in losses is all connected to it.
This is also a reminder that the security of a hardware wallet depends on more than its chip and code: the supply chain can also be an entry point for attacks. No matter how secure the device itself is, your assets could still be stolen if the initialization process is compromised or your recovery phrase has been exposed.
If you bought a device through CryptoBilis within the past 90 days and haven’t initialized it yet, don’t use it for now. If you’ve already activated one, promptly check for risks through official channels and consider transferring your assets to a wallet created with a brand-new recovery phrase. The new recovery phrase must be generated on a trusted device. Never enter your old recovery phrase on a website or send it to customer support.
As members of the crypto community, we should pay attention not only to the total losses, but also to the range of affected devices, the attack vector, and whether official channels can establish more reliable tamper-proof verification.
Remember: The essence of self-custody isn’t just hiding your private keys—it’s ensuring that from the moment they’re generated, they remain in your hands alone.
$BTC
$ETH
#Ledger确认用户设备遭植入未授权硬件
My take:
The most concerning thing about this incident isn’t that hardware wallets are unsafe. It’s that you may think you bought a device through an official channel, but still can’t be sure it wasn’t tampered with between leaving the factory and reaching you.
Ledger has confirmed that one device involved in the incident contained an unauthorized hardware implant. However, it has not yet been confirmed whether the suspected $86 million in losses is all connected to it.
This is also a reminder that the security of a hardware wallet depends on more than its chip and code: the supply chain can also be an entry point for attacks. No matter how secure the device itself is, your assets could still be stolen if the initialization process is compromised or your recovery phrase has been exposed.
If you bought a device through CryptoBilis within the past 90 days and haven’t initialized it yet, don’t use it for now. If you’ve already activated one, promptly check for risks through official channels and consider transferring your assets to a wallet created with a brand-new recovery phrase. The new recovery phrase must be generated on a trusted device. Never enter your old recovery phrase on a website or send it to customer support.
As members of the crypto community, we should pay attention not only to the total losses, but also to the range of affected devices, the attack vector, and whether official channels can establish more reliable tamper-proof verification.
Remember: The essence of self-custody isn’t just hiding your private keys—it’s ensuring that from the moment they’re generated, they remain in your hands alone.
$BTC
$ETH
157
·
--
CPI preview: Oil prices fuel inflation—can $BTC hold above $80K?
🔥 Most likely scenario: Headline CPI runs hot, while core CPI stays moderate.
Markets expect U.S. headline CPI to rise 0.6% month over month in September, taking the year-over-year rate to 3.6%–3.7%, mainly driven by energy prices. Core CPI is expected to increase by around 0.2% month over month, suggesting price pressures have yet to spread broadly.
📊 Three scenarios that could determine market direction:
· In line with expectations: Expectations for an October rate hike remain low, and BTC could see a choppy rebound. Watch for a move above $83,000.
· Core CPI comes in hotter than expected: Treasury yields and the U.S. dollar strengthen, and BTC could retest $80,000. U.S. tech stocks and gold may also come under pressure.
· Core CPI comes in below expectations: Rate-cut or rate-pause expectations gain traction, risk appetite improves, and BTC and altcoins could rebound.
🎯 My take:
This time, we can't focus on headline CPI alone—core inflation is what matters. A jump in headline inflation driven by energy may not be alarming; the real danger is if core inflation heats up too.
As for trading, keep leverage in check and avoid taking oversized directional bets ahead of the data. After its release, focus on how core CPI and Treasury yields move together.
Do you think this will be a case of “headline inflation causing a false alarm,” or will core inflation once again dampen market sentiment? Can BTC hold above $80,000?
#BTC走势分析
{future}(BTCUSDT)
CPI preview: Oil prices fuel inflation—can $BTC hold above $80K?
🔥 Most likely scenario: Headline CPI runs hot, while core CPI stays moderate.
Markets expect U.S. headline CPI to rise 0.6% month over month in September, taking the year-over-year rate to 3.6%–3.7%, mainly driven by energy prices. Core CPI is expected to increase by around 0.2% month over month, suggesting price pressures have yet to spread broadly.
📊 Three scenarios that could determine market direction:
· In line with expectations: Expectations for an October rate hike remain low, and BTC could see a choppy rebound. Watch for a move above $83,000.
· Core CPI comes in hotter than expected: Treasury yields and the U.S. dollar strengthen, and BTC could retest $80,000. U.S. tech stocks and gold may also come under pressure.
· Core CPI comes in below expectations: Rate-cut or rate-pause expectations gain traction, risk appetite improves, and BTC and altcoins could rebound.
🎯 My take:
This time, we can't focus on headline CPI alone—core inflation is what matters. A jump in headline inflation driven by energy may not be alarming; the real danger is if core inflation heats up too.
As for trading, keep leverage in check and avoid taking oversized directional bets ahead of the data. After its release, focus on how core CPI and Treasury yields move together.
Do you think this will be a case of “headline inflation causing a false alarm,” or will core inflation once again dampen market sentiment? Can BTC hold above $80,000?
#BTC走势分析
🔥 Most likely scenario: Headline CPI runs hot, while core CPI stays moderate.
Markets expect U.S. headline CPI to rise 0.6% month over month in September, taking the year-over-year rate to 3.6%–3.7%, mainly driven by energy prices. Core CPI is expected to increase by around 0.2% month over month, suggesting price pressures have yet to spread broadly.
📊 Three scenarios that could determine market direction:
· In line with expectations: Expectations for an October rate hike remain low, and BTC could see a choppy rebound. Watch for a move above $83,000.
· Core CPI comes in hotter than expected: Treasury yields and the U.S. dollar strengthen, and BTC could retest $80,000. U.S. tech stocks and gold may also come under pressure.
· Core CPI comes in below expectations: Rate-cut or rate-pause expectations gain traction, risk appetite improves, and BTC and altcoins could rebound.
🎯 My take:
This time, we can't focus on headline CPI alone—core inflation is what matters. A jump in headline inflation driven by energy may not be alarming; the real danger is if core inflation heats up too.
As for trading, keep leverage in check and avoid taking oversized directional bets ahead of the data. After its release, focus on how core CPI and Treasury yields move together.
Do you think this will be a case of “headline inflation causing a false alarm,” or will core inflation once again dampen market sentiment? Can BTC hold above $80,000?
#BTC走势分析
174
·
--
BTC and ETH ETFs continue to see outflows, so why is the XRP ETF bucking the trend and attracting inflows?
What exactly do investors see in it?
BTC and ETH ETFs have seen net outflows for several consecutive days recently, with combined outflows of about $1.29 billion from October 5–9. Meanwhile, the XRP ETF saw net inflows of about $8.17 million on October 8, bringing cumulative net inflows to about $1.8 billion.
Why are investors drawn specifically to $XRP ?
I think there are three main reasons:
First, the Ripple-SEC lawsuit is essentially over, reducing regulatory uncertainty;
Second, XRP has previously lagged behind, creating expectations of a catch-up rally;
Third, the cross-border payments narrative gives it an investment case distinct from BTC and ETH.
This suggests that some capital is shifting away from major assets toward investments with independent catalysts.
Technically, $XRP is currently consolidating weakly near $1.40.
The $1.32–$1.38 range is an important support zone, while $1.50–$1.53 is key resistance.
A breakout on strong volume could open the way to a further test of $1.60–$1.70;
if support fails, however, watch for a further decline.
My view:
XRP is worth watching, but inflows are a signal—not confirmation of a bull market.
The key things to watch next are whether the ETF can continue attracting inflows and whether the price can break convincingly above $1.50.
A confluence of capital flows, price action, and market sentiment would be stronger evidence of a trend reversal.
#XRP账本修复可增发XRP的漏洞 #XRP财库公司Evernorth完成SPAC合并
BTC and ETH ETFs continue to see outflows, so why is the XRP ETF bucking the trend and attracting inflows?
What exactly do investors see in it?
BTC and ETH ETFs have seen net outflows for several consecutive days recently, with combined outflows of about $1.29 billion from October 5–9. Meanwhile, the XRP ETF saw net inflows of about $8.17 million on October 8, bringing cumulative net inflows to about $1.8 billion.
Why are investors drawn specifically to $XRP ?
I think there are three main reasons:
First, the Ripple-SEC lawsuit is essentially over, reducing regulatory uncertainty;
Second, XRP has previously lagged behind, creating expectations of a catch-up rally;
Third, the cross-border payments narrative gives it an investment case distinct from BTC and ETH.
This suggests that some capital is shifting away from major assets toward investments with independent catalysts.
Technically, $XRP is currently consolidating weakly near $1.40.
The $1.32–$1.38 range is an important support zone, while $1.50–$1.53 is key resistance.
A breakout on strong volume could open the way to a further test of $1.60–$1.70;
if support fails, however, watch for a further decline.
My view:
XRP is worth watching, but inflows are a signal—not confirmation of a bull market.
The key things to watch next are whether the ETF can continue attracting inflows and whether the price can break convincingly above $1.50.
A confluence of capital flows, price action, and market sentiment would be stronger evidence of a trend reversal.
#XRP账本修复可增发XRP的漏洞 #XRP财库公司Evernorth完成SPAC合并
What exactly do investors see in it?
BTC and ETH ETFs have seen net outflows for several consecutive days recently, with combined outflows of about $1.29 billion from October 5–9. Meanwhile, the XRP ETF saw net inflows of about $8.17 million on October 8, bringing cumulative net inflows to about $1.8 billion.
Why are investors drawn specifically to $XRP ?
I think there are three main reasons:
First, the Ripple-SEC lawsuit is essentially over, reducing regulatory uncertainty;
Second, XRP has previously lagged behind, creating expectations of a catch-up rally;
Third, the cross-border payments narrative gives it an investment case distinct from BTC and ETH.
This suggests that some capital is shifting away from major assets toward investments with independent catalysts.
Technically, $XRP is currently consolidating weakly near $1.40.
The $1.32–$1.38 range is an important support zone, while $1.50–$1.53 is key resistance.
A breakout on strong volume could open the way to a further test of $1.60–$1.70;
if support fails, however, watch for a further decline.
My view:
XRP is worth watching, but inflows are a signal—not confirmation of a bull market.
The key things to watch next are whether the ETF can continue attracting inflows and whether the price can break convincingly above $1.50.
A confluence of capital flows, price action, and market sentiment would be stronger evidence of a trend reversal.
#XRP账本修复可增发XRP的漏洞 #XRP财库公司Evernorth完成SPAC合并
87
·
--
I just realized it’s Saturday—no wonder the market isn’t moving at all!
After Thursday’s price dip triggered about $1.1 billion in long liquidations, the market completed a round of deleveraging. Total market cap is now stable around $2.8 trillion, BTC dominance remains near 59%, and sentiment has cooled from greed to neutral with a cautious tilt.
Major assets:
$BTC is currently around 82,700, with the weekly chart still down about 2%–3%. After dipping to 80,400 on Thursday, it rebounded quickly and is now trading sideways in the 82,000–83,000 range. Support is holding, so this looks like stabilization after a healthy short-term pullback, though resistance remains overhead before 85,000.
$ETH is around 2,495, with a notably larger weekly decline than BTC. Ongoing ETF outflows, coupled with liquidation pressure, have weighed on its relative performance. Watch to see whether it can hold the 2,450–2,500 range.
$ZEC is around 1,226 and has held up relatively well amid broad pullbacks across major coins. The privacy sector has attracted some short-term interest, but volatility remains high at these levels, so it’s best not to chase.
$XRP is around 1.4, essentially flat over the past 24 hours, though still down on the week. It’s steadier than most major altcoins, but lacks an independent catalyst and is largely following the broader market.
What to watch next:
U.S. inflation data (CPI) and Fed comments next week. High oil prices and yields remain key variables; whether geopolitical tensions in the Middle East ease further; and whether BTC can decisively break above 83,500 and help ETH stabilize. #XRP财库公司Evernorth完成SPAC合并
{future}(BTCUSDT)
I just realized it’s Saturday—no wonder the market isn’t moving at all!
After Thursday’s price dip triggered about $1.1 billion in long liquidations, the market completed a round of deleveraging. Total market cap is now stable around $2.8 trillion, BTC dominance remains near 59%, and sentiment has cooled from greed to neutral with a cautious tilt.
Major assets:
$BTC is currently around 82,700, with the weekly chart still down about 2%–3%. After dipping to 80,400 on Thursday, it rebounded quickly and is now trading sideways in the 82,000–83,000 range. Support is holding, so this looks like stabilization after a healthy short-term pullback, though resistance remains overhead before 85,000.
$ETH is around 2,495, with a notably larger weekly decline than BTC. Ongoing ETF outflows, coupled with liquidation pressure, have weighed on its relative performance. Watch to see whether it can hold the 2,450–2,500 range.
$ZEC is around 1,226 and has held up relatively well amid broad pullbacks across major coins. The privacy sector has attracted some short-term interest, but volatility remains high at these levels, so it’s best not to chase.
$XRP is around 1.4, essentially flat over the past 24 hours, though still down on the week. It’s steadier than most major altcoins, but lacks an independent catalyst and is largely following the broader market.
What to watch next:
U.S. inflation data (CPI) and Fed comments next week. High oil prices and yields remain key variables; whether geopolitical tensions in the Middle East ease further; and whether BTC can decisively break above 83,500 and help ETH stabilize. #XRP财库公司Evernorth完成SPAC合并
After Thursday’s price dip triggered about $1.1 billion in long liquidations, the market completed a round of deleveraging. Total market cap is now stable around $2.8 trillion, BTC dominance remains near 59%, and sentiment has cooled from greed to neutral with a cautious tilt.
Major assets:
$BTC is currently around 82,700, with the weekly chart still down about 2%–3%. After dipping to 80,400 on Thursday, it rebounded quickly and is now trading sideways in the 82,000–83,000 range. Support is holding, so this looks like stabilization after a healthy short-term pullback, though resistance remains overhead before 85,000.
$ETH is around 2,495, with a notably larger weekly decline than BTC. Ongoing ETF outflows, coupled with liquidation pressure, have weighed on its relative performance. Watch to see whether it can hold the 2,450–2,500 range.
$ZEC is around 1,226 and has held up relatively well amid broad pullbacks across major coins. The privacy sector has attracted some short-term interest, but volatility remains high at these levels, so it’s best not to chase.
$XRP is around 1.4, essentially flat over the past 24 hours, though still down on the week. It’s steadier than most major altcoins, but lacks an independent catalyst and is largely following the broader market.
What to watch next:
U.S. inflation data (CPI) and Fed comments next week. High oil prices and yields remain key variables; whether geopolitical tensions in the Middle East ease further; and whether BTC can decisively break above 83,500 and help ETH stabilize. #XRP财库公司Evernorth完成SPAC合并
251
·
--
Down over 13% in a single day: ZEC’s privacy narrative isn’t dead, but buyers are starting to pull back!
$ZEC , which surged toward $1,700 throughout September, has now pulled back by about 30%. Grayscale’s ZCSH has also started seeing sustained outflows.
In the week ending October 2, ZCSH saw net outflows of about $93.56 million; on October 8, another $18.66 million flowed out. The ETF, which had been steadily absorbing supply, is now becoming selling pressure the market needs to digest.
Add in liquidations of leveraged longs and a weakening BTC, and ZEC’s current pullback is about more than just profit-taking.
My view right now:
$ZEC is bearish in the short term, but that doesn’t mean the privacy sector is over.
ZEC’s optional privacy features, ETF access, and institutional interest still have value, and the NU7 upgrade is still moving forward.
But these are medium-term factors—they can’t directly offset the outflows happening right now.
Key things to watch next:
First, whether the $1,110–$1,200 range can hold;
Second, when ZCSH’s net outflows start to ease noticeably.
If the price finds a floor and ETF outflows cool, this may just be a supply reset after a sharp rally;
if outflows continue and key support gives way, a deeper pullback is a risk.
The privacy narrative is still alive, but ZEC will need new buyers to prove it can rally again.
#ZECUSDT #比特币跌破8.1万美元
{future}(ZECUSDT)
Down over 13% in a single day: ZEC’s privacy narrative isn’t dead, but buyers are starting to pull back!
$ZEC , which surged toward $1,700 throughout September, has now pulled back by about 30%. Grayscale’s ZCSH has also started seeing sustained outflows.
In the week ending October 2, ZCSH saw net outflows of about $93.56 million; on October 8, another $18.66 million flowed out. The ETF, which had been steadily absorbing supply, is now becoming selling pressure the market needs to digest.
Add in liquidations of leveraged longs and a weakening BTC, and ZEC’s current pullback is about more than just profit-taking.
My view right now:
$ZEC is bearish in the short term, but that doesn’t mean the privacy sector is over.
ZEC’s optional privacy features, ETF access, and institutional interest still have value, and the NU7 upgrade is still moving forward.
But these are medium-term factors—they can’t directly offset the outflows happening right now.
Key things to watch next:
First, whether the $1,110–$1,200 range can hold;
Second, when ZCSH’s net outflows start to ease noticeably.
If the price finds a floor and ETF outflows cool, this may just be a supply reset after a sharp rally;
if outflows continue and key support gives way, a deeper pullback is a risk.
The privacy narrative is still alive, but ZEC will need new buyers to prove it can rally again.
#ZECUSDT #比特币跌破8.1万美元
$ZEC , which surged toward $1,700 throughout September, has now pulled back by about 30%. Grayscale’s ZCSH has also started seeing sustained outflows.
In the week ending October 2, ZCSH saw net outflows of about $93.56 million; on October 8, another $18.66 million flowed out. The ETF, which had been steadily absorbing supply, is now becoming selling pressure the market needs to digest.
Add in liquidations of leveraged longs and a weakening BTC, and ZEC’s current pullback is about more than just profit-taking.
My view right now:
$ZEC is bearish in the short term, but that doesn’t mean the privacy sector is over.
ZEC’s optional privacy features, ETF access, and institutional interest still have value, and the NU7 upgrade is still moving forward.
But these are medium-term factors—they can’t directly offset the outflows happening right now.
Key things to watch next:
First, whether the $1,110–$1,200 range can hold;
Second, when ZCSH’s net outflows start to ease noticeably.
If the price finds a floor and ETF outflows cool, this may just be a supply reset after a sharp rally;
if outflows continue and key support gives way, a deeper pullback is a risk.
The privacy narrative is still alive, but ZEC will need new buyers to prove it can rally again.
#ZECUSDT #比特币跌破8.1万美元
237
·
--
ETF inflows are still coming in—so why is BTC falling instead?
Because the main force driving the sell-off right now isn’t spot trading.
On the 6th, U.S. spot BTC ETFs saw net inflows of about $119 million, yet BTC still fell from $87,000 to $83,000.
There’s no contradiction here. ETFs are buying the dip, but leveraged longs are getting liquidated in a cascade.
Over the past 24 hours, about $67.5 million worth of BTC futures positions were liquidated, with long positions accounting for roughly 85%.
After several failed attempts to break through $87,000, the market had built up a lot of leveraged positions chasing a breakout. Once the price fell below a key level, forced liquidations became fresh sell orders, creating a cycle: prices fall → positions get liquidated → prices fall further.
What makes things worse is that the macro environment is also helping the bears.
$BZ surged above $100, the 10-year Treasury yield approached 5.3%, the U.S. dollar strengthened, and risk assets came under broad pressure.
So BTC’s situation right now is:
ETFs are buying below, leverage is driving prices down from above, and macro factors are adding pressure from the sidelines.
That’s why ETF inflows worth $100 million in a single day may still be nowhere near enough to stop prices from falling that day.
I wouldn’t recommend $BTC flipping straight to a short position right now. The $83,000 support is still strong.
If it holds, wait for leverage to clear before looking for a rebound. If it breaks, the next support is around $80,000.
If ETF inflows remain steady, liquidations cool off noticeably, and oil prices and Treasury yields start to pull back, that’s when the buying power of spot demand will truly come into view. #美联储纪要聚焦10月暂停加息
{future}(BZUSDT)
{future}(BTCUSDT)
ETF inflows are still coming in—so why is BTC falling instead?
Because the main force driving the sell-off right now isn’t spot trading.
On the 6th, U.S. spot BTC ETFs saw net inflows of about $119 million, yet BTC still fell from $87,000 to $83,000.
There’s no contradiction here. ETFs are buying the dip, but leveraged longs are getting liquidated in a cascade.
Over the past 24 hours, about $67.5 million worth of BTC futures positions were liquidated, with long positions accounting for roughly 85%.
After several failed attempts to break through $87,000, the market had built up a lot of leveraged positions chasing a breakout. Once the price fell below a key level, forced liquidations became fresh sell orders, creating a cycle: prices fall → positions get liquidated → prices fall further.
What makes things worse is that the macro environment is also helping the bears.
$BZ surged above $100, the 10-year Treasury yield approached 5.3%, the U.S. dollar strengthened, and risk assets came under broad pressure.
So BTC’s situation right now is:
ETFs are buying below, leverage is driving prices down from above, and macro factors are adding pressure from the sidelines.
That’s why ETF inflows worth $100 million in a single day may still be nowhere near enough to stop prices from falling that day.
I wouldn’t recommend $BTC flipping straight to a short position right now. The $83,000 support is still strong.
If it holds, wait for leverage to clear before looking for a rebound. If it breaks, the next support is around $80,000.
If ETF inflows remain steady, liquidations cool off noticeably, and oil prices and Treasury yields start to pull back, that’s when the buying power of spot demand will truly come into view. #美联储纪要聚焦10月暂停加息
Because the main force driving the sell-off right now isn’t spot trading.
On the 6th, U.S. spot BTC ETFs saw net inflows of about $119 million, yet BTC still fell from $87,000 to $83,000.
There’s no contradiction here. ETFs are buying the dip, but leveraged longs are getting liquidated in a cascade.
Over the past 24 hours, about $67.5 million worth of BTC futures positions were liquidated, with long positions accounting for roughly 85%.
After several failed attempts to break through $87,000, the market had built up a lot of leveraged positions chasing a breakout. Once the price fell below a key level, forced liquidations became fresh sell orders, creating a cycle: prices fall → positions get liquidated → prices fall further.
What makes things worse is that the macro environment is also helping the bears.
$BZ surged above $100, the 10-year Treasury yield approached 5.3%, the U.S. dollar strengthened, and risk assets came under broad pressure.
So BTC’s situation right now is:
ETFs are buying below, leverage is driving prices down from above, and macro factors are adding pressure from the sidelines.
That’s why ETF inflows worth $100 million in a single day may still be nowhere near enough to stop prices from falling that day.
I wouldn’t recommend $BTC flipping straight to a short position right now. The $83,000 support is still strong.
If it holds, wait for leverage to clear before looking for a rebound. If it breaks, the next support is around $80,000.
If ETF inflows remain steady, liquidations cool off noticeably, and oil prices and Treasury yields start to pull back, that’s when the buying power of spot demand will truly come into view. #美联储纪要聚焦10月暂停加息
36
·
--
I’m still bullish on the outlook, but ETH has clearly been weaker in the short term.
$ETH It fell from around 2,700 to 2,535. It still couldn’t reclaim 2,600 this morning and has returned to the 2,560 area. Its decline has been greater than BTC’s, so it is indeed weak in the short term.
But I’m still bullish on the outlook, mainly for these reasons:
1. The 2,535–2,580 range lines up with a support zone around the daily retracement level, the 50-day moving average, and the 200-week moving average. The next weekly reference below that is 2,500.
2. The medium-term moving averages are still lower, and the broader structure remains intact. It’s just that the short-term uptrend line in place since September has been broken, so momentum needs time to rebuild.
3. ETFs have seen net outflows for six consecutive days, but these redemptions reflect institutions rebalancing their positions amid macro pressure. Oil prices, Treasury yields, and hawkish minutes have all weighed on risk assets at the same time, and ETH, as a high-beta asset, has been hit harder. Six consecutive days of redemptions have erased nearly half of the earlier inflows, and a round of leveraged long positions has also been cleared out, leaving positioning less crowded than at the start of the month.
In terms of trading, I’m taking a bullish stance after consolidation rather than chasing the excitement ahead of a breakout.
Most likely, price will consolidate around 2,540–2,580, with 2,600 as the first upside target.
If it breaks decisively below 2,500 on the daily chart, I’ll set aside the short-term bullish thesis for now and reassess around 2,450–2,430.
Macro risks remain, and above 2,600 there is already overhead supply from trapped holders, as well as the psychological hurdle of ETF redemptions.
So I’ll wait patiently for the weak hands to be shaken out and risk appetite to recover. #美联储纪要聚焦10月暂停加息
{future}(ETHUSDT)
I’m still bullish on the outlook, but ETH has clearly been weaker in the short term.
$ETH It fell from around 2,700 to 2,535. It still couldn’t reclaim 2,600 this morning and has returned to the 2,560 area. Its decline has been greater than BTC’s, so it is indeed weak in the short term.
But I’m still bullish on the outlook, mainly for these reasons:
1. The 2,535–2,580 range lines up with a support zone around the daily retracement level, the 50-day moving average, and the 200-week moving average. The next weekly reference below that is 2,500.
2. The medium-term moving averages are still lower, and the broader structure remains intact. It’s just that the short-term uptrend line in place since September has been broken, so momentum needs time to rebuild.
3. ETFs have seen net outflows for six consecutive days, but these redemptions reflect institutions rebalancing their positions amid macro pressure. Oil prices, Treasury yields, and hawkish minutes have all weighed on risk assets at the same time, and ETH, as a high-beta asset, has been hit harder. Six consecutive days of redemptions have erased nearly half of the earlier inflows, and a round of leveraged long positions has also been cleared out, leaving positioning less crowded than at the start of the month.
In terms of trading, I’m taking a bullish stance after consolidation rather than chasing the excitement ahead of a breakout.
Most likely, price will consolidate around 2,540–2,580, with 2,600 as the first upside target.
If it breaks decisively below 2,500 on the daily chart, I’ll set aside the short-term bullish thesis for now and reassess around 2,450–2,430.
Macro risks remain, and above 2,600 there is already overhead supply from trapped holders, as well as the psychological hurdle of ETF redemptions.
So I’ll wait patiently for the weak hands to be shaken out and risk appetite to recover. #美联储纪要聚焦10月暂停加息
$ETH It fell from around 2,700 to 2,535. It still couldn’t reclaim 2,600 this morning and has returned to the 2,560 area. Its decline has been greater than BTC’s, so it is indeed weak in the short term.
But I’m still bullish on the outlook, mainly for these reasons:
1. The 2,535–2,580 range lines up with a support zone around the daily retracement level, the 50-day moving average, and the 200-week moving average. The next weekly reference below that is 2,500.
2. The medium-term moving averages are still lower, and the broader structure remains intact. It’s just that the short-term uptrend line in place since September has been broken, so momentum needs time to rebuild.
3. ETFs have seen net outflows for six consecutive days, but these redemptions reflect institutions rebalancing their positions amid macro pressure. Oil prices, Treasury yields, and hawkish minutes have all weighed on risk assets at the same time, and ETH, as a high-beta asset, has been hit harder. Six consecutive days of redemptions have erased nearly half of the earlier inflows, and a round of leveraged long positions has also been cleared out, leaving positioning less crowded than at the start of the month.
In terms of trading, I’m taking a bullish stance after consolidation rather than chasing the excitement ahead of a breakout.
Most likely, price will consolidate around 2,540–2,580, with 2,600 as the first upside target.
If it breaks decisively below 2,500 on the daily chart, I’ll set aside the short-term bullish thesis for now and reassess around 2,450–2,430.
Macro risks remain, and above 2,600 there is already overhead supply from trapped holders, as well as the psychological hurdle of ETF redemptions.
So I’ll wait patiently for the weak hands to be shaken out and risk appetite to recover. #美联储纪要聚焦10月暂停加息
261
·
--
At Basecamp, Sui pushed tunnels to a peak of 40.61 million TPS—it's definitely well suited for AI.
The official positioning is that this layer serves as the throughput layer for the AI agent economy: humans can't use this kind of speed, but agents can.
Despite such a major bullish catalyst, $SUI not only failed to rise, but fell quite a bit.
$SUI The current price is around $1.13, still roughly 80% below the all-time high of $5.35.
My view is that macro factors dragged the price down first; the narrative hasn't been priced in yet.
I'm bullish not because the mainnet is already running at 40 million TPS, but because agent payments need channels with near-zero marginal costs. Sui keeps channel opening and closing on the mainnet, while intermediate interactions happen off-chain.
Next, let's see whether $1.10 can hold.
If it does, the first target is the previous high of $1.19–$1.23; a breakout on rising volume would put the next target around $1.26. #Sui创4060万TPS纪录
{future}(SUIUSDT)
At Basecamp, Sui pushed tunnels to a peak of 40.61 million TPS—it's definitely well suited for AI.
The official positioning is that this layer serves as the throughput layer for the AI agent economy: humans can't use this kind of speed, but agents can.
Despite such a major bullish catalyst, $SUI not only failed to rise, but fell quite a bit.
$SUI The current price is around $1.13, still roughly 80% below the all-time high of $5.35.
My view is that macro factors dragged the price down first; the narrative hasn't been priced in yet.
I'm bullish not because the mainnet is already running at 40 million TPS, but because agent payments need channels with near-zero marginal costs. Sui keeps channel opening and closing on the mainnet, while intermediate interactions happen off-chain.
Next, let's see whether $1.10 can hold.
If it does, the first target is the previous high of $1.19–$1.23; a breakout on rising volume would put the next target around $1.26. #Sui创4060万TPS纪录
The official positioning is that this layer serves as the throughput layer for the AI agent economy: humans can't use this kind of speed, but agents can.
Despite such a major bullish catalyst, $SUI not only failed to rise, but fell quite a bit.
$SUI The current price is around $1.13, still roughly 80% below the all-time high of $5.35.
My view is that macro factors dragged the price down first; the narrative hasn't been priced in yet.
I'm bullish not because the mainnet is already running at 40 million TPS, but because agent payments need channels with near-zero marginal costs. Sui keeps channel opening and closing on the mainnet, while intermediate interactions happen off-chain.
Next, let's see whether $1.10 can hold.
If it does, the first target is the previous high of $1.19–$1.23; a breakout on rising volume would put the next target around $1.26. #Sui创4060万TPS纪录
303
·
--
Bullish
The minutes were released and were hawkish, just as expected. The market is still broadly range-bound, so look to add longs on dips in the short term.
The minutes released early this morning stated:
Most participants thought that another increase in the target range before year-end “would likely be appropriate,”
but they did not commit to whether action would be necessary in October or December.
$BTC Maintain the short-term view of adding longs on dips in a choppy market.
There are three main reasons:
1. Leverage has already been flushed out once. Liquidations over the past 24 hours totaled around $550–600 million, the vast majority of them long positions. Funding rates have fallen noticeably, and long-position crowding has eased.
2. Technically, the price is still above the higher-timeframe moving average cluster. The area around 83000 marks the low after this round of leverage liquidations; it does not mean the trend has broken down.
3. The market is still pricing in an 80% chance that rates will be held steady at the October meeting. The key policy events are not until the end of the month and December, with no catalyst in between for an immediate further rate hike.
Key things to watch next:
A further escalation in the Strait of Hormuz situation, with oil prices and US Treasuries being key;
If BTC breaks below the low of 82700 on rising volume, long positions should be cautious about risk;
In the short term, consider opening a small long position near the lower end of the 83000 range.
The first resistance above remains at 85000, followed by the area around 87,000 where price was rejected several times before.#FOMC会议 #BTC走势分析
{future}(BTCUSDT)
The minutes were released and were hawkish, just as expected. The market is still broadly range-bound, so look to add longs on dips in the short term.
The minutes released early this morning stated:
Most participants thought that another increase in the target range before year-end “would likely be appropriate,”
but they did not commit to whether action would be necessary in October or December.
$BTC Maintain the short-term view of adding longs on dips in a choppy market.
There are three main reasons:
1. Leverage has already been flushed out once. Liquidations over the past 24 hours totaled around $550–600 million, the vast majority of them long positions. Funding rates have fallen noticeably, and long-position crowding has eased.
2. Technically, the price is still above the higher-timeframe moving average cluster. The area around 83000 marks the low after this round of leverage liquidations; it does not mean the trend has broken down.
3. The market is still pricing in an 80% chance that rates will be held steady at the October meeting. The key policy events are not until the end of the month and December, with no catalyst in between for an immediate further rate hike.
Key things to watch next:
A further escalation in the Strait of Hormuz situation, with oil prices and US Treasuries being key;
If BTC breaks below the low of 82700 on rising volume, long positions should be cautious about risk;
In the short term, consider opening a small long position near the lower end of the 83000 range.
The first resistance above remains at 85000, followed by the area around 87,000 where price was rejected several times before.#FOMC会议 #BTC走势分析
The minutes released early this morning stated:
Most participants thought that another increase in the target range before year-end “would likely be appropriate,”
but they did not commit to whether action would be necessary in October or December.
$BTC Maintain the short-term view of adding longs on dips in a choppy market.
There are three main reasons:
1. Leverage has already been flushed out once. Liquidations over the past 24 hours totaled around $550–600 million, the vast majority of them long positions. Funding rates have fallen noticeably, and long-position crowding has eased.
2. Technically, the price is still above the higher-timeframe moving average cluster. The area around 83000 marks the low after this round of leverage liquidations; it does not mean the trend has broken down.
3. The market is still pricing in an 80% chance that rates will be held steady at the October meeting. The key policy events are not until the end of the month and December, with no catalyst in between for an immediate further rate hike.
Key things to watch next:
A further escalation in the Strait of Hormuz situation, with oil prices and US Treasuries being key;
If BTC breaks below the low of 82700 on rising volume, long positions should be cautious about risk;
In the short term, consider opening a small long position near the lower end of the 83000 range.
The first resistance above remains at 85000, followed by the area around 87,000 where price was rejected several times before.#FOMC会议 #BTC走势分析
305
·
--
The minutes released in the early hours of the 8th will likely strike a hawkish tone, and a rate hike could come in December
The Fed already raised rates by 25 basis points in September, and the dot plot also put another hike this year in the median projection.
Markets have now largely ruled out a rate hike in October, with the probability at only around 22%. But the probability of a December hike to 4.00%–4.25% is already close to 68%.
More importantly, Daly’s recent comments haven’t ruled out further rate hikes:
If the inflationary shocks from tariffs, oil prices, and AI demand are only temporary, the Fed can pause;
but if these factors continue to build, the Fed may still tighten further.
And now $BZ has climbed back above $100, giving hawks a fresh reason to push for that.
So my view is that the minutes may not explicitly say “there will definitely be a hike in December,” but will likely send a clear signal: inflation hasn’t been beaten, and the Fed hasn’t ruled out further rate hikes.
Market action:
I don’t think today’s sharp drop in crypto was mainly driven by traders positioning ahead of the minutes. Rather, it was a combination of the oil price shock, rising Treasury yields, and a wave of liquidations among heavily leveraged longs.
$BZ surged above $101, the 10-year Treasury yield broke through 5.3%, and $BTC briefly fell below $84,000. Oil prices are weighing on valuations, while leverage is fueling a cascade of liquidations, naturally amplifying the losses.
If tonight’s minutes remain hawkish and the dollar and Treasury yields climb further, BTC will likely face more near-term pressure.
My approach:
I’m not chasing the drop. I’ll wait for the panic to subside first.
83,000 is the near-term support level. If it holds, I’ll wait for the liquidations to end before looking for a rebound;
if it breaks below 83,000, we’ll need to watch out for a move toward 80,000.
What really matters tonight isn’t just how hawkish the minutes are, but whether oil prices keep rising and yields continue to climb.
If these two variables don’t come down, even dovish wording alone will have a hard time rescuing crypto. #美联储纪要
{future}(BZUSDT)
{future}(BTCUSDT)
The minutes released in the early hours of the 8th will likely strike a hawkish tone, and a rate hike could come in December
The Fed already raised rates by 25 basis points in September, and the dot plot also put another hike this year in the median projection.
Markets have now largely ruled out a rate hike in October, with the probability at only around 22%. But the probability of a December hike to 4.00%–4.25% is already close to 68%.
More importantly, Daly’s recent comments haven’t ruled out further rate hikes:
If the inflationary shocks from tariffs, oil prices, and AI demand are only temporary, the Fed can pause;
but if these factors continue to build, the Fed may still tighten further.
And now $BZ has climbed back above $100, giving hawks a fresh reason to push for that.
So my view is that the minutes may not explicitly say “there will definitely be a hike in December,” but will likely send a clear signal: inflation hasn’t been beaten, and the Fed hasn’t ruled out further rate hikes.
Market action:
I don’t think today’s sharp drop in crypto was mainly driven by traders positioning ahead of the minutes. Rather, it was a combination of the oil price shock, rising Treasury yields, and a wave of liquidations among heavily leveraged longs.
$BZ surged above $101, the 10-year Treasury yield broke through 5.3%, and $BTC briefly fell below $84,000. Oil prices are weighing on valuations, while leverage is fueling a cascade of liquidations, naturally amplifying the losses.
If tonight’s minutes remain hawkish and the dollar and Treasury yields climb further, BTC will likely face more near-term pressure.
My approach:
I’m not chasing the drop. I’ll wait for the panic to subside first.
83,000 is the near-term support level. If it holds, I’ll wait for the liquidations to end before looking for a rebound;
if it breaks below 83,000, we’ll need to watch out for a move toward 80,000.
What really matters tonight isn’t just how hawkish the minutes are, but whether oil prices keep rising and yields continue to climb.
If these two variables don’t come down, even dovish wording alone will have a hard time rescuing crypto. #美联储纪要
The Fed already raised rates by 25 basis points in September, and the dot plot also put another hike this year in the median projection.
Markets have now largely ruled out a rate hike in October, with the probability at only around 22%. But the probability of a December hike to 4.00%–4.25% is already close to 68%.
More importantly, Daly’s recent comments haven’t ruled out further rate hikes:
If the inflationary shocks from tariffs, oil prices, and AI demand are only temporary, the Fed can pause;
but if these factors continue to build, the Fed may still tighten further.
And now $BZ has climbed back above $100, giving hawks a fresh reason to push for that.
So my view is that the minutes may not explicitly say “there will definitely be a hike in December,” but will likely send a clear signal: inflation hasn’t been beaten, and the Fed hasn’t ruled out further rate hikes.
Market action:
I don’t think today’s sharp drop in crypto was mainly driven by traders positioning ahead of the minutes. Rather, it was a combination of the oil price shock, rising Treasury yields, and a wave of liquidations among heavily leveraged longs.
$BZ surged above $101, the 10-year Treasury yield broke through 5.3%, and $BTC briefly fell below $84,000. Oil prices are weighing on valuations, while leverage is fueling a cascade of liquidations, naturally amplifying the losses.
If tonight’s minutes remain hawkish and the dollar and Treasury yields climb further, BTC will likely face more near-term pressure.
My approach:
I’m not chasing the drop. I’ll wait for the panic to subside first.
83,000 is the near-term support level. If it holds, I’ll wait for the liquidations to end before looking for a rebound;
if it breaks below 83,000, we’ll need to watch out for a move toward 80,000.
What really matters tonight isn’t just how hawkish the minutes are, but whether oil prices keep rising and yields continue to climb.
If these two variables don’t come down, even dovish wording alone will have a hard time rescuing crypto. #美联储纪要
468
Log in to explore more content
Join global crypto users on Binance Square
⚡️ Get latest and useful information about crypto.
💬 Trusted by the world’s largest crypto exchange.
👍 Discover real insights from verified creators.
Email / Phone number