

bendigote
69 Posts

bendigote
Report
Block User
Análisis, lectura técnica y más.
Open Trade
Frequent Trader
5.4 Years
8 Following
44 Followers
33 Liked
Posts
Portfolio
·
--
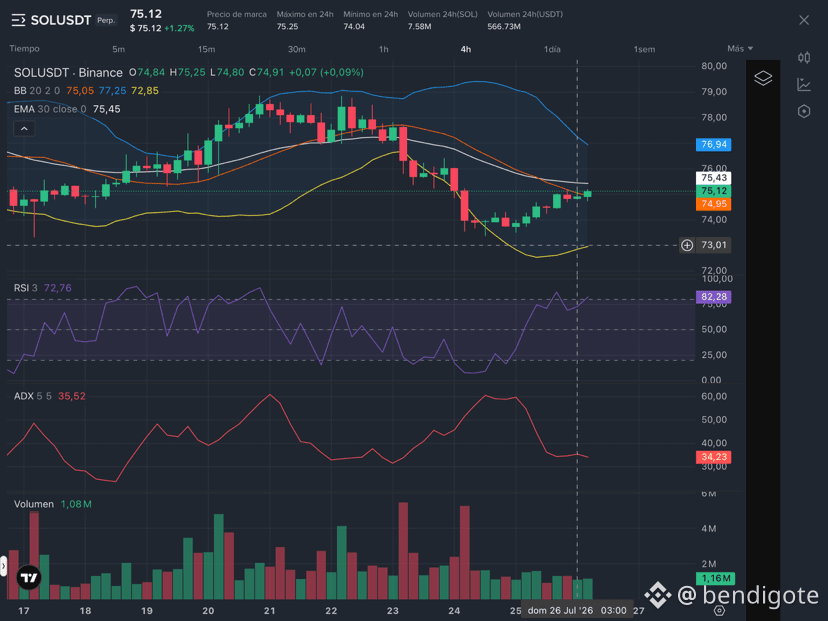
⚡️ Fast Analysis: $SOL Perpetual (4H)
Tense structure at 75.14 with mixed signals of exhaustion and strength.
📊 Key Data
4H Candles: Bullish attempt halted. The latest sessions show small bodies and decreasing volume (from 1.3M to 1.08M).
RSI: Stays elevated in a high-tension zone (72.76), without fully cooling off.
ADX: Strong at 35.52, indicating the trend keeps its structure, but is ranging in the short term.
Bollinger Bands: Price is oscillating near the midline, with the upper band acting as a key resistance.
🔮 Quick Forecast
Key area to watch: Immediate support at 74.80 - 74.40 and dynamic resistance in the 75.50 area.
Scenario: If it breaks and holds with volume above 75.50, it targets the upper part of the BB (~77.00). If it loses 74.40, it will look for a deep re-test toward the lower band (~72.80) to relieve the overbought condition.
Is it heading to break resistance—or a bullish trap to sweep longs? 👇📉📈
{future}(SOLUSDT)
⚡️ Fast Analysis: $SOL Perpetual (4H)
Tense structure at 75.14 with mixed signals of exhaustion and strength.
📊 Key Data
4H Candles: Bullish attempt halted. The latest sessions show small bodies and decreasing volume (from 1.3M to 1.08M).
RSI: Stays elevated in a high-tension zone (72.76), without fully cooling off.
ADX: Strong at 35.52, indicating the trend keeps its structure, but is ranging in the short term.
Bollinger Bands: Price is oscillating near the midline, with the upper band acting as a key resistance.
🔮 Quick Forecast
Key area to watch: Immediate support at 74.80 - 74.40 and dynamic resistance in the 75.50 area.
Scenario: If it breaks and holds with volume above 75.50, it targets the upper part of the BB (~77.00). If it loses 74.40, it will look for a deep re-test toward the lower band (~72.80) to relieve the overbought condition.
Is it heading to break resistance—or a bullish trap to sweep longs? 👇📉📈
Tense structure at 75.14 with mixed signals of exhaustion and strength.
📊 Key Data
4H Candles: Bullish attempt halted. The latest sessions show small bodies and decreasing volume (from 1.3M to 1.08M).
RSI: Stays elevated in a high-tension zone (72.76), without fully cooling off.
ADX: Strong at 35.52, indicating the trend keeps its structure, but is ranging in the short term.
Bollinger Bands: Price is oscillating near the midline, with the upper band acting as a key resistance.
🔮 Quick Forecast
Key area to watch: Immediate support at 74.80 - 74.40 and dynamic resistance in the 75.50 area.
Scenario: If it breaks and holds with volume above 75.50, it targets the upper part of the BB (~77.00). If it loses 74.40, it will look for a deep re-test toward the lower band (~72.80) to relieve the overbought condition.
Is it heading to break resistance—or a bullish trap to sweep longs? 👇📉📈
1
1.8k
·
--
$SOL : The chart is lying and the $76 hurts
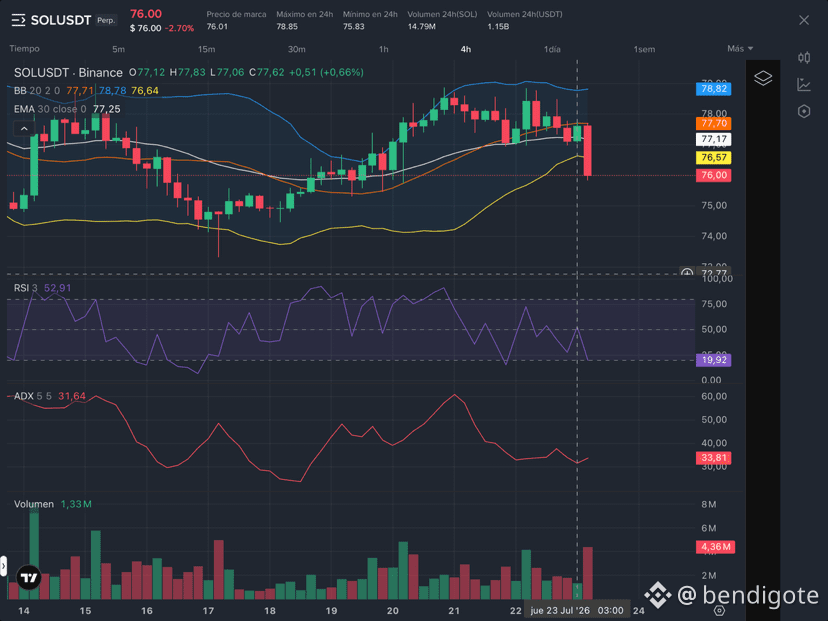
We just closed a 12-hour block that shows why traditional technical analysis sometimes feels like guessing the weather by looking at clouds.
If you were guided only by the last green candle closing at 77.62 and an RSI recovering to 52.91, you’d think buyers are back in control. But what’s on the screen right now is brutal: the price is at 76.00.
The real read (what the bots did to us):
The green mirage: That last green candle misled more than one person into believing in an organic bounce. However, volume fell to 1.33m (less than the prior declines). It was a classic liquidity-induction move—an attraction to trap late longs.
The Bands trap: Price tried to seek the median at 77.71, but the moment the algorithms swept that upper liquidity area, the market ruthlessly collapsed below the lower band, and is now trading at 76.00.
ADX losing strength: With the ADX dropping to 31.64, the clear directional trend fades, making room for pure high-frequency manipulation. The bots are playing in a range, sweeping stops up and down.
Forecast without filters:
It does nothing to watch moving averages or RSI when liquidity drains that fast. If 76.00 can’t hold immediately with a real injection of institutional volume, the path toward a deep purge of positions is open.
The chart from an hour ago told you one thing; the current quote tells you another. That’s why classic technical analysis falls short against the game played by market makers.
Are they trapped in this move, or did they get out in time before the drop to $76? I’ll read your thoughts.
Disclaimer: Honest analysis without masks. Not financial advice.
{future}(SOLUSDT)
$SOL : The chart is lying and the $76 hurts
We just closed a 12-hour block that shows why traditional technical analysis sometimes feels like guessing the weather by looking at clouds.
If you were guided only by the last green candle closing at 77.62 and an RSI recovering to 52.91, you’d think buyers are back in control. But what’s on the screen right now is brutal: the price is at 76.00.
The real read (what the bots did to us):
The green mirage: That last green candle misled more than one person into believing in an organic bounce. However, volume fell to 1.33m (less than the prior declines). It was a classic liquidity-induction move—an attraction to trap late longs.
The Bands trap: Price tried to seek the median at 77.71, but the moment the algorithms swept that upper liquidity area, the market ruthlessly collapsed below the lower band, and is now trading at 76.00.
ADX losing strength: With the ADX dropping to 31.64, the clear directional trend fades, making room for pure high-frequency manipulation. The bots are playing in a range, sweeping stops up and down.
Forecast without filters:
It does nothing to watch moving averages or RSI when liquidity drains that fast. If 76.00 can’t hold immediately with a real injection of institutional volume, the path toward a deep purge of positions is open.
The chart from an hour ago told you one thing; the current quote tells you another. That’s why classic technical analysis falls short against the game played by market makers.
Are they trapped in this move, or did they get out in time before the drop to $76? I’ll read your thoughts.
Disclaimer: Honest analysis without masks. Not financial advice.
We just closed a 12-hour block that shows why traditional technical analysis sometimes feels like guessing the weather by looking at clouds.
If you were guided only by the last green candle closing at 77.62 and an RSI recovering to 52.91, you’d think buyers are back in control. But what’s on the screen right now is brutal: the price is at 76.00.
The real read (what the bots did to us):
The green mirage: That last green candle misled more than one person into believing in an organic bounce. However, volume fell to 1.33m (less than the prior declines). It was a classic liquidity-induction move—an attraction to trap late longs.
The Bands trap: Price tried to seek the median at 77.71, but the moment the algorithms swept that upper liquidity area, the market ruthlessly collapsed below the lower band, and is now trading at 76.00.
ADX losing strength: With the ADX dropping to 31.64, the clear directional trend fades, making room for pure high-frequency manipulation. The bots are playing in a range, sweeping stops up and down.
Forecast without filters:
It does nothing to watch moving averages or RSI when liquidity drains that fast. If 76.00 can’t hold immediately with a real injection of institutional volume, the path toward a deep purge of positions is open.
The chart from an hour ago told you one thing; the current quote tells you another. That’s why classic technical analysis falls short against the game played by market makers.
Are they trapped in this move, or did they get out in time before the drop to $76? I’ll read your thoughts.
Disclaimer: Honest analysis without masks. Not financial advice.
4
4.1k
·
--
$SOL (Sol Perpetuo): The support break is a fact ⚠️
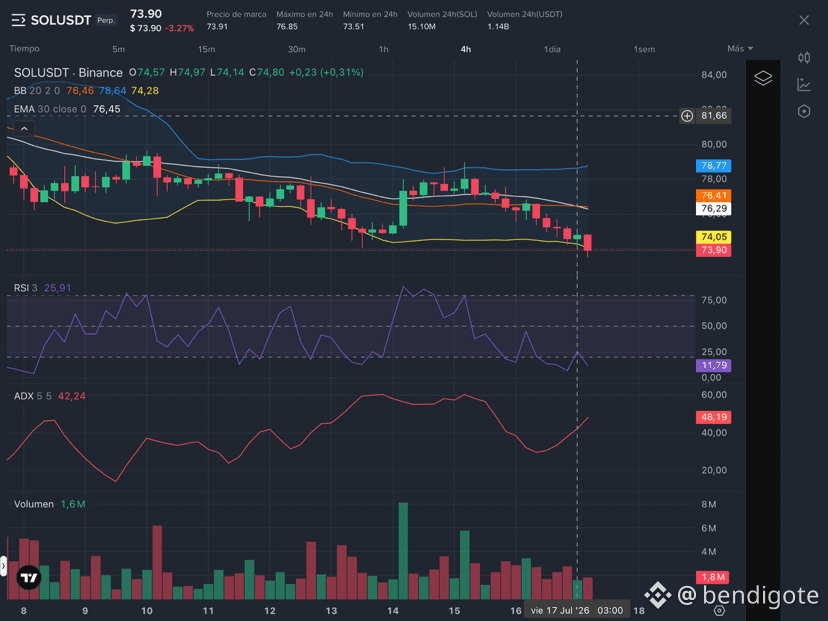
If you were expecting a recovery after that small green bounce on the last candle, the current data at 73.90 confirms it was only an illusion. The technical structure on the 4H chart has fractured.
Structure analysis:
Capitulation and failed bounce: The RSI hit an all-time low of 6.94 on the second candle, a technical oversold level that we rarely see. The last green candle tried to stage a rescue, but with weak volume (1.6m) compared to the prior drop, it’s clear there was no buying conviction.
ADX as a trend test: Despite the green candle, the ADX has risen from 33.39 to 42.24. This is devastating data: it tells us that the downtrend is accelerating even while price attempts to correct. The market’s momentum is clearly “sell”.
Danger zone: Since we’re currently at 73.85, we’ve broken the Lower Bollinger Band (74.28). We’re operating in unknown territory for the short term, and when an asset breaks its lower band in a sustained way, the market enters a “floor-search” mode, where volatility has no ceiling.
The EMA (76.45) has moved too far away from the current price; it’s acting like a gravitational ceiling pulling the structure downward. I don’t see any fundamentals for an immediate recovery. The lack of volume in the bounce attempt confirms that institutional capital is staying on the sidelines, waiting for a full capitulation.
Trading in this context is like trying to pick up coins in front of a bulldozer. I’d rather see a clear consolidation base and a surge in volume before considering any entry. If 74.00 can’t quickly reclaim its role as support, the next leg down is inevitable.
Does anyone see any real demand signals, or are we simply in free fall? I’m reading your thoughts, but be very careful with longs right now.
Disclaimer: This is not financial advice. The current structure is high risk. DYOR.
{future}(SOLUSDT)
$SOL (Sol Perpetuo): The support break is a fact ⚠️
If you were expecting a recovery after that small green bounce on the last candle, the current data at 73.90 confirms it was only an illusion. The technical structure on the 4H chart has fractured.
Structure analysis:
Capitulation and failed bounce: The RSI hit an all-time low of 6.94 on the second candle, a technical oversold level that we rarely see. The last green candle tried to stage a rescue, but with weak volume (1.6m) compared to the prior drop, it’s clear there was no buying conviction.
ADX as a trend test: Despite the green candle, the ADX has risen from 33.39 to 42.24. This is devastating data: it tells us that the downtrend is accelerating even while price attempts to correct. The market’s momentum is clearly “sell”.
Danger zone: Since we’re currently at 73.85, we’ve broken the Lower Bollinger Band (74.28). We’re operating in unknown territory for the short term, and when an asset breaks its lower band in a sustained way, the market enters a “floor-search” mode, where volatility has no ceiling.
The EMA (76.45) has moved too far away from the current price; it’s acting like a gravitational ceiling pulling the structure downward. I don’t see any fundamentals for an immediate recovery. The lack of volume in the bounce attempt confirms that institutional capital is staying on the sidelines, waiting for a full capitulation.
Trading in this context is like trying to pick up coins in front of a bulldozer. I’d rather see a clear consolidation base and a surge in volume before considering any entry. If 74.00 can’t quickly reclaim its role as support, the next leg down is inevitable.
Does anyone see any real demand signals, or are we simply in free fall? I’m reading your thoughts, but be very careful with longs right now.
Disclaimer: This is not financial advice. The current structure is high risk. DYOR.
If you were expecting a recovery after that small green bounce on the last candle, the current data at 73.90 confirms it was only an illusion. The technical structure on the 4H chart has fractured.
Structure analysis:
Capitulation and failed bounce: The RSI hit an all-time low of 6.94 on the second candle, a technical oversold level that we rarely see. The last green candle tried to stage a rescue, but with weak volume (1.6m) compared to the prior drop, it’s clear there was no buying conviction.
ADX as a trend test: Despite the green candle, the ADX has risen from 33.39 to 42.24. This is devastating data: it tells us that the downtrend is accelerating even while price attempts to correct. The market’s momentum is clearly “sell”.
Danger zone: Since we’re currently at 73.85, we’ve broken the Lower Bollinger Band (74.28). We’re operating in unknown territory for the short term, and when an asset breaks its lower band in a sustained way, the market enters a “floor-search” mode, where volatility has no ceiling.
The EMA (76.45) has moved too far away from the current price; it’s acting like a gravitational ceiling pulling the structure downward. I don’t see any fundamentals for an immediate recovery. The lack of volume in the bounce attempt confirms that institutional capital is staying on the sidelines, waiting for a full capitulation.
Trading in this context is like trying to pick up coins in front of a bulldozer. I’d rather see a clear consolidation base and a surge in volume before considering any entry. If 74.00 can’t quickly reclaim its role as support, the next leg down is inevitable.
Does anyone see any real demand signals, or are we simply in free fall? I’m reading your thoughts, but be very careful with longs right now.
Disclaimer: This is not financial advice. The current structure is high risk. DYOR.
2
2
2.4k
·
--
$SOL (Sol Perpetuo): The capitulation is real and support is wobbling 📉
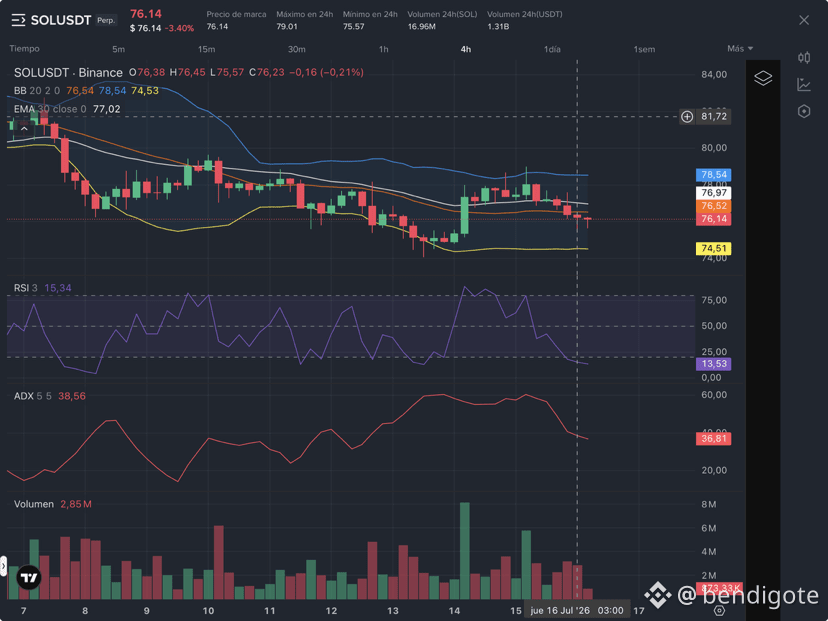
If anyone was expecting a miraculous bounce, the last 12 hours’ data in Sol Perpetuo says otherwise. Three consecutive red candles are not a coincidence—they’re a massive capital flight.
Technical read:
RSI drawdown: We’ve dropped from 30.38 to 15.34. An RSI at 15 is extreme oversold territory, but be careful: in markets with high bearish inertia, this is usually a sign of panic, not an immediate buying opportunity.
Bearish strength intact: Although ADX has fallen from 49.28 to 38.56, it still remains at very high trend-strength levels. This means the drop hasn’t been an accident; it’s been a move driven by conviction from sellers.
Price against the wall: We’re trading at 76.14, already breaking the close of the last candle (76.23) and dangerously approaching the lower band (74.53). The technical structure is completely broken.
Is it time to buy? Honestly, no. Trying to catch this falling knife is exposing yourself to unnecessary risk. When the market capitulates like this, it usually seeks a “selling climax,” where volume spikes even more before stabilizing.
The EMA (77.02) has become an unbreakable ceiling. As long as price doesn’t recover and consolidate above that level, any “green” you see on the chart is only a pause before continuing to fall. We’re in survival mode; if you’re in, keep a close eye on your stops, and if you’re out, watch from the sidelines. The market doesn’t give gifts—it gives lessons.
Are you still looking for buys, or are you waiting for lower levels to see if real demand shows up? I’m reading your thoughts.
Disclaimer: This is not financial advice. Current volatility is a high risk. DYOR.
{future}(SOLUSDT)
$SOL (Sol Perpetuo): The capitulation is real and support is wobbling 📉
If anyone was expecting a miraculous bounce, the last 12 hours’ data in Sol Perpetuo says otherwise. Three consecutive red candles are not a coincidence—they’re a massive capital flight.
Technical read:
RSI drawdown: We’ve dropped from 30.38 to 15.34. An RSI at 15 is extreme oversold territory, but be careful: in markets with high bearish inertia, this is usually a sign of panic, not an immediate buying opportunity.
Bearish strength intact: Although ADX has fallen from 49.28 to 38.56, it still remains at very high trend-strength levels. This means the drop hasn’t been an accident; it’s been a move driven by conviction from sellers.
Price against the wall: We’re trading at 76.14, already breaking the close of the last candle (76.23) and dangerously approaching the lower band (74.53). The technical structure is completely broken.
Is it time to buy? Honestly, no. Trying to catch this falling knife is exposing yourself to unnecessary risk. When the market capitulates like this, it usually seeks a “selling climax,” where volume spikes even more before stabilizing.
The EMA (77.02) has become an unbreakable ceiling. As long as price doesn’t recover and consolidate above that level, any “green” you see on the chart is only a pause before continuing to fall. We’re in survival mode; if you’re in, keep a close eye on your stops, and if you’re out, watch from the sidelines. The market doesn’t give gifts—it gives lessons.
Are you still looking for buys, or are you waiting for lower levels to see if real demand shows up? I’m reading your thoughts.
Disclaimer: This is not financial advice. Current volatility is a high risk. DYOR.
If anyone was expecting a miraculous bounce, the last 12 hours’ data in Sol Perpetuo says otherwise. Three consecutive red candles are not a coincidence—they’re a massive capital flight.
Technical read:
RSI drawdown: We’ve dropped from 30.38 to 15.34. An RSI at 15 is extreme oversold territory, but be careful: in markets with high bearish inertia, this is usually a sign of panic, not an immediate buying opportunity.
Bearish strength intact: Although ADX has fallen from 49.28 to 38.56, it still remains at very high trend-strength levels. This means the drop hasn’t been an accident; it’s been a move driven by conviction from sellers.
Price against the wall: We’re trading at 76.14, already breaking the close of the last candle (76.23) and dangerously approaching the lower band (74.53). The technical structure is completely broken.
Is it time to buy? Honestly, no. Trying to catch this falling knife is exposing yourself to unnecessary risk. When the market capitulates like this, it usually seeks a “selling climax,” where volume spikes even more before stabilizing.
The EMA (77.02) has become an unbreakable ceiling. As long as price doesn’t recover and consolidate above that level, any “green” you see on the chart is only a pause before continuing to fall. We’re in survival mode; if you’re in, keep a close eye on your stops, and if you’re out, watch from the sidelines. The market doesn’t give gifts—it gives lessons.
Are you still looking for buys, or are you waiting for lower levels to see if real demand shows up? I’m reading your thoughts.
Disclaimer: This is not financial advice. Current volatility is a high risk. DYOR.
1.3k
·
--
$SOL (Sol Perpetuo): Technical exhaustion is evident ⚠️
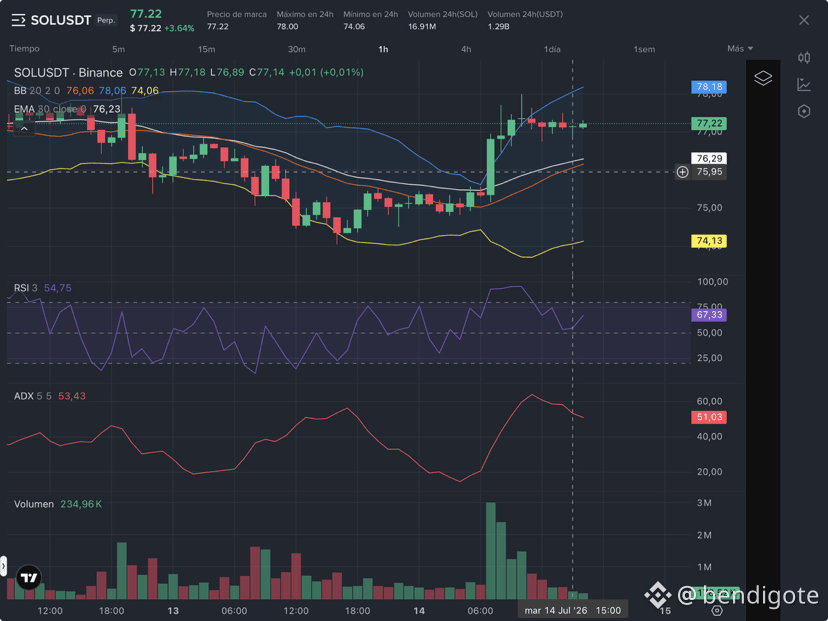
After analyzing the last 3 hours, the picture in Sol Perpetuo has shifted from euphoria to a dangerous stagnation zone. Even though the price is trying to hold around 77.22, the structure under the hood tells a different story.
Divergence and loss of momentum: We went from an RSI of 75.71 to stabilizing at 54.75. The free fall in the RSI, despite the price remaining relatively stable, is a sign that buying pressure has evaporated.
ADX as a thermometer: An ADX of 53.43 is still very high, which indicates that the uptrend still has significant momentum, but declining volume (from 373k to 234k) tells us there are no new buyers willing to pay higher prices anymore.
Resistance zone: We’re trading very close to the Bollinger Median (76.06) and with an EMA that has stopped gaining upward slope. The market is clearly in a phase of "distribution" or a technical pause.
Personally, I don’t see any explosive bullish continuation here. The price is "struggling" not to pull back, but without fresh volume, this usually ends in a corrective pullback toward 76.50 to test whether the previous buyers are still there.
If we don’t see an aggressive increase in volume in the next hour that breaks above the previous highs (77.50), the probability of a drop toward the EMA (76.23) is much higher than the chance of a new push toward $78.
Be careful about going long right now purely due to FOMO. The structure is overheated, and the risk-reward at this point—honestly—is poor.
Do you think this is a pause to keep rising, or the start of an imminent technical correction? I’m reading your thoughts.
Disclaimer: Educational analysis. Prudence is your best tool at these RSI levels.
{future}(SOLUSDT)
$SOL (Sol Perpetuo): Technical exhaustion is evident ⚠️
After analyzing the last 3 hours, the picture in Sol Perpetuo has shifted from euphoria to a dangerous stagnation zone. Even though the price is trying to hold around 77.22, the structure under the hood tells a different story.
Divergence and loss of momentum: We went from an RSI of 75.71 to stabilizing at 54.75. The free fall in the RSI, despite the price remaining relatively stable, is a sign that buying pressure has evaporated.
ADX as a thermometer: An ADX of 53.43 is still very high, which indicates that the uptrend still has significant momentum, but declining volume (from 373k to 234k) tells us there are no new buyers willing to pay higher prices anymore.
Resistance zone: We’re trading very close to the Bollinger Median (76.06) and with an EMA that has stopped gaining upward slope. The market is clearly in a phase of "distribution" or a technical pause.
Personally, I don’t see any explosive bullish continuation here. The price is "struggling" not to pull back, but without fresh volume, this usually ends in a corrective pullback toward 76.50 to test whether the previous buyers are still there.
If we don’t see an aggressive increase in volume in the next hour that breaks above the previous highs (77.50), the probability of a drop toward the EMA (76.23) is much higher than the chance of a new push toward $78.
Be careful about going long right now purely due to FOMO. The structure is overheated, and the risk-reward at this point—honestly—is poor.
Do you think this is a pause to keep rising, or the start of an imminent technical correction? I’m reading your thoughts.
Disclaimer: Educational analysis. Prudence is your best tool at these RSI levels.
After analyzing the last 3 hours, the picture in Sol Perpetuo has shifted from euphoria to a dangerous stagnation zone. Even though the price is trying to hold around 77.22, the structure under the hood tells a different story.
Divergence and loss of momentum: We went from an RSI of 75.71 to stabilizing at 54.75. The free fall in the RSI, despite the price remaining relatively stable, is a sign that buying pressure has evaporated.
ADX as a thermometer: An ADX of 53.43 is still very high, which indicates that the uptrend still has significant momentum, but declining volume (from 373k to 234k) tells us there are no new buyers willing to pay higher prices anymore.
Resistance zone: We’re trading very close to the Bollinger Median (76.06) and with an EMA that has stopped gaining upward slope. The market is clearly in a phase of "distribution" or a technical pause.
Personally, I don’t see any explosive bullish continuation here. The price is "struggling" not to pull back, but without fresh volume, this usually ends in a corrective pullback toward 76.50 to test whether the previous buyers are still there.
If we don’t see an aggressive increase in volume in the next hour that breaks above the previous highs (77.50), the probability of a drop toward the EMA (76.23) is much higher than the chance of a new push toward $78.
Be careful about going long right now purely due to FOMO. The structure is overheated, and the risk-reward at this point—honestly—is poor.
Do you think this is a pause to keep rising, or the start of an imminent technical correction? I’m reading your thoughts.
Disclaimer: Educational analysis. Prudence is your best tool at these RSI levels.
258
·
--
Whale war at $77: who has more to lose? 🐋
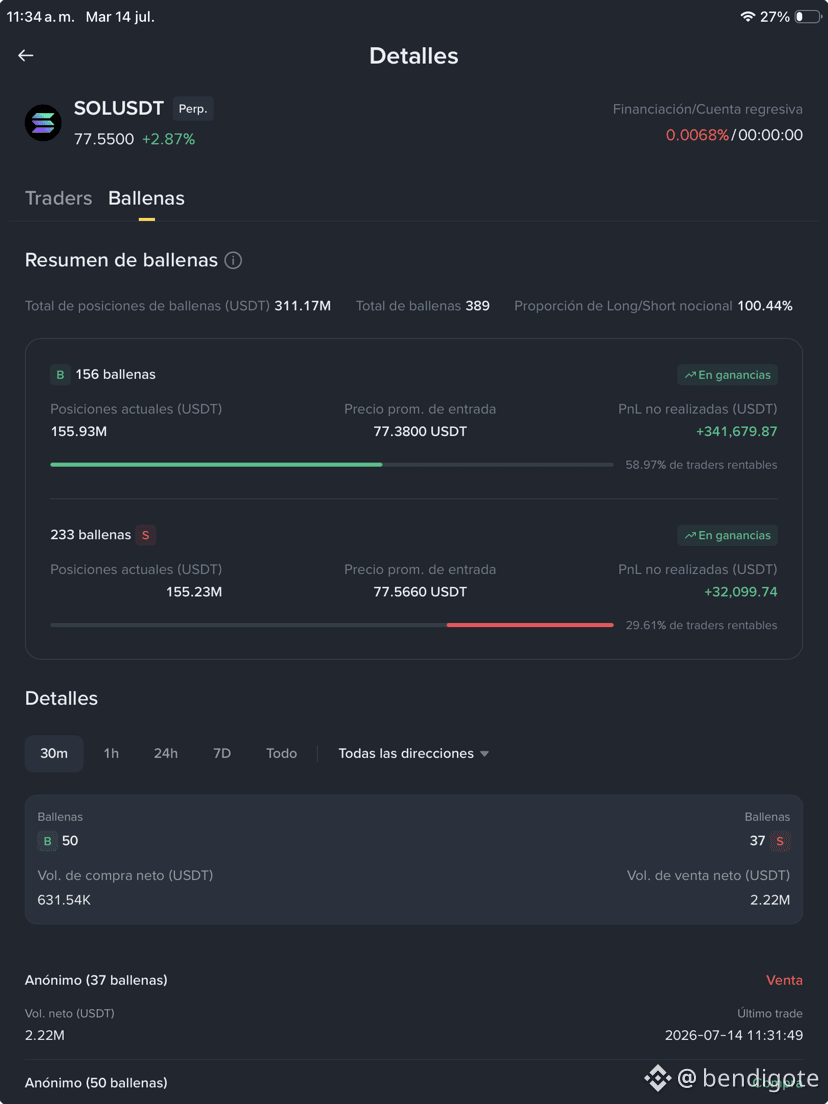
The latest updates to whale flow data at $SOL (Sol Perpetuo) have just been applied, and the position map leaves us with a high-tension scenario. With $311.17M USDT at stake, the battle to control the price is at a critical point.
What the data says:
Balance of power: The Long/Short ratio is practically even (100.44%), indicating we’re at a forced equilibrium.
The advantage of the Longs: There are 156 whales in long positions with an unrealized PnL of +$341k. Their average entry price is 77.38, which currently puts them "in the money."
Short pressure: We have 233 whales in short positions, but with a much tighter PnL (just +$32k). Their average price is 77.56. Here’s the key: many of these shorts are trading right at the edge of risk.
Short-position whales have a clear technical disadvantage: there are more of them (233 vs 156), but they’re far less profitable. This suggests there’s an accumulation of bearish positions that could be forced to close if the price holds steady or attempts a breakout to the upside. If the price rises a bit more, we could see a rather aggressive "Short Squeeze."
Possible outcomes:
1. Squeeze scenario: If the price breaks above $77.60 with volume, the 233 short whales will start liquidating positions to protect capital, accelerating the rise.
2. Capitulation scenario: If the price loses $77.30, it will be the long whales who have to decide whether to cut losses, which could send the price down quickly.
We’re at a level where whale profitability will determine the next move. Don’t trade on intuition—watch these entry levels (77.38 vs 77.56). That’s where the market direction will be decided over the next few hours.
Which side do you think will end up tipping the balance? I’m listening. 👇
{future}(SOLUSDT)
Whale war at $77: who has more to lose? 🐋
The latest updates to whale flow data at $SOL (Sol Perpetuo) have just been applied, and the position map leaves us with a high-tension scenario. With $311.17M USDT at stake, the battle to control the price is at a critical point.
What the data says:
Balance of power: The Long/Short ratio is practically even (100.44%), indicating we’re at a forced equilibrium.
The advantage of the Longs: There are 156 whales in long positions with an unrealized PnL of +$341k. Their average entry price is 77.38, which currently puts them "in the money."
Short pressure: We have 233 whales in short positions, but with a much tighter PnL (just +$32k). Their average price is 77.56. Here’s the key: many of these shorts are trading right at the edge of risk.
Short-position whales have a clear technical disadvantage: there are more of them (233 vs 156), but they’re far less profitable. This suggests there’s an accumulation of bearish positions that could be forced to close if the price holds steady or attempts a breakout to the upside. If the price rises a bit more, we could see a rather aggressive "Short Squeeze."
Possible outcomes:
1. Squeeze scenario: If the price breaks above $77.60 with volume, the 233 short whales will start liquidating positions to protect capital, accelerating the rise.
2. Capitulation scenario: If the price loses $77.30, it will be the long whales who have to decide whether to cut losses, which could send the price down quickly.
We’re at a level where whale profitability will determine the next move. Don’t trade on intuition—watch these entry levels (77.38 vs 77.56). That’s where the market direction will be decided over the next few hours.
Which side do you think will end up tipping the balance? I’m listening. 👇
The latest updates to whale flow data at $SOL (Sol Perpetuo) have just been applied, and the position map leaves us with a high-tension scenario. With $311.17M USDT at stake, the battle to control the price is at a critical point.
What the data says:
Balance of power: The Long/Short ratio is practically even (100.44%), indicating we’re at a forced equilibrium.
The advantage of the Longs: There are 156 whales in long positions with an unrealized PnL of +$341k. Their average entry price is 77.38, which currently puts them "in the money."
Short pressure: We have 233 whales in short positions, but with a much tighter PnL (just +$32k). Their average price is 77.56. Here’s the key: many of these shorts are trading right at the edge of risk.
Short-position whales have a clear technical disadvantage: there are more of them (233 vs 156), but they’re far less profitable. This suggests there’s an accumulation of bearish positions that could be forced to close if the price holds steady or attempts a breakout to the upside. If the price rises a bit more, we could see a rather aggressive "Short Squeeze."
Possible outcomes:
1. Squeeze scenario: If the price breaks above $77.60 with volume, the 233 short whales will start liquidating positions to protect capital, accelerating the rise.
2. Capitulation scenario: If the price loses $77.30, it will be the long whales who have to decide whether to cut losses, which could send the price down quickly.
We’re at a level where whale profitability will determine the next move. Don’t trade on intuition—watch these entry levels (77.38 vs 77.56). That’s where the market direction will be decided over the next few hours.
Which side do you think will end up tipping the balance? I’m listening. 👇
2
1
1.2k
·
--
$SOL (Sol Perpetuo): Rebound strongly or just a simple breath during the fall? 📉
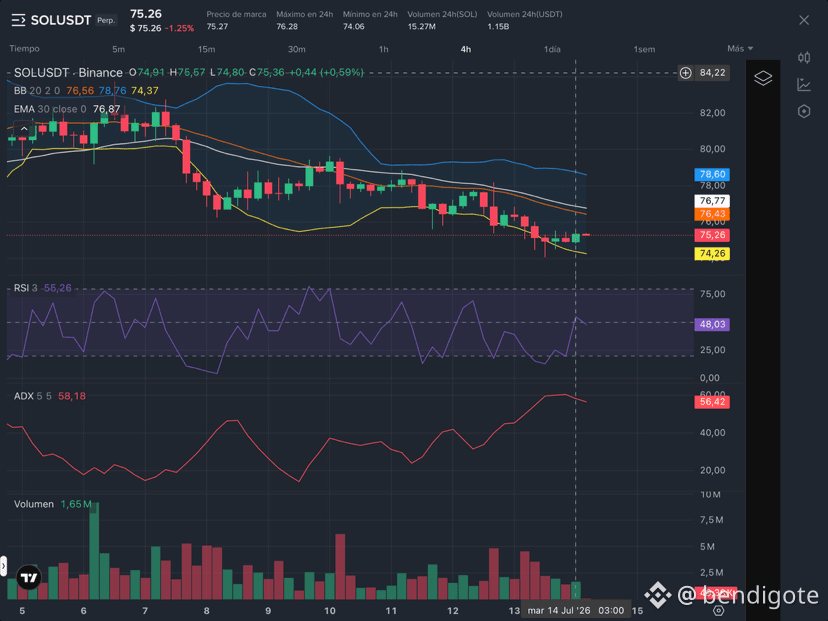
The last 12 hours (3 candles of 4H) have been a technical battlefield. We went from extreme oversold to an attempted recovery that, honestly, leaves more doubts than certainties.
Structure analysis:
Volatility vs. Trend: The ADX (58.18) is still extremely high. This confirms that, despite the last candle closing green, the strength of the dominant trend (bearish) is still far greater than any attempt at a rebound. We are not in a consolidated reversal.
The RSI jump: Seeing the RSI spike from 19.92 to 55.26 in a single 4H candle is unusual. More than a natural accumulation, this looks like a reactive response to critical support levels (close to the lower Bollinger Band at 74.37).
The EMA as a barrier: The current price at 75.26 remains well below the EMA (76.87). As long as price doesn’t manage to stabilize above this level, any bullish move should be treated as a simple "pullback" within a structure that is still bearish.
The current structure is a classic trap for those entering out of FOMO. Volume has been decent (1.65m on the last candle), but it’s not a buying surge that would justify a trend change.
I think the market is testing whether there is real liquidity before deciding if it will continue the bearish trend. Personally, I’m not looking for longs until the 76.87 EMA is conquered and tested as support. Buying now is trying to catch a rebound on a chart that still shows open wounds. Caution isn’t fear—it’s strategy.
Do you think $75.36 is the new floor, or are we just setting up the next bearish leg toward $74? I’m reading your thoughts.
Disclaimer: This is not financial advice. The market is extremely volatile—operate with risk management.
{future}(SOLUSDT)
$SOL (Sol Perpetuo): Rebound strongly or just a simple breath during the fall? 📉
The last 12 hours (3 candles of 4H) have been a technical battlefield. We went from extreme oversold to an attempted recovery that, honestly, leaves more doubts than certainties.
Structure analysis:
Volatility vs. Trend: The ADX (58.18) is still extremely high. This confirms that, despite the last candle closing green, the strength of the dominant trend (bearish) is still far greater than any attempt at a rebound. We are not in a consolidated reversal.
The RSI jump: Seeing the RSI spike from 19.92 to 55.26 in a single 4H candle is unusual. More than a natural accumulation, this looks like a reactive response to critical support levels (close to the lower Bollinger Band at 74.37).
The EMA as a barrier: The current price at 75.26 remains well below the EMA (76.87). As long as price doesn’t manage to stabilize above this level, any bullish move should be treated as a simple "pullback" within a structure that is still bearish.
The current structure is a classic trap for those entering out of FOMO. Volume has been decent (1.65m on the last candle), but it’s not a buying surge that would justify a trend change.
I think the market is testing whether there is real liquidity before deciding if it will continue the bearish trend. Personally, I’m not looking for longs until the 76.87 EMA is conquered and tested as support. Buying now is trying to catch a rebound on a chart that still shows open wounds. Caution isn’t fear—it’s strategy.
Do you think $75.36 is the new floor, or are we just setting up the next bearish leg toward $74? I’m reading your thoughts.
Disclaimer: This is not financial advice. The market is extremely volatile—operate with risk management.
The last 12 hours (3 candles of 4H) have been a technical battlefield. We went from extreme oversold to an attempted recovery that, honestly, leaves more doubts than certainties.
Structure analysis:
Volatility vs. Trend: The ADX (58.18) is still extremely high. This confirms that, despite the last candle closing green, the strength of the dominant trend (bearish) is still far greater than any attempt at a rebound. We are not in a consolidated reversal.
The RSI jump: Seeing the RSI spike from 19.92 to 55.26 in a single 4H candle is unusual. More than a natural accumulation, this looks like a reactive response to critical support levels (close to the lower Bollinger Band at 74.37).
The EMA as a barrier: The current price at 75.26 remains well below the EMA (76.87). As long as price doesn’t manage to stabilize above this level, any bullish move should be treated as a simple "pullback" within a structure that is still bearish.
The current structure is a classic trap for those entering out of FOMO. Volume has been decent (1.65m on the last candle), but it’s not a buying surge that would justify a trend change.
I think the market is testing whether there is real liquidity before deciding if it will continue the bearish trend. Personally, I’m not looking for longs until the 76.87 EMA is conquered and tested as support. Buying now is trying to catch a rebound on a chart that still shows open wounds. Caution isn’t fear—it’s strategy.
Do you think $75.36 is the new floor, or are we just setting up the next bearish leg toward $74? I’m reading your thoughts.
Disclaimer: This is not financial advice. The market is extremely volatile—operate with risk management.
848
·
--
SOL (Sol Perpetuo): The market paralysis in 78 📉
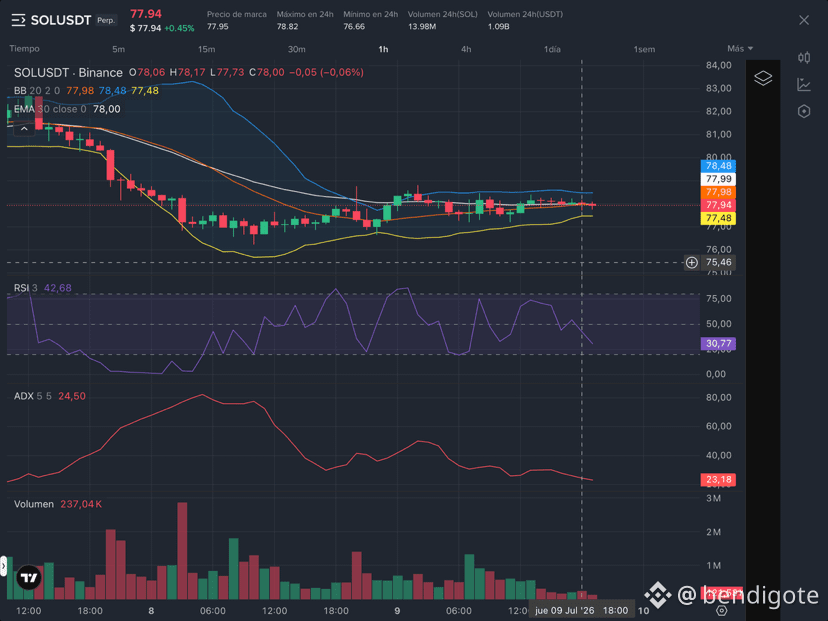
The last 3 hours in $SOL have, to be honest, been a waste of time for those of us looking for volatility. We’re dealing with a fully sideways market structure, where indecision is the main character.
The EMA magnet: The price has been stuck to the EMA (78.00) throughout the whole block. There’s no strength to break upward and no will to fall apart. It’s the classic behavior where the market doesn’t know what to do and keeps waiting for an external signal.
Bollinger range: The bands are narrowing significantly. The Median (77.98) acts like a central axis that the price crosses effortlessly, confirming there’s no real trend right now.
ADX falling: Seeing ADX drop from 27.97 to 24.50 is the definitive proof that the previous trend has died. We’re in a calm period before a storm, but we don’t know which direction it will break.
With the current price at 77.94, we’re just below the control zone. Volume (which barely rose to 237k in the last hour) isn’t enough to confirm a breakout. My reading is simple: until we see a solid close outside the 77.20 - 78.50 range, any entry is basically a coin toss.
Don’t be fooled by the small moves. The current structure is pure sideways action. I’d rather wait until volume spikes and confirms a clean exit. Trading in this sideways “noise” is where many end up getting wiped out by commissions and the spread. Patience—the market will eventually show its hand.
Does anyone see any hidden pattern, or are we all just waiting for this to move once and for all?
Disclaimer: Technical analysis, not financial advice. Keep risk management in mind.
{future}(SOLUSDT)
SOL (Sol Perpetuo): The market paralysis in 78 📉
The last 3 hours in $SOL have, to be honest, been a waste of time for those of us looking for volatility. We’re dealing with a fully sideways market structure, where indecision is the main character.
The EMA magnet: The price has been stuck to the EMA (78.00) throughout the whole block. There’s no strength to break upward and no will to fall apart. It’s the classic behavior where the market doesn’t know what to do and keeps waiting for an external signal.
Bollinger range: The bands are narrowing significantly. The Median (77.98) acts like a central axis that the price crosses effortlessly, confirming there’s no real trend right now.
ADX falling: Seeing ADX drop from 27.97 to 24.50 is the definitive proof that the previous trend has died. We’re in a calm period before a storm, but we don’t know which direction it will break.
With the current price at 77.94, we’re just below the control zone. Volume (which barely rose to 237k in the last hour) isn’t enough to confirm a breakout. My reading is simple: until we see a solid close outside the 77.20 - 78.50 range, any entry is basically a coin toss.
Don’t be fooled by the small moves. The current structure is pure sideways action. I’d rather wait until volume spikes and confirms a clean exit. Trading in this sideways “noise” is where many end up getting wiped out by commissions and the spread. Patience—the market will eventually show its hand.
Does anyone see any hidden pattern, or are we all just waiting for this to move once and for all?
Disclaimer: Technical analysis, not financial advice. Keep risk management in mind.
The last 3 hours in $SOL have, to be honest, been a waste of time for those of us looking for volatility. We’re dealing with a fully sideways market structure, where indecision is the main character.
The EMA magnet: The price has been stuck to the EMA (78.00) throughout the whole block. There’s no strength to break upward and no will to fall apart. It’s the classic behavior where the market doesn’t know what to do and keeps waiting for an external signal.
Bollinger range: The bands are narrowing significantly. The Median (77.98) acts like a central axis that the price crosses effortlessly, confirming there’s no real trend right now.
ADX falling: Seeing ADX drop from 27.97 to 24.50 is the definitive proof that the previous trend has died. We’re in a calm period before a storm, but we don’t know which direction it will break.
With the current price at 77.94, we’re just below the control zone. Volume (which barely rose to 237k in the last hour) isn’t enough to confirm a breakout. My reading is simple: until we see a solid close outside the 77.20 - 78.50 range, any entry is basically a coin toss.
Don’t be fooled by the small moves. The current structure is pure sideways action. I’d rather wait until volume spikes and confirms a clean exit. Trading in this sideways “noise” is where many end up getting wiped out by commissions and the spread. Patience—the market will eventually show its hand.
Does anyone see any hidden pattern, or are we all just waiting for this to move once and for all?
Disclaimer: Technical analysis, not financial advice. Keep risk management in mind.
1
209
·
--
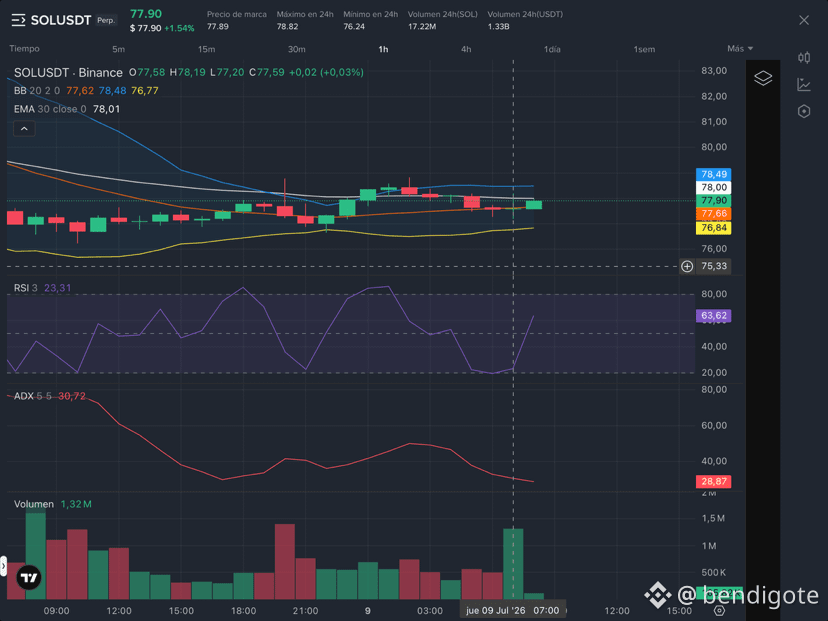
$SOL (Sol Perpetuo): Looking for support or a bull trap? 🔍
After a three-hour session where price tried to break through the 77.20 zone, the technical structure shows mixed signals that require extreme caution.
Structure analysis:
Trend exhaustion: We moved from an RSI of 22.47 to 23.31. Even though we’re still in the technical oversold zone, the sell-off has lost momentum.
The ADX, which was at 37.97, has fallen to 30.72, confirming that bearish strength is dissipating.
“Rescue” volume: The most interesting part is the last candle. With volume at 1.32m (more than double compared to the previous hours), the market absorbed sell pressure.
This doesn’t guarantee a trend change, but it does show that in the 77.20 area there’s a base of buyers that isn’t willing to give up more.
The EMA as resistance: Price is trading at 77.90, just below the EMA (78.01). As long as we don’t consolidate above this level, the structure remains technically bearish in the short term.
I wouldn’t trust this “green bounce.” A falling ADX suggests we’re entering a consolidation or sideways period. It’s likely we’ll see a retest in the 78.10–78.20 area; if it fails to break that level with volume, sell pressure could return.
We’re looking at a difficult accumulation/distribution zone. Don’t try to guess the bottom. I’d rather wait for price to confirm a break above the 78.01 EMA before considering any long entries. Buying just because “it’s cheap” when the chart is still fighting its own moving average is a rookie mistake.
What do you think? Is the last hour’s volume a real reversal signal or just a pause before continuing to fall? I’m reading your replies. 👇
Disclaimer: Technical analysis, not financial advice. Volatility rules.
{future}(SOLUSDT)
$SOL (Sol Perpetuo): Looking for support or a bull trap? 🔍
After a three-hour session where price tried to break through the 77.20 zone, the technical structure shows mixed signals that require extreme caution.
Structure analysis:
Trend exhaustion: We moved from an RSI of 22.47 to 23.31. Even though we’re still in the technical oversold zone, the sell-off has lost momentum.
The ADX, which was at 37.97, has fallen to 30.72, confirming that bearish strength is dissipating.
“Rescue” volume: The most interesting part is the last candle. With volume at 1.32m (more than double compared to the previous hours), the market absorbed sell pressure.
This doesn’t guarantee a trend change, but it does show that in the 77.20 area there’s a base of buyers that isn’t willing to give up more.
The EMA as resistance: Price is trading at 77.90, just below the EMA (78.01). As long as we don’t consolidate above this level, the structure remains technically bearish in the short term.
I wouldn’t trust this “green bounce.” A falling ADX suggests we’re entering a consolidation or sideways period. It’s likely we’ll see a retest in the 78.10–78.20 area; if it fails to break that level with volume, sell pressure could return.
We’re looking at a difficult accumulation/distribution zone. Don’t try to guess the bottom. I’d rather wait for price to confirm a break above the 78.01 EMA before considering any long entries. Buying just because “it’s cheap” when the chart is still fighting its own moving average is a rookie mistake.
What do you think? Is the last hour’s volume a real reversal signal or just a pause before continuing to fall? I’m reading your replies. 👇
Disclaimer: Technical analysis, not financial advice. Volatility rules.
After a three-hour session where price tried to break through the 77.20 zone, the technical structure shows mixed signals that require extreme caution.
Structure analysis:
Trend exhaustion: We moved from an RSI of 22.47 to 23.31. Even though we’re still in the technical oversold zone, the sell-off has lost momentum.
The ADX, which was at 37.97, has fallen to 30.72, confirming that bearish strength is dissipating.
“Rescue” volume: The most interesting part is the last candle. With volume at 1.32m (more than double compared to the previous hours), the market absorbed sell pressure.
This doesn’t guarantee a trend change, but it does show that in the 77.20 area there’s a base of buyers that isn’t willing to give up more.
The EMA as resistance: Price is trading at 77.90, just below the EMA (78.01). As long as we don’t consolidate above this level, the structure remains technically bearish in the short term.
I wouldn’t trust this “green bounce.” A falling ADX suggests we’re entering a consolidation or sideways period. It’s likely we’ll see a retest in the 78.10–78.20 area; if it fails to break that level with volume, sell pressure could return.
We’re looking at a difficult accumulation/distribution zone. Don’t try to guess the bottom. I’d rather wait for price to confirm a break above the 78.01 EMA before considering any long entries. Buying just because “it’s cheap” when the chart is still fighting its own moving average is a rookie mistake.
What do you think? Is the last hour’s volume a real reversal signal or just a pause before continuing to fall? I’m reading your replies. 👇
Disclaimer: Technical analysis, not financial advice. Volatility rules.
207
·
--
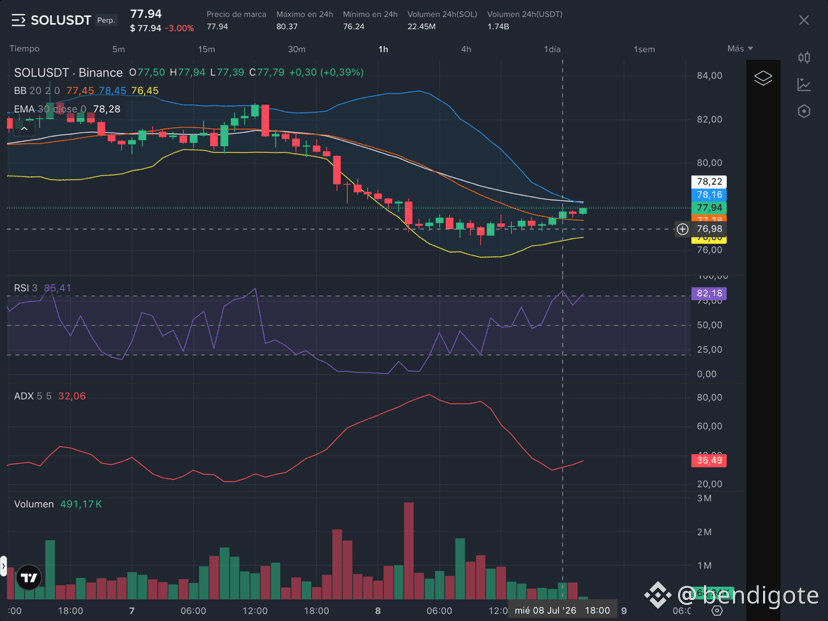
$SOL (Sol Perpetuo): Real impulse or imminent exhaustion? ⚡
After reviewing the last 3 hours of the market, the structure has changed aggressively. We went from consolidation to a clear bullish impulse, but the data forces me to be cautious.
Technical read:
Acceleration: The candles have closed consecutively higher (77.20 -> 77.49 -> 77.79), breaking above the Bollinger Median (77.45). The price is pushing against the upper band, indicating strong buying pressure.
The RSI alert: Here is the problem. We went from 52.23 to 85.41 in just three hours. An RSI at 85 is extreme overbought territory. Historically, this usually precedes a quick profit-taking move—or at the very least, a technical correction.
Volume: The volume increase in the last hour (491.17k) confirms that there is buy interest, but entering here when the asset is touching the band top is, at the very least, risky.
Critical outlook:
We’re at 77.94 and the structure shows that the “buyer bellows” is stretching too far. The ADX (32.06) indicates the trend is bullish, but it isn’t an uncontrollable parabolic trend—so it’s likely we’ll see a retest of the 77.50 area before attempting any further highs.
I don’t trust FOMO entries when the RSI is brushing 85. The structure is bullish, yes, but we’re “overheated.” I’d rather wait for the price to cool down and validate the median support before looking for positions. This isn’t about guessing the top—it’s about not buying at the peak of enthusiasm.
Do you think this has enough strength to break $78, or are we looking at an imminent correction? I’m reading your thoughts.
Disclaimer: This is not financial advice. Trade with risk management.
{future}(SOLUSDT)
$SOL (Sol Perpetuo): Real impulse or imminent exhaustion? ⚡
After reviewing the last 3 hours of the market, the structure has changed aggressively. We went from consolidation to a clear bullish impulse, but the data forces me to be cautious.
Technical read:
Acceleration: The candles have closed consecutively higher (77.20 -> 77.49 -> 77.79), breaking above the Bollinger Median (77.45). The price is pushing against the upper band, indicating strong buying pressure.
The RSI alert: Here is the problem. We went from 52.23 to 85.41 in just three hours. An RSI at 85 is extreme overbought territory. Historically, this usually precedes a quick profit-taking move—or at the very least, a technical correction.
Volume: The volume increase in the last hour (491.17k) confirms that there is buy interest, but entering here when the asset is touching the band top is, at the very least, risky.
Critical outlook:
We’re at 77.94 and the structure shows that the “buyer bellows” is stretching too far. The ADX (32.06) indicates the trend is bullish, but it isn’t an uncontrollable parabolic trend—so it’s likely we’ll see a retest of the 77.50 area before attempting any further highs.
I don’t trust FOMO entries when the RSI is brushing 85. The structure is bullish, yes, but we’re “overheated.” I’d rather wait for the price to cool down and validate the median support before looking for positions. This isn’t about guessing the top—it’s about not buying at the peak of enthusiasm.
Do you think this has enough strength to break $78, or are we looking at an imminent correction? I’m reading your thoughts.
Disclaimer: This is not financial advice. Trade with risk management.
After reviewing the last 3 hours of the market, the structure has changed aggressively. We went from consolidation to a clear bullish impulse, but the data forces me to be cautious.
Technical read:
Acceleration: The candles have closed consecutively higher (77.20 -> 77.49 -> 77.79), breaking above the Bollinger Median (77.45). The price is pushing against the upper band, indicating strong buying pressure.
The RSI alert: Here is the problem. We went from 52.23 to 85.41 in just three hours. An RSI at 85 is extreme overbought territory. Historically, this usually precedes a quick profit-taking move—or at the very least, a technical correction.
Volume: The volume increase in the last hour (491.17k) confirms that there is buy interest, but entering here when the asset is touching the band top is, at the very least, risky.
Critical outlook:
We’re at 77.94 and the structure shows that the “buyer bellows” is stretching too far. The ADX (32.06) indicates the trend is bullish, but it isn’t an uncontrollable parabolic trend—so it’s likely we’ll see a retest of the 77.50 area before attempting any further highs.
I don’t trust FOMO entries when the RSI is brushing 85. The structure is bullish, yes, but we’re “overheated.” I’d rather wait for the price to cool down and validate the median support before looking for positions. This isn’t about guessing the top—it’s about not buying at the peak of enthusiasm.
Do you think this has enough strength to break $78, or are we looking at an imminent correction? I’m reading your thoughts.
Disclaimer: This is not financial advice. Trade with risk management.
2
1
421
·
--
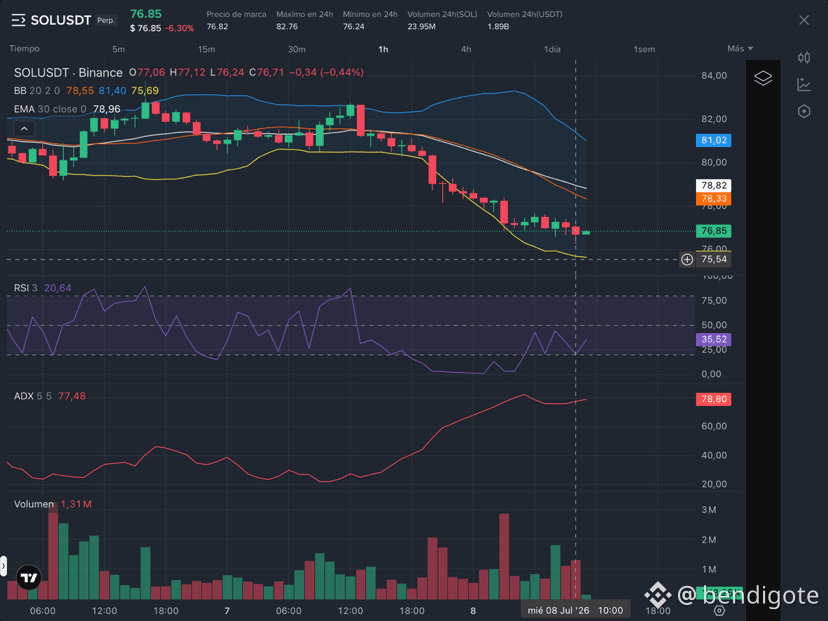
Sol Perpetuo ($SOL ): The technical rebound trap ⚠️
If we analyze the behavior of the last 3 hours on Sol Perpetuo, the picture is misleading. We’ve seen an attempted recovery that quickly deflated, leaving a structure that, honestly, gives me no confidence to go long.
Structure analysis:
Rejection of the Median: Over these three hours, the price has repeatedly tried to approach the Bollinger Median, but the market has rejected the move with increasing force. The fact that the close has progressively dropped from 77.27 to 76.71 confirms that selling pressure is setting the pace.
The free fall of the RSI: It plunges from 44.34 to 20.64 in just three hours—this is a clear sign of capitulation. This isn’t healthy consolidation; it’s accelerated capital outflow.
ADX at 77.48: An ADX above 75 is not normal. It indicates that the current downtrend has extreme strength. At these levels, trying to “buy the drop,” in my opinion, is buying a ticket toward an even bigger loss.
Outlook and critical view:
The market is currently at 76.85, trying to hold above the recent low. However, with an ADX that’s so elevated and an RSI that’s barely starting to edge into extreme oversold territory, the risk of further downside extension is still very much present.
Personally, I don’t see reasons to be optimistic. The EMA at 78.96 is acting like a containment wall that buyers aren’t even close to challenging. If the immediate support around 76.24 (the low of the last hour) breaks, there’s nothing stopping a move toward lower levels.
My read: We’re in a process of cleaning out “weak” positions. Until I see a clear divergence in the RSI and a break of that EMA on 1H with real volume, I’ll stay on the sidelines. The market has no rush to go up, and you shouldn’t either when entering.
Don’t trade based on only this—right now the market is very erratic.
{future}(SOLUSDT)
Sol Perpetuo ($SOL ): The technical rebound trap ⚠️
If we analyze the behavior of the last 3 hours on Sol Perpetuo, the picture is misleading. We’ve seen an attempted recovery that quickly deflated, leaving a structure that, honestly, gives me no confidence to go long.
Structure analysis:
Rejection of the Median: Over these three hours, the price has repeatedly tried to approach the Bollinger Median, but the market has rejected the move with increasing force. The fact that the close has progressively dropped from 77.27 to 76.71 confirms that selling pressure is setting the pace.
The free fall of the RSI: It plunges from 44.34 to 20.64 in just three hours—this is a clear sign of capitulation. This isn’t healthy consolidation; it’s accelerated capital outflow.
ADX at 77.48: An ADX above 75 is not normal. It indicates that the current downtrend has extreme strength. At these levels, trying to “buy the drop,” in my opinion, is buying a ticket toward an even bigger loss.
Outlook and critical view:
The market is currently at 76.85, trying to hold above the recent low. However, with an ADX that’s so elevated and an RSI that’s barely starting to edge into extreme oversold territory, the risk of further downside extension is still very much present.
Personally, I don’t see reasons to be optimistic. The EMA at 78.96 is acting like a containment wall that buyers aren’t even close to challenging. If the immediate support around 76.24 (the low of the last hour) breaks, there’s nothing stopping a move toward lower levels.
My read: We’re in a process of cleaning out “weak” positions. Until I see a clear divergence in the RSI and a break of that EMA on 1H with real volume, I’ll stay on the sidelines. The market has no rush to go up, and you shouldn’t either when entering.
Don’t trade based on only this—right now the market is very erratic.
If we analyze the behavior of the last 3 hours on Sol Perpetuo, the picture is misleading. We’ve seen an attempted recovery that quickly deflated, leaving a structure that, honestly, gives me no confidence to go long.
Structure analysis:
Rejection of the Median: Over these three hours, the price has repeatedly tried to approach the Bollinger Median, but the market has rejected the move with increasing force. The fact that the close has progressively dropped from 77.27 to 76.71 confirms that selling pressure is setting the pace.
The free fall of the RSI: It plunges from 44.34 to 20.64 in just three hours—this is a clear sign of capitulation. This isn’t healthy consolidation; it’s accelerated capital outflow.
ADX at 77.48: An ADX above 75 is not normal. It indicates that the current downtrend has extreme strength. At these levels, trying to “buy the drop,” in my opinion, is buying a ticket toward an even bigger loss.
Outlook and critical view:
The market is currently at 76.85, trying to hold above the recent low. However, with an ADX that’s so elevated and an RSI that’s barely starting to edge into extreme oversold territory, the risk of further downside extension is still very much present.
Personally, I don’t see reasons to be optimistic. The EMA at 78.96 is acting like a containment wall that buyers aren’t even close to challenging. If the immediate support around 76.24 (the low of the last hour) breaks, there’s nothing stopping a move toward lower levels.
My read: We’re in a process of cleaning out “weak” positions. Until I see a clear divergence in the RSI and a break of that EMA on 1H with real volume, I’ll stay on the sidelines. The market has no rush to go up, and you shouldn’t either when entering.
Don’t trade based on only this—right now the market is very erratic.
3
1.4k
·
--
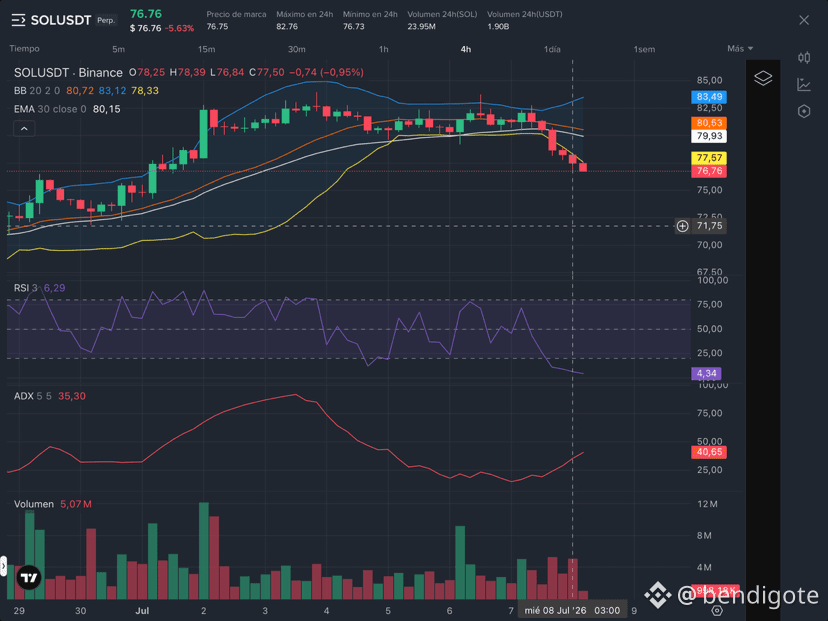
Sol Perpetuo ($SOL ) at the limit: extreme oversold or technical capitulation? 📉
The technical structure of Sol Perpetuo on 4H is, to say the least, concerning. After the close of the last candle at 77.50, the asset has broken key levels, leaving data that cannot be ignored.
Technical read without filters:
RSI at 6.29: This level is alarming. An RSI below 10 indicates absolute seller exhaustion and a historically extreme technical oversold condition. However, in highly volatile markets, an RSI this low can also be a sign of a “capitulation,” where panic dominates volume (5.07m).
Break of structure: The price has clearly closed below the EMA (80.15) and the Bollinger Median (80.72). Since it’s currently trading at 76.76, we are operating below the Lower Band (78.33). This confirms that the downtrend has total control.
ADX at 35.30: Even though the RSI screams oversold, the ADX at 35.30 tells us the bearish trend still has strength. This isn’t a simple pullback—we’re seeing a move with negative technical momentum.
Outlook and critical view:
Many would expect an automatic bounce from the RSI, but beware: oversold indicators can stay flat for a long time while price keeps falling. My stance is one of maximum caution. The structure has collapsed; seeing price hovering around 76.76 after breaking the lower band is a sign that the market is searching for a bottom that has not appeared yet.
What do I expect?
Personally, I wouldn’t try to catch this falling knife. We need to see a reversal candle with confirmed volume and, above all, a recovery of the lower band (78.33) as support before even considering that the bleed has stopped. If price doesn’t reclaim that level quickly, the risk of extending the losses is real.
What do you think? Is this the technical “bottom” by RSI, or are we seeing the start of a deeper capitulation? I’m reading your thoughts, but trade carefully because the market is giving few signs of bullish life.
{future}(SOLUSDT)
Sol Perpetuo ($SOL ) at the limit: extreme oversold or technical capitulation? 📉
The technical structure of Sol Perpetuo on 4H is, to say the least, concerning. After the close of the last candle at 77.50, the asset has broken key levels, leaving data that cannot be ignored.
Technical read without filters:
RSI at 6.29: This level is alarming. An RSI below 10 indicates absolute seller exhaustion and a historically extreme technical oversold condition. However, in highly volatile markets, an RSI this low can also be a sign of a “capitulation,” where panic dominates volume (5.07m).
Break of structure: The price has clearly closed below the EMA (80.15) and the Bollinger Median (80.72). Since it’s currently trading at 76.76, we are operating below the Lower Band (78.33). This confirms that the downtrend has total control.
ADX at 35.30: Even though the RSI screams oversold, the ADX at 35.30 tells us the bearish trend still has strength. This isn’t a simple pullback—we’re seeing a move with negative technical momentum.
Outlook and critical view:
Many would expect an automatic bounce from the RSI, but beware: oversold indicators can stay flat for a long time while price keeps falling. My stance is one of maximum caution. The structure has collapsed; seeing price hovering around 76.76 after breaking the lower band is a sign that the market is searching for a bottom that has not appeared yet.
What do I expect?
Personally, I wouldn’t try to catch this falling knife. We need to see a reversal candle with confirmed volume and, above all, a recovery of the lower band (78.33) as support before even considering that the bleed has stopped. If price doesn’t reclaim that level quickly, the risk of extending the losses is real.
What do you think? Is this the technical “bottom” by RSI, or are we seeing the start of a deeper capitulation? I’m reading your thoughts, but trade carefully because the market is giving few signs of bullish life.
The technical structure of Sol Perpetuo on 4H is, to say the least, concerning. After the close of the last candle at 77.50, the asset has broken key levels, leaving data that cannot be ignored.
Technical read without filters:
RSI at 6.29: This level is alarming. An RSI below 10 indicates absolute seller exhaustion and a historically extreme technical oversold condition. However, in highly volatile markets, an RSI this low can also be a sign of a “capitulation,” where panic dominates volume (5.07m).
Break of structure: The price has clearly closed below the EMA (80.15) and the Bollinger Median (80.72). Since it’s currently trading at 76.76, we are operating below the Lower Band (78.33). This confirms that the downtrend has total control.
ADX at 35.30: Even though the RSI screams oversold, the ADX at 35.30 tells us the bearish trend still has strength. This isn’t a simple pullback—we’re seeing a move with negative technical momentum.
Outlook and critical view:
Many would expect an automatic bounce from the RSI, but beware: oversold indicators can stay flat for a long time while price keeps falling. My stance is one of maximum caution. The structure has collapsed; seeing price hovering around 76.76 after breaking the lower band is a sign that the market is searching for a bottom that has not appeared yet.
What do I expect?
Personally, I wouldn’t try to catch this falling knife. We need to see a reversal candle with confirmed volume and, above all, a recovery of the lower band (78.33) as support before even considering that the bleed has stopped. If price doesn’t reclaim that level quickly, the risk of extending the losses is real.
What do you think? Is this the technical “bottom” by RSI, or are we seeing the start of a deeper capitulation? I’m reading your thoughts, but trade carefully because the market is giving few signs of bullish life.
256
·
--
Newton Protocol and the utopia of AI agents: Reality or marketing? 🧐
I’ve been analyzing the progress of Newton Protocol for days, and although the narrative of an onchain policy infrastructure for AI agents is compelling, we need to separate the noise from the technical reality.
My critical take:
The value proposition is clear: prevent autonomous agents from carrying out uncontrolled operations through a layer of prior authorization. On paper, it’s the “seatbelt” that DeFi needs so institutional capital feels comfortable. However, I have doubts about the implementation:
1. The bottleneck dilemma: Can the protocol handle complex policies without adding latency that kills the user experience? Verifiable security usually comes at the cost of speed, and in the world of AI agents, every millisecond counts.
2. Centralization risk: Beyond the marketing, the real test will be whether these policy validators can maintain a truly decentralized framework—or whether we’ll end up depending on a handful of decision-making nodes.
3. Adoption vs. Hype: It’s easy to promise security; the hard part is getting developers to integrate this layer at scale. If Newton’s SDK isn’t flawless, it will remain another interesting technical project with no real traction.
Don’t misunderstand me—I think the direction is right. Forensic security is a thing of the past; we need preventive authorization. But is Newton the ultimate solution, or just the first version of something that still needs to prove it can scale?
I’d rather be skeptical and wait to see how they handle network stress under real conditions before calling it a win. What do you think? Do you see Newton as a necessary standard, or do you believe the technical complexity will work against it? I’m reading your thoughts below. 👇
Disclaimer: Educational content and personal analysis. This is not financial advice. DYOR.
@NewtonProtocol $NEWT #Newt
Newton Protocol and the utopia of AI agents: Reality or marketing? 🧐
I’ve been analyzing the progress of Newton Protocol for days, and although the narrative of an onchain policy infrastructure for AI agents is compelling, we need to separate the noise from the technical reality.
My critical take:
The value proposition is clear: prevent autonomous agents from carrying out uncontrolled operations through a layer of prior authorization. On paper, it’s the “seatbelt” that DeFi needs so institutional capital feels comfortable. However, I have doubts about the implementation:
1. The bottleneck dilemma: Can the protocol handle complex policies without adding latency that kills the user experience? Verifiable security usually comes at the cost of speed, and in the world of AI agents, every millisecond counts.
2. Centralization risk: Beyond the marketing, the real test will be whether these policy validators can maintain a truly decentralized framework—or whether we’ll end up depending on a handful of decision-making nodes.
3. Adoption vs. Hype: It’s easy to promise security; the hard part is getting developers to integrate this layer at scale. If Newton’s SDK isn’t flawless, it will remain another interesting technical project with no real traction.
Don’t misunderstand me—I think the direction is right. Forensic security is a thing of the past; we need preventive authorization. But is Newton the ultimate solution, or just the first version of something that still needs to prove it can scale?
I’d rather be skeptical and wait to see how they handle network stress under real conditions before calling it a win. What do you think? Do you see Newton as a necessary standard, or do you believe the technical complexity will work against it? I’m reading your thoughts below. 👇
Disclaimer: Educational content and personal analysis. This is not financial advice. DYOR.
@NewtonProtocol $NEWT #Newt
I’ve been analyzing the progress of Newton Protocol for days, and although the narrative of an onchain policy infrastructure for AI agents is compelling, we need to separate the noise from the technical reality.
My critical take:
The value proposition is clear: prevent autonomous agents from carrying out uncontrolled operations through a layer of prior authorization. On paper, it’s the “seatbelt” that DeFi needs so institutional capital feels comfortable. However, I have doubts about the implementation:
1. The bottleneck dilemma: Can the protocol handle complex policies without adding latency that kills the user experience? Verifiable security usually comes at the cost of speed, and in the world of AI agents, every millisecond counts.
2. Centralization risk: Beyond the marketing, the real test will be whether these policy validators can maintain a truly decentralized framework—or whether we’ll end up depending on a handful of decision-making nodes.
3. Adoption vs. Hype: It’s easy to promise security; the hard part is getting developers to integrate this layer at scale. If Newton’s SDK isn’t flawless, it will remain another interesting technical project with no real traction.
Don’t misunderstand me—I think the direction is right. Forensic security is a thing of the past; we need preventive authorization. But is Newton the ultimate solution, or just the first version of something that still needs to prove it can scale?
I’d rather be skeptical and wait to see how they handle network stress under real conditions before calling it a win. What do you think? Do you see Newton as a necessary standard, or do you believe the technical complexity will work against it? I’m reading your thoughts below. 👇
Disclaimer: Educational content and personal analysis. This is not financial advice. DYOR.
@NewtonProtocol $NEWT #Newt
68
·
--
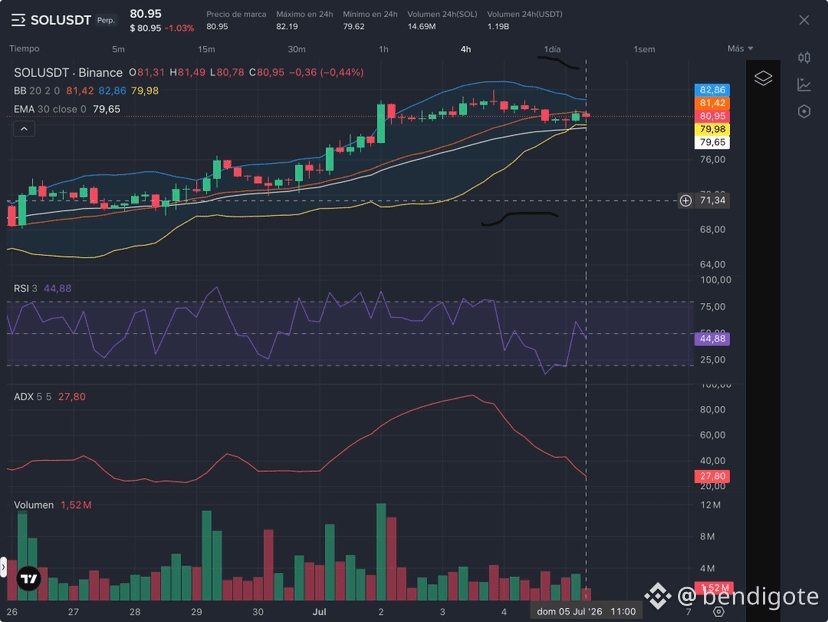
Sol Perpetuo ($SOL ): Loss of the middle band or simple consolidation? 📉
The close of the last candle at 80.95 leaves an interesting technical picture. Price has confirmed a loss of the Bollinger Middle Band (81.42), indicating that the bullish momentum in the short term has cooled.
Technical points to highlight:
Break of the Middle Band: Closing below 81.42 is a sign of technical weakness. The middle band often acts like a magnet for price, and when it’s broken to the downside, the market is testing whether there’s enough liquidity at lower levels.
Key support: It’s important to note that, despite the red candle, we’re still holding above the Lower Band (79.98). This keeps us from technically entering an area of extreme oversold conditions, maintaining the structure within the Bollinger range for now.
Momentum (RSI/ADX): With an RSI at 44.88, the market is trading in neutral territory. What stands out most to me is the ADX at 27.80; after having seen very strong levels, this drop suggests the market is moving into a phase of sideways trading.
We’re not in free fall, but the fact that the bands’ middle band was lost is a "warning" that buyers have lost control of the short term. Personally, I’m going to watch to see whether we can quickly reclaim 81.42 or whether price seeks more solid support closer to the lower band.
What do you think? Is it time to wait for a bounce, or are we seeing the start of a longer sideways range?
Disclaimer: My technical analysis is for educational purposes only. Not investment advice. DYOR.
Sol Perpetuo ($SOL ): Loss of the middle band or simple consolidation? 📉
The close of the last candle at 80.95 leaves an interesting technical picture. Price has confirmed a loss of the Bollinger Middle Band (81.42), indicating that the bullish momentum in the short term has cooled.
Technical points to highlight:
Break of the Middle Band: Closing below 81.42 is a sign of technical weakness. The middle band often acts like a magnet for price, and when it’s broken to the downside, the market is testing whether there’s enough liquidity at lower levels.
Key support: It’s important to note that, despite the red candle, we’re still holding above the Lower Band (79.98). This keeps us from technically entering an area of extreme oversold conditions, maintaining the structure within the Bollinger range for now.
Momentum (RSI/ADX): With an RSI at 44.88, the market is trading in neutral territory. What stands out most to me is the ADX at 27.80; after having seen very strong levels, this drop suggests the market is moving into a phase of sideways trading.
We’re not in free fall, but the fact that the bands’ middle band was lost is a "warning" that buyers have lost control of the short term. Personally, I’m going to watch to see whether we can quickly reclaim 81.42 or whether price seeks more solid support closer to the lower band.
What do you think? Is it time to wait for a bounce, or are we seeing the start of a longer sideways range?
Disclaimer: My technical analysis is for educational purposes only. Not investment advice. DYOR.
The close of the last candle at 80.95 leaves an interesting technical picture. Price has confirmed a loss of the Bollinger Middle Band (81.42), indicating that the bullish momentum in the short term has cooled.
Technical points to highlight:
Break of the Middle Band: Closing below 81.42 is a sign of technical weakness. The middle band often acts like a magnet for price, and when it’s broken to the downside, the market is testing whether there’s enough liquidity at lower levels.
Key support: It’s important to note that, despite the red candle, we’re still holding above the Lower Band (79.98). This keeps us from technically entering an area of extreme oversold conditions, maintaining the structure within the Bollinger range for now.
Momentum (RSI/ADX): With an RSI at 44.88, the market is trading in neutral territory. What stands out most to me is the ADX at 27.80; after having seen very strong levels, this drop suggests the market is moving into a phase of sideways trading.
We’re not in free fall, but the fact that the bands’ middle band was lost is a "warning" that buyers have lost control of the short term. Personally, I’m going to watch to see whether we can quickly reclaim 81.42 or whether price seeks more solid support closer to the lower band.
What do you think? Is it time to wait for a bounce, or are we seeing the start of a longer sideways range?
Disclaimer: My technical analysis is for educational purposes only. Not investment advice. DYOR.
164
·
--

Article
Why transparency is the real bottleneck of financial AIIn the current debate about integrating autonomous agents into the crypto ecosystem, there is a near-religious fascination with execution speed. We are told that the future belongs to those agents capable of operating with minimal latency, reacting to fluctuations in Bitcoin or Solana in milliseconds. However, in this race for operational efficiency, we are overlooking a structural problem that will determine whether <c-9/> and similar technologies become the foundational layer of tomorrow’s finance—or whether they end up as a sophisticated but marginal technical experiment.
Why transparency is the real bottleneck of financial AI
In the current debate about integrating autonomous agents into the crypto ecosystem, there is a near-religious fascination with execution speed. We are told that the future belongs to those agents capable of operating with minimal latency, reacting to fluctuations in Bitcoin or Solana in milliseconds. However, in this race for operational efficiency, we are overlooking a structural problem that will determine whether <c-9/> and similar technologies become the foundational layer of tomorrow’s finance—or whether they end up as a sophisticated but marginal technical experiment.
2
103
·
--
I’ve been analyzing how the governance of @NewtonProtocol enables real-time adjustments, and I wonder whether the “flexibility” it offers is, in reality, a blind spot for operators.
The idea is often sold that dynamic rule configuration is a competitive advantage. However, there’s a fine line between operational agility and the erosion of baseline security. If we compare the robustness of networks like #BTC , where immutability is the rule, with the malleability of policies in DeFi environments, an uncomfortable question arises:
At what point does the protocol stop being a “default-deny” policy and instead become simply a pass filter for any transaction the operator considers “profitable”?
The security of a system based on Rego—especially when it interacts with the speed and liquidity of networks like #sol —should not depend on the good faith of whoever configures the policy, but on the quality of the logical constraints.
To what extent should we standardize the “exception parameters” to ensure that excessive customization doesn’t end up weakening the security fabric the protocol promises?
I believe trust should rest exclusively on the code, not on arbitrary configuration. What do you think? Should the ecosystem impose stricter limits on how far an “exception” can go, or is the operator’s sovereignty a non-negotiable principle?
What do you trust more when operating with access policies on #Newt?
Vote and leave your justification in the comments!
@NewtonProtocol #Newt $NEWT
I’ve been analyzing how the governance of @NewtonProtocol enables real-time adjustments, and I wonder whether the “flexibility” it offers is, in reality, a blind spot for operators.
The idea is often sold that dynamic rule configuration is a competitive advantage. However, there’s a fine line between operational agility and the erosion of baseline security. If we compare the robustness of networks like #BTC , where immutability is the rule, with the malleability of policies in DeFi environments, an uncomfortable question arises:
At what point does the protocol stop being a “default-deny” policy and instead become simply a pass filter for any transaction the operator considers “profitable”?
The security of a system based on Rego—especially when it interacts with the speed and liquidity of networks like #sol —should not depend on the good faith of whoever configures the policy, but on the quality of the logical constraints.
To what extent should we standardize the “exception parameters” to ensure that excessive customization doesn’t end up weakening the security fabric the protocol promises?
I believe trust should rest exclusively on the code, not on arbitrary configuration. What do you think? Should the ecosystem impose stricter limits on how far an “exception” can go, or is the operator’s sovereignty a non-negotiable principle?
What do you trust more when operating with access policies on #Newt?
Vote and leave your justification in the comments!
@NewtonProtocol #Newt $NEWT
The idea is often sold that dynamic rule configuration is a competitive advantage. However, there’s a fine line between operational agility and the erosion of baseline security. If we compare the robustness of networks like #BTC , where immutability is the rule, with the malleability of policies in DeFi environments, an uncomfortable question arises:
At what point does the protocol stop being a “default-deny” policy and instead become simply a pass filter for any transaction the operator considers “profitable”?
The security of a system based on Rego—especially when it interacts with the speed and liquidity of networks like #sol —should not depend on the good faith of whoever configures the policy, but on the quality of the logical constraints.
To what extent should we standardize the “exception parameters” to ensure that excessive customization doesn’t end up weakening the security fabric the protocol promises?
I believe trust should rest exclusively on the code, not on arbitrary configuration. What do you think? Should the ecosystem impose stricter limits on how far an “exception” can go, or is the operator’s sovereignty a non-negotiable principle?
What do you trust more when operating with access policies on #Newt?
Vote and leave your justification in the comments!
@NewtonProtocol #Newt $NEWT
Código estricto (Rego)
50%
Soberanía del operador
0%
Auditorías externas
50%
Consenso comunitario
0%
2 votes • Voting closed
140
·
--
Sol Perpetuo ($SOL ): Extreme strength and caution signals 📊
The Sol Perpetuo market is showing intense technical dynamics within the 4-hour timeframe. With a current price of 82.76, after the last candle closed at 82.67, it’s time to analyze the key indicators:
Technical Summary (4H):
Trend: Clearly bullish structure, trading above the 78.08 EMA and the Bollinger Bands’ midline (79.19).
RSI (81.65): We’re in a zone of extreme overbought. Historically, levels above 70 suggest the price has risen very quickly and a correction or imminent pullback could occur.
ADX (86.39): Such a high ADX level confirms that the uptrend is extremely strong, but it also often serves as a warning signal of potential trend exhaustion in the short term.
Structure Analysis:
The asset has managed to break upward with strength, but the momentum indicators (RSI) and trend strength (ADX) are at levels where caution is necessary.
What to watch?
1. Support: The Bollinger midline at 79.19 and the EMA at 78.08 are critical levels that should act as support in case of a pullback.
2. Volume: With 2.25M in volume, we’ll see whether buying interest manages to hold the price above the recent highs of 82.83 or if we see profit-taking.
Although the trend is dominant, the market is “hot.” It’s likely we’ll see a consolidation phase or a technical pullback before attempting new highs.
Disclaimer: This content is for educational purposes and does not constitute financial advice. Always do your own research (DYOR).
{future}(SOLUSDT)
Sol Perpetuo ($SOL ): Extreme strength and caution signals 📊
The Sol Perpetuo market is showing intense technical dynamics within the 4-hour timeframe. With a current price of 82.76, after the last candle closed at 82.67, it’s time to analyze the key indicators:
Technical Summary (4H):
Trend: Clearly bullish structure, trading above the 78.08 EMA and the Bollinger Bands’ midline (79.19).
RSI (81.65): We’re in a zone of extreme overbought. Historically, levels above 70 suggest the price has risen very quickly and a correction or imminent pullback could occur.
ADX (86.39): Such a high ADX level confirms that the uptrend is extremely strong, but it also often serves as a warning signal of potential trend exhaustion in the short term.
Structure Analysis:
The asset has managed to break upward with strength, but the momentum indicators (RSI) and trend strength (ADX) are at levels where caution is necessary.
What to watch?
1. Support: The Bollinger midline at 79.19 and the EMA at 78.08 are critical levels that should act as support in case of a pullback.
2. Volume: With 2.25M in volume, we’ll see whether buying interest manages to hold the price above the recent highs of 82.83 or if we see profit-taking.
Although the trend is dominant, the market is “hot.” It’s likely we’ll see a consolidation phase or a technical pullback before attempting new highs.
Disclaimer: This content is for educational purposes and does not constitute financial advice. Always do your own research (DYOR).
The Sol Perpetuo market is showing intense technical dynamics within the 4-hour timeframe. With a current price of 82.76, after the last candle closed at 82.67, it’s time to analyze the key indicators:
Technical Summary (4H):
Trend: Clearly bullish structure, trading above the 78.08 EMA and the Bollinger Bands’ midline (79.19).
RSI (81.65): We’re in a zone of extreme overbought. Historically, levels above 70 suggest the price has risen very quickly and a correction or imminent pullback could occur.
ADX (86.39): Such a high ADX level confirms that the uptrend is extremely strong, but it also often serves as a warning signal of potential trend exhaustion in the short term.
Structure Analysis:
The asset has managed to break upward with strength, but the momentum indicators (RSI) and trend strength (ADX) are at levels where caution is necessary.
What to watch?
1. Support: The Bollinger midline at 79.19 and the EMA at 78.08 are critical levels that should act as support in case of a pullback.
2. Volume: With 2.25M in volume, we’ll see whether buying interest manages to hold the price above the recent highs of 82.83 or if we see profit-taking.
Although the trend is dominant, the market is “hot.” It’s likely we’ll see a consolidation phase or a technical pullback before attempting new highs.
Disclaimer: This content is for educational purposes and does not constitute financial advice. Always do your own research (DYOR).
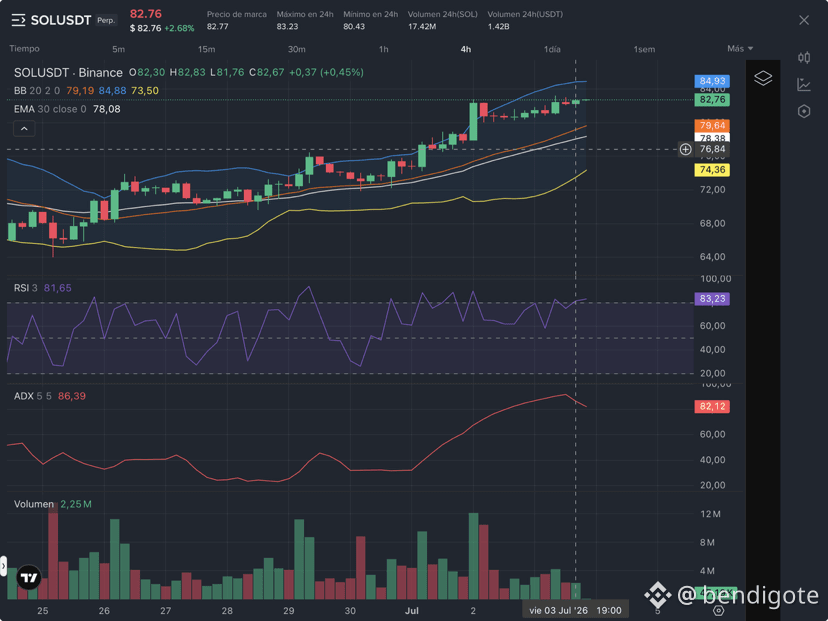
662
·
--
Sol Perpetuo: Are we facing a necessary pause? Technical analysis in 4H 📊
The behavior of $SOL Perpetuo within the 4-hour timeframe shows an interesting battle in the $81 area. After the last close at 81.17, the asset leaves us key technical clues that we should keep a close eye on.
Key analysis points:
Current Bullish Structure: The price remains quoted above the 77.10 EMA, confirming that, despite the recent red candle, the short-term structure still favors buyers.
Consolidation Zone: With the current price at 81.26, we are trading above the Bollinger Bands mean (77.83), suggesting a stabilization phase within a broader range.
Alert Signal - ADX: The ADX indicator is at 88.58. Technically, such a high ADX level is often a sign of exhaustion in the current trend, which anticipates possible sideways movement or a mild correction before attempting new highs.
Neutral RSI: With an RSI of 58.44, the asset has enough room to maneuver without being in extreme overbought zones, maintaining a healthy profile.
My opinion
The market shows strength, but the intensity measured by the ADX suggests that the bulls may take a breather soon. The key will be to see whether support at the EMA (77.10) can absorb selling pressure in case of a retest.
¿
How do you see the move for the coming hours? Do you think it will consolidate to break $82, or will we see a pullback toward the moving average? I’m reading your comments. 👇
Disclaimer: This analysis is for information purposes only and does not constitute financial advice. Always do your own research (DYOR).
{future}(SOLUSDT)
Sol Perpetuo: Are we facing a necessary pause? Technical analysis in 4H 📊
The behavior of $SOL Perpetuo within the 4-hour timeframe shows an interesting battle in the $81 area. After the last close at 81.17, the asset leaves us key technical clues that we should keep a close eye on.
Key analysis points:
Current Bullish Structure: The price remains quoted above the 77.10 EMA, confirming that, despite the recent red candle, the short-term structure still favors buyers.
Consolidation Zone: With the current price at 81.26, we are trading above the Bollinger Bands mean (77.83), suggesting a stabilization phase within a broader range.
Alert Signal - ADX: The ADX indicator is at 88.58. Technically, such a high ADX level is often a sign of exhaustion in the current trend, which anticipates possible sideways movement or a mild correction before attempting new highs.
Neutral RSI: With an RSI of 58.44, the asset has enough room to maneuver without being in extreme overbought zones, maintaining a healthy profile.
My opinion
The market shows strength, but the intensity measured by the ADX suggests that the bulls may take a breather soon. The key will be to see whether support at the EMA (77.10) can absorb selling pressure in case of a retest.
¿
How do you see the move for the coming hours? Do you think it will consolidate to break $82, or will we see a pullback toward the moving average? I’m reading your comments. 👇
Disclaimer: This analysis is for information purposes only and does not constitute financial advice. Always do your own research (DYOR).
The behavior of $SOL Perpetuo within the 4-hour timeframe shows an interesting battle in the $81 area. After the last close at 81.17, the asset leaves us key technical clues that we should keep a close eye on.
Key analysis points:
Current Bullish Structure: The price remains quoted above the 77.10 EMA, confirming that, despite the recent red candle, the short-term structure still favors buyers.
Consolidation Zone: With the current price at 81.26, we are trading above the Bollinger Bands mean (77.83), suggesting a stabilization phase within a broader range.
Alert Signal - ADX: The ADX indicator is at 88.58. Technically, such a high ADX level is often a sign of exhaustion in the current trend, which anticipates possible sideways movement or a mild correction before attempting new highs.
Neutral RSI: With an RSI of 58.44, the asset has enough room to maneuver without being in extreme overbought zones, maintaining a healthy profile.
My opinion
The market shows strength, but the intensity measured by the ADX suggests that the bulls may take a breather soon. The key will be to see whether support at the EMA (77.10) can absorb selling pressure in case of a retest.
¿
How do you see the move for the coming hours? Do you think it will consolidate to break $82, or will we see a pullback toward the moving average? I’m reading your comments. 👇
Disclaimer: This analysis is for information purposes only and does not constitute financial advice. Always do your own research (DYOR).
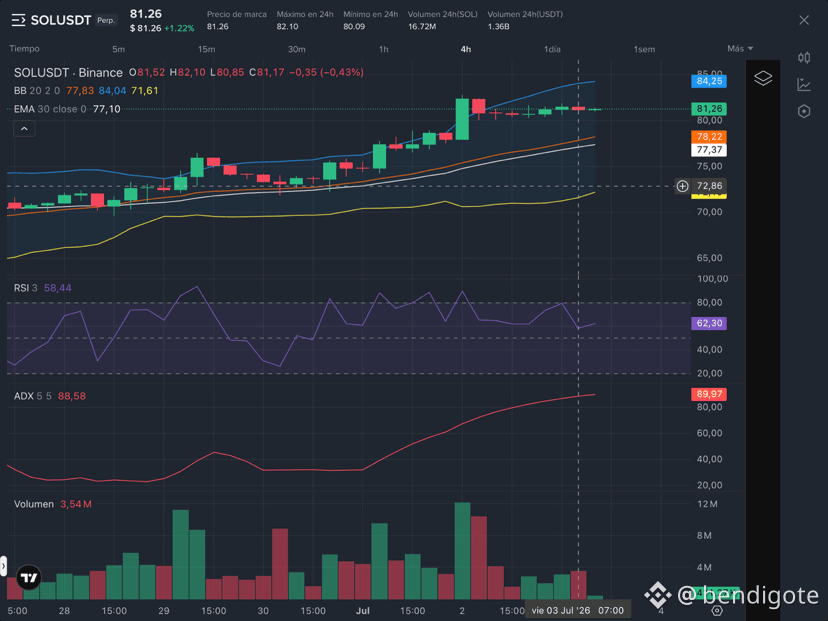
1
76
·
--
Newton Protocol is redefining onchain transaction infrastructure through "pre-authorization". Unlike other tools that only report events, Newton enforces policy validation (identity, APY, oracle health) before final settlement. It is the evolution toward a robust and scalable security policy market.
@NewtonProtocol $NEWT #Newt
{future}(NEWTUSDT)
Newton Protocol is redefining onchain transaction infrastructure through "pre-authorization". Unlike other tools that only report events, Newton enforces policy validation (identity, APY, oracle health) before final settlement. It is the evolution toward a robust and scalable security policy market.
@NewtonProtocol $NEWT #Newt
@NewtonProtocol $NEWT #Newt

2
62
·
--
Solana ($SOL ): Extreme technical strength (ADX 86.85) 🚀
Solana is in vertical acceleration mode. With an ADX of 86.85, the uptrend is so strong that any pullback is being absorbed instantly.
Key data:
Close: $81.52
Strength (ADX): 86.85 (Extreme)
Overbought (RSI): 79.56 (Alert zone)
Volume: 3.08m (High conviction)
We’re trading at the upper limit of the Bollinger Bands. The trend is undeniable, but the elevated RSI suggests volatility is about to explode.
What’s my take? The strength is real, but at ADX levels >80, risk management is not optional. The key is not to chase the price at the top.
Do you think Solana will break $84 today, or will we see the necessary cooldown?
{future}(SOLUSDT)
Solana ($SOL ): Extreme technical strength (ADX 86.85) 🚀
Solana is in vertical acceleration mode. With an ADX of 86.85, the uptrend is so strong that any pullback is being absorbed instantly.
Key data:
Close: $81.52
Strength (ADX): 86.85 (Extreme)
Overbought (RSI): 79.56 (Alert zone)
Volume: 3.08m (High conviction)
We’re trading at the upper limit of the Bollinger Bands. The trend is undeniable, but the elevated RSI suggests volatility is about to explode.
What’s my take? The strength is real, but at ADX levels >80, risk management is not optional. The key is not to chase the price at the top.
Do you think Solana will break $84 today, or will we see the necessary cooldown?
Solana is in vertical acceleration mode. With an ADX of 86.85, the uptrend is so strong that any pullback is being absorbed instantly.
Key data:
Close: $81.52
Strength (ADX): 86.85 (Extreme)
Overbought (RSI): 79.56 (Alert zone)
Volume: 3.08m (High conviction)
We’re trading at the upper limit of the Bollinger Bands. The trend is undeniable, but the elevated RSI suggests volatility is about to explode.
What’s my take? The strength is real, but at ADX levels >80, risk management is not optional. The key is not to chase the price at the top.
Do you think Solana will break $84 today, or will we see the necessary cooldown?
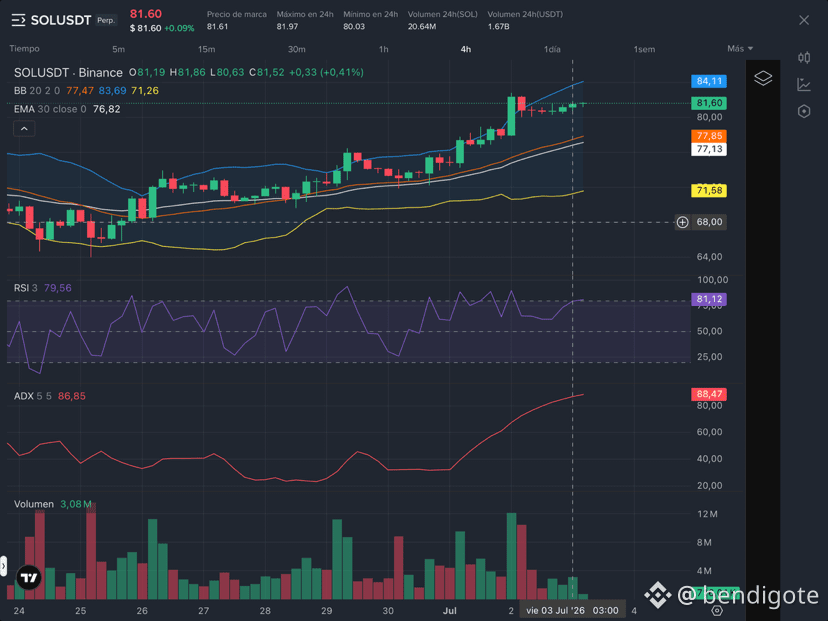
1
431
Log in to explore more content
Join global crypto users on Binance Square
⚡️ Get latest and useful information about crypto.
💬 Trusted by the world’s largest crypto exchange.
👍 Discover real insights from verified creators.
Email / Phone number
Trending Topics
SECHaltsCryptoETFReviewsAmidFundingLapse
579 views
52 Discussing
Everyone Was Waiting for the Next Crypto ETF… Then Washington Hit PAUSE 👀
This one caught my attention this morning.
The SEC has paused reviews of new crypto ETFs during the U.S. funding lapse.
Important part: this is not a rejection.
Existing ETFs keep trading.
New applications are basically stuck waiting for the SEC machinery to restart.
And reportedly 90+ applications were sitting in the pipeline as October began.
So I’m not watching this as bearish news.
I’m watching what happens when that pipeline starts moving again. 👀
Sometimes the bigger move comes after the pause, not during it.
—Master CX
$BTC $ETH
#SECHaltsCryptoETFReviewsAmidFundingLapse
Master CX
·2 Likes
·51 views
ZcashETFPostsFirstWeeklyOutflow$93.6M
53,690 views
162 Discussing
GreekPoliceBustCryptoScamRingArrest17
154,001 views
1,081 Discussing