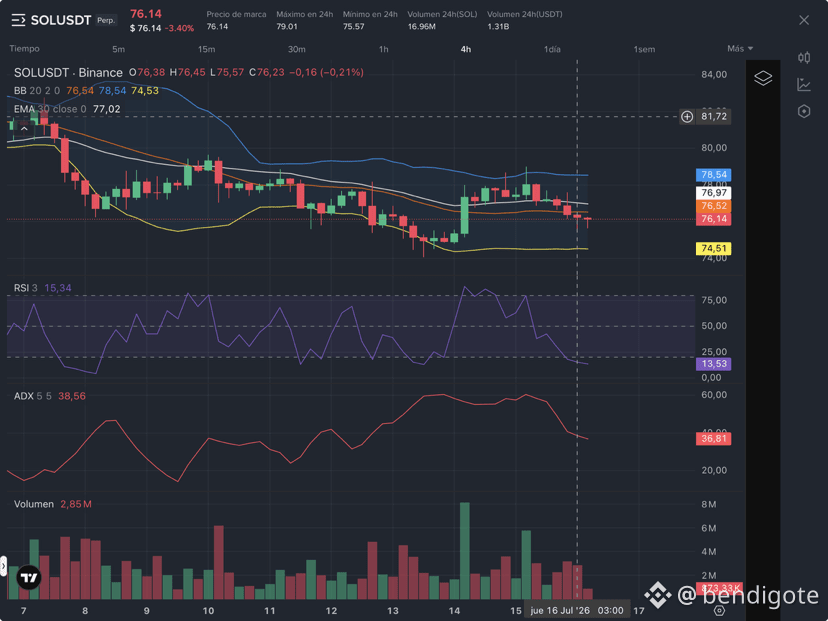
$SOL (Sol Perpetuo): The capitulation is real and support is wobbling 📉
If anyone was expecting a miraculous bounce, the last 12 hours’ data in Sol Perpetuo says otherwise. Three consecutive red candles are not a coincidence—they’re a massive capital flight.
Technical read:
RSI drawdown: We’ve dropped from 30.38 to 15.34. An RSI at 15 is extreme oversold territory, but be careful: in markets with high bearish inertia, this is usually a sign of panic, not an immediate buying opportunity.
Bearish strength intact: Although ADX has fallen from 49.28 to 38.56, it still remains at very high trend-strength levels. This means the drop hasn’t been an accident; it’s been a move driven by conviction from sellers.
Price against the wall: We’re trading at 76.14, already breaking the close of the last candle (76.23) and dangerously approaching the lower band (74.53). The technical structure is completely broken.
Is it time to buy? Honestly, no. Trying to catch this falling knife is exposing yourself to unnecessary risk. When the market capitulates like this, it usually seeks a “selling climax,” where volume spikes even more before stabilizing.
The EMA (77.02) has become an unbreakable ceiling. As long as price doesn’t recover and consolidate above that level, any “green” you see on the chart is only a pause before continuing to fall. We’re in survival mode; if you’re in, keep a close eye on your stops, and if you’re out, watch from the sidelines. The market doesn’t give gifts—it gives lessons.
Are you still looking for buys, or are you waiting for lower levels to see if real demand shows up? I’m reading your thoughts.
Disclaimer: This is not financial advice. Current volatility is a high risk. DYOR.
If anyone was expecting a miraculous bounce, the last 12 hours’ data in Sol Perpetuo says otherwise. Three consecutive red candles are not a coincidence—they’re a massive capital flight.
Technical read:
RSI drawdown: We’ve dropped from 30.38 to 15.34. An RSI at 15 is extreme oversold territory, but be careful: in markets with high bearish inertia, this is usually a sign of panic, not an immediate buying opportunity.
Bearish strength intact: Although ADX has fallen from 49.28 to 38.56, it still remains at very high trend-strength levels. This means the drop hasn’t been an accident; it’s been a move driven by conviction from sellers.
Price against the wall: We’re trading at 76.14, already breaking the close of the last candle (76.23) and dangerously approaching the lower band (74.53). The technical structure is completely broken.
Is it time to buy? Honestly, no. Trying to catch this falling knife is exposing yourself to unnecessary risk. When the market capitulates like this, it usually seeks a “selling climax,” where volume spikes even more before stabilizing.
The EMA (77.02) has become an unbreakable ceiling. As long as price doesn’t recover and consolidate above that level, any “green” you see on the chart is only a pause before continuing to fall. We’re in survival mode; if you’re in, keep a close eye on your stops, and if you’re out, watch from the sidelines. The market doesn’t give gifts—it gives lessons.
Are you still looking for buys, or are you waiting for lower levels to see if real demand shows up? I’m reading your thoughts.
Disclaimer: This is not financial advice. Current volatility is a high risk. DYOR.