Sol Perpetuo ($SOL ): Loss of the middle band or simple consolidation? 📉
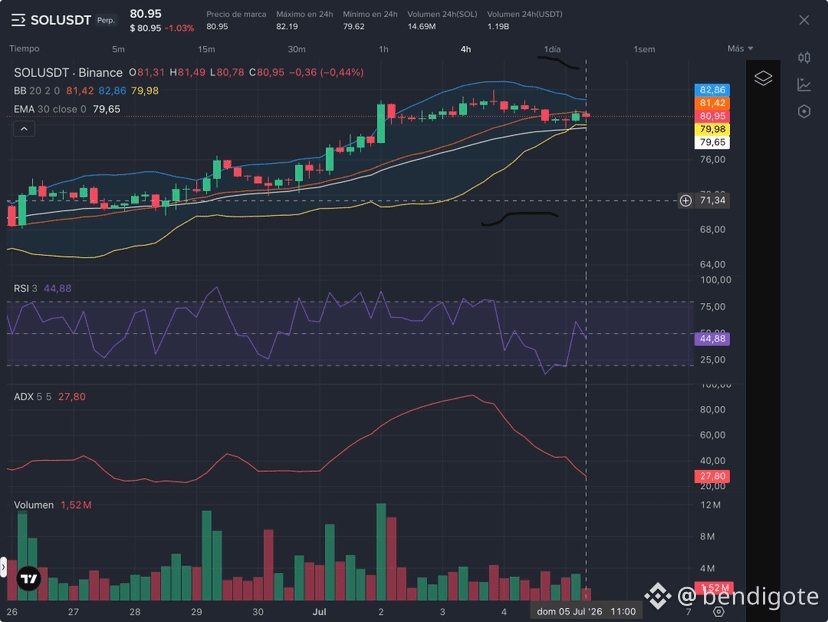
The close of the last candle at 80.95 leaves an interesting technical picture. Price has confirmed a loss of the Bollinger Middle Band (81.42), indicating that the bullish momentum in the short term has cooled.
Technical points to highlight:
Break of the Middle Band: Closing below 81.42 is a sign of technical weakness. The middle band often acts like a magnet for price, and when it’s broken to the downside, the market is testing whether there’s enough liquidity at lower levels.
Key support: It’s important to note that, despite the red candle, we’re still holding above the Lower Band (79.98). This keeps us from technically entering an area of extreme oversold conditions, maintaining the structure within the Bollinger range for now.
Momentum (RSI/ADX): With an RSI at 44.88, the market is trading in neutral territory. What stands out most to me is the ADX at 27.80; after having seen very strong levels, this drop suggests the market is moving into a phase of sideways trading.
We’re not in free fall, but the fact that the bands’ middle band was lost is a "warning" that buyers have lost control of the short term. Personally, I’m going to watch to see whether we can quickly reclaim 81.42 or whether price seeks more solid support closer to the lower band.
What do you think? Is it time to wait for a bounce, or are we seeing the start of a longer sideways range?
Disclaimer: My technical analysis is for educational purposes only. Not investment advice. DYOR.
The close of the last candle at 80.95 leaves an interesting technical picture. Price has confirmed a loss of the Bollinger Middle Band (81.42), indicating that the bullish momentum in the short term has cooled.
Technical points to highlight:
Break of the Middle Band: Closing below 81.42 is a sign of technical weakness. The middle band often acts like a magnet for price, and when it’s broken to the downside, the market is testing whether there’s enough liquidity at lower levels.
Key support: It’s important to note that, despite the red candle, we’re still holding above the Lower Band (79.98). This keeps us from technically entering an area of extreme oversold conditions, maintaining the structure within the Bollinger range for now.
Momentum (RSI/ADX): With an RSI at 44.88, the market is trading in neutral territory. What stands out most to me is the ADX at 27.80; after having seen very strong levels, this drop suggests the market is moving into a phase of sideways trading.
We’re not in free fall, but the fact that the bands’ middle band was lost is a "warning" that buyers have lost control of the short term. Personally, I’m going to watch to see whether we can quickly reclaim 81.42 or whether price seeks more solid support closer to the lower band.
What do you think? Is it time to wait for a bounce, or are we seeing the start of a longer sideways range?
Disclaimer: My technical analysis is for educational purposes only. Not investment advice. DYOR.