Sol Perpetuo ($SOL ): The technical rebound trap ⚠️
If we analyze the behavior of the last 3 hours on Sol Perpetuo, the picture is misleading. We’ve seen an attempted recovery that quickly deflated, leaving a structure that, honestly, gives me no confidence to go long.
Structure analysis:
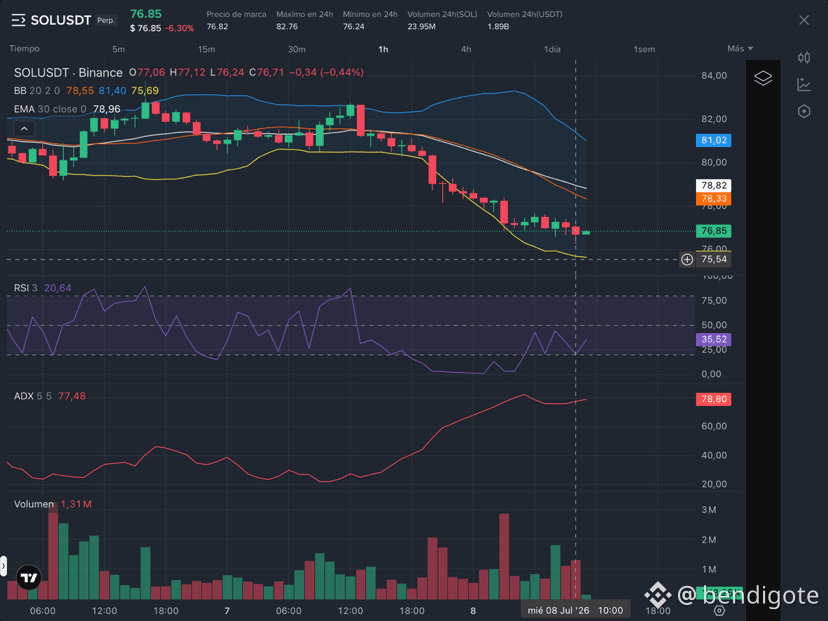
Rejection of the Median: Over these three hours, the price has repeatedly tried to approach the Bollinger Median, but the market has rejected the move with increasing force. The fact that the close has progressively dropped from 77.27 to 76.71 confirms that selling pressure is setting the pace.
The free fall of the RSI: It plunges from 44.34 to 20.64 in just three hours—this is a clear sign of capitulation. This isn’t healthy consolidation; it’s accelerated capital outflow.
ADX at 77.48: An ADX above 75 is not normal. It indicates that the current downtrend has extreme strength. At these levels, trying to “buy the drop,” in my opinion, is buying a ticket toward an even bigger loss.
Outlook and critical view:
The market is currently at 76.85, trying to hold above the recent low. However, with an ADX that’s so elevated and an RSI that’s barely starting to edge into extreme oversold territory, the risk of further downside extension is still very much present.
Personally, I don’t see reasons to be optimistic. The EMA at 78.96 is acting like a containment wall that buyers aren’t even close to challenging. If the immediate support around 76.24 (the low of the last hour) breaks, there’s nothing stopping a move toward lower levels.
My read: We’re in a process of cleaning out “weak” positions. Until I see a clear divergence in the RSI and a break of that EMA on 1H with real volume, I’ll stay on the sidelines. The market has no rush to go up, and you shouldn’t either when entering.
Don’t trade based on only this—right now the market is very erratic.
If we analyze the behavior of the last 3 hours on Sol Perpetuo, the picture is misleading. We’ve seen an attempted recovery that quickly deflated, leaving a structure that, honestly, gives me no confidence to go long.
Structure analysis:
Rejection of the Median: Over these three hours, the price has repeatedly tried to approach the Bollinger Median, but the market has rejected the move with increasing force. The fact that the close has progressively dropped from 77.27 to 76.71 confirms that selling pressure is setting the pace.
The free fall of the RSI: It plunges from 44.34 to 20.64 in just three hours—this is a clear sign of capitulation. This isn’t healthy consolidation; it’s accelerated capital outflow.
ADX at 77.48: An ADX above 75 is not normal. It indicates that the current downtrend has extreme strength. At these levels, trying to “buy the drop,” in my opinion, is buying a ticket toward an even bigger loss.
Outlook and critical view:
The market is currently at 76.85, trying to hold above the recent low. However, with an ADX that’s so elevated and an RSI that’s barely starting to edge into extreme oversold territory, the risk of further downside extension is still very much present.
Personally, I don’t see reasons to be optimistic. The EMA at 78.96 is acting like a containment wall that buyers aren’t even close to challenging. If the immediate support around 76.24 (the low of the last hour) breaks, there’s nothing stopping a move toward lower levels.
My read: We’re in a process of cleaning out “weak” positions. Until I see a clear divergence in the RSI and a break of that EMA on 1H with real volume, I’ll stay on the sidelines. The market has no rush to go up, and you shouldn’t either when entering.
Don’t trade based on only this—right now the market is very erratic.