

有米06
1.5k Posts

有米06
Report
Block User
菜鸡交易员 只分享趣事
87 Following
111 Followers
127 Liked
Posts
All
Videos
PINNED
·
--
Get ready to welcome your brighter tomorrow $BNB
Get ready to welcome your brighter tomorrow $BNB
3
363
·
--
ETH’s price has barely moved over the past couple of days, but last night the development team put the “pedal to the metal” on the testnet, tripling the speed—the price and the project’s progress are once again moving on separate tracks.
At 21:53 Beijing time on October 6, Ethereum’s Glamsterdam upgrade activated on the Sepolia testnet (epoch 353024). It combines the execution-layer Amsterdam upgrade with the consensus-layer Gloas upgrade. The two key changes are ePBS (enshrined Proposer-Builder Separation, EIP-7732) and Block-Level Access Lists (BALs, EIP-7928). The goal is to let clients process more execution work in parallel and produce blocks faster.
Sepolia also raised its block gas limit from 60 million to 200 million, conducting a stress test at more than three times the previous capacity. The Prysm client even rushed out a 7.2.1 patch on the eve of activation to ensure the test could make full use of the 200 million limit. Next up is the Hoodi testnet; no mainnet date has been set. Regular holders don’t need to do anything.
My take: Ethereum’s roadmap has never really stopped moving. Both ePBS and BALs tackle the tough challenges of L1 scaling and MEV fairness, so successfully implementing them would be a long-term positive. But let’s not get ahead of ourselves: a smooth testnet run doesn’t guarantee a smooth mainnet launch. The Hoodi test is still ahead, and there isn’t even a hint of a mainnet date. Anyone chasing the price on testnet news is probably buying into the “upgrade hype.” If you want a real signal, an official announcement of the mainnet activation date is far more reliable than all the testnet buzz. I’ll keep following these upgrade developments—follow me to stay in the loop.
$ETH
#EthereumUpgrade
Data as of: 2026-10-07 07:05 UTC
Source: Ethereum Foundation testnet announcement; CoinDesk
For informational purposes only; not investment advice.
Would you adjust your position because of a testnet upgrade? 🤔
ETH’s price has barely moved over the past couple of days, but last night the development team put the “pedal to the metal” on the testnet, tripling the speed—the price and the project’s progress are once again moving on separate tracks.
At 21:53 Beijing time on October 6, Ethereum’s Glamsterdam upgrade activated on the Sepolia testnet (epoch 353024). It combines the execution-layer Amsterdam upgrade with the consensus-layer Gloas upgrade. The two key changes are ePBS (enshrined Proposer-Builder Separation, EIP-7732) and Block-Level Access Lists (BALs, EIP-7928). The goal is to let clients process more execution work in parallel and produce blocks faster.
Sepolia also raised its block gas limit from 60 million to 200 million, conducting a stress test at more than three times the previous capacity. The Prysm client even rushed out a 7.2.1 patch on the eve of activation to ensure the test could make full use of the 200 million limit. Next up is the Hoodi testnet; no mainnet date has been set. Regular holders don’t need to do anything.
My take: Ethereum’s roadmap has never really stopped moving. Both ePBS and BALs tackle the tough challenges of L1 scaling and MEV fairness, so successfully implementing them would be a long-term positive. But let’s not get ahead of ourselves: a smooth testnet run doesn’t guarantee a smooth mainnet launch. The Hoodi test is still ahead, and there isn’t even a hint of a mainnet date. Anyone chasing the price on testnet news is probably buying into the “upgrade hype.” If you want a real signal, an official announcement of the mainnet activation date is far more reliable than all the testnet buzz. I’ll keep following these upgrade developments—follow me to stay in the loop.
$ETH
#EthereumUpgrade
Data as of: 2026-10-07 07:05 UTC
Source: Ethereum Foundation testnet announcement; CoinDesk
For informational purposes only; not investment advice.
Would you adjust your position because of a testnet upgrade? 🤔
At 21:53 Beijing time on October 6, Ethereum’s Glamsterdam upgrade activated on the Sepolia testnet (epoch 353024). It combines the execution-layer Amsterdam upgrade with the consensus-layer Gloas upgrade. The two key changes are ePBS (enshrined Proposer-Builder Separation, EIP-7732) and Block-Level Access Lists (BALs, EIP-7928). The goal is to let clients process more execution work in parallel and produce blocks faster.
Sepolia also raised its block gas limit from 60 million to 200 million, conducting a stress test at more than three times the previous capacity. The Prysm client even rushed out a 7.2.1 patch on the eve of activation to ensure the test could make full use of the 200 million limit. Next up is the Hoodi testnet; no mainnet date has been set. Regular holders don’t need to do anything.
My take: Ethereum’s roadmap has never really stopped moving. Both ePBS and BALs tackle the tough challenges of L1 scaling and MEV fairness, so successfully implementing them would be a long-term positive. But let’s not get ahead of ourselves: a smooth testnet run doesn’t guarantee a smooth mainnet launch. The Hoodi test is still ahead, and there isn’t even a hint of a mainnet date. Anyone chasing the price on testnet news is probably buying into the “upgrade hype.” If you want a real signal, an official announcement of the mainnet activation date is far more reliable than all the testnet buzz. I’ll keep following these upgrade developments—follow me to stay in the loop.
$ETH
#EthereumUpgrade
Data as of: 2026-10-07 07:05 UTC
Source: Ethereum Foundation testnet announcement; CoinDesk
For informational purposes only; not investment advice.
Would you adjust your position because of a testnet upgrade? 🤔

96
·
--
90% of beginners trading futures get stuck in the same place when opening their first position—their money isn’t in their futures account.
Here are 5 steps to open a Binance USDⓈ-M Futures position. Beginners can follow along:
Step 1: Transfer funds
On the app home page, tap “Assets” → “Transfer.” Select “Spot” as the source and “USDⓈ-M Futures” as the destination, enter an amount, and confirm. Transfers are free and instant.
Step 2: Go to the right trading page
Tap “Futures” at the bottom → “USDⓈ-M Perpetual.” Check that the top-left corner shows USDT-M, then use the search bar to select a trading pair, such as BTCUSDT Perpetual.
Step 3: Set your margin mode and leverage
Set the mode to Isolated in the top-right corner (if you’re liquidated, you’ll only lose the margin for that position—beginner-friendly). Choose a leverage level you can handle; don’t just use the maximum default.
Step 4: Choose an order type and direction
A limit order lets you set the price yourself; it may take longer to fill, but gives you price control. A market order fills immediately at the current price. If you think the price will rise, tap the green “Buy/Long”; if you think it will fall, tap the red “Sell/Short.” Enter an amount or drag the position-size slider below.
Step 5: Set take-profit and stop-loss
After your order fills, go to “Positions” and set a stop-loss. If the market moves against you, the system will close the position automatically. Don’t count on being able to close it manually in time.
My take: The hardest part of futures trading has never been tapping the “Open Long” button. It’s deciding beforehand how much you’re willing to lose. For your first trade, don’t focus on how to make money—first make sure you understand isolated margin and stop-losses, and keep leverage as low as possible. Most people don’t get liquidated because they guessed the direction wrong; they get taken out by their position size. Learn how not to lose first, then think about making money.
Source: Compiled from the udn blog post “Binance USDⓈ-M Futures Tutorial for Beginners” and the Matters community’s guide to opening a futures position
$BTC
For informational purposes only; this is not investment advice. Futures trading involves significant risk. Please participate with caution.
I’ll keep sharing beginner tutorials like this, so follow me to stay in the loop. Was your first futures trade a long or a short? Let’s talk in the comments.
90% of beginners trading futures get stuck in the same place when opening their first position—their money isn’t in their futures account.
Here are 5 steps to open a Binance USDⓈ-M Futures position. Beginners can follow along:
Step 1: Transfer funds
On the app home page, tap “Assets” → “Transfer.” Select “Spot” as the source and “USDⓈ-M Futures” as the destination, enter an amount, and confirm. Transfers are free and instant.
Step 2: Go to the right trading page
Tap “Futures” at the bottom → “USDⓈ-M Perpetual.” Check that the top-left corner shows USDT-M, then use the search bar to select a trading pair, such as BTCUSDT Perpetual.
Step 3: Set your margin mode and leverage
Set the mode to Isolated in the top-right corner (if you’re liquidated, you’ll only lose the margin for that position—beginner-friendly). Choose a leverage level you can handle; don’t just use the maximum default.
Step 4: Choose an order type and direction
A limit order lets you set the price yourself; it may take longer to fill, but gives you price control. A market order fills immediately at the current price. If you think the price will rise, tap the green “Buy/Long”; if you think it will fall, tap the red “Sell/Short.” Enter an amount or drag the position-size slider below.
Step 5: Set take-profit and stop-loss
After your order fills, go to “Positions” and set a stop-loss. If the market moves against you, the system will close the position automatically. Don’t count on being able to close it manually in time.
My take: The hardest part of futures trading has never been tapping the “Open Long” button. It’s deciding beforehand how much you’re willing to lose. For your first trade, don’t focus on how to make money—first make sure you understand isolated margin and stop-losses, and keep leverage as low as possible. Most people don’t get liquidated because they guessed the direction wrong; they get taken out by their position size. Learn how not to lose first, then think about making money.
Source: Compiled from the udn blog post “Binance USDⓈ-M Futures Tutorial for Beginners” and the Matters community’s guide to opening a futures position
$BTC
For informational purposes only; this is not investment advice. Futures trading involves significant risk. Please participate with caution.
I’ll keep sharing beginner tutorials like this, so follow me to stay in the loop. Was your first futures trade a long or a short? Let’s talk in the comments.
Here are 5 steps to open a Binance USDⓈ-M Futures position. Beginners can follow along:
Step 1: Transfer funds
On the app home page, tap “Assets” → “Transfer.” Select “Spot” as the source and “USDⓈ-M Futures” as the destination, enter an amount, and confirm. Transfers are free and instant.
Step 2: Go to the right trading page
Tap “Futures” at the bottom → “USDⓈ-M Perpetual.” Check that the top-left corner shows USDT-M, then use the search bar to select a trading pair, such as BTCUSDT Perpetual.
Step 3: Set your margin mode and leverage
Set the mode to Isolated in the top-right corner (if you’re liquidated, you’ll only lose the margin for that position—beginner-friendly). Choose a leverage level you can handle; don’t just use the maximum default.
Step 4: Choose an order type and direction
A limit order lets you set the price yourself; it may take longer to fill, but gives you price control. A market order fills immediately at the current price. If you think the price will rise, tap the green “Buy/Long”; if you think it will fall, tap the red “Sell/Short.” Enter an amount or drag the position-size slider below.
Step 5: Set take-profit and stop-loss
After your order fills, go to “Positions” and set a stop-loss. If the market moves against you, the system will close the position automatically. Don’t count on being able to close it manually in time.
My take: The hardest part of futures trading has never been tapping the “Open Long” button. It’s deciding beforehand how much you’re willing to lose. For your first trade, don’t focus on how to make money—first make sure you understand isolated margin and stop-losses, and keep leverage as low as possible. Most people don’t get liquidated because they guessed the direction wrong; they get taken out by their position size. Learn how not to lose first, then think about making money.
Source: Compiled from the udn blog post “Binance USDⓈ-M Futures Tutorial for Beginners” and the Matters community’s guide to opening a futures position
$BTC
For informational purposes only; this is not investment advice. Futures trading involves significant risk. Please participate with caution.
I’ll keep sharing beginner tutorials like this, so follow me to stay in the loop. Was your first futures trade a long or a short? Let’s talk in the comments.

111
·
--
The most profitable move in crypto might just be to “do nothing”
Buying the top and getting trapped, or wanting to buy the dip but not daring to pull the trigger—most retail investors lose money because of when they buy, not because they picked the wrong coin. Binance has an official feature called Auto-Invest. Set it up once, and the system automatically buys crypto on the schedule you choose. It’s perfect for keeping itchy fingers and decision paralysis in check.
Get started in 5 steps:
1. Open the Binance app and tap → (or →→)
2. Choose what to invest in: a single coin (BTC, ETH, or BNB, for example), or create a portfolio plan to invest in multiple coins at once
3. Set the amount and schedule: how much USDT to invest each time, and whether to invest daily, weekly, every two weeks, or monthly. The minimum is low.
4. Turn on “Use Flexible Balance.” If your balance is insufficient, funds will automatically be topped up from Simple Earn Flexible, so your plan won’t be interrupted.
5. Confirm the agreement and start. You can pause, change the amount, or cancel anytime under “My Plans.”
The coins you buy will also automatically go into Simple Earn Flexible to earn interest—earn from both regular investing and interest.
My take: Dollar-cost averaging has never been the strategy with the highest returns—a lump-sum investment in a one-way bull market would earn more. But it’s the only strategy most people can stick with for the long run. The key isn’t the rate of return, but being able to “hold on”: automatic purchases help you sidestep human nature. You automatically buy more when prices fall and less when they rise, naturally averaging out your cost over time. BTC is now over 80,000 and looks expensive, but if you keep buying a little every month, a year from now your average cost may be much lower than you think. Don’t try to outsmart the market; what matters is how long you can stay invested.
$BTC $ETH $BNB
#Bitcoin
Source: Binance’s official Auto-Invest feature guide, compiled and cross-checked against publicly available tutorials.
For informational purposes only; this is not investment advice.
I’ll keep sharing practical tutorials like this, so follow me to stay updated.
Have you tried dollar-cost averaging? What’s the longest you’ve stuck with it?
The most profitable move in crypto might just be to “do nothing”
Buying the top and getting trapped, or wanting to buy the dip but not daring to pull the trigger—most retail investors lose money because of when they buy, not because they picked the wrong coin. Binance has an official feature called Auto-Invest. Set it up once, and the system automatically buys crypto on the schedule you choose. It’s perfect for keeping itchy fingers and decision paralysis in check.
Get started in 5 steps:
1. Open the Binance app and tap → (or →→)
2. Choose what to invest in: a single coin (BTC, ETH, or BNB, for example), or create a portfolio plan to invest in multiple coins at once
3. Set the amount and schedule: how much USDT to invest each time, and whether to invest daily, weekly, every two weeks, or monthly. The minimum is low.
4. Turn on “Use Flexible Balance.” If your balance is insufficient, funds will automatically be topped up from Simple Earn Flexible, so your plan won’t be interrupted.
5. Confirm the agreement and start. You can pause, change the amount, or cancel anytime under “My Plans.”
The coins you buy will also automatically go into Simple Earn Flexible to earn interest—earn from both regular investing and interest.
My take: Dollar-cost averaging has never been the strategy with the highest returns—a lump-sum investment in a one-way bull market would earn more. But it’s the only strategy most people can stick with for the long run. The key isn’t the rate of return, but being able to “hold on”: automatic purchases help you sidestep human nature. You automatically buy more when prices fall and less when they rise, naturally averaging out your cost over time. BTC is now over 80,000 and looks expensive, but if you keep buying a little every month, a year from now your average cost may be much lower than you think. Don’t try to outsmart the market; what matters is how long you can stay invested.
$BTC $ETH $BNB
#Bitcoin
Source: Binance’s official Auto-Invest feature guide, compiled and cross-checked against publicly available tutorials.
For informational purposes only; this is not investment advice.
I’ll keep sharing practical tutorials like this, so follow me to stay updated.
Have you tried dollar-cost averaging? What’s the longest you’ve stuck with it?
Buying the top and getting trapped, or wanting to buy the dip but not daring to pull the trigger—most retail investors lose money because of when they buy, not because they picked the wrong coin. Binance has an official feature called Auto-Invest. Set it up once, and the system automatically buys crypto on the schedule you choose. It’s perfect for keeping itchy fingers and decision paralysis in check.
Get started in 5 steps:
1. Open the Binance app and tap → (or →→)
2. Choose what to invest in: a single coin (BTC, ETH, or BNB, for example), or create a portfolio plan to invest in multiple coins at once
3. Set the amount and schedule: how much USDT to invest each time, and whether to invest daily, weekly, every two weeks, or monthly. The minimum is low.
4. Turn on “Use Flexible Balance.” If your balance is insufficient, funds will automatically be topped up from Simple Earn Flexible, so your plan won’t be interrupted.
5. Confirm the agreement and start. You can pause, change the amount, or cancel anytime under “My Plans.”
The coins you buy will also automatically go into Simple Earn Flexible to earn interest—earn from both regular investing and interest.
My take: Dollar-cost averaging has never been the strategy with the highest returns—a lump-sum investment in a one-way bull market would earn more. But it’s the only strategy most people can stick with for the long run. The key isn’t the rate of return, but being able to “hold on”: automatic purchases help you sidestep human nature. You automatically buy more when prices fall and less when they rise, naturally averaging out your cost over time. BTC is now over 80,000 and looks expensive, but if you keep buying a little every month, a year from now your average cost may be much lower than you think. Don’t try to outsmart the market; what matters is how long you can stay invested.
$BTC $ETH $BNB
#Bitcoin
Source: Binance’s official Auto-Invest feature guide, compiled and cross-checked against publicly available tutorials.
For informational purposes only; this is not investment advice.
I’ll keep sharing practical tutorials like this, so follow me to stay updated.
Have you tried dollar-cost averaging? What’s the longest you’ve stuck with it?

146
·
--
Can you earn a $WLFI airdrop every week just by leaving your stablecoins untouched—without doing anything? Binance’s 150 million-token prize pool has only 9 days left in its first phase.
On October 2, Binance officially renewed its airdrop campaign for USD1 holders: simply hold $USD1 in net assets in your Spot, Funding, Margin, or USDⓈ-M Futures account, and you’ll share in the prize pool based on your holdings.
The first phase (October 2–October 16) has a prize pool of 75 million WLFI. The second phase (October 16–October 30) offers 75 million WLFI plus up to 2.5 million USD1. Rewards are airdropped directly to your Spot account every Saturday before 02:00 (UTC+8)—no manual claim required.
Two details are worth noting:
1. Maintain an open interest of at least 300 USD1 per day in USD1 trading pairs to receive a 1.2x reward boost;
2. USD1 obtained by borrowing other stablecoins will only count at 70% of its value—the official anti-abuse rules are very explicit.
My take: These “hold and earn an airdrop” campaigns are essentially exchanges using incentives to attract stablecoin deposits, with WLFI serving merely as the unit of reward. The campaign has been renewed repeatedly since March and follows a fixed schedule, suggesting Binance plans to keep it going long term. For people who already keep idle stablecoins on Binance to earn flexible savings interest, moving some into USD1 is an easy way to collect rewards at no extra effort. But the participation terms for the second phase haven’t been announced yet, so check for updates before October 16 rather than assuming the old rules still apply. Also, USD1 is a less widely used stablecoin, so weigh its liquidity and depeg risks carefully—and don’t overcommit.
Data as of: 2026-10-07 04:00 UTC
Source: Binance official announcement; ChainCatcher report
For informational purposes only; not investment advice.
#USD1Airdrop
Do you usually leave your idle stablecoins in flexible savings to earn interest, or swap them around to chase airdrops like this?
Can you earn a $WLFI airdrop every week just by leaving your stablecoins untouched—without doing anything? Binance’s 150 million-token prize pool has only 9 days left in its first phase.
On October 2, Binance officially renewed its airdrop campaign for USD1 holders: simply hold $USD1 in net assets in your Spot, Funding, Margin, or USDⓈ-M Futures account, and you’ll share in the prize pool based on your holdings.
The first phase (October 2–October 16) has a prize pool of 75 million WLFI. The second phase (October 16–October 30) offers 75 million WLFI plus up to 2.5 million USD1. Rewards are airdropped directly to your Spot account every Saturday before 02:00 (UTC+8)—no manual claim required.
Two details are worth noting:
1. Maintain an open interest of at least 300 USD1 per day in USD1 trading pairs to receive a 1.2x reward boost;
2. USD1 obtained by borrowing other stablecoins will only count at 70% of its value—the official anti-abuse rules are very explicit.
My take: These “hold and earn an airdrop” campaigns are essentially exchanges using incentives to attract stablecoin deposits, with WLFI serving merely as the unit of reward. The campaign has been renewed repeatedly since March and follows a fixed schedule, suggesting Binance plans to keep it going long term. For people who already keep idle stablecoins on Binance to earn flexible savings interest, moving some into USD1 is an easy way to collect rewards at no extra effort. But the participation terms for the second phase haven’t been announced yet, so check for updates before October 16 rather than assuming the old rules still apply. Also, USD1 is a less widely used stablecoin, so weigh its liquidity and depeg risks carefully—and don’t overcommit.
Data as of: 2026-10-07 04:00 UTC
Source: Binance official announcement; ChainCatcher report
For informational purposes only; not investment advice.
#USD1Airdrop
Do you usually leave your idle stablecoins in flexible savings to earn interest, or swap them around to chase airdrops like this?
On October 2, Binance officially renewed its airdrop campaign for USD1 holders: simply hold $USD1 in net assets in your Spot, Funding, Margin, or USDⓈ-M Futures account, and you’ll share in the prize pool based on your holdings.
The first phase (October 2–October 16) has a prize pool of 75 million WLFI. The second phase (October 16–October 30) offers 75 million WLFI plus up to 2.5 million USD1. Rewards are airdropped directly to your Spot account every Saturday before 02:00 (UTC+8)—no manual claim required.
Two details are worth noting:
1. Maintain an open interest of at least 300 USD1 per day in USD1 trading pairs to receive a 1.2x reward boost;
2. USD1 obtained by borrowing other stablecoins will only count at 70% of its value—the official anti-abuse rules are very explicit.
My take: These “hold and earn an airdrop” campaigns are essentially exchanges using incentives to attract stablecoin deposits, with WLFI serving merely as the unit of reward. The campaign has been renewed repeatedly since March and follows a fixed schedule, suggesting Binance plans to keep it going long term. For people who already keep idle stablecoins on Binance to earn flexible savings interest, moving some into USD1 is an easy way to collect rewards at no extra effort. But the participation terms for the second phase haven’t been announced yet, so check for updates before October 16 rather than assuming the old rules still apply. Also, USD1 is a less widely used stablecoin, so weigh its liquidity and depeg risks carefully—and don’t overcommit.
Data as of: 2026-10-07 04:00 UTC
Source: Binance official announcement; ChainCatcher report
For informational purposes only; not investment advice.
#USD1Airdrop
Do you usually leave your idle stablecoins in flexible savings to earn interest, or swap them around to chase airdrops like this?

1
190
·
--
The Fear & Greed Index has hit 71, and the market is cheering—but over the past 24 hours, $139 million in positions were liquidated across the crypto market.
BTC is now hovering around $85,540. The Fear & Greed Index is at 71, firmly in “Greed” territory. The hotter sentiment gets, the more leverage piles up: $139 million in liquidations shows that plenty of people are chasing the rally with leverage.
My take: The Fear & Greed Index is a contrarian indicator; greed isn’t a signal to pile in. Historically, a reading of 71 often corresponds to a short-term sentiment peak. Two scenarios are possible from here—the rally could keep building, or a sharp drop could flush out leveraged positions. What really matters is the liquidation breakdown: if liquidations remain heavily concentrated in long positions, it suggests too many traders are chasing the rally and pullback risk is building.
One rule of thumb: don’t chase the rally with leverage when everyone’s greedy. Manage your position size so you’ll still have firepower when volatility hits. I’ll keep tracking sentiment data like this—follow me to stay in the loop.
$BTC
#比特币 #Fear & Greed Index
Data as of: 2026-10-07 03:00 UTC
Sources: BlockTempo; Alternative.me
For informational purposes only; not investment advice.
Would you add to or reduce your position when the Fear & Greed Index is above 70? Let’s discuss in the comments.
The Fear & Greed Index has hit 71, and the market is cheering—but over the past 24 hours, $139 million in positions were liquidated across the crypto market.
BTC is now hovering around $85,540. The Fear & Greed Index is at 71, firmly in “Greed” territory. The hotter sentiment gets, the more leverage piles up: $139 million in liquidations shows that plenty of people are chasing the rally with leverage.
My take: The Fear & Greed Index is a contrarian indicator; greed isn’t a signal to pile in. Historically, a reading of 71 often corresponds to a short-term sentiment peak. Two scenarios are possible from here—the rally could keep building, or a sharp drop could flush out leveraged positions. What really matters is the liquidation breakdown: if liquidations remain heavily concentrated in long positions, it suggests too many traders are chasing the rally and pullback risk is building.
One rule of thumb: don’t chase the rally with leverage when everyone’s greedy. Manage your position size so you’ll still have firepower when volatility hits. I’ll keep tracking sentiment data like this—follow me to stay in the loop.
$BTC
#比特币 #Fear & Greed Index
Data as of: 2026-10-07 03:00 UTC
Sources: BlockTempo; Alternative.me
For informational purposes only; not investment advice.
Would you add to or reduce your position when the Fear & Greed Index is above 70? Let’s discuss in the comments.
BTC is now hovering around $85,540. The Fear & Greed Index is at 71, firmly in “Greed” territory. The hotter sentiment gets, the more leverage piles up: $139 million in liquidations shows that plenty of people are chasing the rally with leverage.
My take: The Fear & Greed Index is a contrarian indicator; greed isn’t a signal to pile in. Historically, a reading of 71 often corresponds to a short-term sentiment peak. Two scenarios are possible from here—the rally could keep building, or a sharp drop could flush out leveraged positions. What really matters is the liquidation breakdown: if liquidations remain heavily concentrated in long positions, it suggests too many traders are chasing the rally and pullback risk is building.
One rule of thumb: don’t chase the rally with leverage when everyone’s greedy. Manage your position size so you’ll still have firepower when volatility hits. I’ll keep tracking sentiment data like this—follow me to stay in the loop.
$BTC
#比特币 #Fear & Greed Index
Data as of: 2026-10-07 03:00 UTC
Sources: BlockTempo; Alternative.me
For informational purposes only; not investment advice.
Would you add to or reduce your position when the Fear & Greed Index is above 70? Let’s discuss in the comments.

213
·
--
BTC is still hovering around $86,000, but your Binance account still has 0 USDT? #BitcoinNear86000Dollars
Lesson one for beginners: Deposit your first USDT. After that, recurring buys, spot trading, and earning products will all be easier.
If you only have RMB, use【Buy Crypto (C2C)】:
1. On the Binance app home page, tap “Deposit” and select “Buy Crypto.”
2. Select USDT and enter an amount—start small the first time, with a few hundred yuan just to try it out.
3. Choose a payment method (bank card/Alipay/WeChat Pay), and pick a merchant with a high completion rate and a long verification history.
4. Follow the order details and transfer money from an account in your own name. Never write terms like “buy crypto” or “USDT” in the transfer note.
5. Once you’ve transferred the money, tap “I’ve Paid” right away. Wait for the merchant to release the crypto, and the USDT will go straight into your Funding Account.
If you already have crypto on another platform or in a wallet, use【On-chain Deposit】:
1. In the bottom-right corner of the app, tap “Assets” → “Deposit” → “Deposit Crypto.”
2. Select the coin (USDT) and the network—TRC20 is recommended for beginners because it’s fast and cheap.
3. Copy the address and go to the other platform to withdraw your crypto. Important: the networks on both sides must match exactly. If you choose the wrong network, your crypto will be lost and cannot be recovered.
4. Wait for the blockchain confirmation. It should arrive in 1–3 minutes.
Once it arrives: Transfer your USDT from your Funding Account to your Spot Account for free, and you can buy $BTC, $ETH, and $BNB .
My take: Nine times out of ten, beginners lose money not because they read the market wrong, but because they mess up the first step—choosing the wrong network and losing their crypto, getting scammed in a private transaction, or having their bank card frozen after writing “buy crypto” in the transfer note. C2C is essentially buying and selling with strangers, and the platform’s protection is your only safety net: never transfer money outside the platform, and always start with a small test transaction. Once you get this step right, everything else is easy.
Source: Compiled from the Binance app’s operating procedures; for informational purposes only and not investment advice.
How did you buy crypto for the first time? C2C or an on-chain transfer? I’ll keep sharing beginner tutorials like this, so follow me to stay in the loop.
BTC is still hovering around $86,000, but your Binance account still has 0 USDT? #BitcoinNear86000Dollars
Lesson one for beginners: Deposit your first USDT. After that, recurring buys, spot trading, and earning products will all be easier.
If you only have RMB, use【Buy Crypto (C2C)】:
1. On the Binance app home page, tap “Deposit” and select “Buy Crypto.”
2. Select USDT and enter an amount—start small the first time, with a few hundred yuan just to try it out.
3. Choose a payment method (bank card/Alipay/WeChat Pay), and pick a merchant with a high completion rate and a long verification history.
4. Follow the order details and transfer money from an account in your own name. Never write terms like “buy crypto” or “USDT” in the transfer note.
5. Once you’ve transferred the money, tap “I’ve Paid” right away. Wait for the merchant to release the crypto, and the USDT will go straight into your Funding Account.
If you already have crypto on another platform or in a wallet, use【On-chain Deposit】:
1. In the bottom-right corner of the app, tap “Assets” → “Deposit” → “Deposit Crypto.”
2. Select the coin (USDT) and the network—TRC20 is recommended for beginners because it’s fast and cheap.
3. Copy the address and go to the other platform to withdraw your crypto. Important: the networks on both sides must match exactly. If you choose the wrong network, your crypto will be lost and cannot be recovered.
4. Wait for the blockchain confirmation. It should arrive in 1–3 minutes.
Once it arrives: Transfer your USDT from your Funding Account to your Spot Account for free, and you can buy $BTC , $ETH , and $BNB .
My take: Nine times out of ten, beginners lose money not because they read the market wrong, but because they mess up the first step—choosing the wrong network and losing their crypto, getting scammed in a private transaction, or having their bank card frozen after writing “buy crypto” in the transfer note. C2C is essentially buying and selling with strangers, and the platform’s protection is your only safety net: never transfer money outside the platform, and always start with a small test transaction. Once you get this step right, everything else is easy.
Source: Compiled from the Binance app’s operating procedures; for informational purposes only and not investment advice.
How did you buy crypto for the first time? C2C or an on-chain transfer? I’ll keep sharing beginner tutorials like this, so follow me to stay in the loop.
Lesson one for beginners: Deposit your first USDT. After that, recurring buys, spot trading, and earning products will all be easier.
If you only have RMB, use【Buy Crypto (C2C)】:
1. On the Binance app home page, tap “Deposit” and select “Buy Crypto.”
2. Select USDT and enter an amount—start small the first time, with a few hundred yuan just to try it out.
3. Choose a payment method (bank card/Alipay/WeChat Pay), and pick a merchant with a high completion rate and a long verification history.
4. Follow the order details and transfer money from an account in your own name. Never write terms like “buy crypto” or “USDT” in the transfer note.
5. Once you’ve transferred the money, tap “I’ve Paid” right away. Wait for the merchant to release the crypto, and the USDT will go straight into your Funding Account.
If you already have crypto on another platform or in a wallet, use【On-chain Deposit】:
1. In the bottom-right corner of the app, tap “Assets” → “Deposit” → “Deposit Crypto.”
2. Select the coin (USDT) and the network—TRC20 is recommended for beginners because it’s fast and cheap.
3. Copy the address and go to the other platform to withdraw your crypto. Important: the networks on both sides must match exactly. If you choose the wrong network, your crypto will be lost and cannot be recovered.
4. Wait for the blockchain confirmation. It should arrive in 1–3 minutes.
Once it arrives: Transfer your USDT from your Funding Account to your Spot Account for free, and you can buy $BTC , $ETH , and $BNB .
My take: Nine times out of ten, beginners lose money not because they read the market wrong, but because they mess up the first step—choosing the wrong network and losing their crypto, getting scammed in a private transaction, or having their bank card frozen after writing “buy crypto” in the transfer note. C2C is essentially buying and selling with strangers, and the platform’s protection is your only safety net: never transfer money outside the platform, and always start with a small test transaction. Once you get this step right, everything else is easy.
Source: Compiled from the Binance app’s operating procedures; for informational purposes only and not investment advice.
How did you buy crypto for the first time? C2C or an on-chain transfer? I’ll keep sharing beginner tutorials like this, so follow me to stay in the loop.

279
·
--
Congress just killed the CLARITY Act, and the SEC turned around and approved the most highly leveraged crypto ETFs ever—a spectacle that’s half brake, half gas pedal.
On October 2, the SEC approved a rule change by Cboe BZX, clearing the way for six 3x leveraged ETFs from Volatility Shares: Bitcoin, Ethereum, gold, silver, crude oil, and natural gas. The Bitcoin ETF’s ticker is BITH, and the Ethereum ETF’s is ETHK.
Three key details:
① Until now, the leverage cap for U.S. crypto ETFs was just 2x. This approval raises it straight to 3x, tracking three times the daily gains or losses;
② They hold regulated futures, not spot assets. And their S-1 registration statement hasn’t yet become effective, so they can’t trade for now—and no listing date has been set;
③ The prospectus itself warns that these products aren’t suitable for ordinary investors, may be considered speculative, and carry the risk of losing your entire principal.
The takeaway: Balchunas summed it up in one line—leveraged ETFs are trading tools, not investment tools. Adam Back ran the numbers: if Bitcoin rises 10% and then falls 10%, spot investors lose just 1%, but a 3x fund loses 9%. That’s volatility drag caused by daily resets. Bitcoin has recently been seesawing between $85,000 and $87,000, and in a choppy market like this, a 3x product can be a slow-bleed machine.
Impact on $BTC $ETH : In the short term, the sentiment boost outweighs the substance—the products haven’t launched, so actual inflows are zero. Once they do launch, the funds will have to mechanically rebalance near the close each day (adding exposure when prices rise and cutting it when they fall). The larger the funds get, the more they could amplify volatility near the market close. Long-term holders can stick with spot ETFs; with a 3x product, holding it for a week is a very different proposition from holding it for a day.
Data as of: 2026-10-07 00:00 UTC
Sources: CoinDesk; CoinCentral
For informational purposes only; not investment advice.
#SECApproves3xLeveragedETFs
Would you try a 3x leveraged ETF? Let’s talk in the comments! I’ll keep following developments with these products, so follow along to stay in the loop.
Congress just killed the CLARITY Act, and the SEC turned around and approved the most highly leveraged crypto ETFs ever—a spectacle that’s half brake, half gas pedal.
On October 2, the SEC approved a rule change by Cboe BZX, clearing the way for six 3x leveraged ETFs from Volatility Shares: Bitcoin, Ethereum, gold, silver, crude oil, and natural gas. The Bitcoin ETF’s ticker is BITH, and the Ethereum ETF’s is ETHK.
Three key details:
① Until now, the leverage cap for U.S. crypto ETFs was just 2x. This approval raises it straight to 3x, tracking three times the daily gains or losses;
② They hold regulated futures, not spot assets. And their S-1 registration statement hasn’t yet become effective, so they can’t trade for now—and no listing date has been set;
③ The prospectus itself warns that these products aren’t suitable for ordinary investors, may be considered speculative, and carry the risk of losing your entire principal.
The takeaway: Balchunas summed it up in one line—leveraged ETFs are trading tools, not investment tools. Adam Back ran the numbers: if Bitcoin rises 10% and then falls 10%, spot investors lose just 1%, but a 3x fund loses 9%. That’s volatility drag caused by daily resets. Bitcoin has recently been seesawing between $85,000 and $87,000, and in a choppy market like this, a 3x product can be a slow-bleed machine.
Impact on $BTC $ETH : In the short term, the sentiment boost outweighs the substance—the products haven’t launched, so actual inflows are zero. Once they do launch, the funds will have to mechanically rebalance near the close each day (adding exposure when prices rise and cutting it when they fall). The larger the funds get, the more they could amplify volatility near the market close. Long-term holders can stick with spot ETFs; with a 3x product, holding it for a week is a very different proposition from holding it for a day.
Data as of: 2026-10-07 00:00 UTC
Sources: CoinDesk; CoinCentral
For informational purposes only; not investment advice.
#SECApproves3xLeveragedETFs
Would you try a 3x leveraged ETF? Let’s talk in the comments! I’ll keep following developments with these products, so follow along to stay in the loop.
On October 2, the SEC approved a rule change by Cboe BZX, clearing the way for six 3x leveraged ETFs from Volatility Shares: Bitcoin, Ethereum, gold, silver, crude oil, and natural gas. The Bitcoin ETF’s ticker is BITH, and the Ethereum ETF’s is ETHK.
Three key details:
① Until now, the leverage cap for U.S. crypto ETFs was just 2x. This approval raises it straight to 3x, tracking three times the daily gains or losses;
② They hold regulated futures, not spot assets. And their S-1 registration statement hasn’t yet become effective, so they can’t trade for now—and no listing date has been set;
③ The prospectus itself warns that these products aren’t suitable for ordinary investors, may be considered speculative, and carry the risk of losing your entire principal.
The takeaway: Balchunas summed it up in one line—leveraged ETFs are trading tools, not investment tools. Adam Back ran the numbers: if Bitcoin rises 10% and then falls 10%, spot investors lose just 1%, but a 3x fund loses 9%. That’s volatility drag caused by daily resets. Bitcoin has recently been seesawing between $85,000 and $87,000, and in a choppy market like this, a 3x product can be a slow-bleed machine.
Impact on $BTC $ETH : In the short term, the sentiment boost outweighs the substance—the products haven’t launched, so actual inflows are zero. Once they do launch, the funds will have to mechanically rebalance near the close each day (adding exposure when prices rise and cutting it when they fall). The larger the funds get, the more they could amplify volatility near the market close. Long-term holders can stick with spot ETFs; with a 3x product, holding it for a week is a very different proposition from holding it for a day.
Data as of: 2026-10-07 00:00 UTC
Sources: CoinDesk; CoinCentral
For informational purposes only; not investment advice.
#SECApproves3xLeveragedETFs
Would you try a 3x leveraged ETF? Let’s talk in the comments! I’ll keep following developments with these products, so follow along to stay in the loop.

184
·
--
Still watching the charts at 3 a.m.? You just haven’t set take-profit and stop-loss orders 😴
Many people place an order and focus only on buying, without deciding in advance “how much profit is enough” or “how much loss I’m willing to take.”
So they end up staying up all night to watch their profits—and if they can’t keep it up, those profits can disappear.
Binance Spot has a take-profit/stop-loss order designed to watch the charts for you:
1. In the app, go to “Trade” → “Spot.” Tap the switch in the order panel, then select “Take Profit/Stop Loss” from the dropdown.
2. Enter three values: trigger price (the price that activates the order), limit price (the price to use once it’s activated), and amount.
3. Before placing the order, carefully read the line of white text beneath it—the system will summarize your order logic in one sentence. If it doesn’t match what you want, make changes.
4. Once confirmed, you’ll see “Order placed successfully.” Note: a successfully placed order isn’t necessarily a successfully executed one. It will remain pending until the market reaches the trigger price.
For example, if you have 0.01 $BTC and want to protect your profits without staying up all night:
Set the trigger price at your comfort level, and leave a little room for slippage with the limit price.
Once it’s set, lock your phone and get some sleep.
My take: take-profit and stop-loss orders are really about building discipline into your orders.
People get tired watching the charts, their hands shake, and they get greedy. Orders don’t.
The same goes for Futures: go to the position page, tap “TP/SL” → “Add,” then enter the trigger price and order type.
Don’t gamble a full night’s sleep and the profits you worked hard to save on the luck of a single trade.
I’ll keep sharing practical tips like this, so follow me and stay in the loop.
Do you usually set your take-profit and stop-loss levels before placing an order? Let’s chat in the comments 👇
#TradingTips
Compiled with reference to relevant information from the Binance Help Center
Still watching the charts at 3 a.m.? You just haven’t set take-profit and stop-loss orders 😴
Many people place an order and focus only on buying, without deciding in advance “how much profit is enough” or “how much loss I’m willing to take.”
So they end up staying up all night to watch their profits—and if they can’t keep it up, those profits can disappear.
Binance Spot has a take-profit/stop-loss order designed to watch the charts for you:
1. In the app, go to “Trade” → “Spot.” Tap the switch in the order panel, then select “Take Profit/Stop Loss” from the dropdown.
2. Enter three values: trigger price (the price that activates the order), limit price (the price to use once it’s activated), and amount.
3. Before placing the order, carefully read the line of white text beneath it—the system will summarize your order logic in one sentence. If it doesn’t match what you want, make changes.
4. Once confirmed, you’ll see “Order placed successfully.” Note: a successfully placed order isn’t necessarily a successfully executed one. It will remain pending until the market reaches the trigger price.
For example, if you have 0.01 $BTC and want to protect your profits without staying up all night:
Set the trigger price at your comfort level, and leave a little room for slippage with the limit price.
Once it’s set, lock your phone and get some sleep.
My take: take-profit and stop-loss orders are really about building discipline into your orders.
People get tired watching the charts, their hands shake, and they get greedy. Orders don’t.
The same goes for Futures: go to the position page, tap “TP/SL” → “Add,” then enter the trigger price and order type.
Don’t gamble a full night’s sleep and the profits you worked hard to save on the luck of a single trade.
I’ll keep sharing practical tips like this, so follow me and stay in the loop.
Do you usually set your take-profit and stop-loss levels before placing an order? Let’s chat in the comments 👇
#TradingTips
Compiled with reference to relevant information from the Binance Help Center
Many people place an order and focus only on buying, without deciding in advance “how much profit is enough” or “how much loss I’m willing to take.”
So they end up staying up all night to watch their profits—and if they can’t keep it up, those profits can disappear.
Binance Spot has a take-profit/stop-loss order designed to watch the charts for you:
1. In the app, go to “Trade” → “Spot.” Tap the switch in the order panel, then select “Take Profit/Stop Loss” from the dropdown.
2. Enter three values: trigger price (the price that activates the order), limit price (the price to use once it’s activated), and amount.
3. Before placing the order, carefully read the line of white text beneath it—the system will summarize your order logic in one sentence. If it doesn’t match what you want, make changes.
4. Once confirmed, you’ll see “Order placed successfully.” Note: a successfully placed order isn’t necessarily a successfully executed one. It will remain pending until the market reaches the trigger price.
For example, if you have 0.01 $BTC and want to protect your profits without staying up all night:
Set the trigger price at your comfort level, and leave a little room for slippage with the limit price.
Once it’s set, lock your phone and get some sleep.
My take: take-profit and stop-loss orders are really about building discipline into your orders.
People get tired watching the charts, their hands shake, and they get greedy. Orders don’t.
The same goes for Futures: go to the position page, tap “TP/SL” → “Add,” then enter the trigger price and order type.
Don’t gamble a full night’s sleep and the profits you worked hard to save on the luck of a single trade.
I’ll keep sharing practical tips like this, so follow me and stay in the loop.
Do you usually set your take-profit and stop-loss levels before placing an order? Let’s chat in the comments 👇
#TradingTips
Compiled with reference to relevant information from the Binance Help Center

33
·
--
Just three months ago, Citi slashed its BTC price target to $82,000. Now it’s raised it back to $113,000—is Citi making these predictions with an eraser? 📝
Citi Group analyst Alex Saunders raised the 12-month BTC price target from $82,000 to $113,000. The ETH target also went up, from $2,240 to $3,028. The reasons given were market activity, the macro environment (concerns about currency debasement and new SEC regulatory developments), and ETF flows. Citi expects net inflows of $5 billion into BTC ETFs over the next 12 months.
What’s interesting is that in a report at the end of June, Citi had just cut its BTC target from $112,000 to $82,000 and lowered its ETF inflow forecast from $10 billion to zero—when BTC was still hovering around $59,000. In three months, BTC rose more than 40% in Q3, marking the first “all-green Q3” in history, and the price target was raised right back up.
Here’s a counterintuitive detail: on the day the upgraded forecast was published (September 30), U.S. spot BTC ETFs actually saw net outflows of $149 million. The bullish call and fund flows were moving in opposite directions that day.
My take:
Take bank price targets with a grain of salt, and definitely don’t use them as a basis for trading—they can change twice in three months, and you can’t keep changing your strategy to match. What’s really worth watching isn’t the $113,000 figure, but the three judgments behind it: whether ETF funds are actually flowing back in, whether institutions are increasing their allocations, and whether BTC can hold above its 200-day moving average. The price target is free; the real data is in those factors. BTC is currently grinding around $86,000, having tested and fallen back from $86,500 three times. Let’s talk about a breakout if one happens; until then, this kind of “price target news” is just seasoning for sentiment—have a taste, but don’t mistake it for a meal.
Data as of: 2026-10-06 23:00 UTC
Sources: MarketWatch; Hindustan Times
For informational purposes only; not investment advice.
$BTC $ETH
#CitiRaisesBitcoinPriceTarget
I’ll keep following these kinds of institutional forecasts, so follow me to stay in the loop. Do you trust price targets from big banks?
Just three months ago, Citi slashed its BTC price target to $82,000. Now it’s raised it back to $113,000—is Citi making these predictions with an eraser? 📝
Citi Group analyst Alex Saunders raised the 12-month BTC price target from $82,000 to $113,000. The ETH target also went up, from $2,240 to $3,028. The reasons given were market activity, the macro environment (concerns about currency debasement and new SEC regulatory developments), and ETF flows. Citi expects net inflows of $5 billion into BTC ETFs over the next 12 months.
What’s interesting is that in a report at the end of June, Citi had just cut its BTC target from $112,000 to $82,000 and lowered its ETF inflow forecast from $10 billion to zero—when BTC was still hovering around $59,000. In three months, BTC rose more than 40% in Q3, marking the first “all-green Q3” in history, and the price target was raised right back up.
Here’s a counterintuitive detail: on the day the upgraded forecast was published (September 30), U.S. spot BTC ETFs actually saw net outflows of $149 million. The bullish call and fund flows were moving in opposite directions that day.
My take:
Take bank price targets with a grain of salt, and definitely don’t use them as a basis for trading—they can change twice in three months, and you can’t keep changing your strategy to match. What’s really worth watching isn’t the $113,000 figure, but the three judgments behind it: whether ETF funds are actually flowing back in, whether institutions are increasing their allocations, and whether BTC can hold above its 200-day moving average. The price target is free; the real data is in those factors. BTC is currently grinding around $86,000, having tested and fallen back from $86,500 three times. Let’s talk about a breakout if one happens; until then, this kind of “price target news” is just seasoning for sentiment—have a taste, but don’t mistake it for a meal.
Data as of: 2026-10-06 23:00 UTC
Sources: MarketWatch; Hindustan Times
For informational purposes only; not investment advice.
$BTC $ETH
#CitiRaisesBitcoinPriceTarget
I’ll keep following these kinds of institutional forecasts, so follow me to stay in the loop. Do you trust price targets from big banks?
Citi Group analyst Alex Saunders raised the 12-month BTC price target from $82,000 to $113,000. The ETH target also went up, from $2,240 to $3,028. The reasons given were market activity, the macro environment (concerns about currency debasement and new SEC regulatory developments), and ETF flows. Citi expects net inflows of $5 billion into BTC ETFs over the next 12 months.
What’s interesting is that in a report at the end of June, Citi had just cut its BTC target from $112,000 to $82,000 and lowered its ETF inflow forecast from $10 billion to zero—when BTC was still hovering around $59,000. In three months, BTC rose more than 40% in Q3, marking the first “all-green Q3” in history, and the price target was raised right back up.
Here’s a counterintuitive detail: on the day the upgraded forecast was published (September 30), U.S. spot BTC ETFs actually saw net outflows of $149 million. The bullish call and fund flows were moving in opposite directions that day.
My take:
Take bank price targets with a grain of salt, and definitely don’t use them as a basis for trading—they can change twice in three months, and you can’t keep changing your strategy to match. What’s really worth watching isn’t the $113,000 figure, but the three judgments behind it: whether ETF funds are actually flowing back in, whether institutions are increasing their allocations, and whether BTC can hold above its 200-day moving average. The price target is free; the real data is in those factors. BTC is currently grinding around $86,000, having tested and fallen back from $86,500 three times. Let’s talk about a breakout if one happens; until then, this kind of “price target news” is just seasoning for sentiment—have a taste, but don’t mistake it for a meal.
Data as of: 2026-10-06 23:00 UTC
Sources: MarketWatch; Hindustan Times
For informational purposes only; not investment advice.
$BTC $ETH
#CitiRaisesBitcoinPriceTarget
I’ll keep following these kinds of institutional forecasts, so follow me to stay in the loop. Do you trust price targets from big banks?

78
·
--
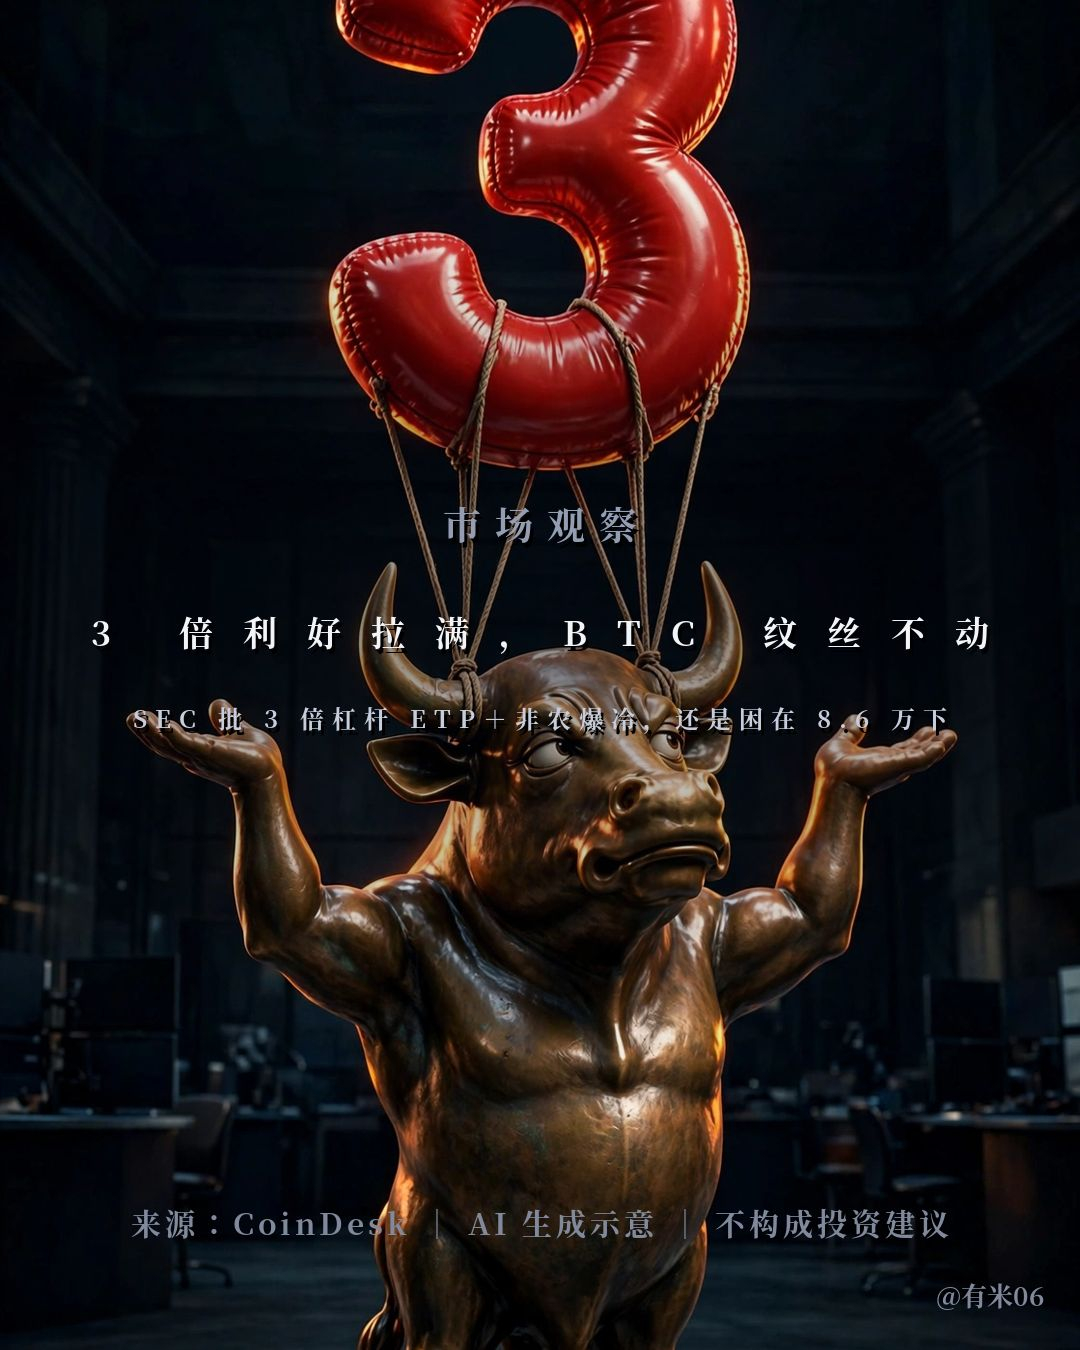
Three bullish catalysts in a row, and BTC says: “I’m sitting this one out.”
On October 2, the market got two pieces of “textbook bullish news” on the same day:
1⃣ The SEC approved the listing on Cboe of six 3x leveraged ETPs issued by Volatility Shares’ VS Trust. They include the first-ever 3x BTC/ETH products in the U.S. (provisionally tickered BITH and ETHK), plus four others linked to gold, silver, crude oil, and natural gas. The products track CME futures and aim to deliver 3x the daily return.
2⃣ U.S. September nonfarm payrolls came in much weaker than expected: only 29,000 jobs were added (versus expectations of 80,000–90,000), the unemployment rate rose to 4.2%, and the July/August total was revised down by 60,000. The odds of another rate hike in October plunged from 66% to just over 20%, while the 10-year U.S. Treasury yield fell back to 5.17%.
By textbook logic, rising rate-cut expectations plus the opening of the door to leveraged products should send BTC soaring. But what happened? BTC is still stuck below 86,000. Its third attempt to break 87,000 failed, and bulls and bears are still locked in a tug-of-war.
My take: the market is becoming increasingly numb to “paper positives.” Let me pour some cold water on this. First, the 3x ETPs have only been approved for listing; their registration statements aren’t effective yet, so they can’t actually be bought—and they haven’t brought in any real buying pressure. Second, leveraged ETPs are trading tools, not investments. Bloomberg analyst Balchunas has long warned that they rebalance daily, and holding them for too long can let volatility eat away most of your gains (if the underlying rises 10% and then falls 10%, a 3x product loses 9% net; in a sideways market, it’s a slow bleed).
The real signal isn’t in approval headlines—it’s in the money: watch daily net ETF flows and the FOMC’s decision on October 28. In a rate-hiking cycle, liquidity is the only real hard currency. Until actual money flows in, chasing rallies in a range-bound market usually isn’t a high-probability trade.
I’ll keep following the intersection of macro trends and regulation. Follow me to stay in the loop. Do you think BTC can get back to 100,000 before year-end?
$BTC $ETH
#BitcoinStuckBelow86K
Data as of: 2026-10-06 22:00 UTC
Sources: CoinDesk; The Agent Times
For informational purposes only; not investment advice.
Three bullish catalysts in a row, and BTC says: “I’m sitting this one out.”
On October 2, the market got two pieces of “textbook bullish news” on the same day:
1⃣ The SEC approved the listing on Cboe of six 3x leveraged ETPs issued by Volatility Shares’ VS Trust. They include the first-ever 3x BTC/ETH products in the U.S. (provisionally tickered BITH and ETHK), plus four others linked to gold, silver, crude oil, and natural gas. The products track CME futures and aim to deliver 3x the daily return.
2⃣ U.S. September nonfarm payrolls came in much weaker than expected: only 29,000 jobs were added (versus expectations of 80,000–90,000), the unemployment rate rose to 4.2%, and the July/August total was revised down by 60,000. The odds of another rate hike in October plunged from 66% to just over 20%, while the 10-year U.S. Treasury yield fell back to 5.17%.
By textbook logic, rising rate-cut expectations plus the opening of the door to leveraged products should send BTC soaring. But what happened? BTC is still stuck below 86,000. Its third attempt to break 87,000 failed, and bulls and bears are still locked in a tug-of-war.
My take: the market is becoming increasingly numb to “paper positives.” Let me pour some cold water on this. First, the 3x ETPs have only been approved for listing; their registration statements aren’t effective yet, so they can’t actually be bought—and they haven’t brought in any real buying pressure. Second, leveraged ETPs are trading tools, not investments. Bloomberg analyst Balchunas has long warned that they rebalance daily, and holding them for too long can let volatility eat away most of your gains (if the underlying rises 10% and then falls 10%, a 3x product loses 9% net; in a sideways market, it’s a slow bleed).
The real signal isn’t in approval headlines—it’s in the money: watch daily net ETF flows and the FOMC’s decision on October 28. In a rate-hiking cycle, liquidity is the only real hard currency. Until actual money flows in, chasing rallies in a range-bound market usually isn’t a high-probability trade.
I’ll keep following the intersection of macro trends and regulation. Follow me to stay in the loop. Do you think BTC can get back to 100,000 before year-end?
$BTC $ETH
#BitcoinStuckBelow86K
Data as of: 2026-10-06 22:00 UTC
Sources: CoinDesk; The Agent Times
For informational purposes only; not investment advice.
On October 2, the market got two pieces of “textbook bullish news” on the same day:
1⃣ The SEC approved the listing on Cboe of six 3x leveraged ETPs issued by Volatility Shares’ VS Trust. They include the first-ever 3x BTC/ETH products in the U.S. (provisionally tickered BITH and ETHK), plus four others linked to gold, silver, crude oil, and natural gas. The products track CME futures and aim to deliver 3x the daily return.
2⃣ U.S. September nonfarm payrolls came in much weaker than expected: only 29,000 jobs were added (versus expectations of 80,000–90,000), the unemployment rate rose to 4.2%, and the July/August total was revised down by 60,000. The odds of another rate hike in October plunged from 66% to just over 20%, while the 10-year U.S. Treasury yield fell back to 5.17%.
By textbook logic, rising rate-cut expectations plus the opening of the door to leveraged products should send BTC soaring. But what happened? BTC is still stuck below 86,000. Its third attempt to break 87,000 failed, and bulls and bears are still locked in a tug-of-war.
My take: the market is becoming increasingly numb to “paper positives.” Let me pour some cold water on this. First, the 3x ETPs have only been approved for listing; their registration statements aren’t effective yet, so they can’t actually be bought—and they haven’t brought in any real buying pressure. Second, leveraged ETPs are trading tools, not investments. Bloomberg analyst Balchunas has long warned that they rebalance daily, and holding them for too long can let volatility eat away most of your gains (if the underlying rises 10% and then falls 10%, a 3x product loses 9% net; in a sideways market, it’s a slow bleed).
The real signal isn’t in approval headlines—it’s in the money: watch daily net ETF flows and the FOMC’s decision on October 28. In a rate-hiking cycle, liquidity is the only real hard currency. Until actual money flows in, chasing rallies in a range-bound market usually isn’t a high-probability trade.
I’ll keep following the intersection of macro trends and regulation. Follow me to stay in the loop. Do you think BTC can get back to 100,000 before year-end?
$BTC $ETH
#BitcoinStuckBelow86K
Data as of: 2026-10-06 22:00 UTC
Sources: CoinDesk; The Agent Times
For informational purposes only; not investment advice.
1
242
·
--
【At 2 a.m. tonight, global markets will be waiting for the minutes】$BTC
At 2 a.m. Beijing time tonight (October 7 at 14:00 Eastern Time), the Fed will release the minutes of its September 15–16 FOMC meeting.
This was the meeting on September 16 when the Fed decided to raise rates by 25 basis points, bringing them to 3.75%–4.00%—its first rate hike since July 2023. Markets still haven’t figured out what the Fed is really thinking. The minutes will need to answer three questions:
1️⃣ Which is the bigger risk in officials’ eyes: inflation or employment?
2️⃣ Was the interest-rate level at the time restrictive enough to bring inflation down?
3⃣ Will rates be raised again on October 28 and in December?
CME FedWatch data for October 6: the probability of rates remaining unchanged in October is 75.9%, while the probability of another 25 bp hike is 24.1%; the probability of a cumulative additional 25 bp hike by December is about 67%.
My take: This is BTC’s most vulnerable 24-hour period in the rate-hiking cycle. BTC failed in its third attempt to break $87,000 and is now hovering around $86,000. The dot plot shows that 16 of the 19 officials expect another hike this year. Tonight will probably play out in one of three ways:
📍 Hawkish: The minutes mention that several officials see inflation as the primary risk and discuss further action in October → rate-hike bets rise → BTC tests support at $84,000
📍 Dovish: Officials are more concerned about employment and economic growth → expectations of a rate-hike pause firm up → BTC may challenge resistance at $87,000 again
📍 Uneventful: The minutes offer no new information → the event passes, volatility subsides, and markets continue waiting for October’s CPI
Whichever way it goes, volatility will be amplified in the minute the minutes are released. Managing risk is more important than guessing the direction.
Data as of: 2026-10-06 21:25 UTC
Sources: CME FedWatch (October 6 data); Schwab Network, “Week Ahead: FOMC Minutes Kick Off Final Quarter of 2026”
For informational purposes only; not investment advice.
#FOMCMinutes
I’ll continue tracking macro data like this—follow me to stay in the loop.
Will you stay up tonight to wait for the minutes?
【At 2 a.m. tonight, global markets will be waiting for the minutes】$BTC
At 2 a.m. Beijing time tonight (October 7 at 14:00 Eastern Time), the Fed will release the minutes of its September 15–16 FOMC meeting.
This was the meeting on September 16 when the Fed decided to raise rates by 25 basis points, bringing them to 3.75%–4.00%—its first rate hike since July 2023. Markets still haven’t figured out what the Fed is really thinking. The minutes will need to answer three questions:
1️⃣ Which is the bigger risk in officials’ eyes: inflation or employment?
2️⃣ Was the interest-rate level at the time restrictive enough to bring inflation down?
3⃣ Will rates be raised again on October 28 and in December?
CME FedWatch data for October 6: the probability of rates remaining unchanged in October is 75.9%, while the probability of another 25 bp hike is 24.1%; the probability of a cumulative additional 25 bp hike by December is about 67%.
My take: This is BTC’s most vulnerable 24-hour period in the rate-hiking cycle. BTC failed in its third attempt to break $87,000 and is now hovering around $86,000. The dot plot shows that 16 of the 19 officials expect another hike this year. Tonight will probably play out in one of three ways:
📍 Hawkish: The minutes mention that several officials see inflation as the primary risk and discuss further action in October → rate-hike bets rise → BTC tests support at $84,000
📍 Dovish: Officials are more concerned about employment and economic growth → expectations of a rate-hike pause firm up → BTC may challenge resistance at $87,000 again
📍 Uneventful: The minutes offer no new information → the event passes, volatility subsides, and markets continue waiting for October’s CPI
Whichever way it goes, volatility will be amplified in the minute the minutes are released. Managing risk is more important than guessing the direction.
Data as of: 2026-10-06 21:25 UTC
Sources: CME FedWatch (October 6 data); Schwab Network, “Week Ahead: FOMC Minutes Kick Off Final Quarter of 2026”
For informational purposes only; not investment advice.
#FOMCMinutes
I’ll continue tracking macro data like this—follow me to stay in the loop.
Will you stay up tonight to wait for the minutes?
At 2 a.m. Beijing time tonight (October 7 at 14:00 Eastern Time), the Fed will release the minutes of its September 15–16 FOMC meeting.
This was the meeting on September 16 when the Fed decided to raise rates by 25 basis points, bringing them to 3.75%–4.00%—its first rate hike since July 2023. Markets still haven’t figured out what the Fed is really thinking. The minutes will need to answer three questions:
1️⃣ Which is the bigger risk in officials’ eyes: inflation or employment?
2️⃣ Was the interest-rate level at the time restrictive enough to bring inflation down?
3⃣ Will rates be raised again on October 28 and in December?
CME FedWatch data for October 6: the probability of rates remaining unchanged in October is 75.9%, while the probability of another 25 bp hike is 24.1%; the probability of a cumulative additional 25 bp hike by December is about 67%.
My take: This is BTC’s most vulnerable 24-hour period in the rate-hiking cycle. BTC failed in its third attempt to break $87,000 and is now hovering around $86,000. The dot plot shows that 16 of the 19 officials expect another hike this year. Tonight will probably play out in one of three ways:
📍 Hawkish: The minutes mention that several officials see inflation as the primary risk and discuss further action in October → rate-hike bets rise → BTC tests support at $84,000
📍 Dovish: Officials are more concerned about employment and economic growth → expectations of a rate-hike pause firm up → BTC may challenge resistance at $87,000 again
📍 Uneventful: The minutes offer no new information → the event passes, volatility subsides, and markets continue waiting for October’s CPI
Whichever way it goes, volatility will be amplified in the minute the minutes are released. Managing risk is more important than guessing the direction.
Data as of: 2026-10-06 21:25 UTC
Sources: CME FedWatch (October 6 data); Schwab Network, “Week Ahead: FOMC Minutes Kick Off Final Quarter of 2026”
For informational purposes only; not investment advice.
#FOMCMinutes
I’ll continue tracking macro data like this—follow me to stay in the loop.
Will you stay up tonight to wait for the minutes?

38
·
--
Sideways markets are the most frustrating: chase a rally and get stuck holding the bag; buy the dip and get buried. But there’s a strategy that thrives on this kind of volatility.
Binance Spot Grid Trading—you set a price range and the number of grids, and it automatically buys low and sells high. No need to watch the charts.
Set one up in 5 steps (on the app):
1. Open the app and tap →→→
2. Choose a trading pair, such as BTC/USDT
3. Choose a parameter mode: generate parameters automatically, copy a successful strategy, or set arithmetic/geometric grids yourself
4. Enter the price range (highest/lowest price), number of grids, and investment amount
5. Review the order details, tap →, and you can watch it go to work in
My take: Grid trading works best when you can’t tell which way the market is headed but expect it to move sideways—for example, BTC has been ranging between 83,000 and 87,000 over the past few weeks. Its profits come from the number of price swings, not market direction. A big one-way rally or sell-off is actually the toughest scenario: set the range too narrow and the price can leave you behind; set it too wide and your capital is less efficiently used. If you’re new, try AI-generated parameters with a small amount for a week and see how much fees eat into your returns. Every grid trade incurs spot trading fees, so grids that are too dense are basically doing the exchange’s work for it.
⚠️ Grid trading isn’t guaranteed profit: if the price falls below the lower limit, you could be left holding a pile of coins; if it breaks above the upper limit, you could miss out. Start small—don’t go all in from the beginning.
I’ll keep sharing practical tutorials like this, so follow me to stay in the loop.
Have you tried grid trading? What percentage of your returns went to fees?
$BTC
Source: Compiled from Binance’s official help documentation
Sideways markets are the most frustrating: chase a rally and get stuck holding the bag; buy the dip and get buried. But there’s a strategy that thrives on this kind of volatility.
Binance Spot Grid Trading—you set a price range and the number of grids, and it automatically buys low and sells high. No need to watch the charts.
Set one up in 5 steps (on the app):
1. Open the app and tap →→→
2. Choose a trading pair, such as BTC/USDT
3. Choose a parameter mode: generate parameters automatically, copy a successful strategy, or set arithmetic/geometric grids yourself
4. Enter the price range (highest/lowest price), number of grids, and investment amount
5. Review the order details, tap →, and you can watch it go to work in
My take: Grid trading works best when you can’t tell which way the market is headed but expect it to move sideways—for example, BTC has been ranging between 83,000 and 87,000 over the past few weeks. Its profits come from the number of price swings, not market direction. A big one-way rally or sell-off is actually the toughest scenario: set the range too narrow and the price can leave you behind; set it too wide and your capital is less efficiently used. If you’re new, try AI-generated parameters with a small amount for a week and see how much fees eat into your returns. Every grid trade incurs spot trading fees, so grids that are too dense are basically doing the exchange’s work for it.
⚠️ Grid trading isn’t guaranteed profit: if the price falls below the lower limit, you could be left holding a pile of coins; if it breaks above the upper limit, you could miss out. Start small—don’t go all in from the beginning.
I’ll keep sharing practical tutorials like this, so follow me to stay in the loop.
Have you tried grid trading? What percentage of your returns went to fees?
$BTC
Source: Compiled from Binance’s official help documentation
Binance Spot Grid Trading—you set a price range and the number of grids, and it automatically buys low and sells high. No need to watch the charts.
Set one up in 5 steps (on the app):
1. Open the app and tap →→→
2. Choose a trading pair, such as BTC/USDT
3. Choose a parameter mode: generate parameters automatically, copy a successful strategy, or set arithmetic/geometric grids yourself
4. Enter the price range (highest/lowest price), number of grids, and investment amount
5. Review the order details, tap →, and you can watch it go to work in
My take: Grid trading works best when you can’t tell which way the market is headed but expect it to move sideways—for example, BTC has been ranging between 83,000 and 87,000 over the past few weeks. Its profits come from the number of price swings, not market direction. A big one-way rally or sell-off is actually the toughest scenario: set the range too narrow and the price can leave you behind; set it too wide and your capital is less efficiently used. If you’re new, try AI-generated parameters with a small amount for a week and see how much fees eat into your returns. Every grid trade incurs spot trading fees, so grids that are too dense are basically doing the exchange’s work for it.
⚠️ Grid trading isn’t guaranteed profit: if the price falls below the lower limit, you could be left holding a pile of coins; if it breaks above the upper limit, you could miss out. Start small—don’t go all in from the beginning.
I’ll keep sharing practical tutorials like this, so follow me to stay in the loop.
Have you tried grid trading? What percentage of your returns went to fees?
$BTC
Source: Compiled from Binance’s official help documentation

24
·
--
Three shares become one—sounds like a warning sign of a 50% plunge? BlackRock just did exactly that yesterday.
On October 6, BlackRock carried out a 1-for-3 reverse split of its spot Ethereum ETF (ETHA): every three shares were consolidated into one, tripling the net asset value per share. The total market value held by investors and the fund’s assets remained exactly the same, while shareholdings were automatically adjusted by brokers based on the October 5 record date.
Bloomberg senior ETF analyst Eric Balchunas spelled out the reason: ETHA is down about 40% year to date, leaving each share worth just around $14 before the split. Market makers’ spreads had become too large a share of trading volume. After the consolidation, the price per share is back above $40, and trading costs could drop from 7 basis points to about 2. Put simply: this isn’t about fleecing investors—it’s about clearing the way for big money to come in.
My take: A reverse split doesn’t change the value by a single cent, but the signal it sends is real—BlackRock believes that a leading product like ETHA is worth making more cost-efficient to trade over the long term. Grayscale pulled the same move with its Mini Trust in 2024. The real thing to watch isn’t the split, but the fund flows afterward: on Monday, spot ETH ETFs saw net outflows for the fifth consecutive day, totaling more than $200 million. Institutional wallets are telling the truth; the split just makes the on-ramp smoother.
Data as of: 2026-10-06 20:00 UTC
Sources: Odaily (citing The Block); Cryptonomist (citing an SEC 8-K filing); Cointelegraph
For informational purposes only; not investment advice.
$ETH
#BlackRockEthereumETFReverseSplit
Do you usually pay attention to ETF fund flows, or do you just watch the price of the coin itself?
Three shares become one—sounds like a warning sign of a 50% plunge? BlackRock just did exactly that yesterday.
On October 6, BlackRock carried out a 1-for-3 reverse split of its spot Ethereum ETF (ETHA): every three shares were consolidated into one, tripling the net asset value per share. The total market value held by investors and the fund’s assets remained exactly the same, while shareholdings were automatically adjusted by brokers based on the October 5 record date.
Bloomberg senior ETF analyst Eric Balchunas spelled out the reason: ETHA is down about 40% year to date, leaving each share worth just around $14 before the split. Market makers’ spreads had become too large a share of trading volume. After the consolidation, the price per share is back above $40, and trading costs could drop from 7 basis points to about 2. Put simply: this isn’t about fleecing investors—it’s about clearing the way for big money to come in.
My take: A reverse split doesn’t change the value by a single cent, but the signal it sends is real—BlackRock believes that a leading product like ETHA is worth making more cost-efficient to trade over the long term. Grayscale pulled the same move with its Mini Trust in 2024. The real thing to watch isn’t the split, but the fund flows afterward: on Monday, spot ETH ETFs saw net outflows for the fifth consecutive day, totaling more than $200 million. Institutional wallets are telling the truth; the split just makes the on-ramp smoother.
Data as of: 2026-10-06 20:00 UTC
Sources: Odaily (citing The Block); Cryptonomist (citing an SEC 8-K filing); Cointelegraph
For informational purposes only; not investment advice.
$ETH
#BlackRockEthereumETFReverseSplit
Do you usually pay attention to ETF fund flows, or do you just watch the price of the coin itself?
On October 6, BlackRock carried out a 1-for-3 reverse split of its spot Ethereum ETF (ETHA): every three shares were consolidated into one, tripling the net asset value per share. The total market value held by investors and the fund’s assets remained exactly the same, while shareholdings were automatically adjusted by brokers based on the October 5 record date.
Bloomberg senior ETF analyst Eric Balchunas spelled out the reason: ETHA is down about 40% year to date, leaving each share worth just around $14 before the split. Market makers’ spreads had become too large a share of trading volume. After the consolidation, the price per share is back above $40, and trading costs could drop from 7 basis points to about 2. Put simply: this isn’t about fleecing investors—it’s about clearing the way for big money to come in.
My take: A reverse split doesn’t change the value by a single cent, but the signal it sends is real—BlackRock believes that a leading product like ETHA is worth making more cost-efficient to trade over the long term. Grayscale pulled the same move with its Mini Trust in 2024. The real thing to watch isn’t the split, but the fund flows afterward: on Monday, spot ETH ETFs saw net outflows for the fifth consecutive day, totaling more than $200 million. Institutional wallets are telling the truth; the split just makes the on-ramp smoother.
Data as of: 2026-10-06 20:00 UTC
Sources: Odaily (citing The Block); Cryptonomist (citing an SEC 8-K filing); Cointelegraph
For informational purposes only; not investment advice.
$ETH
#BlackRockEthereumETFReverseSplit
Do you usually pay attention to ETF fund flows, or do you just watch the price of the coin itself?
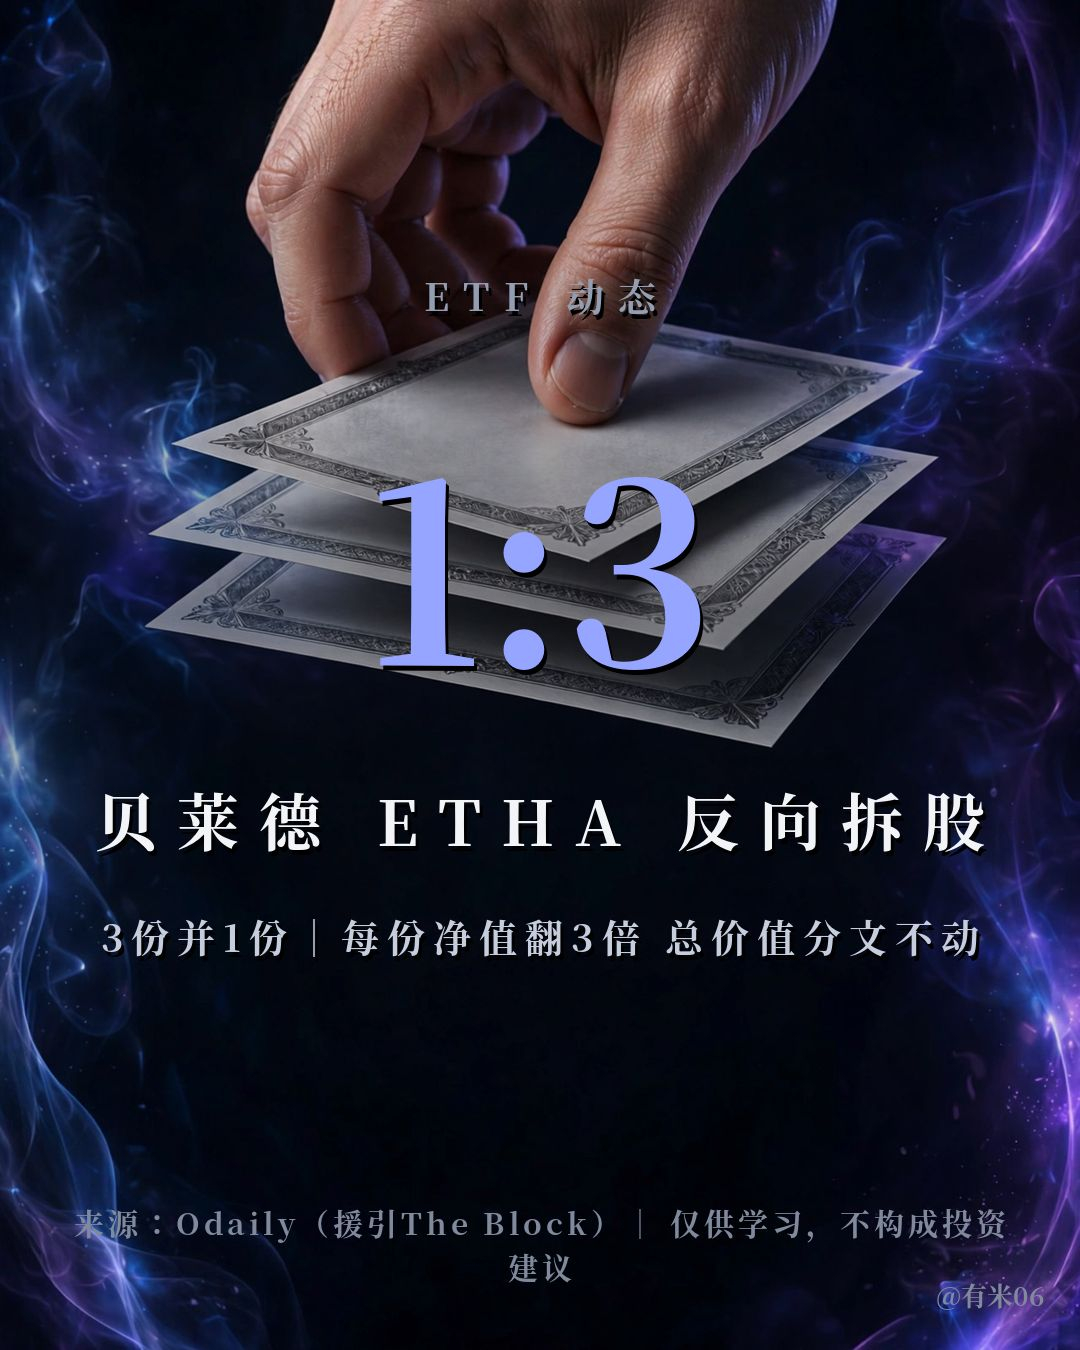
ETH-2.91%
ETHAETF-2.82%
153
·
--
A publicly listed company is buying up ETH to reach “Alchemy of 5%” of the total supply.
BitMine disclosed on October 5 that it bought another 15,112 ETH over the past week, bringing its total holdings to 6,016,414 ETH, worth about $16.4 billion at current prices. Based on a total supply of 122.1 million ETH, that’s 4.9% held by a single company.
They’re now just 0.1 percentage points away from their self-set “Alchemy of 5%” goal.
A few key details:
1. Buying every week: Since launching its ETH treasury strategy on June 30, 2025, it has “bought every single week.” The company says no other publicly listed company can match this streak.
2. Most of it is “put to work”: 84% of its holdings (about 5.067 million ETH) has been staked, earning an annualized yield of about 2.63%—roughly $360 million a year based on the amount staked.
3. The balance sheet: Crypto, cash, marketable securities, and strategic investments total $17.4 billion.
What do you make of it?
The treasury-company strategy of “buying a fixed amount every week and staking a large share” essentially removes ETH from the circulating supply in a systematic way: they buy it and lock it up through staking, leaving less ETH available to trade on the market. That’s a completely different approach from retail investors chasing a rally: one accumulates according to a plan, the other jumps in on a gut feeling.
But there’s another side to consider: the more concentrated ownership becomes, the more a single entity’s actions can move the market. And stocks like BMNR have their own premium fluctuations—crypto and stocks are not the same thing. Institutions have their own reasons for accumulating crypto, so weigh your own position carefully before copying their playbook.
Data as of: 2026-10-04 22:30 UTC
Source: BitMine official press release; Wu Blockchain
#Ethereum
$ETH
For informational purposes only; not investment advice.
I’ll continue tracking institutional holdings like these. Follow me to stay in the loop.
Do you think one company holding 5% of the ETH supply is a long-term positive or a potential risk?
A publicly listed company is buying up ETH to reach “Alchemy of 5%” of the total supply.
BitMine disclosed on October 5 that it bought another 15,112 ETH over the past week, bringing its total holdings to 6,016,414 ETH, worth about $16.4 billion at current prices. Based on a total supply of 122.1 million ETH, that’s 4.9% held by a single company.
They’re now just 0.1 percentage points away from their self-set “Alchemy of 5%” goal.
A few key details:
1. Buying every week: Since launching its ETH treasury strategy on June 30, 2025, it has “bought every single week.” The company says no other publicly listed company can match this streak.
2. Most of it is “put to work”: 84% of its holdings (about 5.067 million ETH) has been staked, earning an annualized yield of about 2.63%—roughly $360 million a year based on the amount staked.
3. The balance sheet: Crypto, cash, marketable securities, and strategic investments total $17.4 billion.
What do you make of it?
The treasury-company strategy of “buying a fixed amount every week and staking a large share” essentially removes ETH from the circulating supply in a systematic way: they buy it and lock it up through staking, leaving less ETH available to trade on the market. That’s a completely different approach from retail investors chasing a rally: one accumulates according to a plan, the other jumps in on a gut feeling.
But there’s another side to consider: the more concentrated ownership becomes, the more a single entity’s actions can move the market. And stocks like BMNR have their own premium fluctuations—crypto and stocks are not the same thing. Institutions have their own reasons for accumulating crypto, so weigh your own position carefully before copying their playbook.
Data as of: 2026-10-04 22:30 UTC
Source: BitMine official press release; Wu Blockchain
#Ethereum
$ETH
For informational purposes only; not investment advice.
I’ll continue tracking institutional holdings like these. Follow me to stay in the loop.
Do you think one company holding 5% of the ETH supply is a long-term positive or a potential risk?
BitMine disclosed on October 5 that it bought another 15,112 ETH over the past week, bringing its total holdings to 6,016,414 ETH, worth about $16.4 billion at current prices. Based on a total supply of 122.1 million ETH, that’s 4.9% held by a single company.
They’re now just 0.1 percentage points away from their self-set “Alchemy of 5%” goal.
A few key details:
1. Buying every week: Since launching its ETH treasury strategy on June 30, 2025, it has “bought every single week.” The company says no other publicly listed company can match this streak.
2. Most of it is “put to work”: 84% of its holdings (about 5.067 million ETH) has been staked, earning an annualized yield of about 2.63%—roughly $360 million a year based on the amount staked.
3. The balance sheet: Crypto, cash, marketable securities, and strategic investments total $17.4 billion.
What do you make of it?
The treasury-company strategy of “buying a fixed amount every week and staking a large share” essentially removes ETH from the circulating supply in a systematic way: they buy it and lock it up through staking, leaving less ETH available to trade on the market. That’s a completely different approach from retail investors chasing a rally: one accumulates according to a plan, the other jumps in on a gut feeling.
But there’s another side to consider: the more concentrated ownership becomes, the more a single entity’s actions can move the market. And stocks like BMNR have their own premium fluctuations—crypto and stocks are not the same thing. Institutions have their own reasons for accumulating crypto, so weigh your own position carefully before copying their playbook.
Data as of: 2026-10-04 22:30 UTC
Source: BitMine official press release; Wu Blockchain
#Ethereum
$ETH
For informational purposes only; not investment advice.
I’ll continue tracking institutional holdings like these. Follow me to stay in the loop.
Do you think one company holding 5% of the ETH supply is a long-term positive or a potential risk?

8
·
--
When I went home for National Day this year, my aunt finally couldn’t hold back and asked: “That blockchain thing of yours… isn’t it just a pyramid scheme?”
I spent ten minutes explaining decentralization, smart contracts, Bitcoin…
She nodded as if she sort of understood, then patted me on the shoulder and said:
“It’s okay. Young people make mistakes. Just don’t borrow money.”
Well, she summed it up better than I did.
Jokes aside, what my family worries about is exactly what this industry lacks most: someone to hit the brakes for you.
In a bull market, when your feed is full of people showing off their gains, the most dangerous thing isn’t volatility—it’s starting to think you can’t be wrong.
So every time I go home and get “lectured,” I come back with a clearer head: manage your position size, stay away from leverage, and keep your living expenses out of the market.
Does your family know you trade crypto? What’s the most classic thing they’ve said?
Source: An original joke, adapted from a real family visit 😂
#NationalDay
When I went home for National Day this year, my aunt finally couldn’t hold back and asked: “That blockchain thing of yours… isn’t it just a pyramid scheme?”
I spent ten minutes explaining decentralization, smart contracts, Bitcoin…
She nodded as if she sort of understood, then patted me on the shoulder and said:
“It’s okay. Young people make mistakes. Just don’t borrow money.”
Well, she summed it up better than I did.
Jokes aside, what my family worries about is exactly what this industry lacks most: someone to hit the brakes for you.
In a bull market, when your feed is full of people showing off their gains, the most dangerous thing isn’t volatility—it’s starting to think you can’t be wrong.
So every time I go home and get “lectured,” I come back with a clearer head: manage your position size, stay away from leverage, and keep your living expenses out of the market.
Does your family know you trade crypto? What’s the most classic thing they’ve said?
Source: An original joke, adapted from a real family visit 😂
#NationalDay
I spent ten minutes explaining decentralization, smart contracts, Bitcoin…
She nodded as if she sort of understood, then patted me on the shoulder and said:
“It’s okay. Young people make mistakes. Just don’t borrow money.”
Well, she summed it up better than I did.
Jokes aside, what my family worries about is exactly what this industry lacks most: someone to hit the brakes for you.
In a bull market, when your feed is full of people showing off their gains, the most dangerous thing isn’t volatility—it’s starting to think you can’t be wrong.
So every time I go home and get “lectured,” I come back with a clearer head: manage your position size, stay away from leverage, and keep your living expenses out of the market.
Does your family know you trade crypto? What’s the most classic thing they’ve said?
Source: An original joke, adapted from a real family visit 😂
#NationalDay

64
·
--
Sold 10,000 Bitcoin, then bought back 11,000—Metaplanet’s third-quarter moves look like “churning,” but behind them is really an effort to reassure creditors.
On October 5, the Japanese publicly listed treasury company disclosed its third-quarter trading details:
1. First, it sold 10,000 BTC for about $789.2 million, at an average price of roughly $78,900
2. It then bought back 11,000 BTC for about $948.7 million, at an average price of roughly $86,200
3. The net increase was 1,000 BTC. As of September 30, total holdings stood at 44,000 BTC, worth about $3.8 billion
The company’s official explanation: converting Bitcoin into cash and temporarily holding the proceeds was meant to demonstrate to rating agencies and bond investors that, if it ever needed to repay debt, the BTC on its books could be liquidated at any time. The debt itself was not actually repaid. As a side note, the sell-and-buyback round lifted the total cost basis of its holdings to about $4.33 billion, or an average of $98,500 per coin—already above the current price.
What should we make of this? The central question hanging over treasury companies for the past two years boils down to this: everyone is happy when prices rise, but if prices fall, can you actually sell—or will you get liquidated and send the market crashing? Metaplanet effectively conducted its own stress test this time. It really did sell 10,000 BTC, so it seems to have passed the liquidity test. But don’t misread this as a bullish signal—it’s a financial maneuver, not a show of conviction. $BTC
The signal worth thinking about is this: institutions are starting to treat Bitcoin as “balance-sheet firepower they can deploy,” rather than a family heirloom they can only look at but never touch. Alongside its newly announced “net interest income strategy” (allocating 10%–15% of total assets to preferred securities issued by treasury companies), the treasury model is shifting from “just hoarding coins” to “earning yield on coins.” One caveat: revenue from its covered-call leasing business was cut in half quarter over quarter, unrealized losses are out in the open, and it remains to be seen whether the interest income can cover the cost of the debt-funded Bitcoin purchases.
Data as of: 2026-10-06 14:00 UTC
Source: CoinDesk; Phemex News Daily
For informational purposes only; not investment advice.
Do you see Bitcoin as a “family heirloom to hold forever” or as “firepower that can be converted into cash when it matters”? I’ll keep following treasury company developments—follow me to stay in the loop.
Sold 10,000 Bitcoin, then bought back 11,000—Metaplanet’s third-quarter moves look like “churning,” but behind them is really an effort to reassure creditors.
On October 5, the Japanese publicly listed treasury company disclosed its third-quarter trading details:
1. First, it sold 10,000 BTC for about $789.2 million, at an average price of roughly $78,900
2. It then bought back 11,000 BTC for about $948.7 million, at an average price of roughly $86,200
3. The net increase was 1,000 BTC. As of September 30, total holdings stood at 44,000 BTC, worth about $3.8 billion
The company’s official explanation: converting Bitcoin into cash and temporarily holding the proceeds was meant to demonstrate to rating agencies and bond investors that, if it ever needed to repay debt, the BTC on its books could be liquidated at any time. The debt itself was not actually repaid. As a side note, the sell-and-buyback round lifted the total cost basis of its holdings to about $4.33 billion, or an average of $98,500 per coin—already above the current price.
What should we make of this? The central question hanging over treasury companies for the past two years boils down to this: everyone is happy when prices rise, but if prices fall, can you actually sell—or will you get liquidated and send the market crashing? Metaplanet effectively conducted its own stress test this time. It really did sell 10,000 BTC, so it seems to have passed the liquidity test. But don’t misread this as a bullish signal—it’s a financial maneuver, not a show of conviction. $BTC
The signal worth thinking about is this: institutions are starting to treat Bitcoin as “balance-sheet firepower they can deploy,” rather than a family heirloom they can only look at but never touch. Alongside its newly announced “net interest income strategy” (allocating 10%–15% of total assets to preferred securities issued by treasury companies), the treasury model is shifting from “just hoarding coins” to “earning yield on coins.” One caveat: revenue from its covered-call leasing business was cut in half quarter over quarter, unrealized losses are out in the open, and it remains to be seen whether the interest income can cover the cost of the debt-funded Bitcoin purchases.
Data as of: 2026-10-06 14:00 UTC
Source: CoinDesk; Phemex News Daily
For informational purposes only; not investment advice.
Do you see Bitcoin as a “family heirloom to hold forever” or as “firepower that can be converted into cash when it matters”? I’ll keep following treasury company developments—follow me to stay in the loop.
On October 5, the Japanese publicly listed treasury company disclosed its third-quarter trading details:
1. First, it sold 10,000 BTC for about $789.2 million, at an average price of roughly $78,900
2. It then bought back 11,000 BTC for about $948.7 million, at an average price of roughly $86,200
3. The net increase was 1,000 BTC. As of September 30, total holdings stood at 44,000 BTC, worth about $3.8 billion
The company’s official explanation: converting Bitcoin into cash and temporarily holding the proceeds was meant to demonstrate to rating agencies and bond investors that, if it ever needed to repay debt, the BTC on its books could be liquidated at any time. The debt itself was not actually repaid. As a side note, the sell-and-buyback round lifted the total cost basis of its holdings to about $4.33 billion, or an average of $98,500 per coin—already above the current price.
What should we make of this? The central question hanging over treasury companies for the past two years boils down to this: everyone is happy when prices rise, but if prices fall, can you actually sell—or will you get liquidated and send the market crashing? Metaplanet effectively conducted its own stress test this time. It really did sell 10,000 BTC, so it seems to have passed the liquidity test. But don’t misread this as a bullish signal—it’s a financial maneuver, not a show of conviction. $BTC
The signal worth thinking about is this: institutions are starting to treat Bitcoin as “balance-sheet firepower they can deploy,” rather than a family heirloom they can only look at but never touch. Alongside its newly announced “net interest income strategy” (allocating 10%–15% of total assets to preferred securities issued by treasury companies), the treasury model is shifting from “just hoarding coins” to “earning yield on coins.” One caveat: revenue from its covered-call leasing business was cut in half quarter over quarter, unrealized losses are out in the open, and it remains to be seen whether the interest income can cover the cost of the debt-funded Bitcoin purchases.
Data as of: 2026-10-06 14:00 UTC
Source: CoinDesk; Phemex News Daily
For informational purposes only; not investment advice.
Do you see Bitcoin as a “family heirloom to hold forever” or as “firepower that can be converted into cash when it matters”? I’ll keep following treasury company developments—follow me to stay in the loop.

5
·
--
There’s a counterintuitive trick to Binance Alpha airdrops: the earlier you rush in, the more likely you are to get played.
The official rules spell it out clearly: the airdrop eligibility threshold drops automatically. Recent rounds (XDP started at 230 points, and CYS Round 3 at 250 points) have both been first-come, first-served. If the pool isn’t fully distributed, the threshold automatically drops by 5 points every 5 minutes. People who rush in during the first minute are basically taking one for those who wait.
Here’s the full claiming process in 4 steps:
1. Check your points: Open Alpha from the app homepage and view your points details. (It uses a rolling 15-day system: only the most recent 15 days count, and on Day 16, Day 1 is automatically cleared.)
2. Check the announcement: Note the points threshold and claim time. It’s first-come, first-served.
3. Claim: Tap “Claim” on the Alpha event page. Each claim costs 15 points.
4. Confirm: You must return to the event page and confirm your claim within 24 hours. If you miss the deadline, your claim is considered forfeited.
Here’s my take. Alpha’s system has never been about who’s fastest; it’s about “consistent activity.” So don’t farm points recklessly: choose assets with stable prices and calculate the fees. Don’t put your principal at risk for an airdrop worth a few dozen U in a single round. If a small airdrop’s pre-market price is too low and you’re short on points, just skip it. Airdrops are only a bonus—staying in the game matters more than farming extra points. Also, always follow Binance’s official announcements for the rules. Any “claiming link” sent to you in a private message is a scam.
Many Alpha assets trade on BSC, where gas is paid in $BNB. Keep a little in your wallet so you don’t have to go looking to swap for it.
Have you ever claimed a Binance Alpha airdrop? How much did you make on your biggest one?
#BinanceAlpha
Source: Binance’s official Chinese-language announcements (Alpha airdrop rules for XDP/CYS/CT); BlockBeats news alerts
Rules compiled on: 2026-10-06. Refer to Binance’s latest official announcements.
For informational purposes only; not investment advice.
There’s a counterintuitive trick to Binance Alpha airdrops: the earlier you rush in, the more likely you are to get played.
The official rules spell it out clearly: the airdrop eligibility threshold drops automatically. Recent rounds (XDP started at 230 points, and CYS Round 3 at 250 points) have both been first-come, first-served. If the pool isn’t fully distributed, the threshold automatically drops by 5 points every 5 minutes. People who rush in during the first minute are basically taking one for those who wait.
Here’s the full claiming process in 4 steps:
1. Check your points: Open Alpha from the app homepage and view your points details. (It uses a rolling 15-day system: only the most recent 15 days count, and on Day 16, Day 1 is automatically cleared.)
2. Check the announcement: Note the points threshold and claim time. It’s first-come, first-served.
3. Claim: Tap “Claim” on the Alpha event page. Each claim costs 15 points.
4. Confirm: You must return to the event page and confirm your claim within 24 hours. If you miss the deadline, your claim is considered forfeited.
Here’s my take. Alpha’s system has never been about who’s fastest; it’s about “consistent activity.” So don’t farm points recklessly: choose assets with stable prices and calculate the fees. Don’t put your principal at risk for an airdrop worth a few dozen U in a single round. If a small airdrop’s pre-market price is too low and you’re short on points, just skip it. Airdrops are only a bonus—staying in the game matters more than farming extra points. Also, always follow Binance’s official announcements for the rules. Any “claiming link” sent to you in a private message is a scam.
Many Alpha assets trade on BSC, where gas is paid in $BNB . Keep a little in your wallet so you don’t have to go looking to swap for it.
Have you ever claimed a Binance Alpha airdrop? How much did you make on your biggest one?
#BinanceAlpha
Source: Binance’s official Chinese-language announcements (Alpha airdrop rules for XDP/CYS/CT); BlockBeats news alerts
Rules compiled on: 2026-10-06. Refer to Binance’s latest official announcements.
For informational purposes only; not investment advice.
The official rules spell it out clearly: the airdrop eligibility threshold drops automatically. Recent rounds (XDP started at 230 points, and CYS Round 3 at 250 points) have both been first-come, first-served. If the pool isn’t fully distributed, the threshold automatically drops by 5 points every 5 minutes. People who rush in during the first minute are basically taking one for those who wait.
Here’s the full claiming process in 4 steps:
1. Check your points: Open Alpha from the app homepage and view your points details. (It uses a rolling 15-day system: only the most recent 15 days count, and on Day 16, Day 1 is automatically cleared.)
2. Check the announcement: Note the points threshold and claim time. It’s first-come, first-served.
3. Claim: Tap “Claim” on the Alpha event page. Each claim costs 15 points.
4. Confirm: You must return to the event page and confirm your claim within 24 hours. If you miss the deadline, your claim is considered forfeited.
Here’s my take. Alpha’s system has never been about who’s fastest; it’s about “consistent activity.” So don’t farm points recklessly: choose assets with stable prices and calculate the fees. Don’t put your principal at risk for an airdrop worth a few dozen U in a single round. If a small airdrop’s pre-market price is too low and you’re short on points, just skip it. Airdrops are only a bonus—staying in the game matters more than farming extra points. Also, always follow Binance’s official announcements for the rules. Any “claiming link” sent to you in a private message is a scam.
Many Alpha assets trade on BSC, where gas is paid in $BNB . Keep a little in your wallet so you don’t have to go looking to swap for it.
Have you ever claimed a Binance Alpha airdrop? How much did you make on your biggest one?
#BinanceAlpha
Source: Binance’s official Chinese-language announcements (Alpha airdrop rules for XDP/CYS/CT); BlockBeats news alerts
Rules compiled on: 2026-10-06. Refer to Binance’s latest official announcements.
For informational purposes only; not investment advice.

656
·
--
On this day one year ago, Bitcoin stood at its all-time high of $126,080. Exactly one year later, it’s still hovering around $85,500—down 32% from the peak. What stings even more: U.S. spot ETFs saw net outflows of $89.9 million yesterday, ending a two-day streak of $293 million in inflows.
These figures make the ETFs’ true role crystal clear: they amplify sentiment; they’re not the market’s savior.
When money is pouring in, they chase the rally harder than anyone. But as soon as prices soften, institutions run even more decisively than retail investors—as shown by cumulative net inflows shrinking from $61.3 billion to $57.7 billion. ETFs solve the question of “Can I buy?” They’ve never solved “Do I dare hold?”
$BTC
If you really want to judge tops and bottoms, it’s better to watch spot buying and on-chain accumulation signals than ETF flow fluctuations. A barometer and a steering wheel are two very different things.
Data as of: 2026-10-06 11:30 UTC
Sources: Cointelegraph; Odaily (Wu Blockchain citing SoSoValue data)
For informational purposes only; not investment advice.
I’ll keep tracking ETF flows like this, so follow me to stay in the loop~ Do you think ETF money is buying the dip right now, or continuing to pull out?
#OneYearSinceBitcoinHitANewHigh
On this day one year ago, Bitcoin stood at its all-time high of $126,080. Exactly one year later, it’s still hovering around $85,500—down 32% from the peak. What stings even more: U.S. spot ETFs saw net outflows of $89.9 million yesterday, ending a two-day streak of $293 million in inflows.
These figures make the ETFs’ true role crystal clear: they amplify sentiment; they’re not the market’s savior.
When money is pouring in, they chase the rally harder than anyone. But as soon as prices soften, institutions run even more decisively than retail investors—as shown by cumulative net inflows shrinking from $61.3 billion to $57.7 billion. ETFs solve the question of “Can I buy?” They’ve never solved “Do I dare hold?”
$BTC
If you really want to judge tops and bottoms, it’s better to watch spot buying and on-chain accumulation signals than ETF flow fluctuations. A barometer and a steering wheel are two very different things.
Data as of: 2026-10-06 11:30 UTC
Sources: Cointelegraph; Odaily (Wu Blockchain citing SoSoValue data)
For informational purposes only; not investment advice.
I’ll keep tracking ETF flows like this, so follow me to stay in the loop~ Do you think ETF money is buying the dip right now, or continuing to pull out?
#OneYearSinceBitcoinHitANewHigh
These figures make the ETFs’ true role crystal clear: they amplify sentiment; they’re not the market’s savior.
When money is pouring in, they chase the rally harder than anyone. But as soon as prices soften, institutions run even more decisively than retail investors—as shown by cumulative net inflows shrinking from $61.3 billion to $57.7 billion. ETFs solve the question of “Can I buy?” They’ve never solved “Do I dare hold?”
$BTC
If you really want to judge tops and bottoms, it’s better to watch spot buying and on-chain accumulation signals than ETF flow fluctuations. A barometer and a steering wheel are two very different things.
Data as of: 2026-10-06 11:30 UTC
Sources: Cointelegraph; Odaily (Wu Blockchain citing SoSoValue data)
For informational purposes only; not investment advice.
I’ll keep tracking ETF flows like this, so follow me to stay in the loop~ Do you think ETF money is buying the dip right now, or continuing to pull out?
#OneYearSinceBitcoinHitANewHigh

116
·
--
US stocks are asleep, but the “US stocks” on Binance never close—today’s official offer is for newcomers.
Binance launched its “New User bStocks Convert Campaign” today. It runs from 00:00 UTC on October 6 until November 2:
Tier A: After registering, convert a cumulative total of at least 50 USDC worth of bStocks. The first 4000 users will share 100 SPCXB token vouchers.
Tier B: Set up a bStocks recurring buy for the first time, complete 4 consecutive periods, and reach a cumulative total of at least 25 USDC. The first 1000 users will share another 10 vouchers.
My take:
The rewards themselves aren’t huge, but the signal is clear—Binance is making a series of moves in tokenized stocks this week. On the same day, it also announced a dividend for holders of $MRVLB $ORCLB (snapshot on October 9; dividends will automatically be reinvested in the same bStocks asset). US stock perpetual futures, Convert, recurring buys, and dividend distributions are all connected now. They’re clearly trying to draw Web2 stock investors into crypto. As liquidity in tokenized stocks picks up, volatility and arbitrage opportunities will grow too, so it’s worth getting familiar with how things work ahead of time. But don’t force trades just to farm rewards—the voucher value is small, and fees could leave you out of pocket.
Data as of: 2026-10-06 10:45 UTC
Sources: Binance Official News account; TradingView Binance News
For informational purposes only; not investment advice.
#bStocks #TokenizedUSStocks
I’ll keep following official campaigns like this—follow me so you don’t miss out~
Have you tried tokenized stocks? Let’s chat in the comments.
US stocks are asleep, but the “US stocks” on Binance never close—today’s official offer is for newcomers.
Binance launched its “New User bStocks Convert Campaign” today. It runs from 00:00 UTC on October 6 until November 2:
Tier A: After registering, convert a cumulative total of at least 50 USDC worth of bStocks. The first 4000 users will share 100 SPCXB token vouchers.
Tier B: Set up a bStocks recurring buy for the first time, complete 4 consecutive periods, and reach a cumulative total of at least 25 USDC. The first 1000 users will share another 10 vouchers.
My take:
The rewards themselves aren’t huge, but the signal is clear—Binance is making a series of moves in tokenized stocks this week. On the same day, it also announced a dividend for holders of $MRVLB $ORCLB (snapshot on October 9; dividends will automatically be reinvested in the same bStocks asset). US stock perpetual futures, Convert, recurring buys, and dividend distributions are all connected now. They’re clearly trying to draw Web2 stock investors into crypto. As liquidity in tokenized stocks picks up, volatility and arbitrage opportunities will grow too, so it’s worth getting familiar with how things work ahead of time. But don’t force trades just to farm rewards—the voucher value is small, and fees could leave you out of pocket.
Data as of: 2026-10-06 10:45 UTC
Sources: Binance Official News account; TradingView Binance News
For informational purposes only; not investment advice.
#bStocks #TokenizedUSStocks
I’ll keep following official campaigns like this—follow me so you don’t miss out~
Have you tried tokenized stocks? Let’s chat in the comments.
Binance launched its “New User bStocks Convert Campaign” today. It runs from 00:00 UTC on October 6 until November 2:
Tier A: After registering, convert a cumulative total of at least 50 USDC worth of bStocks. The first 4000 users will share 100 SPCXB token vouchers.
Tier B: Set up a bStocks recurring buy for the first time, complete 4 consecutive periods, and reach a cumulative total of at least 25 USDC. The first 1000 users will share another 10 vouchers.
My take:
The rewards themselves aren’t huge, but the signal is clear—Binance is making a series of moves in tokenized stocks this week. On the same day, it also announced a dividend for holders of $MRVLB $ORCLB (snapshot on October 9; dividends will automatically be reinvested in the same bStocks asset). US stock perpetual futures, Convert, recurring buys, and dividend distributions are all connected now. They’re clearly trying to draw Web2 stock investors into crypto. As liquidity in tokenized stocks picks up, volatility and arbitrage opportunities will grow too, so it’s worth getting familiar with how things work ahead of time. But don’t force trades just to farm rewards—the voucher value is small, and fees could leave you out of pocket.
Data as of: 2026-10-06 10:45 UTC
Sources: Binance Official News account; TradingView Binance News
For informational purposes only; not investment advice.
#bStocks #TokenizedUSStocks
I’ll keep following official campaigns like this—follow me so you don’t miss out~
Have you tried tokenized stocks? Let’s chat in the comments.

68
Log in to explore more content
Join global crypto users on Binance Square
⚡️ Get latest and useful information about crypto.
💬 Trusted by the world’s largest crypto exchange.
👍 Discover real insights from verified creators.
Email / Phone number
Trending Topics
BinanceLaunchesBinanceIntelligence
703,190 views
4,428 Discussing
#binancelaunchesbinanceintelligence 🚨 WHAT IF THE NEXT BIG EXCHANGE BATTLE ISN’T ABOUT FEES? 👀
Binance just made a bigger move than adding another AI chatbot.
With Binance Intelligence, AI is moving deeper into the exchange — from understanding market data to building trading workflows. 🤖⚡
The real question is:
Who has the best liquidity?
Or who has the smartest AI layer?
If users can research, test ideas and manage trading workflows without switching between different tools, the exchange itself could become a financial assistant.
That could be a much bigger shift than it looks today.
If Binance Intelligence drives more users, more strategies and more trading activity, $BNB could become one of the tokens to watch. 👀
Is Binance building the future of AI-powered finance?
$BNB
#binancelaunchesbinanceintelligence #BinanceAI #CryptoAI #AITrading
Suleman Khan Haqqani
·18 Likes
·22.8k views
BTCFallsBelow$84K
23,556 views
90 Discussing
DubaiVARAIssuesReserveAssetAuditCircular
4,527 views
294 Discussing