
无期-188个顶级博主VIP策略分享
247 Posts

无期-188个顶级博主VIP策略分享
Report
Block User
公众号:加密无期 推特@wuqi2030 每天为兄弟们分享一些顶级博主的策略
97 Following
1.1K+ Followers
743 Liked
Posts
All
Quotes
Videos
Live
🎙️ Let’s talk about the primary market and investing in BNB spot via DCA!
End
03 h 58 m 00 s
18.8k
43
56
4.7 Bitcoin slightly fell in the morning, currently the price is under pressure from the bulls, let's take a look at this issue's market analysis and community blogger's operations for high short or low long positions.
4.7 Bitcoin slightly fell in the morning, currently the price is under pressure from the bulls, let's take a look at this issue's market analysis and community blogger's operations for high short or low long positions.
108
April 6th Bitcoin surged in the morning, after brewing for 3 days it finally exploded, is it a real breakthrough or a false breakthrough? Let's take a look at this issue's market analysis and the blogger's operations.
April 6th Bitcoin surged in the morning, after brewing for 3 days it finally exploded, is it a real breakthrough or a false breakthrough? Let's take a look at this issue's market analysis and the blogger's operations.
583
On April 3rd, Bitcoin experienced extremely narrow fluctuations, with a range not exceeding 2%. Both long and short strategies have been provided, welcome to watch.
On April 3rd, Bitcoin experienced extremely narrow fluctuations, with a range not exceeding 2%. Both long and short strategies have been provided, welcome to watch.
237
4.1 Will Trump speak tomorrow, will Bitcoin be on his line-up? Let's take a look at this issue's market analysis and the blogger's operations from yesterday.
4.1 Will Trump speak tomorrow, will Bitcoin be on his line-up? Let's take a look at this issue's market analysis and the blogger's operations from yesterday.
1k
3.31 Month-end effect, Bitcoin is about to face a six consecutive monthly losses, the four-hour structure has changed, let's take a look at the new market analysis and yesterday's blogger operations
3.31 Month-end effect, Bitcoin is about to face a six consecutive monthly losses, the four-hour structure has changed, let's take a look at the new market analysis and yesterday's blogger operations
421
On March 28, successfully fell 8%, with the Nasdaq leading the decline on the 27th, followed closely by U.S. tech stocks. Bitcoin also did not back down. Let’s see in this analysis and the operations of excellent bloggers whether there will be further opportunities.
On March 28, successfully fell 8%, with the Nasdaq leading the decline on the 27th, followed closely by U.S. tech stocks. Bitcoin also did not back down. Let’s see in this analysis and the operations of excellent bloggers whether there will be further opportunities.
1
308
#Bitcoin – What’s Next?Sunday Major Report: Everything We Need to Know
Technical Analysis / Cyclical Liquidity Analysis / Psychological Analysis: In last month's report at 65k, I clearly pointed out that a new range is forming. As previously stated, I expect Bitcoin to move sideways between 57k and 87k, with a volatility range of 33%. This sideways phase is not bullish but is preparing for the upcoming market in the next few months. I anticipate a downturn after this phase, with a drop towards the lower target of the 44-50k area from the range in the coming months. A year ago, in 2024, Bitcoin fluctuated within a range of 58k to 74k throughout the year. At that time, I repeatedly explained that this range had three main purposes, one of the most important being to draw future reference lines for the next bear market. I have often said that the range in 2024 will play a key role again in the same price area during the bear market of 2026. This is precisely what is happening now. Bitcoin is currently in the area of consolidation that occurred throughout the previous year before the breakout above 100k. In the context of a bear market, this area is not support but structure, and structures eventually break. Once the sideways phase is complete, I expect a breakdown of this range.
#Bitcoin – What’s Next?
Sunday Major Report: Everything We Need to Know
Technical Analysis / Cyclical Liquidity Analysis / Psychological Analysis: In last month's report at 65k, I clearly pointed out that a new range is forming. As previously stated, I expect Bitcoin to move sideways between 57k and 87k, with a volatility range of 33%. This sideways phase is not bullish but is preparing for the upcoming market in the next few months. I anticipate a downturn after this phase, with a drop towards the lower target of the 44-50k area from the range in the coming months. A year ago, in 2024, Bitcoin fluctuated within a range of 58k to 74k throughout the year. At that time, I repeatedly explained that this range had three main purposes, one of the most important being to draw future reference lines for the next bear market. I have often said that the range in 2024 will play a key role again in the same price area during the bear market of 2026. This is precisely what is happening now. Bitcoin is currently in the area of consolidation that occurred throughout the previous year before the breakout above 100k. In the context of a bear market, this area is not support but structure, and structures eventually break. Once the sideways phase is complete, I expect a breakdown of this range.
Technical Analysis / Cyclical Liquidity Analysis / Psychological Analysis: In last month's report at 65k, I clearly pointed out that a new range is forming. As previously stated, I expect Bitcoin to move sideways between 57k and 87k, with a volatility range of 33%. This sideways phase is not bullish but is preparing for the upcoming market in the next few months. I anticipate a downturn after this phase, with a drop towards the lower target of the 44-50k area from the range in the coming months. A year ago, in 2024, Bitcoin fluctuated within a range of 58k to 74k throughout the year. At that time, I repeatedly explained that this range had three main purposes, one of the most important being to draw future reference lines for the next bear market. I have often said that the range in 2024 will play a key role again in the same price area during the bear market of 2026. This is precisely what is happening now. Bitcoin is currently in the area of consolidation that occurred throughout the previous year before the breakout above 100k. In the context of a bear market, this area is not support but structure, and structures eventually break. Once the sideways phase is complete, I expect a breakdown of this range.
3
421
#BTC – Special Weekly Report: – Special Weekly Report:
Sunday Big Report: Everything We Need to Know Technical Analysis / Periodic Liquidity Analysis / Psychological Profiling:
Bitcoin is currently in stage 4 of the 6 stages of the current bear market: these six stages are my own framework developed through direct observation of every major Bitcoin bull and bear market so far. This structure repeats because the underlying driving factors repeat: liquidity mechanisms, leveraged positions, and predictable human behavior under stress and current panic.
Stage 1: Frenzied Market and Crazy Buying Desire:
#BTC – Special Weekly Report:
– Special Weekly Report:
Sunday Big Report: Everything We Need to Know Technical Analysis / Periodic Liquidity Analysis / Psychological Profiling:
Bitcoin is currently in stage 4 of the 6 stages of the current bear market: these six stages are my own framework developed through direct observation of every major Bitcoin bull and bear market so far. This structure repeats because the underlying driving factors repeat: liquidity mechanisms, leveraged positions, and predictable human behavior under stress and current panic.
Stage 1: Frenzied Market and Crazy Buying Desire:
Sunday Big Report: Everything We Need to Know Technical Analysis / Periodic Liquidity Analysis / Psychological Profiling:
Bitcoin is currently in stage 4 of the 6 stages of the current bear market: these six stages are my own framework developed through direct observation of every major Bitcoin bull and bear market so far. This structure repeats because the underlying driving factors repeat: liquidity mechanisms, leveraged positions, and predictable human behavior under stress and current panic.
Stage 1: Frenzied Market and Crazy Buying Desire:
2
2
443
#BTC – What comes next?#BTC – What comes next?
Big Weekly Report: Everything We Need to Know
🚩 Technical Analysis / Linear Retracement / Psychological Analysis: Psychological Analysis
In last week's weekly report, I clearly pointed out that a new range was forming when Bitcoin was at 78k. I expect Bitcoin to trade sideways between 57k and 87k, with a volatility range of 33%, as previously stated. This sideways phase does not indicate a bullish sentiment, but rather prepares for the upcoming months. I anticipate a downward wave following this phase, with targets pointing towards lower levels in the 44-50k area in the coming weeks or months as the box breaks.
#BTC – What comes next?
#BTC – What comes next?
Big Weekly Report: Everything We Need to Know
🚩 Technical Analysis / Linear Retracement / Psychological Analysis: Psychological Analysis
In last week's weekly report, I clearly pointed out that a new range was forming when Bitcoin was at 78k. I expect Bitcoin to trade sideways between 57k and 87k, with a volatility range of 33%, as previously stated. This sideways phase does not indicate a bullish sentiment, but rather prepares for the upcoming months. I anticipate a downward wave following this phase, with targets pointing towards lower levels in the 44-50k area in the coming weeks or months as the box breaks.
Big Weekly Report: Everything We Need to Know
🚩 Technical Analysis / Linear Retracement / Psychological Analysis: Psychological Analysis
In last week's weekly report, I clearly pointed out that a new range was forming when Bitcoin was at 78k. I expect Bitcoin to trade sideways between 57k and 87k, with a volatility range of 33%, as previously stated. This sideways phase does not indicate a bullish sentiment, but rather prepares for the upcoming months. I anticipate a downward wave following this phase, with targets pointing towards lower levels in the 44-50k area in the coming weeks or months as the box breaks.
4
1
1
379
#BTC ——What's next?#BTC ——What's next?
Weekly report: Everything you need to know
TA / LCA / Psychological breakdown:
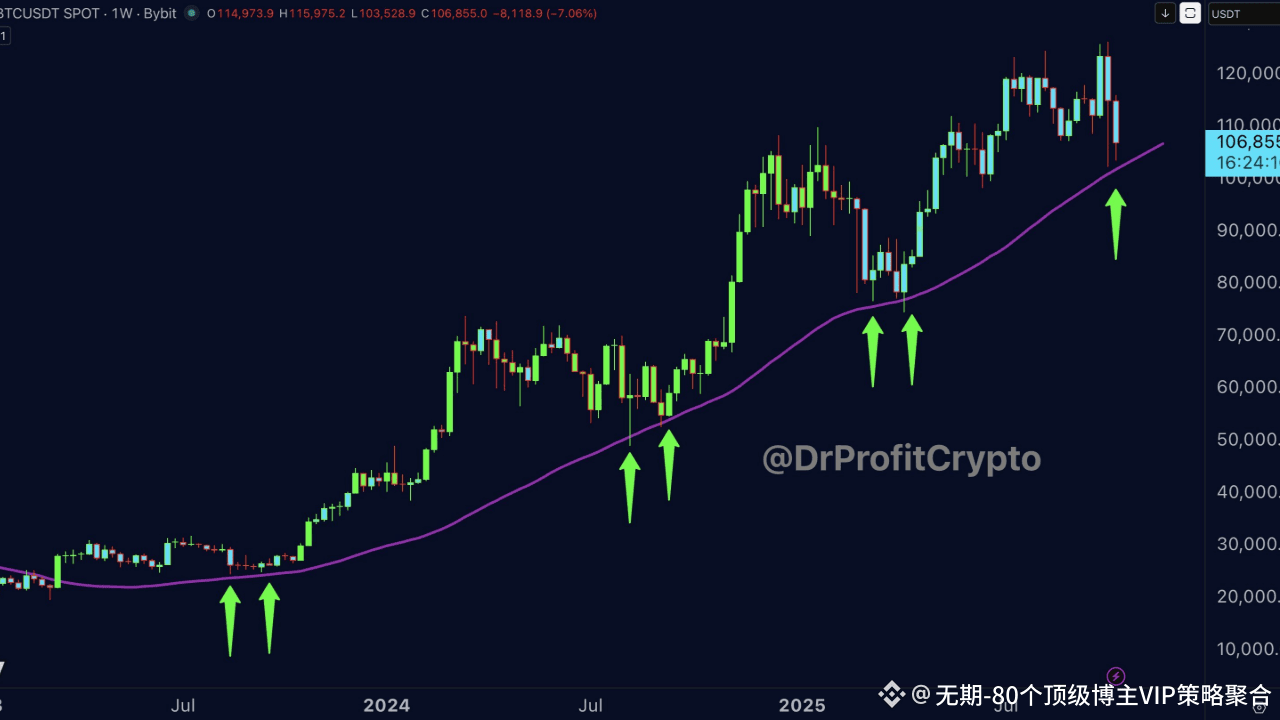
Two weeks ago, I wrote in the weekly report (price at $95,000): “Bitcoin is still in a consolidation phase, which remains bearish, and breaking below $80,000 is just a matter of time. Currently, we are still in the consolidation phase, just as I predicted in November when I mentioned that a consolidation phase was about to begin, but the next round of decline is inevitable.” This statement made two weeks ago at $95,000 now seems completely accurate. As I promised, Bitcoin has now broken below $80,000, and with this trend, it has accomplished something extremely important this week. Of course, most people overlooked this again, but Bitcoin has just broken below the 100-week moving average, which is a key indicator to confirm whether we are in a bull market or a bear market. Bitcoin had previously held above the purple line (the 100-week moving average), but this week it fell below it! As shown in the figure, in October 2023, when Bitcoin broke through the 100-week moving average (purple line), we confirmed the arrival of the bull market for the first time. However, today, two years later, Bitcoin has broken below this extremely important price level, perfectly aligning with the previous bull market cycle and confirming the arrival of the bear market. Another strong evidence is the death cross that is currently unfolding before our eyes. This perfectly matches the peak of the 2021-2022 cycle and its subsequent movements. However, most people are oblivious to this. This is precisely my personal observation and long-term view; several months ago, when Bitcoin's price was at historical highs of $115,000 to $125,000, I repeatedly warned that the bear market had already begun. Now, you should understand what I mean.
#BTC ——What's next?
#BTC ——What's next?
Weekly report: Everything you need to know
TA / LCA / Psychological breakdown:
Two weeks ago, I wrote in the weekly report (price at $95,000): “Bitcoin is still in a consolidation phase, which remains bearish, and breaking below $80,000 is just a matter of time. Currently, we are still in the consolidation phase, just as I predicted in November when I mentioned that a consolidation phase was about to begin, but the next round of decline is inevitable.” This statement made two weeks ago at $95,000 now seems completely accurate. As I promised, Bitcoin has now broken below $80,000, and with this trend, it has accomplished something extremely important this week. Of course, most people overlooked this again, but Bitcoin has just broken below the 100-week moving average, which is a key indicator to confirm whether we are in a bull market or a bear market. Bitcoin had previously held above the purple line (the 100-week moving average), but this week it fell below it! As shown in the figure, in October 2023, when Bitcoin broke through the 100-week moving average (purple line), we confirmed the arrival of the bull market for the first time. However, today, two years later, Bitcoin has broken below this extremely important price level, perfectly aligning with the previous bull market cycle and confirming the arrival of the bear market. Another strong evidence is the death cross that is currently unfolding before our eyes. This perfectly matches the peak of the 2021-2022 cycle and its subsequent movements. However, most people are oblivious to this. This is precisely my personal observation and long-term view; several months ago, when Bitcoin's price was at historical highs of $115,000 to $125,000, I repeatedly warned that the bear market had already begun. Now, you should understand what I mean.
Weekly report: Everything you need to know
TA / LCA / Psychological breakdown:
Two weeks ago, I wrote in the weekly report (price at $95,000): “Bitcoin is still in a consolidation phase, which remains bearish, and breaking below $80,000 is just a matter of time. Currently, we are still in the consolidation phase, just as I predicted in November when I mentioned that a consolidation phase was about to begin, but the next round of decline is inevitable.” This statement made two weeks ago at $95,000 now seems completely accurate. As I promised, Bitcoin has now broken below $80,000, and with this trend, it has accomplished something extremely important this week. Of course, most people overlooked this again, but Bitcoin has just broken below the 100-week moving average, which is a key indicator to confirm whether we are in a bull market or a bear market. Bitcoin had previously held above the purple line (the 100-week moving average), but this week it fell below it! As shown in the figure, in October 2023, when Bitcoin broke through the 100-week moving average (purple line), we confirmed the arrival of the bull market for the first time. However, today, two years later, Bitcoin has broken below this extremely important price level, perfectly aligning with the previous bull market cycle and confirming the arrival of the bear market. Another strong evidence is the death cross that is currently unfolding before our eyes. This perfectly matches the peak of the 2021-2022 cycle and its subsequent movements. However, most people are oblivious to this. This is precisely my personal observation and long-term view; several months ago, when Bitcoin's price was at historical highs of $115,000 to $125,000, I repeatedly warned that the bear market had already begun. Now, you should understand what I mean.
1
1
234
#SILVER ——What happened?#SILVER ——What happened?
The reason for the price crash is simply that a large number of short positions flooded into the futures market, leading to a sharp decline in prices. It is easy to draw this conclusion by observing the futures trading volume, but to further validate it, it is important to observe some interesting patterns. I noticed some very interesting patterns that confirm my argument that some shorts needed to cover. Today, in both the Shanghai and COMEX markets, they had the opportunity to cover:
What exactly happened today? As far as the Shanghai market is concerned, I did not see any significant large-scale physical silver redemptions, which means that in today's downturn, no physical silver changed hands. So, what exactly happened?
#SILVER ——What happened?
#SILVER ——What happened?
The reason for the price crash is simply that a large number of short positions flooded into the futures market, leading to a sharp decline in prices. It is easy to draw this conclusion by observing the futures trading volume, but to further validate it, it is important to observe some interesting patterns. I noticed some very interesting patterns that confirm my argument that some shorts needed to cover. Today, in both the Shanghai and COMEX markets, they had the opportunity to cover:
What exactly happened today? As far as the Shanghai market is concerned, I did not see any significant large-scale physical silver redemptions, which means that in today's downturn, no physical silver changed hands. So, what exactly happened?
The reason for the price crash is simply that a large number of short positions flooded into the futures market, leading to a sharp decline in prices. It is easy to draw this conclusion by observing the futures trading volume, but to further validate it, it is important to observe some interesting patterns. I noticed some very interesting patterns that confirm my argument that some shorts needed to cover. Today, in both the Shanghai and COMEX markets, they had the opportunity to cover:
What exactly happened today? As far as the Shanghai market is concerned, I did not see any significant large-scale physical silver redemptions, which means that in today's downturn, no physical silver changed hands. So, what exactly happened?
1
1
1
74
#BTC / Stocks — What Happens Next?#BTC / Stocks — What Happens Next?
Sunday's Important Report: Everything You Need to Know:
🚩 Technical Analysis / Lifecycle Assessment / Psychological Analysis: Bitcoin is simultaneously forming three bearish patterns. First, a significant bearish divergence has already appeared on the weekly and monthly charts. Second, a clear bearish flag pattern is pointing toward the $70,000 zone. Third, a potential head and shoulders pattern remains active. Given the abundant liquidity between $97,000 and $107,000, it's not impossible for the price to break through this range, but there's no doubt: reaching $70,000 is just a matter of time! Currently, the probability of Bitcoin hitting the $70,000 target is 50:50. It will either break through the bearish flag directly and head straight for the $70,000 zone, or first complete the head and shoulders pattern before attacking $70,000. This is the only uncertainty, but the ultimate goal remains $70,000!
#BTC / Stocks — What Happens Next?
#BTC / Stocks — What Happens Next?
Sunday's Important Report: Everything You Need to Know:
🚩 Technical Analysis / Lifecycle Assessment / Psychological Analysis: Bitcoin is simultaneously forming three bearish patterns. First, a significant bearish divergence has already appeared on the weekly and monthly charts. Second, a clear bearish flag pattern is pointing toward the $70,000 zone. Third, a potential head and shoulders pattern remains active. Given the abundant liquidity between $97,000 and $107,000, it's not impossible for the price to break through this range, but there's no doubt: reaching $70,000 is just a matter of time! Currently, the probability of Bitcoin hitting the $70,000 target is 50:50. It will either break through the bearish flag directly and head straight for the $70,000 zone, or first complete the head and shoulders pattern before attacking $70,000. This is the only uncertainty, but the ultimate goal remains $70,000!
Sunday's Important Report: Everything You Need to Know:
🚩 Technical Analysis / Lifecycle Assessment / Psychological Analysis: Bitcoin is simultaneously forming three bearish patterns. First, a significant bearish divergence has already appeared on the weekly and monthly charts. Second, a clear bearish flag pattern is pointing toward the $70,000 zone. Third, a potential head and shoulders pattern remains active. Given the abundant liquidity between $97,000 and $107,000, it's not impossible for the price to break through this range, but there's no doubt: reaching $70,000 is just a matter of time! Currently, the probability of Bitcoin hitting the $70,000 target is 50:50. It will either break through the bearish flag directly and head straight for the $70,000 zone, or first complete the head and shoulders pattern before attacking $70,000. This is the only uncertainty, but the ultimate goal remains $70,000!
2
168
Article
#BTC / Stock Market - What Will Happen Next? / Stock Market - What Will Happen Next?
Sunday's Big News: Everything You Need to Know
TA / LCA / Psychological Breakdown:
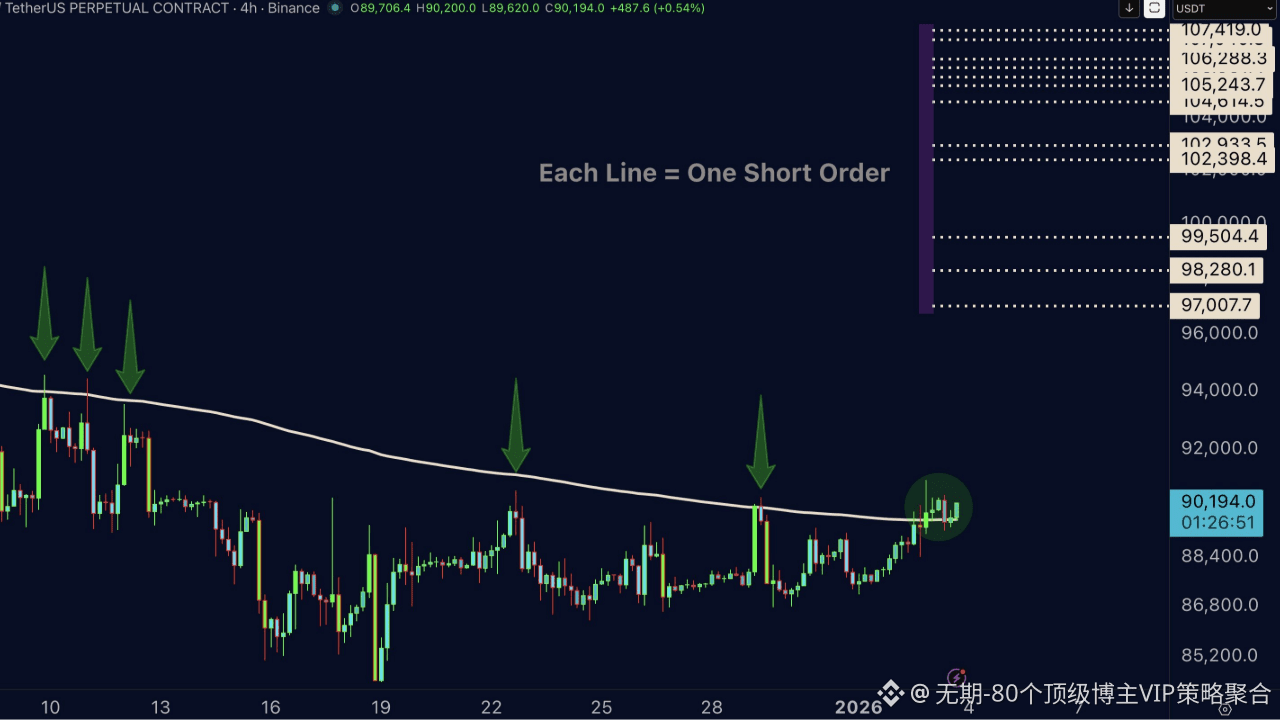
This is a report released early on Sunday. Due to the current market trends and a very important development, we are releasing it ahead of schedule on Saturday. Bitcoin has broken through the silver line that had previously failed five times for the first time in a month. After this breakthrough, there was a clear retest, and bullish confirmation was obtained. What does this mean? It means that Bitcoin has successfully broken through this short-term resistance level and sent a clear signal indicating it is ready to continue rising. This is exactly what I have been waiting for over the past two months. After reaching the target price of $80,000, I clearly stated that before continuing to fall, target prices of $97,000 to $107,000 are not impossible, and I have bought spot at $85,000, planning to sell between $97,000 and $107,000. It now appears that the market intends to make this downward move. Therefore, I have set multiple short orders between $97,000 and $107,000, with each line representing a short order. For example, if my trading capital is $10,000, I would divide it into 12 parts and set the corresponding number of orders. I have always traded this way to capture the best average price for shorting.
#BTC / Stock Market - What Will Happen Next?
/ Stock Market - What Will Happen Next?
Sunday's Big News: Everything You Need to Know
TA / LCA / Psychological Breakdown:
This is a report released early on Sunday. Due to the current market trends and a very important development, we are releasing it ahead of schedule on Saturday. Bitcoin has broken through the silver line that had previously failed five times for the first time in a month. After this breakthrough, there was a clear retest, and bullish confirmation was obtained. What does this mean? It means that Bitcoin has successfully broken through this short-term resistance level and sent a clear signal indicating it is ready to continue rising. This is exactly what I have been waiting for over the past two months. After reaching the target price of $80,000, I clearly stated that before continuing to fall, target prices of $97,000 to $107,000 are not impossible, and I have bought spot at $85,000, planning to sell between $97,000 and $107,000. It now appears that the market intends to make this downward move. Therefore, I have set multiple short orders between $97,000 and $107,000, with each line representing a short order. For example, if my trading capital is $10,000, I would divide it into 12 parts and set the corresponding number of orders. I have always traded this way to capture the best average price for shorting.
Sunday's Big News: Everything You Need to Know
TA / LCA / Psychological Breakdown:
This is a report released early on Sunday. Due to the current market trends and a very important development, we are releasing it ahead of schedule on Saturday. Bitcoin has broken through the silver line that had previously failed five times for the first time in a month. After this breakthrough, there was a clear retest, and bullish confirmation was obtained. What does this mean? It means that Bitcoin has successfully broken through this short-term resistance level and sent a clear signal indicating it is ready to continue rising. This is exactly what I have been waiting for over the past two months. After reaching the target price of $80,000, I clearly stated that before continuing to fall, target prices of $97,000 to $107,000 are not impossible, and I have bought spot at $85,000, planning to sell between $97,000 and $107,000. It now appears that the market intends to make this downward move. Therefore, I have set multiple short orders between $97,000 and $107,000, with each line representing a short order. For example, if my trading capital is $10,000, I would divide it into 12 parts and set the corresponding number of orders. I have always traded this way to capture the best average price for shorting.
304
Article
#BTC —— What’s next?#BTC —— What’s next?
Important report on Sunday: Everything you need to know:
🚩 TA / LCA / Psychological breakdown:
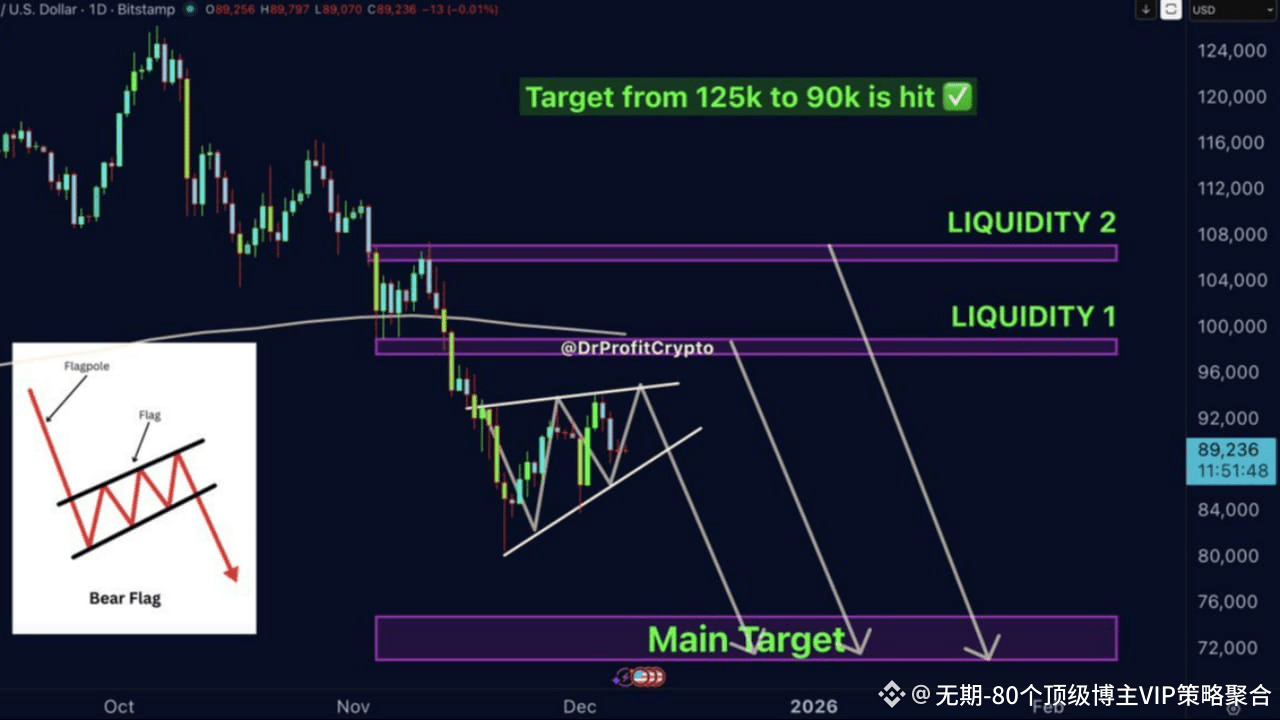
Since the report last week, there has been no change, so today’s update is shorter than usual. Last week, we discussed the two main liquidity accumulation points in the 97k and 107k areas, and the importance of setting up short positions in these areas in case market makers allow prices to touch these areas again to seize liquidity. Notably, the 50-day moving average needs to be retested, which aligns perfectly with the first liquidity pool around 99-100k. If we see such a spike in price, it will require significant volatility, which is likely to occur during the Federal Open Market Committee (FOMC) statement on December 10, three days from now.
#BTC —— What’s next?
#BTC —— What’s next?
Important report on Sunday: Everything you need to know:
🚩 TA / LCA / Psychological breakdown:
Since the report last week, there has been no change, so today’s update is shorter than usual. Last week, we discussed the two main liquidity accumulation points in the 97k and 107k areas, and the importance of setting up short positions in these areas in case market makers allow prices to touch these areas again to seize liquidity. Notably, the 50-day moving average needs to be retested, which aligns perfectly with the first liquidity pool around 99-100k. If we see such a spike in price, it will require significant volatility, which is likely to occur during the Federal Open Market Committee (FOMC) statement on December 10, three days from now.
Important report on Sunday: Everything you need to know:
🚩 TA / LCA / Psychological breakdown:
Since the report last week, there has been no change, so today’s update is shorter than usual. Last week, we discussed the two main liquidity accumulation points in the 97k and 107k areas, and the importance of setting up short positions in these areas in case market makers allow prices to touch these areas again to seize liquidity. Notably, the 50-day moving average needs to be retested, which aligns perfectly with the first liquidity pool around 99-100k. If we see such a spike in price, it will require significant volatility, which is likely to occur during the Federal Open Market Committee (FOMC) statement on December 10, three days from now.
1
400
Article
#BTC — What's next?#BTC — What's next?
Important report on Sunday: Everything you need to know:
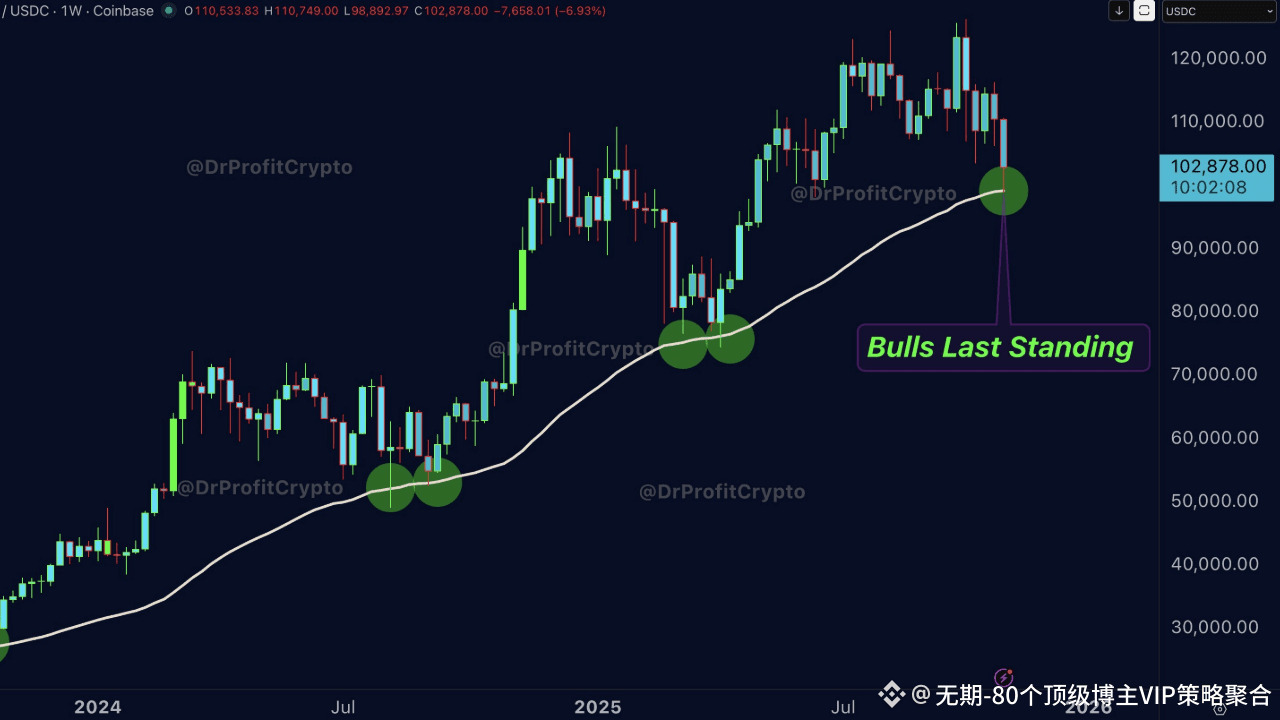
Technical analysis / Life cycle assessment / Psychological analysis: Bitcoin is currently at a historical support level. Since the bull market began in March 2023, it has never fallen below this golden line. A quick glance at the chart shows that Bitcoin has consistently rebounded above the golden line on the weekly chart and has never closed below it. If it closes below, it is likely to indicate that bullish strength is weakening, as this is one of the most important bullish-bearish indicators. I am not blindly shorting, although we must understand the movements of both sides to improve trading, I believe the golden line is an important support level, currently around $99,200, slightly below the psychological level of $100,000. This supports my view that before the next round of increases, we may see Bitcoin consolidate in this area. I must emphasize again that joining Wall Street members can truly change your life, and many user testimonials have proven this.
#BTC — What's next?
#BTC — What's next?
Important report on Sunday: Everything you need to know:
Technical analysis / Life cycle assessment / Psychological analysis: Bitcoin is currently at a historical support level. Since the bull market began in March 2023, it has never fallen below this golden line. A quick glance at the chart shows that Bitcoin has consistently rebounded above the golden line on the weekly chart and has never closed below it. If it closes below, it is likely to indicate that bullish strength is weakening, as this is one of the most important bullish-bearish indicators. I am not blindly shorting, although we must understand the movements of both sides to improve trading, I believe the golden line is an important support level, currently around $99,200, slightly below the psychological level of $100,000. This supports my view that before the next round of increases, we may see Bitcoin consolidate in this area. I must emphasize again that joining Wall Street members can truly change your life, and many user testimonials have proven this.
Important report on Sunday: Everything you need to know:
Technical analysis / Life cycle assessment / Psychological analysis: Bitcoin is currently at a historical support level. Since the bull market began in March 2023, it has never fallen below this golden line. A quick glance at the chart shows that Bitcoin has consistently rebounded above the golden line on the weekly chart and has never closed below it. If it closes below, it is likely to indicate that bullish strength is weakening, as this is one of the most important bullish-bearish indicators. I am not blindly shorting, although we must understand the movements of both sides to improve trading, I believe the golden line is an important support level, currently around $99,200, slightly below the psychological level of $100,000. This supports my view that before the next round of increases, we may see Bitcoin consolidate in this area. I must emphasize again that joining Wall Street members can truly change your life, and many user testimonials have proven this.
117
Article
BTC/Stock Market – What’s the Next Move?BTC/Stock Market – What’s the Next Move?
Sunday Heavy Report: Everything You Need to Know
🚩 Technical Analysis/Liquidity Accumulation Analysis/Psychological Perspective Analysis:
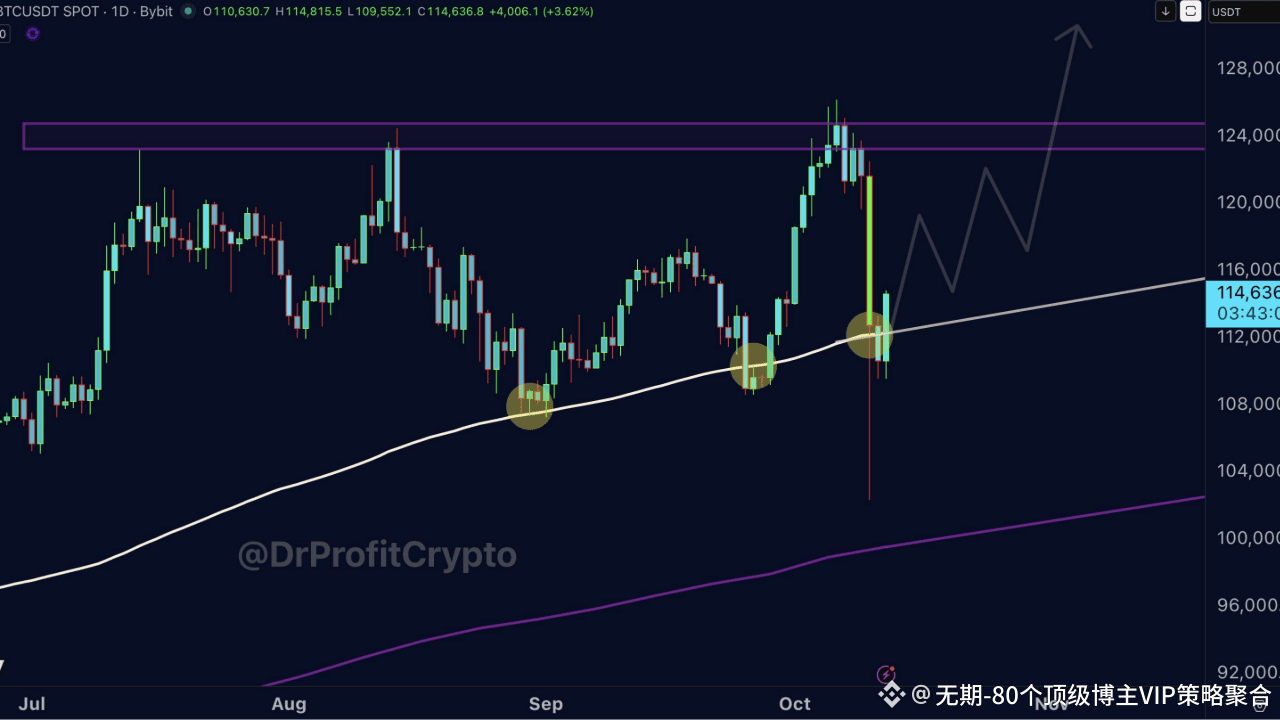
Since the end of August, I have continuously warned that the top area is the time to increase short positions and sell. Everyone who followed my advice now understands that the 115k-125k range is indeed an excellent area to establish shorts and sell — our average short entry point is at 119,000, accurately predicting the peak at 125,000. So what's next? The market remains extremely bearish, and we are currently playing out the top divergence pattern that has formed since August. It must be understood that this market is driven by greed, and I rarely observe extreme greed in the market — this includes both bulls and bears: greedy bulls seeking ideal prices to sell, and ecstatic bears anticipating the subsequent price movement. Although I firmly hold a bearish outlook, market makers often clear the market's bidirectional positions before launching significant market movements. A brief review: in August and September, BTC touched our shorting area of 115k-125k when the bulls greedily called for a rise, and I clearly called for establishing short positions in that area. BTC surged to 126,000 (only 1,000 higher than my predicted peak of 125,000), and then we witnessed the historic crash in October. Recently, many latecomer bears have flooded the battlefield, causing massive liquidations in the 116,500 area. Although our short entry point is far above these liquidation points, the recently entered bears face the risk of being liquidated before further declines. Additionally, I find that many claim there is significant liquidation in the 120k-130k area, which is completely untrue. I wonder what data sources others are using; according to my data monitoring, liquidity in that area is extremely thin — because almost everyone was bullish during the 120k-125k period, very few, besides myself, actually established short positions. Based on this, will market makers allow retail investors and whales to exit at better prices after causing losses? I highly doubt it. Therefore, I believe the maximum upward scenario will reach the 116,500 area (a 9% increase from the current position). If the market truly allows probing that area, I have preset a large number of short positions waiting to be triggered — after all, the main trend remains downward.
BTC/Stock Market – What’s the Next Move?
BTC/Stock Market – What’s the Next Move?
Sunday Heavy Report: Everything You Need to Know
🚩 Technical Analysis/Liquidity Accumulation Analysis/Psychological Perspective Analysis:
Since the end of August, I have continuously warned that the top area is the time to increase short positions and sell. Everyone who followed my advice now understands that the 115k-125k range is indeed an excellent area to establish shorts and sell — our average short entry point is at 119,000, accurately predicting the peak at 125,000. So what's next? The market remains extremely bearish, and we are currently playing out the top divergence pattern that has formed since August. It must be understood that this market is driven by greed, and I rarely observe extreme greed in the market — this includes both bulls and bears: greedy bulls seeking ideal prices to sell, and ecstatic bears anticipating the subsequent price movement. Although I firmly hold a bearish outlook, market makers often clear the market's bidirectional positions before launching significant market movements. A brief review: in August and September, BTC touched our shorting area of 115k-125k when the bulls greedily called for a rise, and I clearly called for establishing short positions in that area. BTC surged to 126,000 (only 1,000 higher than my predicted peak of 125,000), and then we witnessed the historic crash in October. Recently, many latecomer bears have flooded the battlefield, causing massive liquidations in the 116,500 area. Although our short entry point is far above these liquidation points, the recently entered bears face the risk of being liquidated before further declines. Additionally, I find that many claim there is significant liquidation in the 120k-130k area, which is completely untrue. I wonder what data sources others are using; according to my data monitoring, liquidity in that area is extremely thin — because almost everyone was bullish during the 120k-125k period, very few, besides myself, actually established short positions. Based on this, will market makers allow retail investors and whales to exit at better prices after causing losses? I highly doubt it. Therefore, I believe the maximum upward scenario will reach the 116,500 area (a 9% increase from the current position). If the market truly allows probing that area, I have preset a large number of short positions waiting to be triggered — after all, the main trend remains downward.
Sunday Heavy Report: Everything You Need to Know
🚩 Technical Analysis/Liquidity Accumulation Analysis/Psychological Perspective Analysis:
Since the end of August, I have continuously warned that the top area is the time to increase short positions and sell. Everyone who followed my advice now understands that the 115k-125k range is indeed an excellent area to establish shorts and sell — our average short entry point is at 119,000, accurately predicting the peak at 125,000. So what's next? The market remains extremely bearish, and we are currently playing out the top divergence pattern that has formed since August. It must be understood that this market is driven by greed, and I rarely observe extreme greed in the market — this includes both bulls and bears: greedy bulls seeking ideal prices to sell, and ecstatic bears anticipating the subsequent price movement. Although I firmly hold a bearish outlook, market makers often clear the market's bidirectional positions before launching significant market movements. A brief review: in August and September, BTC touched our shorting area of 115k-125k when the bulls greedily called for a rise, and I clearly called for establishing short positions in that area. BTC surged to 126,000 (only 1,000 higher than my predicted peak of 125,000), and then we witnessed the historic crash in October. Recently, many latecomer bears have flooded the battlefield, causing massive liquidations in the 116,500 area. Although our short entry point is far above these liquidation points, the recently entered bears face the risk of being liquidated before further declines. Additionally, I find that many claim there is significant liquidation in the 120k-130k area, which is completely untrue. I wonder what data sources others are using; according to my data monitoring, liquidity in that area is extremely thin — because almost everyone was bullish during the 120k-125k period, very few, besides myself, actually established short positions. Based on this, will market makers allow retail investors and whales to exit at better prices after causing losses? I highly doubt it. Therefore, I believe the maximum upward scenario will reach the 116,500 area (a 9% increase from the current position). If the market truly allows probing that area, I have preset a large number of short positions waiting to be triggered — after all, the main trend remains downward.
123
Article
#BTC/Stock Market – Future Trend Analysis#BTC/Stock Market – Future Trend Analysis
Sunday's Major Report: Comprehensive Analysis of Key Points
Technical Analysis/Liquidity Analysis/Market Psychology Analysis
After experiencing the largest liquidation event in history recently, we no longer need to maintain an 'extremely bearish' stance—though this does not mean a shift to 'extremely bullish.' Trading has never been black and white; this moment is crucial for assessing the next major market movement. This record-breaking chain liquidation is the storm I have long anticipated, and it has finally arrived. If you survived the most brutal liquidation wave in cryptocurrency history, congratulations! All participants who shorted alongside me have been validated: countless altcoins have gone to zero, and our limit buy orders executed at extremely low levels. The profits from shorting altcoins are remarkable, far exceeding what most earn from trading over the years. Every follower who trusted my warnings is a winner at this moment.
#BTC/Stock Market – Future Trend Analysis
#BTC/Stock Market – Future Trend Analysis
Sunday's Major Report: Comprehensive Analysis of Key Points
Technical Analysis/Liquidity Analysis/Market Psychology Analysis
After experiencing the largest liquidation event in history recently, we no longer need to maintain an 'extremely bearish' stance—though this does not mean a shift to 'extremely bullish.' Trading has never been black and white; this moment is crucial for assessing the next major market movement. This record-breaking chain liquidation is the storm I have long anticipated, and it has finally arrived. If you survived the most brutal liquidation wave in cryptocurrency history, congratulations! All participants who shorted alongside me have been validated: countless altcoins have gone to zero, and our limit buy orders executed at extremely low levels. The profits from shorting altcoins are remarkable, far exceeding what most earn from trading over the years. Every follower who trusted my warnings is a winner at this moment.
Sunday's Major Report: Comprehensive Analysis of Key Points
Technical Analysis/Liquidity Analysis/Market Psychology Analysis
After experiencing the largest liquidation event in history recently, we no longer need to maintain an 'extremely bearish' stance—though this does not mean a shift to 'extremely bullish.' Trading has never been black and white; this moment is crucial for assessing the next major market movement. This record-breaking chain liquidation is the storm I have long anticipated, and it has finally arrived. If you survived the most brutal liquidation wave in cryptocurrency history, congratulations! All participants who shorted alongside me have been validated: countless altcoins have gone to zero, and our limit buy orders executed at extremely low levels. The profits from shorting altcoins are remarkable, far exceeding what most earn from trading over the years. Every follower who trusted my warnings is a winner at this moment.
1
4
1.2k
Article
#BTC – Future Direction Analysis#BTC – Future Direction Analysis
Sunday's Major Report: Core Points Fully Analyzed
Technical Analysis / Liquidity Analysis / Market Psychology Analysis
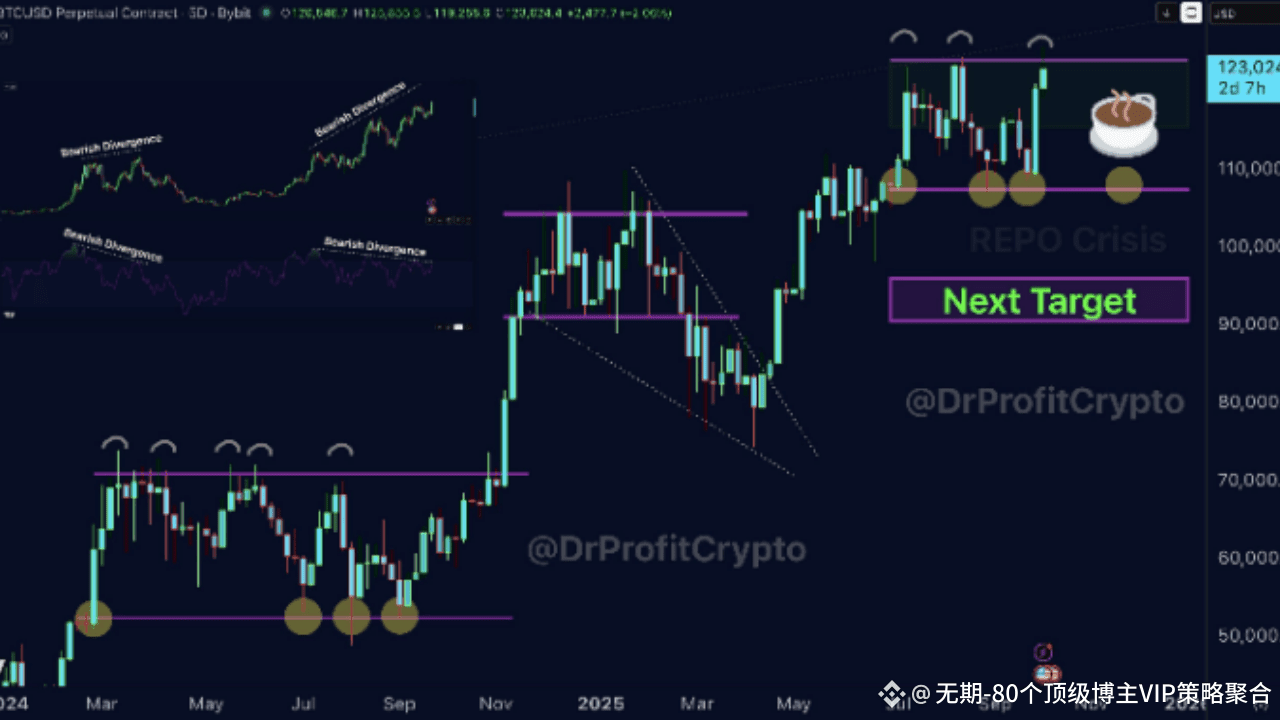
This article is my final update for this month; I will quietly observe the market while enjoying tea before returning in November. The market is entering a highly unstable zone, yet the festive mood obscures the public's vision—my defined selling zone of $115,000 to $125,000 remains a disaster area for large players distributing their chips, as they pour their holdings onto the blindly buying retail investors. Current selling pressure has yet to become apparent due to the continuous influx of retail funds from all directions.
Despite the fervent atmosphere on social media, today's false breakout and subsequent pullback from 125k will still be packaged by the media as the headline 'Bitcoin Hits New All-Time High', luring more retail investors into the market. The stock market is showing a similar pattern: since August, the inflow of retail funds has reached record levels, while financial indicators have flashed early warnings of liquidity tightening beneath the surface.
#BTC – Future Direction Analysis
#BTC – Future Direction Analysis
Sunday's Major Report: Core Points Fully Analyzed
Technical Analysis / Liquidity Analysis / Market Psychology Analysis
This article is my final update for this month; I will quietly observe the market while enjoying tea before returning in November. The market is entering a highly unstable zone, yet the festive mood obscures the public's vision—my defined selling zone of $115,000 to $125,000 remains a disaster area for large players distributing their chips, as they pour their holdings onto the blindly buying retail investors. Current selling pressure has yet to become apparent due to the continuous influx of retail funds from all directions.
Despite the fervent atmosphere on social media, today's false breakout and subsequent pullback from 125k will still be packaged by the media as the headline 'Bitcoin Hits New All-Time High', luring more retail investors into the market. The stock market is showing a similar pattern: since August, the inflow of retail funds has reached record levels, while financial indicators have flashed early warnings of liquidity tightening beneath the surface.
Sunday's Major Report: Core Points Fully Analyzed
Technical Analysis / Liquidity Analysis / Market Psychology Analysis
This article is my final update for this month; I will quietly observe the market while enjoying tea before returning in November. The market is entering a highly unstable zone, yet the festive mood obscures the public's vision—my defined selling zone of $115,000 to $125,000 remains a disaster area for large players distributing their chips, as they pour their holdings onto the blindly buying retail investors. Current selling pressure has yet to become apparent due to the continuous influx of retail funds from all directions.
Despite the fervent atmosphere on social media, today's false breakout and subsequent pullback from 125k will still be packaged by the media as the headline 'Bitcoin Hits New All-Time High', luring more retail investors into the market. The stock market is showing a similar pattern: since August, the inflow of retail funds has reached record levels, while financial indicators have flashed early warnings of liquidity tightening beneath the surface.
1
227
Log in to explore more content
Join global crypto users on Binance Square
⚡️ Get latest and useful information about crypto.
💬 Trusted by the world’s largest crypto exchange.
👍 Discover real insights from verified creators.
Email / Phone number
Trending Topics
AppleDebutsFoldablePhone
25,756 views
566 Discussing
Apple just dropped the foldable iPhone — and the market is paying attention. This isn't just another product cycle; it's a new product category, a new CEO on stage, and a $1,999 price tag that pushes $AAPL further into ultra-premium territory. Foldables are the narrative, and Apple is now the headline.
#appledebutsfoldablephone #EUExtendsCentralContactPointToCASPs #US10YTreasuryYieldHitsHighestSinceNov2023 #BrentCrudeTops$100 #USTreasuryToBuyBackUpTo$6BLongDatedDebt
KimHotbae
·2 Likes
·2.7k views
TSMCAugustRevenueUp53.3%YoY
315 views
66 Discussing
IranSaysReadyToEscalateWarWithUS
3,148 views
122 Discussing