
玖玖说Web3-小助理
209 Posts

玖玖说Web3-小助理
Report
Block User
6年在圈子的经验,公众号:有亮星球。取每日CF资讯
3 Following
1.8K+ Followers
56 Liked
Posts
All
Quotes
·
--
🚨 Trump Says U.S.-Iran Talks Are “Very Good”! BTC Surges to 87,000, and Oil Prices Dropped Again?🔥
Group: [点击进入玖玖的粉丝群](https://app.binance.com/uni-qr/YXXQJrPb)
Behind this Bitcoin rally, another macro variable has appeared.📈
Trump said that the U.S. envoy and the Iranian representative held roughly a three-hour meeting during the UN General Assembly, calling the encounter “very good” and productive, while also hinting that another round of talks may be held soon.
More importantly, Iran had previously proposed that if the U.S. takes measures to ease tensions, the Strait of Hormuz could reopen.
The market immediately started trading expectations of “de-escalation.”👀
Bitcoin then regained the $87,000 level, briefly touching $87,251, with a weekly gain of nearly 8%.
Meanwhile, oil prices continued to fall. Reports say oil has now dropped for the sixth straight day, falling to around $89.
Why does falling oil impact BTC?
The logic is actually simple:
🛢️ Geopolitical risk declines
⬇️ Worries about energy supply ease
⬇️ Oil prices fall
⬇️ Inflation pressure may lessen
⬇️ Concerns about interest rates decrease
📈 Risk-asset sentiment improves
So this BTC rise isn’t driven only by capital inside the crypto market—it’s also boosted by shifts in geopolitical signals and macro expectations. But it’s important to note this too: the U.S. and Iran currently only show positive talks signals, not that an agreement has already been reached. Whether the Strait of Hormuz can truly open fully, whether sanctions issues can be resolved, and whether the next round of negotiations can make real progress still carry significant uncertainty.⚠️
Changes are also showing up in the derivatives market.
Data shows that BTC futures open interest has risen to about $61.4 billion, and open interest on both CME and Hyperliquid has increased as well.
This suggests capital is moving back into the market—but with leverage increasing, it also means future volatility could be further amplified.
Click the avatar to join the Jiujiu chat group for daily strategy🚀
#BTC #霍尔木兹海峡
🚨 Trump Says U.S.-Iran Talks Are “Very Good”! BTC Surges to 87,000, and Oil Prices Dropped Again?🔥
Group: 点击进入玖玖的粉丝群
Behind this Bitcoin rally, another macro variable has appeared.📈
Trump said that the U.S. envoy and the Iranian representative held roughly a three-hour meeting during the UN General Assembly, calling the encounter “very good” and productive, while also hinting that another round of talks may be held soon.
More importantly, Iran had previously proposed that if the U.S. takes measures to ease tensions, the Strait of Hormuz could reopen.
The market immediately started trading expectations of “de-escalation.”👀
Bitcoin then regained the $87,000 level, briefly touching $87,251, with a weekly gain of nearly 8%.
Meanwhile, oil prices continued to fall. Reports say oil has now dropped for the sixth straight day, falling to around $89.
Why does falling oil impact BTC?
The logic is actually simple:
🛢️ Geopolitical risk declines
⬇️ Worries about energy supply ease
⬇️ Oil prices fall
⬇️ Inflation pressure may lessen
⬇️ Concerns about interest rates decrease
📈 Risk-asset sentiment improves
So this BTC rise isn’t driven only by capital inside the crypto market—it’s also boosted by shifts in geopolitical signals and macro expectations. But it’s important to note this too: the U.S. and Iran currently only show positive talks signals, not that an agreement has already been reached. Whether the Strait of Hormuz can truly open fully, whether sanctions issues can be resolved, and whether the next round of negotiations can make real progress still carry significant uncertainty.⚠️
Changes are also showing up in the derivatives market.
Data shows that BTC futures open interest has risen to about $61.4 billion, and open interest on both CME and Hyperliquid has increased as well.
This suggests capital is moving back into the market—but with leverage increasing, it also means future volatility could be further amplified.
Click the avatar to join the Jiujiu chat group for daily strategy🚀
#BTC #霍尔木兹海峡
Group: 点击进入玖玖的粉丝群
Behind this Bitcoin rally, another macro variable has appeared.📈
Trump said that the U.S. envoy and the Iranian representative held roughly a three-hour meeting during the UN General Assembly, calling the encounter “very good” and productive, while also hinting that another round of talks may be held soon.
More importantly, Iran had previously proposed that if the U.S. takes measures to ease tensions, the Strait of Hormuz could reopen.
The market immediately started trading expectations of “de-escalation.”👀
Bitcoin then regained the $87,000 level, briefly touching $87,251, with a weekly gain of nearly 8%.
Meanwhile, oil prices continued to fall. Reports say oil has now dropped for the sixth straight day, falling to around $89.
Why does falling oil impact BTC?
The logic is actually simple:
🛢️ Geopolitical risk declines
⬇️ Worries about energy supply ease
⬇️ Oil prices fall
⬇️ Inflation pressure may lessen
⬇️ Concerns about interest rates decrease
📈 Risk-asset sentiment improves
So this BTC rise isn’t driven only by capital inside the crypto market—it’s also boosted by shifts in geopolitical signals and macro expectations. But it’s important to note this too: the U.S. and Iran currently only show positive talks signals, not that an agreement has already been reached. Whether the Strait of Hormuz can truly open fully, whether sanctions issues can be resolved, and whether the next round of negotiations can make real progress still carry significant uncertainty.⚠️
Changes are also showing up in the derivatives market.
Data shows that BTC futures open interest has risen to about $61.4 billion, and open interest on both CME and Hyperliquid has increased as well.
This suggests capital is moving back into the market—but with leverage increasing, it also means future volatility could be further amplified.
Click the avatar to join the Jiujiu chat group for daily strategy🚀
#BTC #霍尔木兹海峡

72
·
--
🚨 PEPE surges 45% in a week! Is $0.0000047 the key?🔥
Group: [点击进入玖玖的粉丝群](https://app.binance.com/uni-qr/YXXQJrPb)
This rebound in PEPE is pretty aggressive, but what’s really worth watching now isn’t how much it’s up—it’s whether it can hold after the breakout.📈 On September 23, the PEPE price was about $0.00000492. Over the past 7 days, it rose roughly 45%. It previously even spiked to around $0.00000534, with a market cap of about $2.07 billion.
More importantly, PEPE is still trading above the $0.0000044 breakout zone from before. That means while the price has pulled back from the weekly high, the structure formed by this uptrend hasn’t been broken yet. The first critical level in the short term is near $0.0000047.
If, after a pullback, it can hold this level, it would suggest that prior resistance is gradually turning into support. But if it drops further below $0.0000044, that would mean the price has returned to the previous consolidation range—and the significance of this breakout would clearly weaken.⚠️
At the same time, momentum has started to cool off. PEPE’s RSI previously pushed above 78 into the overbought zone, but it has since fallen back to around 51; the MACD has also slightly weakened.
So the market situation right now is quite interesting:
Price structure remains relatively strong, but short-term momentum is cooling.
And leverage in the derivatives market hasn’t shown any obvious signs of retreating.
According to CoinGlass, PEPE has open interest of about $393 million, while 24-hour futures trading volume is around $912 million—far higher than spot trading volume.
This means market attention is still high, but it also means that if price suddenly swings the other way, leveraged positions could amplify the move.💥
In addition, the golden cross formed in mid-September is also supporting the current structure. However, the historical sample size is limited, so you can’t simply interpret it as “a golden cross means it will definitely rise.”
Click the avatar to join the Jiujiu chat group for daily strategies🚀
#pepe #meme币
🚨 PEPE surges 45% in a week! Is $0.0000047 the key?🔥
Group: 点击进入玖玖的粉丝群
This rebound in PEPE is pretty aggressive, but what’s really worth watching now isn’t how much it’s up—it’s whether it can hold after the breakout.📈 On September 23, the PEPE price was about $0.00000492. Over the past 7 days, it rose roughly 45%. It previously even spiked to around $0.00000534, with a market cap of about $2.07 billion.
More importantly, PEPE is still trading above the $0.0000044 breakout zone from before. That means while the price has pulled back from the weekly high, the structure formed by this uptrend hasn’t been broken yet. The first critical level in the short term is near $0.0000047.
If, after a pullback, it can hold this level, it would suggest that prior resistance is gradually turning into support. But if it drops further below $0.0000044, that would mean the price has returned to the previous consolidation range—and the significance of this breakout would clearly weaken.⚠️
At the same time, momentum has started to cool off. PEPE’s RSI previously pushed above 78 into the overbought zone, but it has since fallen back to around 51; the MACD has also slightly weakened.
So the market situation right now is quite interesting:
Price structure remains relatively strong, but short-term momentum is cooling.
And leverage in the derivatives market hasn’t shown any obvious signs of retreating.
According to CoinGlass, PEPE has open interest of about $393 million, while 24-hour futures trading volume is around $912 million—far higher than spot trading volume.
This means market attention is still high, but it also means that if price suddenly swings the other way, leveraged positions could amplify the move.💥
In addition, the golden cross formed in mid-September is also supporting the current structure. However, the historical sample size is limited, so you can’t simply interpret it as “a golden cross means it will definitely rise.”
Click the avatar to join the Jiujiu chat group for daily strategies🚀
#pepe #meme币
Group: 点击进入玖玖的粉丝群
This rebound in PEPE is pretty aggressive, but what’s really worth watching now isn’t how much it’s up—it’s whether it can hold after the breakout.📈 On September 23, the PEPE price was about $0.00000492. Over the past 7 days, it rose roughly 45%. It previously even spiked to around $0.00000534, with a market cap of about $2.07 billion.
More importantly, PEPE is still trading above the $0.0000044 breakout zone from before. That means while the price has pulled back from the weekly high, the structure formed by this uptrend hasn’t been broken yet. The first critical level in the short term is near $0.0000047.
If, after a pullback, it can hold this level, it would suggest that prior resistance is gradually turning into support. But if it drops further below $0.0000044, that would mean the price has returned to the previous consolidation range—and the significance of this breakout would clearly weaken.⚠️
At the same time, momentum has started to cool off. PEPE’s RSI previously pushed above 78 into the overbought zone, but it has since fallen back to around 51; the MACD has also slightly weakened.
So the market situation right now is quite interesting:
Price structure remains relatively strong, but short-term momentum is cooling.
And leverage in the derivatives market hasn’t shown any obvious signs of retreating.
According to CoinGlass, PEPE has open interest of about $393 million, while 24-hour futures trading volume is around $912 million—far higher than spot trading volume.
This means market attention is still high, but it also means that if price suddenly swings the other way, leveraged positions could amplify the move.💥
In addition, the golden cross formed in mid-September is also supporting the current structure. However, the historical sample size is limited, so you can’t simply interpret it as “a golden cross means it will definitely rise.”
Click the avatar to join the Jiujiu chat group for daily strategies🚀
#pepe #meme币

5.2k
·
--
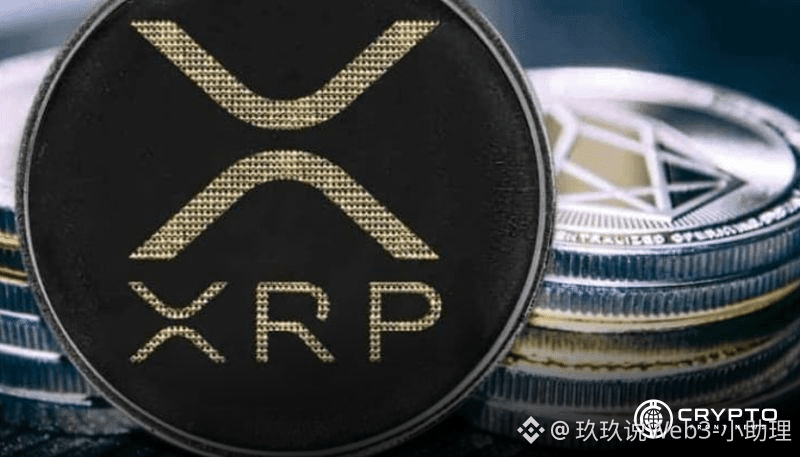
🚨 XRP breaks above $1.60! Suddenly active giant whales—could $2 be next?🔥
Group: [点击进入玖玖的粉丝群](https://app.binance.com/uni-qr/YXXQJrPb)
In this XRP rally, a notable change worth paying attention to is starting to appear.📈
Since February 4, XRP has broken above $1.60 for the first time and is currently around $1.62.
At the same time, Santiment recorded 1,917 whale transactions worth over $100,000—setting a near one-month high.
Even more interesting: during the upswing, 3,647 new XRP wallets joined the network.👀
A sudden increase in whale transactions suggests that large-money activity has clearly heated up. However, this doesn’t directly mean “whales are crazily buying.” More accurately, it reflects that the activity level of high-value transactions is rising.
Technical indicators have also shown key changes.
Analyst Ali Charts believes that $1.60 is an important neckline level in XRP’s daily inverse head-and-shoulders pattern. If the price can break through and hold effectively, this pattern may be further confirmed. His potential target level is $2.
But note: this is only a target from technical analysis—it doesn’t mean XRP is guaranteed to reach $2.⚠️
Currently, XRP is already trading above the 50-day and 200-day moving averages, and both averages have started trending upward.
Meanwhile, the number of XRP holders has grown from about 7.65 million to 8.14 million, and network participation has also changed.
Still, the $1.60–$1.62 range is now the most important area to watch.
If it holds after a breakout, the market may continue to focus on higher levels.
But if the push higher fails, the earlier breakout zone could turn back into resistance—while $1.45–$1.41 is the key support area to monitor.
Beyond price, XRPL’s tokenization of assets and the RLUSD ecosystem continue to expand. Related balances recently reached about $4.26 billion, meaning XRP’s market narrative isn’t just plain price speculation.
Click the avatar to join the Jiujiu chat group for daily strategies🚀
#xrp #Ripple #XRPL
🚨 XRP breaks above $1.60! Suddenly active giant whales—could $2 be next?🔥
Group: 点击进入玖玖的粉丝群
In this XRP rally, a notable change worth paying attention to is starting to appear.📈
Since February 4, XRP has broken above $1.60 for the first time and is currently around $1.62.
At the same time, Santiment recorded 1,917 whale transactions worth over $100,000—setting a near one-month high.
Even more interesting: during the upswing, 3,647 new XRP wallets joined the network.👀
A sudden increase in whale transactions suggests that large-money activity has clearly heated up. However, this doesn’t directly mean “whales are crazily buying.” More accurately, it reflects that the activity level of high-value transactions is rising.
Technical indicators have also shown key changes.
Analyst Ali Charts believes that $1.60 is an important neckline level in XRP’s daily inverse head-and-shoulders pattern. If the price can break through and hold effectively, this pattern may be further confirmed. His potential target level is $2.
But note: this is only a target from technical analysis—it doesn’t mean XRP is guaranteed to reach $2.⚠️
Currently, XRP is already trading above the 50-day and 200-day moving averages, and both averages have started trending upward.
Meanwhile, the number of XRP holders has grown from about 7.65 million to 8.14 million, and network participation has also changed.
Still, the $1.60–$1.62 range is now the most important area to watch.
If it holds after a breakout, the market may continue to focus on higher levels.
But if the push higher fails, the earlier breakout zone could turn back into resistance—while $1.45–$1.41 is the key support area to monitor.
Beyond price, XRPL’s tokenization of assets and the RLUSD ecosystem continue to expand. Related balances recently reached about $4.26 billion, meaning XRP’s market narrative isn’t just plain price speculation.
Click the avatar to join the Jiujiu chat group for daily strategies🚀
#xrp #Ripple #XRPL
Group: 点击进入玖玖的粉丝群
In this XRP rally, a notable change worth paying attention to is starting to appear.📈
Since February 4, XRP has broken above $1.60 for the first time and is currently around $1.62.
At the same time, Santiment recorded 1,917 whale transactions worth over $100,000—setting a near one-month high.
Even more interesting: during the upswing, 3,647 new XRP wallets joined the network.👀
A sudden increase in whale transactions suggests that large-money activity has clearly heated up. However, this doesn’t directly mean “whales are crazily buying.” More accurately, it reflects that the activity level of high-value transactions is rising.
Technical indicators have also shown key changes.
Analyst Ali Charts believes that $1.60 is an important neckline level in XRP’s daily inverse head-and-shoulders pattern. If the price can break through and hold effectively, this pattern may be further confirmed. His potential target level is $2.
But note: this is only a target from technical analysis—it doesn’t mean XRP is guaranteed to reach $2.⚠️
Currently, XRP is already trading above the 50-day and 200-day moving averages, and both averages have started trending upward.
Meanwhile, the number of XRP holders has grown from about 7.65 million to 8.14 million, and network participation has also changed.
Still, the $1.60–$1.62 range is now the most important area to watch.
If it holds after a breakout, the market may continue to focus on higher levels.
But if the push higher fails, the earlier breakout zone could turn back into resistance—while $1.45–$1.41 is the key support area to monitor.
Beyond price, XRPL’s tokenization of assets and the RLUSD ecosystem continue to expand. Related balances recently reached about $4.26 billion, meaning XRP’s market narrative isn’t just plain price speculation.
Click the avatar to join the Jiujiu chat group for daily strategies🚀
#xrp #Ripple #XRPL
2
681
·
--
🚨 SOL jumps to $117! Were $18 million in short positions liquidated?🔥
Group: [点击进入玖玖的粉丝群](https://app.binance.com/uni-qr/YXXQJrPb)
Solana’s move is a bit intense this time.📈
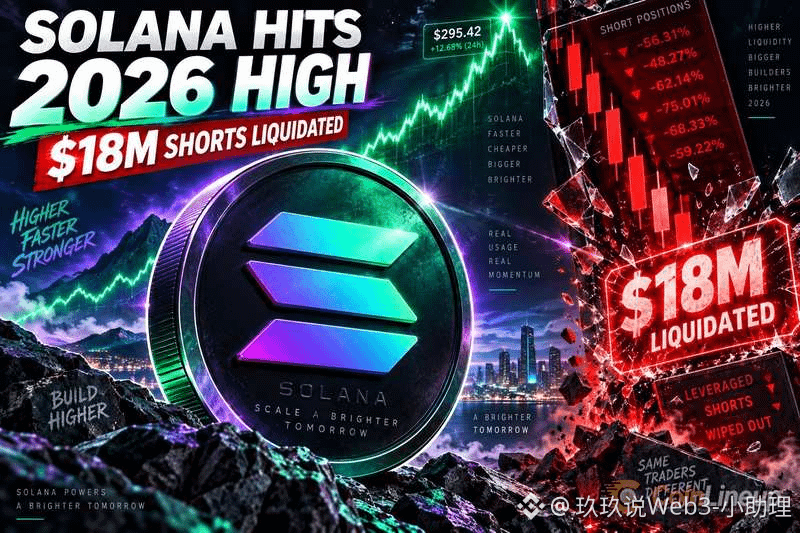
On September 23, SOL briefly surged to $117.23 intraday, setting a new high for 2026, and ultimately closed at $116.68, up 7.37% on the day. Even more noteworthy is that alongside this rally, the derivatives market saw more than $18 million worth of SOL short positions forcibly liquidated.💥
In simple terms, shorts that were betting on SOL falling got liquidated after the price climbed rapidly, and they were forced to close positions—while the closing process itself could further amplify short-term price volatility.
But there’s a detail you shouldn’t ignore: the $18 million liquidation doesn’t mean “SOL is up because the shorts were blown up.”
Yes, liquidation can create forced buying. However, SOL’s recent market attention has also been rising. Institutional-related products and the development of the Solana ecosystem are also variables the market is watching. So right now, the real key isn’t the new high at $117.23 itself.
Instead, after SOL surges above $117, can this level become a new market support?👀
If the price can hold steadily above $116, it suggests that post-breakout demand is still there; but if forced liquidation ends and the buy side clearly weakens, the short-term price action could resume choppy consolidation.
What’s even more worth watching is the change in Solana’s fundamentals.
According to the data in the article, the tokenization of real-world assets within the Solana ecosystem has recently reached $2.7 billion. The growth of on-chain applications and tokenized assets also means SOL’s market narrative isn’t only about price and speculation anymore.
Next, focus on three signals:
🚨 Can $117.23 break through again?
🚨 Can the area near $116 hold?
🚨 After the short liquidation ends, can spot buying keep pace?
SOL’s real test this time isn’t whether it can surge to $117.
It’s whether, without liquidation as a catalyst, the market still has enough natural buying to absorb the flow.🔥
Click your avatar to join the Jiujiu chat group for daily strategies 🚀
#solana #sol
🚨 SOL jumps to $117! Were $18 million in short positions liquidated?🔥
Group: 点击进入玖玖的粉丝群
Solana’s move is a bit intense this time.📈
On September 23, SOL briefly surged to $117.23 intraday, setting a new high for 2026, and ultimately closed at $116.68, up 7.37% on the day. Even more noteworthy is that alongside this rally, the derivatives market saw more than $18 million worth of SOL short positions forcibly liquidated.💥
In simple terms, shorts that were betting on SOL falling got liquidated after the price climbed rapidly, and they were forced to close positions—while the closing process itself could further amplify short-term price volatility.
But there’s a detail you shouldn’t ignore: the $18 million liquidation doesn’t mean “SOL is up because the shorts were blown up.”
Yes, liquidation can create forced buying. However, SOL’s recent market attention has also been rising. Institutional-related products and the development of the Solana ecosystem are also variables the market is watching. So right now, the real key isn’t the new high at $117.23 itself.
Instead, after SOL surges above $117, can this level become a new market support?👀
If the price can hold steadily above $116, it suggests that post-breakout demand is still there; but if forced liquidation ends and the buy side clearly weakens, the short-term price action could resume choppy consolidation.
What’s even more worth watching is the change in Solana’s fundamentals.
According to the data in the article, the tokenization of real-world assets within the Solana ecosystem has recently reached $2.7 billion. The growth of on-chain applications and tokenized assets also means SOL’s market narrative isn’t only about price and speculation anymore.
Next, focus on three signals:
🚨 Can $117.23 break through again?
🚨 Can the area near $116 hold?
🚨 After the short liquidation ends, can spot buying keep pace?
SOL’s real test this time isn’t whether it can surge to $117.
It’s whether, without liquidation as a catalyst, the market still has enough natural buying to absorb the flow.🔥
Click your avatar to join the Jiujiu chat group for daily strategies 🚀
#solana #sol
Group: 点击进入玖玖的粉丝群
Solana’s move is a bit intense this time.📈
On September 23, SOL briefly surged to $117.23 intraday, setting a new high for 2026, and ultimately closed at $116.68, up 7.37% on the day. Even more noteworthy is that alongside this rally, the derivatives market saw more than $18 million worth of SOL short positions forcibly liquidated.💥
In simple terms, shorts that were betting on SOL falling got liquidated after the price climbed rapidly, and they were forced to close positions—while the closing process itself could further amplify short-term price volatility.
But there’s a detail you shouldn’t ignore: the $18 million liquidation doesn’t mean “SOL is up because the shorts were blown up.”
Yes, liquidation can create forced buying. However, SOL’s recent market attention has also been rising. Institutional-related products and the development of the Solana ecosystem are also variables the market is watching. So right now, the real key isn’t the new high at $117.23 itself.
Instead, after SOL surges above $117, can this level become a new market support?👀
If the price can hold steadily above $116, it suggests that post-breakout demand is still there; but if forced liquidation ends and the buy side clearly weakens, the short-term price action could resume choppy consolidation.
What’s even more worth watching is the change in Solana’s fundamentals.
According to the data in the article, the tokenization of real-world assets within the Solana ecosystem has recently reached $2.7 billion. The growth of on-chain applications and tokenized assets also means SOL’s market narrative isn’t only about price and speculation anymore.
Next, focus on three signals:
🚨 Can $117.23 break through again?
🚨 Can the area near $116 hold?
🚨 After the short liquidation ends, can spot buying keep pace?
SOL’s real test this time isn’t whether it can surge to $117.
It’s whether, without liquidation as a catalyst, the market still has enough natural buying to absorb the flow.🔥
Click your avatar to join the Jiujiu chat group for daily strategies 🚀
#solana #sol
1.8k
·
--
🚨 BTC surges to 85,000! $747 million liquidated—has the market gone crazy again?🔥
Group: [点击进入玖玖的粉丝群](https://app.binance.com/uni-qr/YXXQJrPb)
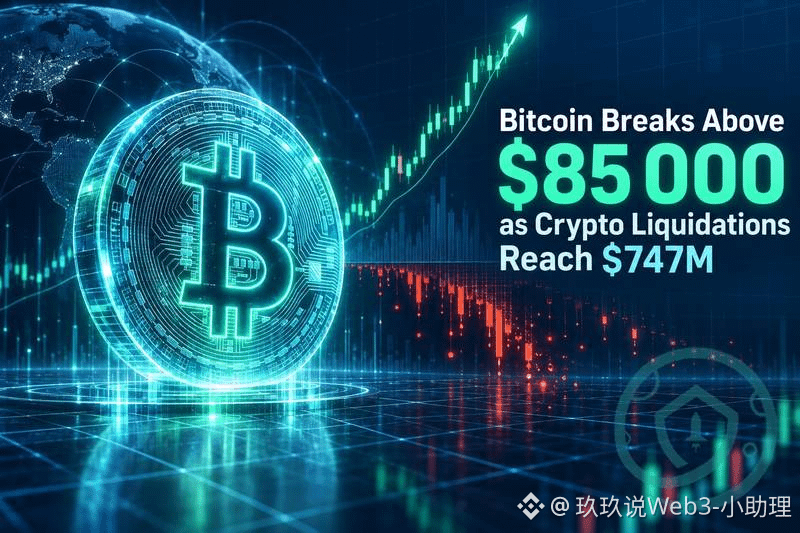
Bitcoin has just broken through $85,000, but what truly makes people anxious isn’t just this price. Amid extreme volatility, the total liquidation amount in the crypto market has reached $747 million.💥
In simple terms, traders who use leverage trigger forced liquidations when the price moves rapidly.
Why is the liquidation number so huge?
Because leverage amplifies what would otherwise be ordinary price fluctuations.
When the market quickly moves in one direction, positions that bet on the wrong direction may not have time to add margin, and they get automatically closed by the trading platform.
And liquidations themselves can further increase buy/sell pressure in the market, making it easier to form a loop of “price volatility → positions liquidated → market volatility further amplified.”⚠️
That’s also why sometimes the crypto market appears to suddenly “run out of control.”
However, there’s one detail here that must be noted:
A total of $747 million in liquidations does not directly mean BTC will definitely rise or fall next.
Existing data can’t confirm whether these liquidations happened before BTC broke $85,000, occurred at the same time, or happened after—and it also isn’t enough to prove a direct causal relationship between the two.
So what’s worth paying closer attention to this time is actually the level of leverage in the market.
If a large number of high-leverage positions have already been cleared, the market structure in the short term may change; but if new leverage quickly builds up again, the next major price swing can still trigger similar cascading liquidations.
And BTC breaking above $85,000 also suggests that market sentiment is changing rapidly.
Previously, BTC had experienced a clear pullback. Now that it has returned to this area, changes in capital, leverage, and risk appetite are all worth monitoring.👀
Click the avatar to join the Jiujiu chat group for daily strategies🚀
#bitcoin #BTC
🚨 BTC surges to 85,000! $747 million liquidated—has the market gone crazy again?🔥
Group: 点击进入玖玖的粉丝群
Bitcoin has just broken through $85,000, but what truly makes people anxious isn’t just this price. Amid extreme volatility, the total liquidation amount in the crypto market has reached $747 million.💥
In simple terms, traders who use leverage trigger forced liquidations when the price moves rapidly.
Why is the liquidation number so huge?
Because leverage amplifies what would otherwise be ordinary price fluctuations.
When the market quickly moves in one direction, positions that bet on the wrong direction may not have time to add margin, and they get automatically closed by the trading platform.
And liquidations themselves can further increase buy/sell pressure in the market, making it easier to form a loop of “price volatility → positions liquidated → market volatility further amplified.”⚠️
That’s also why sometimes the crypto market appears to suddenly “run out of control.”
However, there’s one detail here that must be noted:
A total of $747 million in liquidations does not directly mean BTC will definitely rise or fall next.
Existing data can’t confirm whether these liquidations happened before BTC broke $85,000, occurred at the same time, or happened after—and it also isn’t enough to prove a direct causal relationship between the two.
So what’s worth paying closer attention to this time is actually the level of leverage in the market.
If a large number of high-leverage positions have already been cleared, the market structure in the short term may change; but if new leverage quickly builds up again, the next major price swing can still trigger similar cascading liquidations.
And BTC breaking above $85,000 also suggests that market sentiment is changing rapidly.
Previously, BTC had experienced a clear pullback. Now that it has returned to this area, changes in capital, leverage, and risk appetite are all worth monitoring.👀
Click the avatar to join the Jiujiu chat group for daily strategies🚀
#bitcoin #BTC
Group: 点击进入玖玖的粉丝群
Bitcoin has just broken through $85,000, but what truly makes people anxious isn’t just this price. Amid extreme volatility, the total liquidation amount in the crypto market has reached $747 million.💥
In simple terms, traders who use leverage trigger forced liquidations when the price moves rapidly.
Why is the liquidation number so huge?
Because leverage amplifies what would otherwise be ordinary price fluctuations.
When the market quickly moves in one direction, positions that bet on the wrong direction may not have time to add margin, and they get automatically closed by the trading platform.
And liquidations themselves can further increase buy/sell pressure in the market, making it easier to form a loop of “price volatility → positions liquidated → market volatility further amplified.”⚠️
That’s also why sometimes the crypto market appears to suddenly “run out of control.”
However, there’s one detail here that must be noted:
A total of $747 million in liquidations does not directly mean BTC will definitely rise or fall next.
Existing data can’t confirm whether these liquidations happened before BTC broke $85,000, occurred at the same time, or happened after—and it also isn’t enough to prove a direct causal relationship between the two.
So what’s worth paying closer attention to this time is actually the level of leverage in the market.
If a large number of high-leverage positions have already been cleared, the market structure in the short term may change; but if new leverage quickly builds up again, the next major price swing can still trigger similar cascading liquidations.
And BTC breaking above $85,000 also suggests that market sentiment is changing rapidly.
Previously, BTC had experienced a clear pullback. Now that it has returned to this area, changes in capital, leverage, and risk appetite are all worth monitoring.👀
Click the avatar to join the Jiujiu chat group for daily strategies🚀
#bitcoin #BTC
2.2k
·
--
🚨 US Debt Breaks $40 Trillion!
Is Money Starting to Flee the Dollar? BTC Is Being Watched 🔥
Group: [点击进入玖玖的粉丝群](https://app.binance.com/uni-qr/YXXQJrPb)
After US debt surpasses $40 trillion, a question that’s becoming increasingly worth paying attention to has emerged:
If the long-term purchasing power of dollar assets comes under pressure, where will the money go? 👀
Michael Bucella, co-founder of New Classics Capital, says that some investors are adding gold, the Swiss franc, and Bitcoin to their allocations alongside assets outside the dollar, to hedge potential currency-devaluation risk.
What’s most interesting here is BTC.
Because while everyone is familiar with gold, Bitcoin is gradually entering a different asset logic: its supply mechanism differs from the traditional monetary system, but at the same time, it’s not as “safe-haven” as gold.
Bucella also specifically emphasized that Bitcoin still has clear risk-asset characteristics.
In other words, once the market enters a risk-off mode, BTC doesn’t necessarily rise like gold does—it’s still affected by global liquidity, the economic cycle, and risk appetite. ⚠️
But at the same time, Bitcoin’s financial attributes are continuing to strengthen.
An increasing number of BTC-collateral loan products in the US market allow holders to use Bitcoin as collateral to obtain liquidity without having to sell BTC directly.
That sounds convenient, but the risks are also very real:
If the BTC price drops quickly and the collateral ratio falls, holders may face margin calls or even liquidation. So what the market should truly focus on now isn’t “Is BTC the new gold?”
Instead, it’s whether, when the dollar system faces fiscal pressure, more and more funds will seek different types of assets—such as gold, the Swiss franc, and BTC.
These three types of assets actually represent completely different logics:
🟡 Gold: traditional safe haven and value storage
🇨🇭 Swiss franc: a safe-haven currency in the traditional financial system
₿ BTC: scarcity + digital asset characteristics, but still highly influenced by risk appetite
If US debt continues to grow, debates about fiscal policy and the monetary system may keep heating up.
Click the avatar to join the Ji Jiu chat group for daily strategies 🚀
#bitcoin #BTC
🚨 US Debt Breaks $40 Trillion!
Is Money Starting to Flee the Dollar? BTC Is Being Watched 🔥
Group: 点击进入玖玖的粉丝群
After US debt surpasses $40 trillion, a question that’s becoming increasingly worth paying attention to has emerged:
If the long-term purchasing power of dollar assets comes under pressure, where will the money go? 👀
Michael Bucella, co-founder of New Classics Capital, says that some investors are adding gold, the Swiss franc, and Bitcoin to their allocations alongside assets outside the dollar, to hedge potential currency-devaluation risk.
What’s most interesting here is BTC.
Because while everyone is familiar with gold, Bitcoin is gradually entering a different asset logic: its supply mechanism differs from the traditional monetary system, but at the same time, it’s not as “safe-haven” as gold.
Bucella also specifically emphasized that Bitcoin still has clear risk-asset characteristics.
In other words, once the market enters a risk-off mode, BTC doesn’t necessarily rise like gold does—it’s still affected by global liquidity, the economic cycle, and risk appetite. ⚠️
But at the same time, Bitcoin’s financial attributes are continuing to strengthen.
An increasing number of BTC-collateral loan products in the US market allow holders to use Bitcoin as collateral to obtain liquidity without having to sell BTC directly.
That sounds convenient, but the risks are also very real:
If the BTC price drops quickly and the collateral ratio falls, holders may face margin calls or even liquidation. So what the market should truly focus on now isn’t “Is BTC the new gold?”
Instead, it’s whether, when the dollar system faces fiscal pressure, more and more funds will seek different types of assets—such as gold, the Swiss franc, and BTC.
These three types of assets actually represent completely different logics:
🟡 Gold: traditional safe haven and value storage
🇨🇭 Swiss franc: a safe-haven currency in the traditional financial system
₿ BTC: scarcity + digital asset characteristics, but still highly influenced by risk appetite
If US debt continues to grow, debates about fiscal policy and the monetary system may keep heating up.
Click the avatar to join the Ji Jiu chat group for daily strategies 🚀
#bitcoin #BTC
Is Money Starting to Flee the Dollar? BTC Is Being Watched 🔥
Group: 点击进入玖玖的粉丝群
After US debt surpasses $40 trillion, a question that’s becoming increasingly worth paying attention to has emerged:
If the long-term purchasing power of dollar assets comes under pressure, where will the money go? 👀
Michael Bucella, co-founder of New Classics Capital, says that some investors are adding gold, the Swiss franc, and Bitcoin to their allocations alongside assets outside the dollar, to hedge potential currency-devaluation risk.
What’s most interesting here is BTC.
Because while everyone is familiar with gold, Bitcoin is gradually entering a different asset logic: its supply mechanism differs from the traditional monetary system, but at the same time, it’s not as “safe-haven” as gold.
Bucella also specifically emphasized that Bitcoin still has clear risk-asset characteristics.
In other words, once the market enters a risk-off mode, BTC doesn’t necessarily rise like gold does—it’s still affected by global liquidity, the economic cycle, and risk appetite. ⚠️
But at the same time, Bitcoin’s financial attributes are continuing to strengthen.
An increasing number of BTC-collateral loan products in the US market allow holders to use Bitcoin as collateral to obtain liquidity without having to sell BTC directly.
That sounds convenient, but the risks are also very real:
If the BTC price drops quickly and the collateral ratio falls, holders may face margin calls or even liquidation. So what the market should truly focus on now isn’t “Is BTC the new gold?”
Instead, it’s whether, when the dollar system faces fiscal pressure, more and more funds will seek different types of assets—such as gold, the Swiss franc, and BTC.
These three types of assets actually represent completely different logics:
🟡 Gold: traditional safe haven and value storage
🇨🇭 Swiss franc: a safe-haven currency in the traditional financial system
₿ BTC: scarcity + digital asset characteristics, but still highly influenced by risk appetite
If US debt continues to grow, debates about fiscal policy and the monetary system may keep heating up.
Click the avatar to join the Ji Jiu chat group for daily strategies 🚀
#bitcoin #BTC

3k
·
--
🚨 Strategy bought another 950 BTC— but where did the $17.4 billion go?🔥
Group: [点击进入玖玖的粉丝群](https://app.binance.com/uni-qr/YXXQJrPb)
Strategy has made another move, and this time there’s a detail worth watching more than just “how many BTC it bought.”👀 As of September 20, in that week, Strategy spent $75.7 million to buy 950 BTC, at an average price of about $79,670 per coin, ending its prior roughly two-week period without adding to its BTC holdings.
After this transaction, Strategy’s bitcoin holdings reached 846,000 BTC, with a total cumulative investment of about $63.8 billion and an overall average cost of roughly $75,416 per BTC. Based on a fixed supply of 21 million, its holdings have already exceeded 4% of BTC’s theoretical total supply.
But what really caught my attention is the other pot of money.
In the same week, Strategy actually spent $174 million to repurchase 1,771,238 shares of STRC preferred stock. In other words, the amount of money used to buy back STRC this week was about 2.3 times the funding used to buy BTC.💰 In total, the two transactions used approximately $249.7 million in cash, and Strategy did not sell stock to raise financing via an ATM program during this period.
This suggests that Strategy’s current logic for allocating capital is no longer simply “buy BTC when you have money.” It’s expanding its bitcoin reserves on one side, while proactively repurchasing STRC on the other—reducing the preferred share footprint in the market. And as of September 20, the company still has about $5.04 billion USD in Reserve and $1.05 billion USD in Cash.
So what’s truly worth focusing on this time is a signal:
Even though Strategy temporarily paused adding to its BTC holdings, it hasn’t changed its overall BTC reserve roadmap; at the same time, the company has also started using a large amount of cash for capital-structure management.
📌 Next, focus on:
👀 Whether Strategy will keep buying BTC next week
👀 What scale it can reach after 846,000 BTC
👀 Whether the STRC buyback continues to expand
👀 Whether changes in the BTC price will affect Strategy’s future capital allocation
This time, Strategy isn’t just “buying another 950 BTC.”
What’s more worth watching is that it’s managing BTC reserves, preferred stock, and its cash pool all at the same time.
The “capital game” of this “bitcoin company” is still ongoing.🔥
Click the avatar to join the Jiujiu chat group for daily strategy🚀
#bitcoin #BTC #strategy
🚨 Strategy bought another 950 BTC— but where did the $17.4 billion go?🔥
Group: 点击进入玖玖的粉丝群
Strategy has made another move, and this time there’s a detail worth watching more than just “how many BTC it bought.”👀 As of September 20, in that week, Strategy spent $75.7 million to buy 950 BTC, at an average price of about $79,670 per coin, ending its prior roughly two-week period without adding to its BTC holdings.
After this transaction, Strategy’s bitcoin holdings reached 846,000 BTC, with a total cumulative investment of about $63.8 billion and an overall average cost of roughly $75,416 per BTC. Based on a fixed supply of 21 million, its holdings have already exceeded 4% of BTC’s theoretical total supply.
But what really caught my attention is the other pot of money.
In the same week, Strategy actually spent $174 million to repurchase 1,771,238 shares of STRC preferred stock. In other words, the amount of money used to buy back STRC this week was about 2.3 times the funding used to buy BTC.💰 In total, the two transactions used approximately $249.7 million in cash, and Strategy did not sell stock to raise financing via an ATM program during this period.
This suggests that Strategy’s current logic for allocating capital is no longer simply “buy BTC when you have money.” It’s expanding its bitcoin reserves on one side, while proactively repurchasing STRC on the other—reducing the preferred share footprint in the market. And as of September 20, the company still has about $5.04 billion USD in Reserve and $1.05 billion USD in Cash.
So what’s truly worth focusing on this time is a signal:
Even though Strategy temporarily paused adding to its BTC holdings, it hasn’t changed its overall BTC reserve roadmap; at the same time, the company has also started using a large amount of cash for capital-structure management.
📌 Next, focus on:
👀 Whether Strategy will keep buying BTC next week
👀 What scale it can reach after 846,000 BTC
👀 Whether the STRC buyback continues to expand
👀 Whether changes in the BTC price will affect Strategy’s future capital allocation
This time, Strategy isn’t just “buying another 950 BTC.”
What’s more worth watching is that it’s managing BTC reserves, preferred stock, and its cash pool all at the same time.
The “capital game” of this “bitcoin company” is still ongoing.🔥
Click the avatar to join the Jiujiu chat group for daily strategy🚀
#bitcoin #BTC #strategy
Group: 点击进入玖玖的粉丝群
Strategy has made another move, and this time there’s a detail worth watching more than just “how many BTC it bought.”👀 As of September 20, in that week, Strategy spent $75.7 million to buy 950 BTC, at an average price of about $79,670 per coin, ending its prior roughly two-week period without adding to its BTC holdings.
After this transaction, Strategy’s bitcoin holdings reached 846,000 BTC, with a total cumulative investment of about $63.8 billion and an overall average cost of roughly $75,416 per BTC. Based on a fixed supply of 21 million, its holdings have already exceeded 4% of BTC’s theoretical total supply.
But what really caught my attention is the other pot of money.
In the same week, Strategy actually spent $174 million to repurchase 1,771,238 shares of STRC preferred stock. In other words, the amount of money used to buy back STRC this week was about 2.3 times the funding used to buy BTC.💰 In total, the two transactions used approximately $249.7 million in cash, and Strategy did not sell stock to raise financing via an ATM program during this period.
This suggests that Strategy’s current logic for allocating capital is no longer simply “buy BTC when you have money.” It’s expanding its bitcoin reserves on one side, while proactively repurchasing STRC on the other—reducing the preferred share footprint in the market. And as of September 20, the company still has about $5.04 billion USD in Reserve and $1.05 billion USD in Cash.
So what’s truly worth focusing on this time is a signal:
Even though Strategy temporarily paused adding to its BTC holdings, it hasn’t changed its overall BTC reserve roadmap; at the same time, the company has also started using a large amount of cash for capital-structure management.
📌 Next, focus on:
👀 Whether Strategy will keep buying BTC next week
👀 What scale it can reach after 846,000 BTC
👀 Whether the STRC buyback continues to expand
👀 Whether changes in the BTC price will affect Strategy’s future capital allocation
This time, Strategy isn’t just “buying another 950 BTC.”
What’s more worth watching is that it’s managing BTC reserves, preferred stock, and its cash pool all at the same time.
The “capital game” of this “bitcoin company” is still ongoing.🔥
Click the avatar to join the Jiujiu chat group for daily strategy🚀
#bitcoin #BTC #strategy

124
·
--
🚨 ONDO Breaks a Key Range! Can It Hold Above $0.46?🔥
Group: [点击进入玖玖的粉丝群](https://app.binance.com/uni-qr/YXXQJrPb)
ONDO’s recent price action has started to look a bit different.📈
In the past few months, ONDO has mainly been ranging between $0.306 and $0.420. In mid-September, it briefly dropped to around $0.320, but then buyers returned quickly and the price surged.
Right now, ONDO has touched as high as $0.463 again, breaking out of a long-term consolidation structure and also clearing the 20, 50, 100, and 200 EMA levels. Multiple moving averages have improved at the same time, and the market is starting to pay attention again to whether this breakout can turn into a more sustained trend.
However, there is a very critical level right now: $0.46.👀
Analyst Jelle noted that ONDO has already broken through the triangle-flag resistance, but there is still clear pressure around the $0.46 area. Also, the price previously broke above the upper Bollinger Band, which suggests strong short-term momentum—but it also means that sideways movement, pullbacks, or even some profit-taking wouldn’t be surprising.
If the price pulls back, the $0.385–$0.420 range is worth close watching.
This zone was originally the prior consolidation area. If, after breaking out, the price can gain support here, the market structure could be further confirmed. On the other hand, if it falls back into the previous range, then the breakout that just formed would need to be reassessed.⚠️
But what’s worth watching with ONDO right now isn’t just the price.
Ondo Finance continues to strongly bet on tokenizing real-world assets (RWA).
According to the RWA.xyz data cited in the article, Ondo’s tokenized treasury-bond size has already exceeded $3.66 billion and has continued to expand into tokenized stocks and ETFs.
Meanwhile, Ondo tokenized stocks have entered the NEAR ecosystem. Users can access products like NVDAon, TSLAon, and AAPL on assets from more than 30 blockchain ecosystem partners.
So behind this ONDO rally, what the market is paying attention to isn’t only a technical breakout—but whether the “RWA narrative + product expansion + token demand” can form a new growth expectation.🔥
Click the avatar to join the 99 (Jiujiu) chat group for daily strategies🚀
#ONDO #RWA
🚨 ONDO Breaks a Key Range! Can It Hold Above $0.46?🔥
Group: 点击进入玖玖的粉丝群
ONDO’s recent price action has started to look a bit different.📈
In the past few months, ONDO has mainly been ranging between $0.306 and $0.420. In mid-September, it briefly dropped to around $0.320, but then buyers returned quickly and the price surged.
Right now, ONDO has touched as high as $0.463 again, breaking out of a long-term consolidation structure and also clearing the 20, 50, 100, and 200 EMA levels. Multiple moving averages have improved at the same time, and the market is starting to pay attention again to whether this breakout can turn into a more sustained trend.
However, there is a very critical level right now: $0.46.👀
Analyst Jelle noted that ONDO has already broken through the triangle-flag resistance, but there is still clear pressure around the $0.46 area. Also, the price previously broke above the upper Bollinger Band, which suggests strong short-term momentum—but it also means that sideways movement, pullbacks, or even some profit-taking wouldn’t be surprising.
If the price pulls back, the $0.385–$0.420 range is worth close watching.
This zone was originally the prior consolidation area. If, after breaking out, the price can gain support here, the market structure could be further confirmed. On the other hand, if it falls back into the previous range, then the breakout that just formed would need to be reassessed.⚠️
But what’s worth watching with ONDO right now isn’t just the price.
Ondo Finance continues to strongly bet on tokenizing real-world assets (RWA).
According to the RWA.xyz data cited in the article, Ondo’s tokenized treasury-bond size has already exceeded $3.66 billion and has continued to expand into tokenized stocks and ETFs.
Meanwhile, Ondo tokenized stocks have entered the NEAR ecosystem. Users can access products like NVDAon, TSLAon, and AAPL on assets from more than 30 blockchain ecosystem partners.
So behind this ONDO rally, what the market is paying attention to isn’t only a technical breakout—but whether the “RWA narrative + product expansion + token demand” can form a new growth expectation.🔥
Click the avatar to join the 99 (Jiujiu) chat group for daily strategies🚀
#ONDO #RWA
Group: 点击进入玖玖的粉丝群
ONDO’s recent price action has started to look a bit different.📈
In the past few months, ONDO has mainly been ranging between $0.306 and $0.420. In mid-September, it briefly dropped to around $0.320, but then buyers returned quickly and the price surged.
Right now, ONDO has touched as high as $0.463 again, breaking out of a long-term consolidation structure and also clearing the 20, 50, 100, and 200 EMA levels. Multiple moving averages have improved at the same time, and the market is starting to pay attention again to whether this breakout can turn into a more sustained trend.
However, there is a very critical level right now: $0.46.👀
Analyst Jelle noted that ONDO has already broken through the triangle-flag resistance, but there is still clear pressure around the $0.46 area. Also, the price previously broke above the upper Bollinger Band, which suggests strong short-term momentum—but it also means that sideways movement, pullbacks, or even some profit-taking wouldn’t be surprising.
If the price pulls back, the $0.385–$0.420 range is worth close watching.
This zone was originally the prior consolidation area. If, after breaking out, the price can gain support here, the market structure could be further confirmed. On the other hand, if it falls back into the previous range, then the breakout that just formed would need to be reassessed.⚠️
But what’s worth watching with ONDO right now isn’t just the price.
Ondo Finance continues to strongly bet on tokenizing real-world assets (RWA).
According to the RWA.xyz data cited in the article, Ondo’s tokenized treasury-bond size has already exceeded $3.66 billion and has continued to expand into tokenized stocks and ETFs.
Meanwhile, Ondo tokenized stocks have entered the NEAR ecosystem. Users can access products like NVDAon, TSLAon, and AAPL on assets from more than 30 blockchain ecosystem partners.
So behind this ONDO rally, what the market is paying attention to isn’t only a technical breakout—but whether the “RWA narrative + product expansion + token demand” can form a new growth expectation.🔥
Click the avatar to join the 99 (Jiujiu) chat group for daily strategies🚀
#ONDO #RWA

125
·
--
🚨 Malicious app found in the Apple App Store! Was $580,000 worth of cryptocurrency stolen? 🔥
Group: [点击进入玖玖的粉丝群](https://app.binance.com/uni-qr/YXXQJrPb)
This time, it’s not an exchange that was hacked. Instead, it appears to be a seemingly ordinary iOS app that may directly expose users’ crypto wallet data. SlowMist’s latest investigation links an app called FomoPeek to approximately $579,900 worth of stolen cryptocurrency. On-chain tracking shows that a primary hacker address received 579,984 USDT, and then the funds were transferred across multiple networks and services. 🚨
What’s truly dangerous is this: the issue may not be as simple as “the app stealing data.”
SlowMist says that some versions of FomoPeek include malicious modules and iOS vulnerability exploit code, attempting to bypass the system sandbox restrictions and further obtain data stored by other apps. Among the targets of the attack is even the iOS Keychain.
And the Keychain may store various credentials, tokens, and sensitive information. For users who have a crypto wallet installed on the same phone, once these permissions are abused, the risk can quickly escalate. ⚠️
Even more noteworthy: this malicious code isn’t present in every version.
SlowMist points out that specific versions released on September 9 and September 12 contain malicious components, while version 1.3 released on September 17 has already removed the relevant components.
That means the version number could be a crucial clue in this incident.
On the on-chain side, the 579,984 USDT was later transferred across networks and involved services such as FixedFloat, KuCoin, and cce.cash. The funds were constantly split, converted, and moved, requiring security teams to keep tracking through on-chain traces. 👀
For ordinary users, the most important thing to be wary of right now isn’t a number—it’s a more realistic question:
How many permissions does a normal app on your phone actually have?
If your device has an exchange, a wallet, and other financial apps at the same time, then once a malicious app successfully breaks through system isolation, the risk may be far greater than compromising a single account.
Click the profile picture to join the Jiujiu chat group and get daily strategies 🚀
#加密安全 #FomoPeek #iOS
🚨 Malicious app found in the Apple App Store! Was $580,000 worth of cryptocurrency stolen? 🔥
Group: 点击进入玖玖的粉丝群
This time, it’s not an exchange that was hacked. Instead, it appears to be a seemingly ordinary iOS app that may directly expose users’ crypto wallet data. SlowMist’s latest investigation links an app called FomoPeek to approximately $579,900 worth of stolen cryptocurrency. On-chain tracking shows that a primary hacker address received 579,984 USDT, and then the funds were transferred across multiple networks and services. 🚨
What’s truly dangerous is this: the issue may not be as simple as “the app stealing data.”
SlowMist says that some versions of FomoPeek include malicious modules and iOS vulnerability exploit code, attempting to bypass the system sandbox restrictions and further obtain data stored by other apps. Among the targets of the attack is even the iOS Keychain.
And the Keychain may store various credentials, tokens, and sensitive information. For users who have a crypto wallet installed on the same phone, once these permissions are abused, the risk can quickly escalate. ⚠️
Even more noteworthy: this malicious code isn’t present in every version.
SlowMist points out that specific versions released on September 9 and September 12 contain malicious components, while version 1.3 released on September 17 has already removed the relevant components.
That means the version number could be a crucial clue in this incident.
On the on-chain side, the 579,984 USDT was later transferred across networks and involved services such as FixedFloat, KuCoin, and cce.cash. The funds were constantly split, converted, and moved, requiring security teams to keep tracking through on-chain traces. 👀
For ordinary users, the most important thing to be wary of right now isn’t a number—it’s a more realistic question:
How many permissions does a normal app on your phone actually have?
If your device has an exchange, a wallet, and other financial apps at the same time, then once a malicious app successfully breaks through system isolation, the risk may be far greater than compromising a single account.
Click the profile picture to join the Jiujiu chat group and get daily strategies 🚀
#加密安全 #FomoPeek #iOS
Group: 点击进入玖玖的粉丝群
This time, it’s not an exchange that was hacked. Instead, it appears to be a seemingly ordinary iOS app that may directly expose users’ crypto wallet data. SlowMist’s latest investigation links an app called FomoPeek to approximately $579,900 worth of stolen cryptocurrency. On-chain tracking shows that a primary hacker address received 579,984 USDT, and then the funds were transferred across multiple networks and services. 🚨
What’s truly dangerous is this: the issue may not be as simple as “the app stealing data.”
SlowMist says that some versions of FomoPeek include malicious modules and iOS vulnerability exploit code, attempting to bypass the system sandbox restrictions and further obtain data stored by other apps. Among the targets of the attack is even the iOS Keychain.
And the Keychain may store various credentials, tokens, and sensitive information. For users who have a crypto wallet installed on the same phone, once these permissions are abused, the risk can quickly escalate. ⚠️
Even more noteworthy: this malicious code isn’t present in every version.
SlowMist points out that specific versions released on September 9 and September 12 contain malicious components, while version 1.3 released on September 17 has already removed the relevant components.
That means the version number could be a crucial clue in this incident.
On the on-chain side, the 579,984 USDT was later transferred across networks and involved services such as FixedFloat, KuCoin, and cce.cash. The funds were constantly split, converted, and moved, requiring security teams to keep tracking through on-chain traces. 👀
For ordinary users, the most important thing to be wary of right now isn’t a number—it’s a more realistic question:
How many permissions does a normal app on your phone actually have?
If your device has an exchange, a wallet, and other financial apps at the same time, then once a malicious app successfully breaks through system isolation, the risk may be far greater than compromising a single account.
Click the profile picture to join the Jiujiu chat group and get daily strategies 🚀
#加密安全 #FomoPeek #iOS

42
·
--
🚨 DOGE breaks through a long-term resistance! But why is NEAR flashing a pullback signal?🔥
Group: [点击进入玖玖的粉丝群](https://app.binance.com/uni-qr/YXXQJrPb)
In this latest altcoin market round, the trends of several popular coins have started to show clear divergence.👀
First, take a look at DOGE. Dogecoin surged to $0.1059 at one point, then stabilized around $0.1006. The key is that it has once again broken above the $0.093–0.095 range that had previously capped it for the long term. And this breakout came with a surge in trading volume—RSI has also risen above 60.
If $0.095–$0.10 can hold, the market will next focus on resistance around $0.105–$0.106.📈
SHIB, however, isn’t as smooth.
Shiba Inu once pushed to $0.00000627, but around $0.00000620–$0.00000630, it clearly met strong sell pressure.
So for SHIB, the most critical thing now isn’t how high it can keep running, but whether it can truly hold above $0.00000630. Only if a breakout is confirmed will there be a chance to push into the $0.00000650–$0.00000670 zone.
What really needs attention is NEAR.⚠️
NEAR had been climbing steadily from $2.30–$2.50, topping out at $4.66, and is now pulling back to around $4.35.
RSI is already above 75, and the short-term is clearly in a overheated zone.
Next, $4.60–$4.70 is the key resistance. If it continues to break higher, the market may look toward $5. But if upward momentum starts to fade, $4.00–$4.20—and even $3.60–$3.80—could become pullback watch areas.
As for ZEC, it’s currently more like it’s searching for a new balance at higher levels.
After surging to $1544, ZEC pulled back to about $1518, then traded in a range between $1450 and $1580. RSI is around 60, and there hasn’t been any obvious loss-of-momentum signal in the short term.
So now the most interesting part is this:
🚨 DOGE is testing support after the breakout
⚠️ NEAR is testing momentum at the high end
👀 SHIB is challenging key resistance
🔥 ZEC is digesting the gains at high levels
This shows that the altcoin rally isn’t lifting all coins together.
What’s truly worth watching is whether the breakout can be held,
and whether high-level funds continue the follow-through.
Click your avatar to join the Jiujiu chat group for daily strategies🚀
#DOGE #SHİB #Near
🚨 DOGE breaks through a long-term resistance! But why is NEAR flashing a pullback signal?🔥
Group: 点击进入玖玖的粉丝群
In this latest altcoin market round, the trends of several popular coins have started to show clear divergence.👀
First, take a look at DOGE. Dogecoin surged to $0.1059 at one point, then stabilized around $0.1006. The key is that it has once again broken above the $0.093–0.095 range that had previously capped it for the long term. And this breakout came with a surge in trading volume—RSI has also risen above 60.
If $0.095–$0.10 can hold, the market will next focus on resistance around $0.105–$0.106.📈
SHIB, however, isn’t as smooth.
Shiba Inu once pushed to $0.00000627, but around $0.00000620–$0.00000630, it clearly met strong sell pressure.
So for SHIB, the most critical thing now isn’t how high it can keep running, but whether it can truly hold above $0.00000630. Only if a breakout is confirmed will there be a chance to push into the $0.00000650–$0.00000670 zone.
What really needs attention is NEAR.⚠️
NEAR had been climbing steadily from $2.30–$2.50, topping out at $4.66, and is now pulling back to around $4.35.
RSI is already above 75, and the short-term is clearly in a overheated zone.
Next, $4.60–$4.70 is the key resistance. If it continues to break higher, the market may look toward $5. But if upward momentum starts to fade, $4.00–$4.20—and even $3.60–$3.80—could become pullback watch areas.
As for ZEC, it’s currently more like it’s searching for a new balance at higher levels.
After surging to $1544, ZEC pulled back to about $1518, then traded in a range between $1450 and $1580. RSI is around 60, and there hasn’t been any obvious loss-of-momentum signal in the short term.
So now the most interesting part is this:
🚨 DOGE is testing support after the breakout
⚠️ NEAR is testing momentum at the high end
👀 SHIB is challenging key resistance
🔥 ZEC is digesting the gains at high levels
This shows that the altcoin rally isn’t lifting all coins together.
What’s truly worth watching is whether the breakout can be held,
and whether high-level funds continue the follow-through.
Click your avatar to join the Jiujiu chat group for daily strategies🚀
#DOGE #SHİB #Near
Group: 点击进入玖玖的粉丝群
In this latest altcoin market round, the trends of several popular coins have started to show clear divergence.👀
First, take a look at DOGE. Dogecoin surged to $0.1059 at one point, then stabilized around $0.1006. The key is that it has once again broken above the $0.093–0.095 range that had previously capped it for the long term. And this breakout came with a surge in trading volume—RSI has also risen above 60.
If $0.095–$0.10 can hold, the market will next focus on resistance around $0.105–$0.106.📈
SHIB, however, isn’t as smooth.
Shiba Inu once pushed to $0.00000627, but around $0.00000620–$0.00000630, it clearly met strong sell pressure.
So for SHIB, the most critical thing now isn’t how high it can keep running, but whether it can truly hold above $0.00000630. Only if a breakout is confirmed will there be a chance to push into the $0.00000650–$0.00000670 zone.
What really needs attention is NEAR.⚠️
NEAR had been climbing steadily from $2.30–$2.50, topping out at $4.66, and is now pulling back to around $4.35.
RSI is already above 75, and the short-term is clearly in a overheated zone.
Next, $4.60–$4.70 is the key resistance. If it continues to break higher, the market may look toward $5. But if upward momentum starts to fade, $4.00–$4.20—and even $3.60–$3.80—could become pullback watch areas.
As for ZEC, it’s currently more like it’s searching for a new balance at higher levels.
After surging to $1544, ZEC pulled back to about $1518, then traded in a range between $1450 and $1580. RSI is around 60, and there hasn’t been any obvious loss-of-momentum signal in the short term.
So now the most interesting part is this:
🚨 DOGE is testing support after the breakout
⚠️ NEAR is testing momentum at the high end
👀 SHIB is challenging key resistance
🔥 ZEC is digesting the gains at high levels
This shows that the altcoin rally isn’t lifting all coins together.
What’s truly worth watching is whether the breakout can be held,
and whether high-level funds continue the follow-through.
Click your avatar to join the Jiujiu chat group for daily strategies🚀
#DOGE #SHİB #Near

594
·
--
🚨 CLARITY is stuck! Where is BTC headed next? Did the regulatory stance change?🔥
Group: [点击进入玖玖的粉丝群](https://app.binance.com/uni-qr/YXXQJrPb)
After the CLARITY bill was blocked in the Senate, the regulatory story for BTC didn’t end—it actually entered a stage that’s even more worth watching.👀
On September 15, the Senate failed to move the CLARITY bill forward after a procedural vote of 49–50. This means the unified federal market-structure framework that the U.S. digital asset spot market had been expecting has not yet been put in place.
But one key point can’t be ignored:
BTC has not suddenly lost its regulatory positioning as a “digital commodity” just because the bill was blocked.
Back in March, the SEC and CFTC already issued relevant explanations clarifying that BTC falls under the category of digital commodities. This existing regulatory interpretation will not automatically become invalid due to CLARITY being blocked this time.
What’s really changed is—
The market had expected Congress to pass legislation and further codify the regulatory boundaries into law; now that path is temporarily stalled, so the SEC and CFTC’s subsequent rulemaking, interpretations, and enforcement direction become even more important. And the market reaction has been quite interesting, too.
On the day CLARITY was blocked, BTC and the crypto market saw a noticeable pullback, and Bitcoin spot ETFs also recorded about a $450 million outflow. But afterward, ETF inflows resumed, and BTC once again reclaimed levels above $80,000.
This points to a change worth watching:
Regulatory uncertainty still exists, but capital has not completely left the crypto market as a result.
So instead of guessing whether BTC will go up or down next, it’s better to track a few variables that truly move the market.⚡
👀 Will the SEC and CFTC continue using their existing authority to push rulemaking?
👀 Can BTC spot ETF inflows stay consistent?
👀 Will Congress push digital-asset market-structure legislation again?
👀 Will macro liquidity and the interest-rate environment continue to affect risk assets—especially ETF flows?
If institutional money keeps coming back, the market’s digestion of the CLARITY setback may continue. But if ETFs start showing persistent outflows again, regulatory uncertainty could once more become a source of market pressure.
Click the avatar to join the NineNine chat group for daily strategy 🚀
#BTC #CLARITY法案 #美国监管
🚨 CLARITY is stuck! Where is BTC headed next? Did the regulatory stance change?🔥
Group: 点击进入玖玖的粉丝群
After the CLARITY bill was blocked in the Senate, the regulatory story for BTC didn’t end—it actually entered a stage that’s even more worth watching.👀
On September 15, the Senate failed to move the CLARITY bill forward after a procedural vote of 49–50. This means the unified federal market-structure framework that the U.S. digital asset spot market had been expecting has not yet been put in place.
But one key point can’t be ignored:
BTC has not suddenly lost its regulatory positioning as a “digital commodity” just because the bill was blocked.
Back in March, the SEC and CFTC already issued relevant explanations clarifying that BTC falls under the category of digital commodities. This existing regulatory interpretation will not automatically become invalid due to CLARITY being blocked this time.
What’s really changed is—
The market had expected Congress to pass legislation and further codify the regulatory boundaries into law; now that path is temporarily stalled, so the SEC and CFTC’s subsequent rulemaking, interpretations, and enforcement direction become even more important. And the market reaction has been quite interesting, too.
On the day CLARITY was blocked, BTC and the crypto market saw a noticeable pullback, and Bitcoin spot ETFs also recorded about a $450 million outflow. But afterward, ETF inflows resumed, and BTC once again reclaimed levels above $80,000.
This points to a change worth watching:
Regulatory uncertainty still exists, but capital has not completely left the crypto market as a result.
So instead of guessing whether BTC will go up or down next, it’s better to track a few variables that truly move the market.⚡
👀 Will the SEC and CFTC continue using their existing authority to push rulemaking?
👀 Can BTC spot ETF inflows stay consistent?
👀 Will Congress push digital-asset market-structure legislation again?
👀 Will macro liquidity and the interest-rate environment continue to affect risk assets—especially ETF flows?
If institutional money keeps coming back, the market’s digestion of the CLARITY setback may continue. But if ETFs start showing persistent outflows again, regulatory uncertainty could once more become a source of market pressure.
Click the avatar to join the NineNine chat group for daily strategy 🚀
#BTC #CLARITY法案 #美国监管
Group: 点击进入玖玖的粉丝群
After the CLARITY bill was blocked in the Senate, the regulatory story for BTC didn’t end—it actually entered a stage that’s even more worth watching.👀
On September 15, the Senate failed to move the CLARITY bill forward after a procedural vote of 49–50. This means the unified federal market-structure framework that the U.S. digital asset spot market had been expecting has not yet been put in place.
But one key point can’t be ignored:
BTC has not suddenly lost its regulatory positioning as a “digital commodity” just because the bill was blocked.
Back in March, the SEC and CFTC already issued relevant explanations clarifying that BTC falls under the category of digital commodities. This existing regulatory interpretation will not automatically become invalid due to CLARITY being blocked this time.
What’s really changed is—
The market had expected Congress to pass legislation and further codify the regulatory boundaries into law; now that path is temporarily stalled, so the SEC and CFTC’s subsequent rulemaking, interpretations, and enforcement direction become even more important. And the market reaction has been quite interesting, too.
On the day CLARITY was blocked, BTC and the crypto market saw a noticeable pullback, and Bitcoin spot ETFs also recorded about a $450 million outflow. But afterward, ETF inflows resumed, and BTC once again reclaimed levels above $80,000.
This points to a change worth watching:
Regulatory uncertainty still exists, but capital has not completely left the crypto market as a result.
So instead of guessing whether BTC will go up or down next, it’s better to track a few variables that truly move the market.⚡
👀 Will the SEC and CFTC continue using their existing authority to push rulemaking?
👀 Can BTC spot ETF inflows stay consistent?
👀 Will Congress push digital-asset market-structure legislation again?
👀 Will macro liquidity and the interest-rate environment continue to affect risk assets—especially ETF flows?
If institutional money keeps coming back, the market’s digestion of the CLARITY setback may continue. But if ETFs start showing persistent outflows again, regulatory uncertainty could once more become a source of market pressure.
Click the avatar to join the NineNine chat group for daily strategy 🚀
#BTC #CLARITY法案 #美国监管

532
·
--
🚨 Oil Prices Return to $100! Is There a Breakthrough in Iran Negotiations?🔥
Group: [点击进入玖玖的粉丝群](https://app.binance.com/uni-qr/YXXQJrPb)
Oil prices have just ended a streak of declines, and the market is getting tense again.⛽
On Tuesday, Brent crude rose 1.3%, reclaiming $101.59; WTI was up 0.7%, to $96.45. What’s more notable is that this rebound came after consecutive days of losses.
The real factor moving the market is that the Middle East situation has introduced a new variable again.👀
During the UN General Assembly, Trump said he is willing to engage with Iran’s President Pezeshkian. Meanwhile, reports indicate that Iran has also conveyed, through intermediary channels, conditions for resuming negotiations.
On the surface, this is a calming signal.
But the oil market isn’t fully easing, because on the other side, supply-side issues are becoming more complicated. After operational problems hit Saudi’s east-to-west pipelines, some crude shipments have begun rerouting through the Strait of Hormuz. Over the past six days, Saudi crude transported via the Strait of Hormuz averaged about 2.9 million barrels per day—significantly higher than before.
At the same time, production at Libya’s largest oil field, Sharara, has plunged from roughly 340,000 barrels per day to 127,000 barrels per day, further tightening supply due to armed blockades. Russia’s diesel export restrictions may also be prolonged.⚠️
That means oil prices are currently facing a highly contradictory situation:
On one side, the U.S. and Iran may reconnect, bringing cooling expectations to the market; on the other side, multiple supply variables—such as the Strait of Hormuz, Libya, and Russia—are changing at the same time.
That’s why oil prices fell, then rebounded quickly.
And if oil prices continue to hover around $100, the impact won’t be limited to the energy market.
Higher oil prices could re-ignite inflation pressure, affect expectations for the Fed to cut rates, influence global equity risk appetite, and even indirectly impact risk assets like BTC.📉
Click the avatar to join the Jiujiu chat group for daily strategies🚀
#原油 #油价
🚨 Oil Prices Return to $100! Is There a Breakthrough in Iran Negotiations?🔥
Group: 点击进入玖玖的粉丝群
Oil prices have just ended a streak of declines, and the market is getting tense again.⛽
On Tuesday, Brent crude rose 1.3%, reclaiming $101.59; WTI was up 0.7%, to $96.45. What’s more notable is that this rebound came after consecutive days of losses.
The real factor moving the market is that the Middle East situation has introduced a new variable again.👀
During the UN General Assembly, Trump said he is willing to engage with Iran’s President Pezeshkian. Meanwhile, reports indicate that Iran has also conveyed, through intermediary channels, conditions for resuming negotiations.
On the surface, this is a calming signal.
But the oil market isn’t fully easing, because on the other side, supply-side issues are becoming more complicated. After operational problems hit Saudi’s east-to-west pipelines, some crude shipments have begun rerouting through the Strait of Hormuz. Over the past six days, Saudi crude transported via the Strait of Hormuz averaged about 2.9 million barrels per day—significantly higher than before.
At the same time, production at Libya’s largest oil field, Sharara, has plunged from roughly 340,000 barrels per day to 127,000 barrels per day, further tightening supply due to armed blockades. Russia’s diesel export restrictions may also be prolonged.⚠️
That means oil prices are currently facing a highly contradictory situation:
On one side, the U.S. and Iran may reconnect, bringing cooling expectations to the market; on the other side, multiple supply variables—such as the Strait of Hormuz, Libya, and Russia—are changing at the same time.
That’s why oil prices fell, then rebounded quickly.
And if oil prices continue to hover around $100, the impact won’t be limited to the energy market.
Higher oil prices could re-ignite inflation pressure, affect expectations for the Fed to cut rates, influence global equity risk appetite, and even indirectly impact risk assets like BTC.📉
Click the avatar to join the Jiujiu chat group for daily strategies🚀
#原油 #油价
Group: 点击进入玖玖的粉丝群
Oil prices have just ended a streak of declines, and the market is getting tense again.⛽
On Tuesday, Brent crude rose 1.3%, reclaiming $101.59; WTI was up 0.7%, to $96.45. What’s more notable is that this rebound came after consecutive days of losses.
The real factor moving the market is that the Middle East situation has introduced a new variable again.👀
During the UN General Assembly, Trump said he is willing to engage with Iran’s President Pezeshkian. Meanwhile, reports indicate that Iran has also conveyed, through intermediary channels, conditions for resuming negotiations.
On the surface, this is a calming signal.
But the oil market isn’t fully easing, because on the other side, supply-side issues are becoming more complicated. After operational problems hit Saudi’s east-to-west pipelines, some crude shipments have begun rerouting through the Strait of Hormuz. Over the past six days, Saudi crude transported via the Strait of Hormuz averaged about 2.9 million barrels per day—significantly higher than before.
At the same time, production at Libya’s largest oil field, Sharara, has plunged from roughly 340,000 barrels per day to 127,000 barrels per day, further tightening supply due to armed blockades. Russia’s diesel export restrictions may also be prolonged.⚠️
That means oil prices are currently facing a highly contradictory situation:
On one side, the U.S. and Iran may reconnect, bringing cooling expectations to the market; on the other side, multiple supply variables—such as the Strait of Hormuz, Libya, and Russia—are changing at the same time.
That’s why oil prices fell, then rebounded quickly.
And if oil prices continue to hover around $100, the impact won’t be limited to the energy market.
Higher oil prices could re-ignite inflation pressure, affect expectations for the Fed to cut rates, influence global equity risk appetite, and even indirectly impact risk assets like BTC.📉
Click the avatar to join the Jiujiu chat group for daily strategies🚀
#原油 #油价

147
·
--
🚨 CLARITY stalled! Fairshake pours $30 million to target Brown? 🔥
Group: [点击进入玖玖的粉丝群](https://app.binance.com/uni-qr/YXXQJrPb)
Reportedly, crypto political action group Fairshake plans to spend at least $30 million to oppose former Ohio Senator Sherrod Brown’s return to the Senate. This is also one of the largest single plans Fairshake has disclosed so far in its 2026 midterm election cycle.
What’s interesting is that Brown himself did not participate in the recent CLARITY bill vote, because he is no longer a senator.
So why still go after him?
The key is that Brown previously served as Chair of the Senate Banking Committee and has long been involved in discussions on digital-asset regulatory policy. During the 2024 election cycle, political organizations tied to the crypto industry reportedly invested over $40 million in that Ohio race. Now, Brown is challenging Republican Senator Jon Husted again, and this contest has once more become the focus of political money from the crypto sector.
And the timing of the CLARITY bill has also made the story stand out.
On September 15, the CLARITY bill failed to advance in the Senate procedural vote, 49–50. After the bill stalled, Fairshake confirmed its $30 million spending plan and said it may announce additional midterm election funding arrangements in the coming weeks.
⚠️ But here’s something very worth noting:
You can’t simply interpret it as “anyone against CLARITY will be targeted by the crypto industry.”
Fairshake has also supported some Democratic candidates in the past, so its funding actions aren’t strictly drawn along a single party line. What’s truly worth watching now is which specific districts in the midterms the crypto industry will direct more money toward—and whether that funding ultimately further impacts digital-asset regulatory issues.
In other words, while the CLARITY bill is temporarily unable to move forward, the battlefield may be expanding from congressional negotiations to the 2026 midterm elections. 🔥
Click the avatar to join the Jiujiu chat group for daily strategy 🚀
#CLARITY法案 #fairshake
🚨 CLARITY stalled! Fairshake pours $30 million to target Brown? 🔥
Group: 点击进入玖玖的粉丝群
Reportedly, crypto political action group Fairshake plans to spend at least $30 million to oppose former Ohio Senator Sherrod Brown’s return to the Senate. This is also one of the largest single plans Fairshake has disclosed so far in its 2026 midterm election cycle.
What’s interesting is that Brown himself did not participate in the recent CLARITY bill vote, because he is no longer a senator.
So why still go after him?
The key is that Brown previously served as Chair of the Senate Banking Committee and has long been involved in discussions on digital-asset regulatory policy. During the 2024 election cycle, political organizations tied to the crypto industry reportedly invested over $40 million in that Ohio race. Now, Brown is challenging Republican Senator Jon Husted again, and this contest has once more become the focus of political money from the crypto sector.
And the timing of the CLARITY bill has also made the story stand out.
On September 15, the CLARITY bill failed to advance in the Senate procedural vote, 49–50. After the bill stalled, Fairshake confirmed its $30 million spending plan and said it may announce additional midterm election funding arrangements in the coming weeks.
⚠️ But here’s something very worth noting:
You can’t simply interpret it as “anyone against CLARITY will be targeted by the crypto industry.”
Fairshake has also supported some Democratic candidates in the past, so its funding actions aren’t strictly drawn along a single party line. What’s truly worth watching now is which specific districts in the midterms the crypto industry will direct more money toward—and whether that funding ultimately further impacts digital-asset regulatory issues.
In other words, while the CLARITY bill is temporarily unable to move forward, the battlefield may be expanding from congressional negotiations to the 2026 midterm elections. 🔥
Click the avatar to join the Jiujiu chat group for daily strategy 🚀
#CLARITY法案 #fairshake
Group: 点击进入玖玖的粉丝群
Reportedly, crypto political action group Fairshake plans to spend at least $30 million to oppose former Ohio Senator Sherrod Brown’s return to the Senate. This is also one of the largest single plans Fairshake has disclosed so far in its 2026 midterm election cycle.
What’s interesting is that Brown himself did not participate in the recent CLARITY bill vote, because he is no longer a senator.
So why still go after him?
The key is that Brown previously served as Chair of the Senate Banking Committee and has long been involved in discussions on digital-asset regulatory policy. During the 2024 election cycle, political organizations tied to the crypto industry reportedly invested over $40 million in that Ohio race. Now, Brown is challenging Republican Senator Jon Husted again, and this contest has once more become the focus of political money from the crypto sector.
And the timing of the CLARITY bill has also made the story stand out.
On September 15, the CLARITY bill failed to advance in the Senate procedural vote, 49–50. After the bill stalled, Fairshake confirmed its $30 million spending plan and said it may announce additional midterm election funding arrangements in the coming weeks.
⚠️ But here’s something very worth noting:
You can’t simply interpret it as “anyone against CLARITY will be targeted by the crypto industry.”
Fairshake has also supported some Democratic candidates in the past, so its funding actions aren’t strictly drawn along a single party line. What’s truly worth watching now is which specific districts in the midterms the crypto industry will direct more money toward—and whether that funding ultimately further impacts digital-asset regulatory issues.
In other words, while the CLARITY bill is temporarily unable to move forward, the battlefield may be expanding from congressional negotiations to the 2026 midterm elections. 🔥
Click the avatar to join the Jiujiu chat group for daily strategy 🚀
#CLARITY法案 #fairshake

1.7k
·
--
🚨 Binance suddenly lists 25 new stocks! Should traditional assets be fully “tokenized on-chain”?🔥
Group: [点击进入玖玖的粉丝群](https://app.binance.com/uni-qr/YXXQJrPb)
Binance is expanding its stock market footprint again.👀
According to a Binance announcement, starting September 21 at 13:30 (UTC), the platform will add 25 tokenized stocks and exchange-listed products, covering individual stocks, leveraged ETFs, and commodity-linked ETFs.
This isn’t just adding a few more stocks—it’s that the range of tradable instruments is clearly becoming richer.
From aerospace and logistics to energy and infrastructure, from medical real estate to technology and service companies, the newly added listings span multiple industries.
Even more noteworthy, this time Binance also included IAUM gold ETF, SIVR silver ETF, as well as leveraged products like RAM, SKDD, and SKUU.⚡
What does this mean? In the past, crypto users mainly focused on trading BTC, ETH, and various tokens. Now, stocks, gold, silver, and even leveraged traditional financial products are gradually being moved into crypto trading scenarios.
What’s truly worth paying attention to isn’t really that “25 more stocks” were added—it’s Binance attempting to connect traditional financial assets with crypto users’ trading habits.
And this time, it also involves securities lending.
The announcement states that once the newly listed securities complete T+1 settlement, users may participate in a fully paid securities lending program, though eligibility is still subject to restrictions based on the user’s region.
At the same time, orders are submitted by Nest Trading Limited and cleared and custodied by Alpaca Securities; Binance does not directly handle or custody the underlying securities.
⚠️ Of course, these kinds of products also come with risks.
Especially leveraged ETFs, which are inherently higher-volatility trading products. Binance also clearly warns that investors may not be able to recover their full invested amount. So the real thing to watch isn’t which stocks Binance has listed this time, but a bigger trend:
Crypto trading platforms are expanding from “only trading crypto assets” toward “connecting more traditional financial assets.”
If this model continues to advance, in the future it may become increasingly common for users to encounter different asset classes—BTC, stocks, gold, ETFs, and more—within the same trading ecosystem.🚀
Click the avatar to join the Jiujiu chat group for daily strategies🚀
#Binance #币安
🚨 Binance suddenly lists 25 new stocks! Should traditional assets be fully “tokenized on-chain”?🔥
Group: 点击进入玖玖的粉丝群
Binance is expanding its stock market footprint again.👀
According to a Binance announcement, starting September 21 at 13:30 (UTC), the platform will add 25 tokenized stocks and exchange-listed products, covering individual stocks, leveraged ETFs, and commodity-linked ETFs.
This isn’t just adding a few more stocks—it’s that the range of tradable instruments is clearly becoming richer.
From aerospace and logistics to energy and infrastructure, from medical real estate to technology and service companies, the newly added listings span multiple industries.
Even more noteworthy, this time Binance also included IAUM gold ETF, SIVR silver ETF, as well as leveraged products like RAM, SKDD, and SKUU.⚡
What does this mean? In the past, crypto users mainly focused on trading BTC, ETH, and various tokens. Now, stocks, gold, silver, and even leveraged traditional financial products are gradually being moved into crypto trading scenarios.
What’s truly worth paying attention to isn’t really that “25 more stocks” were added—it’s Binance attempting to connect traditional financial assets with crypto users’ trading habits.
And this time, it also involves securities lending.
The announcement states that once the newly listed securities complete T+1 settlement, users may participate in a fully paid securities lending program, though eligibility is still subject to restrictions based on the user’s region.
At the same time, orders are submitted by Nest Trading Limited and cleared and custodied by Alpaca Securities; Binance does not directly handle or custody the underlying securities.
⚠️ Of course, these kinds of products also come with risks.
Especially leveraged ETFs, which are inherently higher-volatility trading products. Binance also clearly warns that investors may not be able to recover their full invested amount. So the real thing to watch isn’t which stocks Binance has listed this time, but a bigger trend:
Crypto trading platforms are expanding from “only trading crypto assets” toward “connecting more traditional financial assets.”
If this model continues to advance, in the future it may become increasingly common for users to encounter different asset classes—BTC, stocks, gold, ETFs, and more—within the same trading ecosystem.🚀
Click the avatar to join the Jiujiu chat group for daily strategies🚀
#Binance #币安
Group: 点击进入玖玖的粉丝群
Binance is expanding its stock market footprint again.👀
According to a Binance announcement, starting September 21 at 13:30 (UTC), the platform will add 25 tokenized stocks and exchange-listed products, covering individual stocks, leveraged ETFs, and commodity-linked ETFs.
This isn’t just adding a few more stocks—it’s that the range of tradable instruments is clearly becoming richer.
From aerospace and logistics to energy and infrastructure, from medical real estate to technology and service companies, the newly added listings span multiple industries.
Even more noteworthy, this time Binance also included IAUM gold ETF, SIVR silver ETF, as well as leveraged products like RAM, SKDD, and SKUU.⚡
What does this mean? In the past, crypto users mainly focused on trading BTC, ETH, and various tokens. Now, stocks, gold, silver, and even leveraged traditional financial products are gradually being moved into crypto trading scenarios.
What’s truly worth paying attention to isn’t really that “25 more stocks” were added—it’s Binance attempting to connect traditional financial assets with crypto users’ trading habits.
And this time, it also involves securities lending.
The announcement states that once the newly listed securities complete T+1 settlement, users may participate in a fully paid securities lending program, though eligibility is still subject to restrictions based on the user’s region.
At the same time, orders are submitted by Nest Trading Limited and cleared and custodied by Alpaca Securities; Binance does not directly handle or custody the underlying securities.
⚠️ Of course, these kinds of products also come with risks.
Especially leveraged ETFs, which are inherently higher-volatility trading products. Binance also clearly warns that investors may not be able to recover their full invested amount. So the real thing to watch isn’t which stocks Binance has listed this time, but a bigger trend:
Crypto trading platforms are expanding from “only trading crypto assets” toward “connecting more traditional financial assets.”
If this model continues to advance, in the future it may become increasingly common for users to encounter different asset classes—BTC, stocks, gold, ETFs, and more—within the same trading ecosystem.🚀
Click the avatar to join the Jiujiu chat group for daily strategies🚀
#Binance #币安
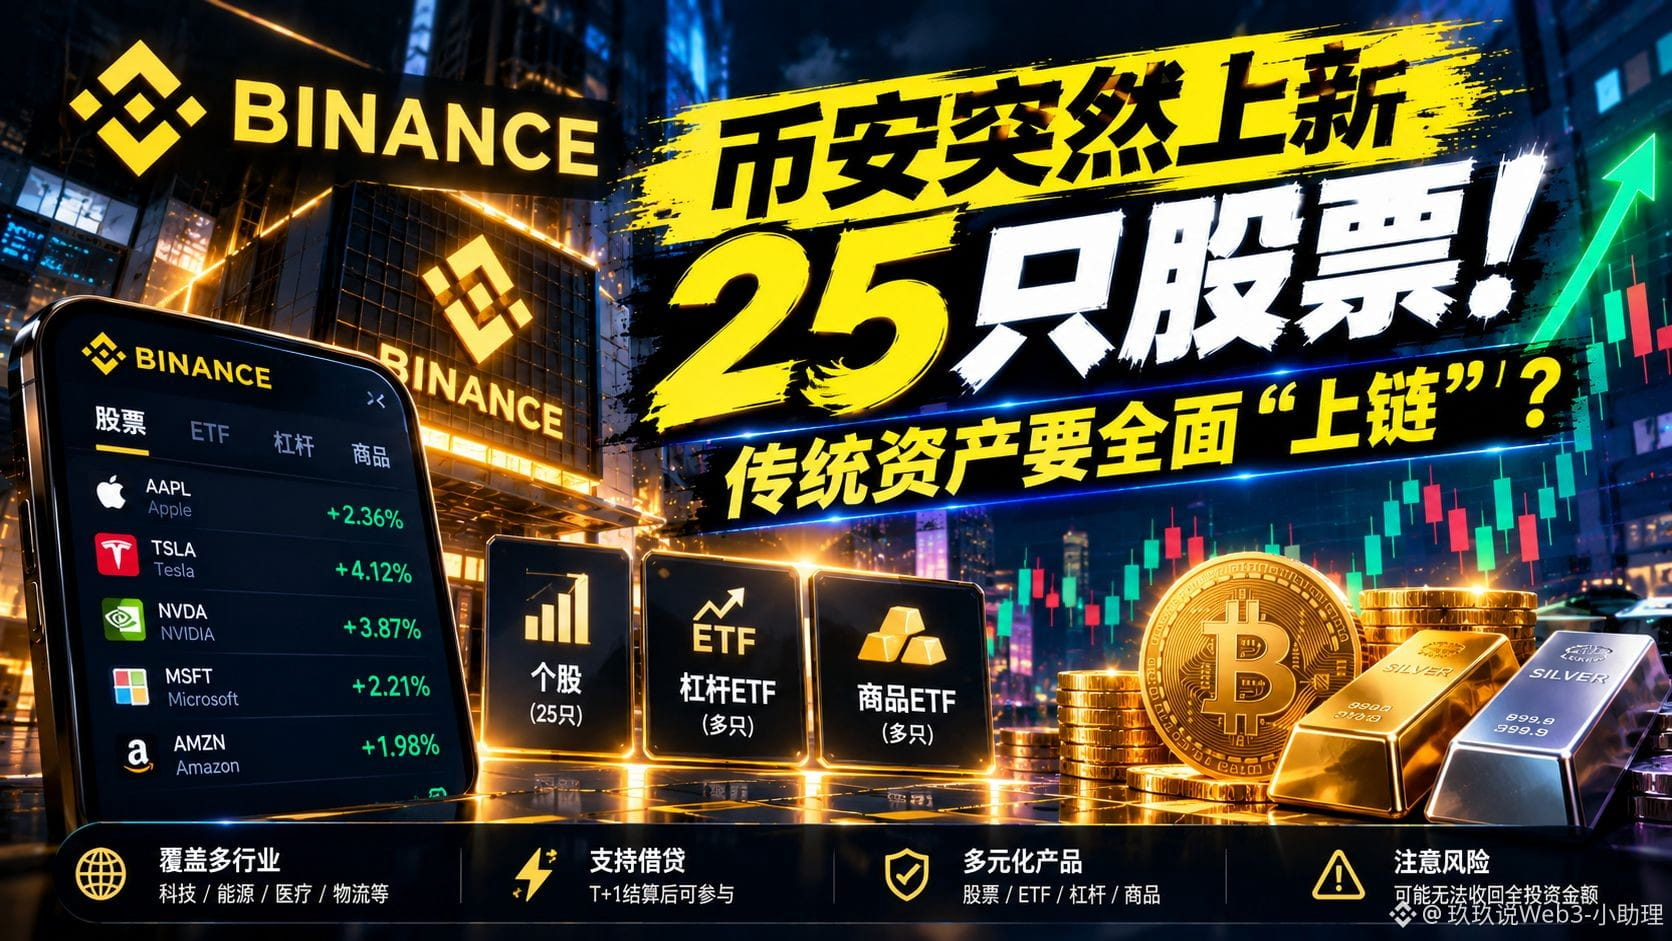
218
·
--
🚨 Glassnode Suddenly Turns! Is the Imitation Season Really Here?🔥
Group: [点击进入玖玖的粉丝群](https://app.binance.com/uni-qr/YXXQJrPb)
The altcoin market has recently started to look a bit different.👀
According to Glassnode’s Sept 22 altcoin cycle signal, the market has shifted back from the “Bitcoin Season” zone to the “Altcoin Season” region.
The biggest difference from previous months this time is: it’s not just that BTC is weakening—more and more altcoins are actually beginning to outperform BTC.
That’s exactly what makes this signal worth paying attention to most.🔥
Glassnode tracks the performance of the top 250 non-stablecoin assets relative to BTC. When the 7-day moving average moves above the 50+ range, it usually indicates that altcoins as a whole are starting to gain the upper hand.
And this time, market breadth is clearly expanding.
Based on recent performance, assets like ZEC, PUMP, UNI, and ARB have shown noticeable gains, while XRP is up about 6.56% in a day, and ETH remains strong as well.
More importantly, the CMC Altcoin Season Index has risen from the 30s last week to around 50.
But don’t rush to declare “Altcoin Season is fully on” just yet.
Because different indicators have not fully aligned at the moment.⚠️
The CMC Altcoin Season Index is currently just at 50 and hasn’t reached the 75-point threshold typically seen as “full altcoin season.”
Also, BTC is still extremely strong, and the market dominance remains close to 58%—59%.
So right now, it’s more like an early stage of “capital beginning to spread into altcoins,” rather than all altcoins partying at once.
The logic behind this is actually pretty simple:
After BTC completes a round of上涨 and then enters a consolidation range, if capital continues to stay within the crypto market, it may start looking for higher-volatility assets. That’s when capital disperses from BTC to ETH, and then further into mid- and small-cap altcoins. This is also why some recent altcoin rallies have started to outpace BTC noticeably.🚀
But risks still can’t be ignored.
Click the avatar to join the Jiujiu chat group for daily strategies🚀
#山寨币季 #BTC #ETH
🚨 Glassnode Suddenly Turns! Is the Imitation Season Really Here?🔥
Group: 点击进入玖玖的粉丝群
The altcoin market has recently started to look a bit different.👀
According to Glassnode’s Sept 22 altcoin cycle signal, the market has shifted back from the “Bitcoin Season” zone to the “Altcoin Season” region.
The biggest difference from previous months this time is: it’s not just that BTC is weakening—more and more altcoins are actually beginning to outperform BTC.
That’s exactly what makes this signal worth paying attention to most.🔥
Glassnode tracks the performance of the top 250 non-stablecoin assets relative to BTC. When the 7-day moving average moves above the 50+ range, it usually indicates that altcoins as a whole are starting to gain the upper hand.
And this time, market breadth is clearly expanding.
Based on recent performance, assets like ZEC, PUMP, UNI, and ARB have shown noticeable gains, while XRP is up about 6.56% in a day, and ETH remains strong as well.
More importantly, the CMC Altcoin Season Index has risen from the 30s last week to around 50.
But don’t rush to declare “Altcoin Season is fully on” just yet.
Because different indicators have not fully aligned at the moment.⚠️
The CMC Altcoin Season Index is currently just at 50 and hasn’t reached the 75-point threshold typically seen as “full altcoin season.”
Also, BTC is still extremely strong, and the market dominance remains close to 58%—59%.
So right now, it’s more like an early stage of “capital beginning to spread into altcoins,” rather than all altcoins partying at once.
The logic behind this is actually pretty simple:
After BTC completes a round of上涨 and then enters a consolidation range, if capital continues to stay within the crypto market, it may start looking for higher-volatility assets. That’s when capital disperses from BTC to ETH, and then further into mid- and small-cap altcoins. This is also why some recent altcoin rallies have started to outpace BTC noticeably.🚀
But risks still can’t be ignored.
Click the avatar to join the Jiujiu chat group for daily strategies🚀
#山寨币季 #BTC #ETH
Group: 点击进入玖玖的粉丝群
The altcoin market has recently started to look a bit different.👀
According to Glassnode’s Sept 22 altcoin cycle signal, the market has shifted back from the “Bitcoin Season” zone to the “Altcoin Season” region.
The biggest difference from previous months this time is: it’s not just that BTC is weakening—more and more altcoins are actually beginning to outperform BTC.
That’s exactly what makes this signal worth paying attention to most.🔥
Glassnode tracks the performance of the top 250 non-stablecoin assets relative to BTC. When the 7-day moving average moves above the 50+ range, it usually indicates that altcoins as a whole are starting to gain the upper hand.
And this time, market breadth is clearly expanding.
Based on recent performance, assets like ZEC, PUMP, UNI, and ARB have shown noticeable gains, while XRP is up about 6.56% in a day, and ETH remains strong as well.
More importantly, the CMC Altcoin Season Index has risen from the 30s last week to around 50.
But don’t rush to declare “Altcoin Season is fully on” just yet.
Because different indicators have not fully aligned at the moment.⚠️
The CMC Altcoin Season Index is currently just at 50 and hasn’t reached the 75-point threshold typically seen as “full altcoin season.”
Also, BTC is still extremely strong, and the market dominance remains close to 58%—59%.
So right now, it’s more like an early stage of “capital beginning to spread into altcoins,” rather than all altcoins partying at once.
The logic behind this is actually pretty simple:
After BTC completes a round of上涨 and then enters a consolidation range, if capital continues to stay within the crypto market, it may start looking for higher-volatility assets. That’s when capital disperses from BTC to ETH, and then further into mid- and small-cap altcoins. This is also why some recent altcoin rallies have started to outpace BTC noticeably.🚀
But risks still can’t be ignored.
Click the avatar to join the Jiujiu chat group for daily strategies🚀
#山寨币季 #BTC #ETH

395
·
--
🚨 SUI surges 30% in a week! Bears get crushed—Is the rally not over yet?🔥
Group: [点击进入玖玖的粉丝群](https://app.binance.com/uni-qr/YXXQJrPb)
SUI suddenly accelerated.🔥
During the latest squeeze on short positions in the crypto market, SUI’s single-day gain reached as high as 21.4%. Over the past few days, it’s accumulated gains of roughly 30%, reclaiming $1 and touching its highest level since May 2026. But this move isn’t driven by market sentiment alone.
First, look at the most direct catalyst:
After Bitcoin pushed toward the $85,000 area, the entire crypto market saw a large-scale liquidation of shorts. In the past 24 hours, liquidation totaled about $740 million, of which roughly $650 million came from shorts.
A large number of shorts were forced to close, creating a wave of aggressive, forced buying—and giving high-volatility altcoins like SUI extra momentum.🚀
More importantly, SUI’s own derivatives data is also starting to heat up.
SUI futures open interest rose by about 28.9% in a short period, reaching $402 million.
At the same time as prices climbed, open interest also increased noticeably, suggesting that the market isn’t only seeing short covering—new leveraged funds are also entering.
In other words, this rally has shifted from “a short squeeze” to “a fresh battle between long and short positioning.”
Fundamentals also have a few things worth noting.👀
At present, SUI ecosystem DeFi total value locked is around $480 million to $550 million. Stablecoin market cap is about $475 million, and there are roughly 129,000 active addresses.
In addition, the Sui Basecamp conference will be held in Singapore from October 7 to 8. The market is watching for any new developments that may be announced during the event, including areas such as sponsored payments, confidential transfers, and related directions.
So what the market is focused on now isn’t just whether SUI can go up.
It’s whether this influx of capital and ecosystem buzz can be sustained.
From a technical standpoint, $0.9725 is an important level. If price can continue to hold above it, the next areas the market may watch include $1.037, $1.16, and higher levels.
However, if it falls back below $0.9542, the current higher-high and higher-low structure could be disrupted.⚠️
One more risk to keep in mind:
SUI futures open interest is rising rapidly, which means leverage is increasing too.
Leverage can amplify gains—and it can just as easily amplify pullbacks.
Click your avatar to join the Jiujiu chat group for daily strategy🚀
#SUİ #SUİ #defi
🚨 SUI surges 30% in a week! Bears get crushed—Is the rally not over yet?🔥
Group: 点击进入玖玖的粉丝群
SUI suddenly accelerated.🔥
During the latest squeeze on short positions in the crypto market, SUI’s single-day gain reached as high as 21.4%. Over the past few days, it’s accumulated gains of roughly 30%, reclaiming $1 and touching its highest level since May 2026. But this move isn’t driven by market sentiment alone.
First, look at the most direct catalyst:
After Bitcoin pushed toward the $85,000 area, the entire crypto market saw a large-scale liquidation of shorts. In the past 24 hours, liquidation totaled about $740 million, of which roughly $650 million came from shorts.
A large number of shorts were forced to close, creating a wave of aggressive, forced buying—and giving high-volatility altcoins like SUI extra momentum.🚀
More importantly, SUI’s own derivatives data is also starting to heat up.
SUI futures open interest rose by about 28.9% in a short period, reaching $402 million.
At the same time as prices climbed, open interest also increased noticeably, suggesting that the market isn’t only seeing short covering—new leveraged funds are also entering.
In other words, this rally has shifted from “a short squeeze” to “a fresh battle between long and short positioning.”
Fundamentals also have a few things worth noting.👀
At present, SUI ecosystem DeFi total value locked is around $480 million to $550 million. Stablecoin market cap is about $475 million, and there are roughly 129,000 active addresses.
In addition, the Sui Basecamp conference will be held in Singapore from October 7 to 8. The market is watching for any new developments that may be announced during the event, including areas such as sponsored payments, confidential transfers, and related directions.
So what the market is focused on now isn’t just whether SUI can go up.
It’s whether this influx of capital and ecosystem buzz can be sustained.
From a technical standpoint, $0.9725 is an important level. If price can continue to hold above it, the next areas the market may watch include $1.037, $1.16, and higher levels.
However, if it falls back below $0.9542, the current higher-high and higher-low structure could be disrupted.⚠️
One more risk to keep in mind:
SUI futures open interest is rising rapidly, which means leverage is increasing too.
Leverage can amplify gains—and it can just as easily amplify pullbacks.
Click your avatar to join the Jiujiu chat group for daily strategy🚀
#SUİ #SUİ #defi
Group: 点击进入玖玖的粉丝群
SUI suddenly accelerated.🔥
During the latest squeeze on short positions in the crypto market, SUI’s single-day gain reached as high as 21.4%. Over the past few days, it’s accumulated gains of roughly 30%, reclaiming $1 and touching its highest level since May 2026. But this move isn’t driven by market sentiment alone.
First, look at the most direct catalyst:
After Bitcoin pushed toward the $85,000 area, the entire crypto market saw a large-scale liquidation of shorts. In the past 24 hours, liquidation totaled about $740 million, of which roughly $650 million came from shorts.
A large number of shorts were forced to close, creating a wave of aggressive, forced buying—and giving high-volatility altcoins like SUI extra momentum.🚀
More importantly, SUI’s own derivatives data is also starting to heat up.
SUI futures open interest rose by about 28.9% in a short period, reaching $402 million.
At the same time as prices climbed, open interest also increased noticeably, suggesting that the market isn’t only seeing short covering—new leveraged funds are also entering.
In other words, this rally has shifted from “a short squeeze” to “a fresh battle between long and short positioning.”
Fundamentals also have a few things worth noting.👀
At present, SUI ecosystem DeFi total value locked is around $480 million to $550 million. Stablecoin market cap is about $475 million, and there are roughly 129,000 active addresses.
In addition, the Sui Basecamp conference will be held in Singapore from October 7 to 8. The market is watching for any new developments that may be announced during the event, including areas such as sponsored payments, confidential transfers, and related directions.
So what the market is focused on now isn’t just whether SUI can go up.
It’s whether this influx of capital and ecosystem buzz can be sustained.
From a technical standpoint, $0.9725 is an important level. If price can continue to hold above it, the next areas the market may watch include $1.037, $1.16, and higher levels.
However, if it falls back below $0.9542, the current higher-high and higher-low structure could be disrupted.⚠️
One more risk to keep in mind:
SUI futures open interest is rising rapidly, which means leverage is increasing too.
Leverage can amplify gains—and it can just as easily amplify pullbacks.
Click your avatar to join the Jiujiu chat group for daily strategy🚀
#SUİ #SUİ #defi

345
·
--
🚨 DOGE surges 14%! Are both whales and short sellers stepping in?🔥
Group: [点击进入玖玖的粉丝群](https://app.binance.com/uni-qr/YXXQJrPb)
Dogecoin has suddenly accelerated over the past few days.🐕🔥
In the past 48 hours, DOGE is up about 14%, has regained the area around $0.10, and successfully broke above the 200-day moving average. But this rally isn’t just about price moving—there are clear changes in both capital flows and the derivatives market.
First, let’s look at a very direct data point:
On September 21, DOGE short positions worth about $5.66 million were forcibly liquidated— the largest short squeeze since late August.
Simply put, the funds that had been betting on DOGE falling were forced to close their positions. And closing positions can further push the price upward.
Even more worth noting is that whales have started moving too.👀
According to CoinGlass data, four large wallets recently built a total of about 78.2 million DOGE long positions, worth roughly $5.59 million. These positions are currently all in profit.
At the same time, DOGE-related ETFs saw net inflows of about $0.9097 million on Monday, significantly higher than the $0.2845 million from the previous week.
So, behind this rally, three forces are moving in together:
🐕 Whales increase long positions
💰 ETF inflows expand
🔥 Shorts concentrate liquidation
And the derivatives market heat is rising as well.
The size of DOGE futures open interest has already climbed to $1.57 billion, while Binance’s DOGE futures open interest has reached $345 million— a level not seen since May this year.
But here’s where you should start to be careful.⚠️
Because DOGE’s RSI is already at 72, entering the overbought zone.
In the short term, if DOGE continues to surge higher, you need to watch closely whether it can truly break through the $0.10–$0.102 area. If it breaks and holds, the market may next focus on the $0.116–$0.117 range. But if $0.10 keeps getting resisted, the profit-taking piled up from the earlier fast rise could also trigger noticeable volatility.
So what DOGE is really worth watching now isn’t just “how much it’s risen.”
It’s whether whale activity, ETF flows, and futures funding can stay in sync.
If capital continues to enter, the rally may still have room to extend; if the inflows start cooling off, this upswing could shift into a high-volatility phase.
Click the avatar to join the Jiujiu chat group for daily strategies🚀
#DOGE #狗狗币 #ETF
🚨 DOGE surges 14%! Are both whales and short sellers stepping in?🔥
Group: 点击进入玖玖的粉丝群
Dogecoin has suddenly accelerated over the past few days.🐕🔥
In the past 48 hours, DOGE is up about 14%, has regained the area around $0.10, and successfully broke above the 200-day moving average. But this rally isn’t just about price moving—there are clear changes in both capital flows and the derivatives market.
First, let’s look at a very direct data point:
On September 21, DOGE short positions worth about $5.66 million were forcibly liquidated— the largest short squeeze since late August.
Simply put, the funds that had been betting on DOGE falling were forced to close their positions. And closing positions can further push the price upward.
Even more worth noting is that whales have started moving too.👀
According to CoinGlass data, four large wallets recently built a total of about 78.2 million DOGE long positions, worth roughly $5.59 million. These positions are currently all in profit.
At the same time, DOGE-related ETFs saw net inflows of about $0.9097 million on Monday, significantly higher than the $0.2845 million from the previous week.
So, behind this rally, three forces are moving in together:
🐕 Whales increase long positions
💰 ETF inflows expand
🔥 Shorts concentrate liquidation
And the derivatives market heat is rising as well.
The size of DOGE futures open interest has already climbed to $1.57 billion, while Binance’s DOGE futures open interest has reached $345 million— a level not seen since May this year.
But here’s where you should start to be careful.⚠️
Because DOGE’s RSI is already at 72, entering the overbought zone.
In the short term, if DOGE continues to surge higher, you need to watch closely whether it can truly break through the $0.10–$0.102 area. If it breaks and holds, the market may next focus on the $0.116–$0.117 range. But if $0.10 keeps getting resisted, the profit-taking piled up from the earlier fast rise could also trigger noticeable volatility.
So what DOGE is really worth watching now isn’t just “how much it’s risen.”
It’s whether whale activity, ETF flows, and futures funding can stay in sync.
If capital continues to enter, the rally may still have room to extend; if the inflows start cooling off, this upswing could shift into a high-volatility phase.
Click the avatar to join the Jiujiu chat group for daily strategies🚀
#DOGE #狗狗币 #ETF
Group: 点击进入玖玖的粉丝群
Dogecoin has suddenly accelerated over the past few days.🐕🔥
In the past 48 hours, DOGE is up about 14%, has regained the area around $0.10, and successfully broke above the 200-day moving average. But this rally isn’t just about price moving—there are clear changes in both capital flows and the derivatives market.
First, let’s look at a very direct data point:
On September 21, DOGE short positions worth about $5.66 million were forcibly liquidated— the largest short squeeze since late August.
Simply put, the funds that had been betting on DOGE falling were forced to close their positions. And closing positions can further push the price upward.
Even more worth noting is that whales have started moving too.👀
According to CoinGlass data, four large wallets recently built a total of about 78.2 million DOGE long positions, worth roughly $5.59 million. These positions are currently all in profit.
At the same time, DOGE-related ETFs saw net inflows of about $0.9097 million on Monday, significantly higher than the $0.2845 million from the previous week.
So, behind this rally, three forces are moving in together:
🐕 Whales increase long positions
💰 ETF inflows expand
🔥 Shorts concentrate liquidation
And the derivatives market heat is rising as well.
The size of DOGE futures open interest has already climbed to $1.57 billion, while Binance’s DOGE futures open interest has reached $345 million— a level not seen since May this year.
But here’s where you should start to be careful.⚠️
Because DOGE’s RSI is already at 72, entering the overbought zone.
In the short term, if DOGE continues to surge higher, you need to watch closely whether it can truly break through the $0.10–$0.102 area. If it breaks and holds, the market may next focus on the $0.116–$0.117 range. But if $0.10 keeps getting resisted, the profit-taking piled up from the earlier fast rise could also trigger noticeable volatility.
So what DOGE is really worth watching now isn’t just “how much it’s risen.”
It’s whether whale activity, ETF flows, and futures funding can stay in sync.
If capital continues to enter, the rally may still have room to extend; if the inflows start cooling off, this upswing could shift into a high-volatility phase.
Click the avatar to join the Jiujiu chat group for daily strategies🚀
#DOGE #狗狗币 #ETF
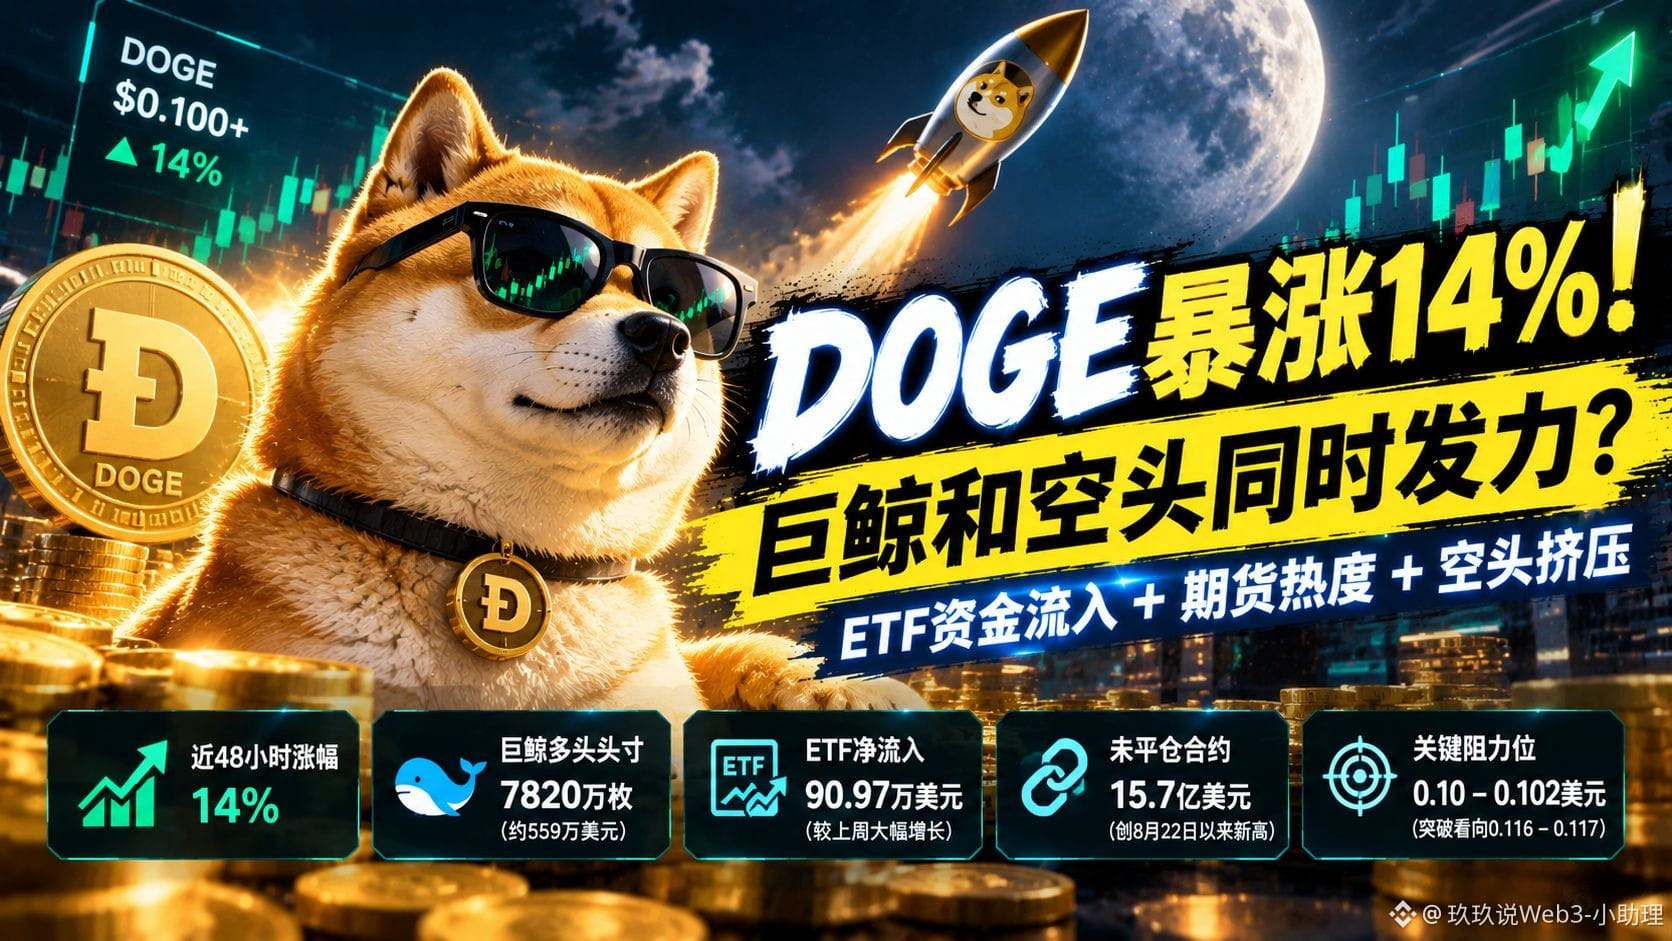
252
·
--
🚨 BTC ETF pulls in nearly $1 billion in a single day! Are institutions back again?🔥
Group: [点击进入玖玖的粉丝群](https://app.binance.com/uni-qr/YXXQJrPb)
This time, the surge in Bitcoin has finally sent a very strong signal on the capital side.👀
According to CoinDesk citing SoSoValue data, U.S. spot BTC ETFs saw a net inflow of $9.9895 billion on Monday—yes, about $1 billion, not $9.9895 billion. To be precise, it’s $9.9895 billion, approaching $1 billion.
What does that mean?
It’s the largest single-day capital inflow into U.S. spot BTC ETFs since October 6, 2025, and also the 9th-largest single-day net inflow since the ETFs were listed.💰 What’s more, this is already the third consecutive trading day with net inflows.
Among them, BlackRock’s IBIT pulled in $381 million in a day, ARKB saw inflows of $289 million, and Fidelity’s FBTC also brought in $239 million.
So this isn’t the case of just one ETF suddenly “holding the fort.” Instead, multiple major products are showing clear net inflows at the same time.
Even more noteworthy is that the return of capital and Bitcoin’s price rally happened almost in sync.
Bitcoin has recently climbed back above the $85,000 level, with a quarterly gain of 44%. At the same time, it has returned above the average cost line of U.S. spot BTC ETFs.
So what the market may be truly trading now might not just be a price rebound.
It may be whether ETF funds are starting to return to the BTC market.🔥
Of course, you can’t rush to conclusions here.
Although ETF capital has regained strength since September, total ETF inflows so far this year are still in a net-outflow position, suggesting that the earlier capital pullback hasn’t been fully erased.
In other words, this looks more like an important observation phase for now.
If, going forward, ETFs continue to maintain net inflows and BTC can hold steady around $85,000, then the persistence of capital returning will matter more than any single-day figure.
Conversely, if ETFs quickly turn back to outflows again, then those nearly $1 billion are more likely to be just a one-off, period-specific concentrated inflow.
Click your avatar to join the Jiujiu chat group for daily strategies🚀
#BTC #ETH
🚨 BTC ETF pulls in nearly $1 billion in a single day! Are institutions back again?🔥
Group: 点击进入玖玖的粉丝群
This time, the surge in Bitcoin has finally sent a very strong signal on the capital side.👀
According to CoinDesk citing SoSoValue data, U.S. spot BTC ETFs saw a net inflow of $9.9895 billion on Monday—yes, about $1 billion, not $9.9895 billion. To be precise, it’s $9.9895 billion, approaching $1 billion.
What does that mean?
It’s the largest single-day capital inflow into U.S. spot BTC ETFs since October 6, 2025, and also the 9th-largest single-day net inflow since the ETFs were listed.💰 What’s more, this is already the third consecutive trading day with net inflows.
Among them, BlackRock’s IBIT pulled in $381 million in a day, ARKB saw inflows of $289 million, and Fidelity’s FBTC also brought in $239 million.
So this isn’t the case of just one ETF suddenly “holding the fort.” Instead, multiple major products are showing clear net inflows at the same time.
Even more noteworthy is that the return of capital and Bitcoin’s price rally happened almost in sync.
Bitcoin has recently climbed back above the $85,000 level, with a quarterly gain of 44%. At the same time, it has returned above the average cost line of U.S. spot BTC ETFs.
So what the market may be truly trading now might not just be a price rebound.
It may be whether ETF funds are starting to return to the BTC market.🔥
Of course, you can’t rush to conclusions here.
Although ETF capital has regained strength since September, total ETF inflows so far this year are still in a net-outflow position, suggesting that the earlier capital pullback hasn’t been fully erased.
In other words, this looks more like an important observation phase for now.
If, going forward, ETFs continue to maintain net inflows and BTC can hold steady around $85,000, then the persistence of capital returning will matter more than any single-day figure.
Conversely, if ETFs quickly turn back to outflows again, then those nearly $1 billion are more likely to be just a one-off, period-specific concentrated inflow.
Click your avatar to join the Jiujiu chat group for daily strategies🚀
#BTC #ETH
Group: 点击进入玖玖的粉丝群
This time, the surge in Bitcoin has finally sent a very strong signal on the capital side.👀
According to CoinDesk citing SoSoValue data, U.S. spot BTC ETFs saw a net inflow of $9.9895 billion on Monday—yes, about $1 billion, not $9.9895 billion. To be precise, it’s $9.9895 billion, approaching $1 billion.
What does that mean?
It’s the largest single-day capital inflow into U.S. spot BTC ETFs since October 6, 2025, and also the 9th-largest single-day net inflow since the ETFs were listed.💰 What’s more, this is already the third consecutive trading day with net inflows.
Among them, BlackRock’s IBIT pulled in $381 million in a day, ARKB saw inflows of $289 million, and Fidelity’s FBTC also brought in $239 million.
So this isn’t the case of just one ETF suddenly “holding the fort.” Instead, multiple major products are showing clear net inflows at the same time.
Even more noteworthy is that the return of capital and Bitcoin’s price rally happened almost in sync.
Bitcoin has recently climbed back above the $85,000 level, with a quarterly gain of 44%. At the same time, it has returned above the average cost line of U.S. spot BTC ETFs.
So what the market may be truly trading now might not just be a price rebound.
It may be whether ETF funds are starting to return to the BTC market.🔥
Of course, you can’t rush to conclusions here.
Although ETF capital has regained strength since September, total ETF inflows so far this year are still in a net-outflow position, suggesting that the earlier capital pullback hasn’t been fully erased.
In other words, this looks more like an important observation phase for now.
If, going forward, ETFs continue to maintain net inflows and BTC can hold steady around $85,000, then the persistence of capital returning will matter more than any single-day figure.
Conversely, if ETFs quickly turn back to outflows again, then those nearly $1 billion are more likely to be just a one-off, period-specific concentrated inflow.
Click your avatar to join the Jiujiu chat group for daily strategies🚀
#BTC #ETH
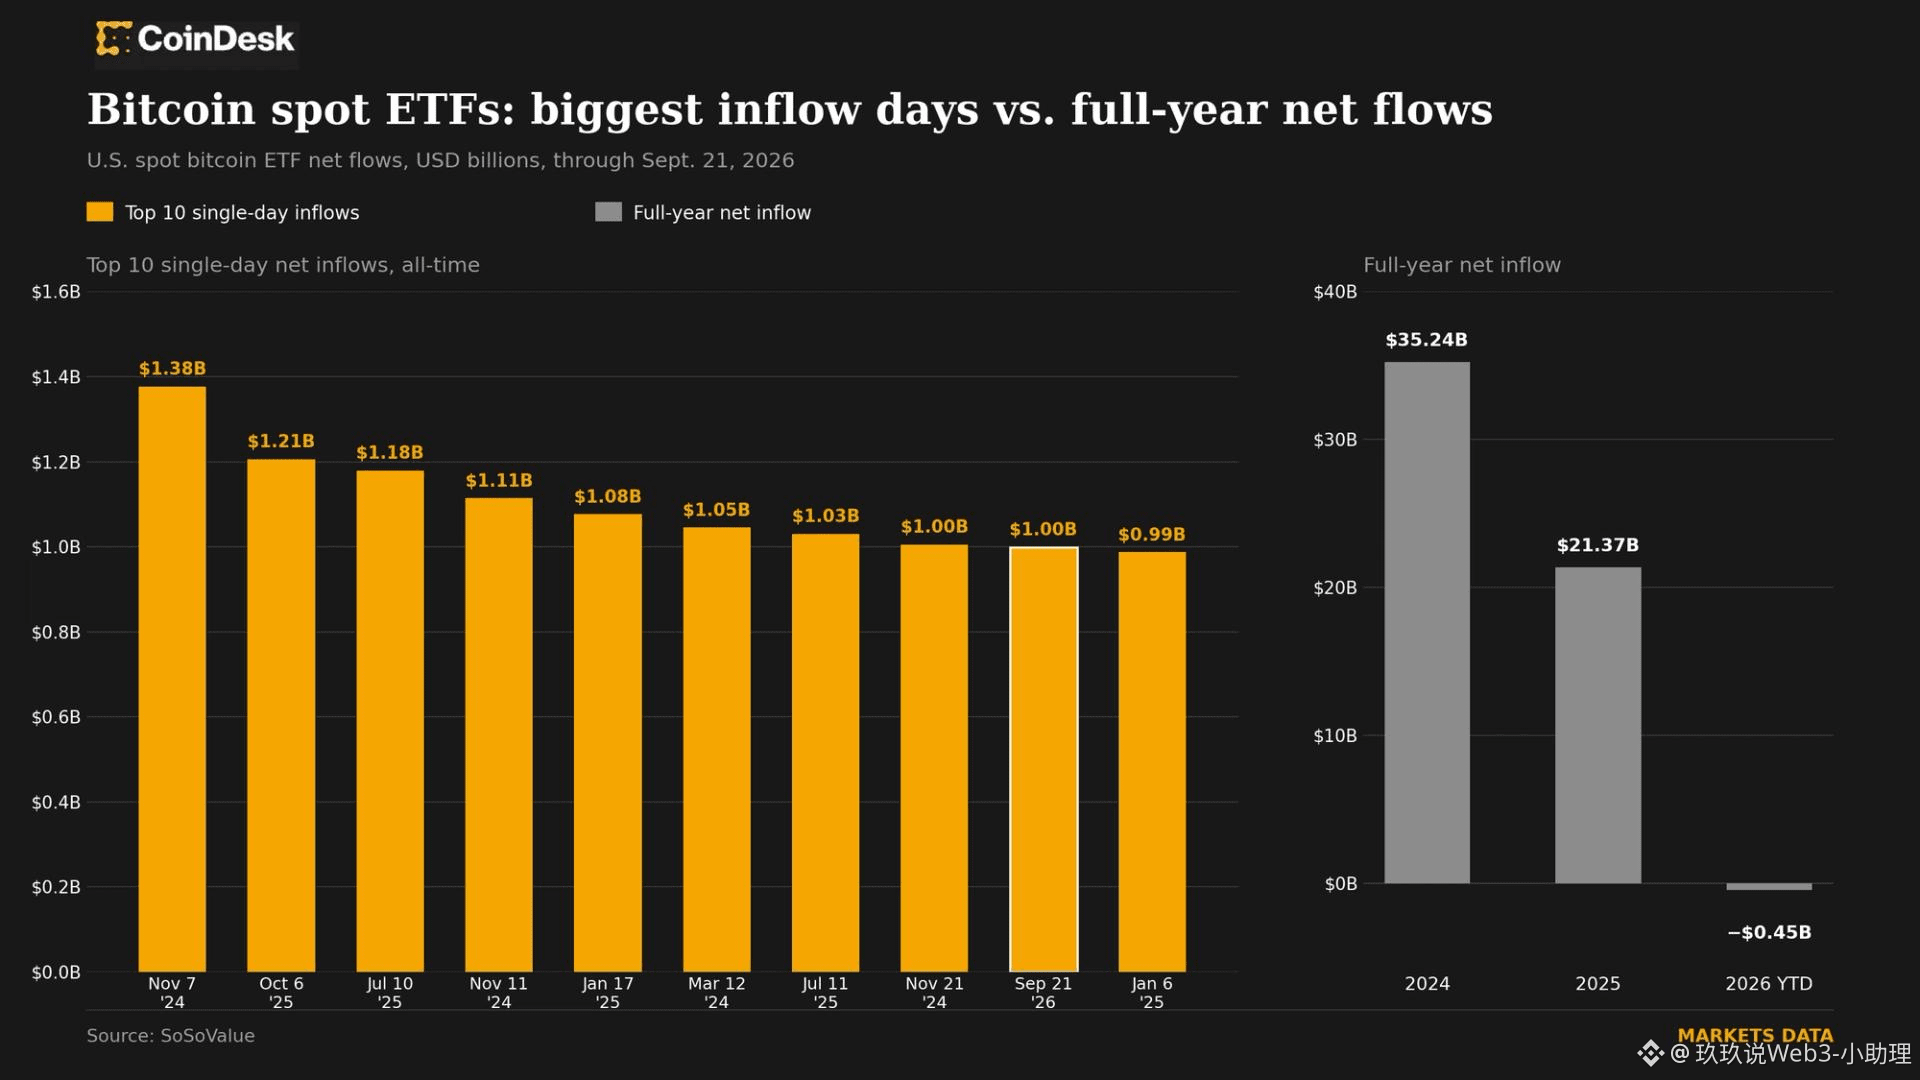
1
1.2k
·
--
🚨 HYPE Breaks Through $95! Hits a New High Again—What’s Behind It?🔥
Group: [点击进入玖玖的粉丝群](https://app.binance.com/uni-qr/YXXQJrPb)
HYPE has hit a new high again, and this is already the third time it has refreshed its record within a week.🚀
On September 21, Hyperliquid’s native token HYPE briefly surged to $95.17, up 4.7% over 24 hours. Over the past 7 days, it gained 18.5%, clearly outperforming BTC, ETH, and SOL.
But what’s really worth paying attention to may not be the $95 price.
Instead, it’s a few new changes behind HYPE.👀
First is Hyperliquid’s newly launched manual lending feature.
On September 18, after the feature went live, it generated about $269 million in borrowing volume within just 24 hours. Users can use HYPE or BTC as collateral to borrow USDC or USDT.
So what does this mean?
In the past, holders of HYPE who needed stablecoin liquidity might have had to sell their tokens first. Now, they can obtain liquidity by pledging HYPE.
Mechanically, this increases the capital efficiency of HYPE and may reduce some holders’ need to directly dump tokens.💰
The second change is that HYPE is trying to open the U.S. market.
Payward, Kraken’s parent company, has proposed launching HYPE perpetual futures for U.S. users via Bitnomial, which is regulated by the CFTC.
Currently, trading activity on Hyperliquid is already quite high, but U.S. users are still restricted. If the relevant plan is ultimately approved, the channel for HYPE to access the compliant derivatives market in the U.S. could expand further.
Of course, you still can’t interpret a “proposal” as “approved” right away.
There’s also a very key piece of data:
Currently, HYPE’s circulating supply is about 251.5 million, while total supply is about 951.6 million—so the circulating ratio is only around 26%.
That means a large number of tokens are still locked.
When market demand rises quickly, limited circulating supply may make price more sensitive to changes in capital.⚠️
So this round of HYPE’s rally might not be just driven by sentiment.
It’s the expectations formed by Hyperliquid’s trading ecosystem, the lending feature, expansion into the U.S. market, and the token supply structure working together.
But the closer it gets to the all-time high, the more you need to watch one question:
Click the avatar to join the Jiuji Chat Group for daily strategies 🚀
#hype #Hyperliquid #DeFi
🚨 HYPE Breaks Through $95! Hits a New High Again—What’s Behind It?🔥
Group: 点击进入玖玖的粉丝群
HYPE has hit a new high again, and this is already the third time it has refreshed its record within a week.🚀
On September 21, Hyperliquid’s native token HYPE briefly surged to $95.17, up 4.7% over 24 hours. Over the past 7 days, it gained 18.5%, clearly outperforming BTC, ETH, and SOL.
But what’s really worth paying attention to may not be the $95 price.
Instead, it’s a few new changes behind HYPE.👀
First is Hyperliquid’s newly launched manual lending feature.
On September 18, after the feature went live, it generated about $269 million in borrowing volume within just 24 hours. Users can use HYPE or BTC as collateral to borrow USDC or USDT.
So what does this mean?
In the past, holders of HYPE who needed stablecoin liquidity might have had to sell their tokens first. Now, they can obtain liquidity by pledging HYPE.
Mechanically, this increases the capital efficiency of HYPE and may reduce some holders’ need to directly dump tokens.💰
The second change is that HYPE is trying to open the U.S. market.
Payward, Kraken’s parent company, has proposed launching HYPE perpetual futures for U.S. users via Bitnomial, which is regulated by the CFTC.
Currently, trading activity on Hyperliquid is already quite high, but U.S. users are still restricted. If the relevant plan is ultimately approved, the channel for HYPE to access the compliant derivatives market in the U.S. could expand further.
Of course, you still can’t interpret a “proposal” as “approved” right away.
There’s also a very key piece of data:
Currently, HYPE’s circulating supply is about 251.5 million, while total supply is about 951.6 million—so the circulating ratio is only around 26%.
That means a large number of tokens are still locked.
When market demand rises quickly, limited circulating supply may make price more sensitive to changes in capital.⚠️
So this round of HYPE’s rally might not be just driven by sentiment.
It’s the expectations formed by Hyperliquid’s trading ecosystem, the lending feature, expansion into the U.S. market, and the token supply structure working together.
But the closer it gets to the all-time high, the more you need to watch one question:
Click the avatar to join the Jiuji Chat Group for daily strategies 🚀
#hype #Hyperliquid #DeFi
Group: 点击进入玖玖的粉丝群
HYPE has hit a new high again, and this is already the third time it has refreshed its record within a week.🚀
On September 21, Hyperliquid’s native token HYPE briefly surged to $95.17, up 4.7% over 24 hours. Over the past 7 days, it gained 18.5%, clearly outperforming BTC, ETH, and SOL.
But what’s really worth paying attention to may not be the $95 price.
Instead, it’s a few new changes behind HYPE.👀
First is Hyperliquid’s newly launched manual lending feature.
On September 18, after the feature went live, it generated about $269 million in borrowing volume within just 24 hours. Users can use HYPE or BTC as collateral to borrow USDC or USDT.
So what does this mean?
In the past, holders of HYPE who needed stablecoin liquidity might have had to sell their tokens first. Now, they can obtain liquidity by pledging HYPE.
Mechanically, this increases the capital efficiency of HYPE and may reduce some holders’ need to directly dump tokens.💰
The second change is that HYPE is trying to open the U.S. market.
Payward, Kraken’s parent company, has proposed launching HYPE perpetual futures for U.S. users via Bitnomial, which is regulated by the CFTC.
Currently, trading activity on Hyperliquid is already quite high, but U.S. users are still restricted. If the relevant plan is ultimately approved, the channel for HYPE to access the compliant derivatives market in the U.S. could expand further.
Of course, you still can’t interpret a “proposal” as “approved” right away.
There’s also a very key piece of data:
Currently, HYPE’s circulating supply is about 251.5 million, while total supply is about 951.6 million—so the circulating ratio is only around 26%.
That means a large number of tokens are still locked.
When market demand rises quickly, limited circulating supply may make price more sensitive to changes in capital.⚠️
So this round of HYPE’s rally might not be just driven by sentiment.
It’s the expectations formed by Hyperliquid’s trading ecosystem, the lending feature, expansion into the U.S. market, and the token supply structure working together.
But the closer it gets to the all-time high, the more you need to watch one question:
Click the avatar to join the Jiuji Chat Group for daily strategies 🚀
#hype #Hyperliquid #DeFi

254
·
--
🚨 BitMine is aggressively buying ETH! 5.98 million coins, nearing 5%—are institutions coming back?🔥
Group: [点击进入玖玖的粉丝群](https://app.binance.com/uni-qr/YXXQJrPb)
BitMine has moved again, and this time it’s getting closer to a key number.👀
According to disclosures, BitMine recently bought another 27,562 ETH, investing about $75.2 million, bringing its ETH holdings to 5.984 million coins—about 4.9% based on current circulating supply.
It’s only about 121,000 ETH away from its goal of holding 5% of the total ETH supply.
Why is this number worth paying attention to?
Because BitMine isn’t buying a little ETH now and then—it’s continuously putting ETH onto the company’s balance sheet. Since launching its crypto asset reserve strategy in June 2025, the company has kept accumulating ETH, and ETH is becoming its core reserve asset.💰
More importantly, BitMine hasn’t simply left all of those ETH sitting idle.
Currently, the company has staked nearly 5 million ETH, accounting for about 83.6% of its holdings. Based on current yield levels, the company expects to earn roughly $357 million in staking returns per year.
This means BitMine isn’t just betting on the ETH price.
It’s essentially betting on two things: first, the long-term value of ETH assets themselves; and second, Ethereum’s ability to generate ongoing yield.
That’s a very clear difference between ETH and BTC when used as corporate reserve assets.
But risks should also be considered here.⚠️
The larger BitMine’s holdings, the more tightly linked the company’s share price and the ETH price become. If the ETH price falls, the book value of the assets it holds would also be affected.
And the “nearing 5%” is only a symbolic milestone—it doesn’t mean ETH will necessarily rise once it reaches 5%.
What’s truly worth watching is whether BitMine can keep maintaining its accumulation pace, and whether more and more institutions begin adopting similar ETH reserve strategies.
Company chairman Tom Lee also expects that institutional investors may increase their crypto allocation again in the last few months of 2026.
Click the avatar to join the JiJiu chat group for daily strategies🚀
#ETH #以太坊 #Bitmine
🚨 BitMine is aggressively buying ETH! 5.98 million coins, nearing 5%—are institutions coming back?🔥
Group: 点击进入玖玖的粉丝群
BitMine has moved again, and this time it’s getting closer to a key number.👀
According to disclosures, BitMine recently bought another 27,562 ETH, investing about $75.2 million, bringing its ETH holdings to 5.984 million coins—about 4.9% based on current circulating supply.
It’s only about 121,000 ETH away from its goal of holding 5% of the total ETH supply.
Why is this number worth paying attention to?
Because BitMine isn’t buying a little ETH now and then—it’s continuously putting ETH onto the company’s balance sheet. Since launching its crypto asset reserve strategy in June 2025, the company has kept accumulating ETH, and ETH is becoming its core reserve asset.💰
More importantly, BitMine hasn’t simply left all of those ETH sitting idle.
Currently, the company has staked nearly 5 million ETH, accounting for about 83.6% of its holdings. Based on current yield levels, the company expects to earn roughly $357 million in staking returns per year.
This means BitMine isn’t just betting on the ETH price.
It’s essentially betting on two things: first, the long-term value of ETH assets themselves; and second, Ethereum’s ability to generate ongoing yield.
That’s a very clear difference between ETH and BTC when used as corporate reserve assets.
But risks should also be considered here.⚠️
The larger BitMine’s holdings, the more tightly linked the company’s share price and the ETH price become. If the ETH price falls, the book value of the assets it holds would also be affected.
And the “nearing 5%” is only a symbolic milestone—it doesn’t mean ETH will necessarily rise once it reaches 5%.
What’s truly worth watching is whether BitMine can keep maintaining its accumulation pace, and whether more and more institutions begin adopting similar ETH reserve strategies.
Company chairman Tom Lee also expects that institutional investors may increase their crypto allocation again in the last few months of 2026.
Click the avatar to join the JiJiu chat group for daily strategies🚀
#ETH #以太坊 #Bitmine
Group: 点击进入玖玖的粉丝群
BitMine has moved again, and this time it’s getting closer to a key number.👀
According to disclosures, BitMine recently bought another 27,562 ETH, investing about $75.2 million, bringing its ETH holdings to 5.984 million coins—about 4.9% based on current circulating supply.
It’s only about 121,000 ETH away from its goal of holding 5% of the total ETH supply.
Why is this number worth paying attention to?
Because BitMine isn’t buying a little ETH now and then—it’s continuously putting ETH onto the company’s balance sheet. Since launching its crypto asset reserve strategy in June 2025, the company has kept accumulating ETH, and ETH is becoming its core reserve asset.💰
More importantly, BitMine hasn’t simply left all of those ETH sitting idle.
Currently, the company has staked nearly 5 million ETH, accounting for about 83.6% of its holdings. Based on current yield levels, the company expects to earn roughly $357 million in staking returns per year.
This means BitMine isn’t just betting on the ETH price.
It’s essentially betting on two things: first, the long-term value of ETH assets themselves; and second, Ethereum’s ability to generate ongoing yield.
That’s a very clear difference between ETH and BTC when used as corporate reserve assets.
But risks should also be considered here.⚠️
The larger BitMine’s holdings, the more tightly linked the company’s share price and the ETH price become. If the ETH price falls, the book value of the assets it holds would also be affected.
And the “nearing 5%” is only a symbolic milestone—it doesn’t mean ETH will necessarily rise once it reaches 5%.
What’s truly worth watching is whether BitMine can keep maintaining its accumulation pace, and whether more and more institutions begin adopting similar ETH reserve strategies.
Company chairman Tom Lee also expects that institutional investors may increase their crypto allocation again in the last few months of 2026.
Click the avatar to join the JiJiu chat group for daily strategies🚀
#ETH #以太坊 #Bitmine

191
Log in to explore more content
Join global crypto users on Binance Square
⚡️ Get latest and useful information about crypto.
💬 Trusted by the world’s largest crypto exchange.
👍 Discover real insights from verified creators.
Email / Phone number
Trending Topics
USWeighsPromotingDollarStablecoinsAbroad
1,047 views
107 Discussing
#USWeighsPromotingDollarStablecoinsAbroad
🚨 THE DOLLAR IS GOING DIGITAL — AND AMERICA WANTS THE WORLD TO USE IT!
🇺🇸 The United States is weighing ways to promote dollar-backed stablecoins overseas, potentially expanding the dollar's reach through blockchain technology.
💵 More global demand for USD stablecoins
🌍 Faster cross-border payments
🔗 Greater adoption of blockchain-based finance
📈 New opportunities for stablecoin issuers and crypto platforms
The dollar's next frontier may not be traditional banking — it could be the blockchain.
If the U.S. actively promotes dollar stablecoins abroad, it could accelerate global adoption of digital dollars and strengthen America's financial influence. For crypto markets, this may support stablecoin infrastructure, liquidity, and payment innovation. But regulatory challenges, competition from local currencies, and concerns over monetary sovereignty remain important factors to watch.
The future of money may be digital — but the currency could still be the dollar.
What do you think? Will dollar stablecoins dominate global digital payments? 👇
#Stablecoins #USDT #USDC #CryptoNews #Bitcoin #Blockchain #DigitalDollar #BinanceSquare
A_K Crypto
·0 Likes
·22 views
US10YTreasuryYieldHits19YearHigh
1,459 views
103 Discussing
SpotBitcoinETFsInflow$2.31BInFourDays
284 views
20 Discussing