
wiki002
4.2k Posts

wiki002
Allah is greatest
High-Frequency Trader
2 Years
1.0K+ Following
6.1K Followers
16.1K+ Liked
Posts
All
Quotes
Live
PINNED
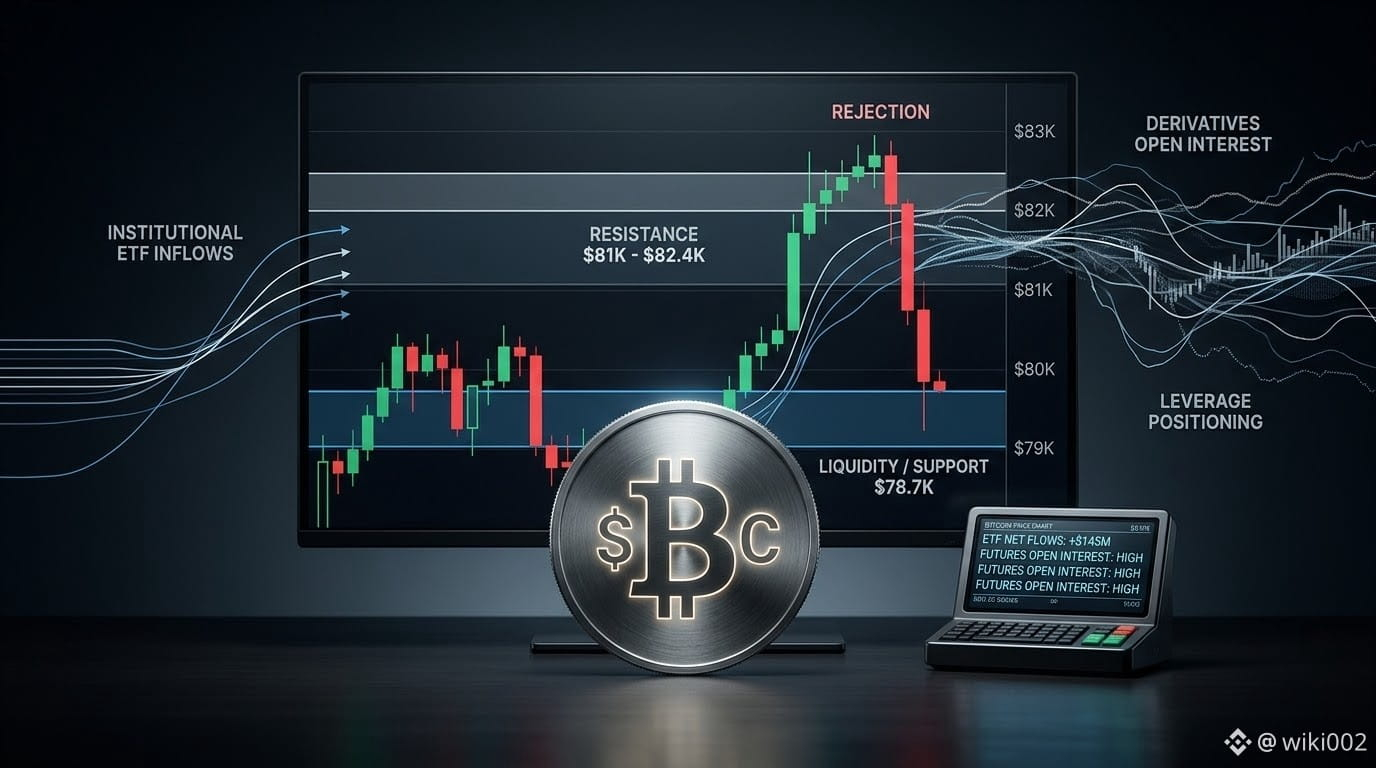
Something about Bitcoin’s latest move doesn’t add up to me.
U.S. spot Bitcoin ETFs pulled in roughly $3.8B over the three weeks through September 4, yet $BTC still failed to hold its move above $82K and slipped back toward $80K. Futures open interest is still around $54.4B.
That creates a more interesting question than “Is Bitcoin bullish?”
If genuine demand is absorbing supply, why did price struggle to retain the breakout?
My read is that ETF demand may be providing strong underlying liquidity, but derivatives positioning is still influencing the marginal price.
That distinction matters.
A leveraged trader can move price quickly, but they cannot necessarily create durable demand. If $BTC rallies toward $81K–$82.4K while open interest expands aggressively and spot demand doesn't accelerate with it, I’d treat that strength cautiously.
But if Bitcoin reclaims that area while leverage stays contained and price continues holding higher after the initial breakout, the signal becomes much stronger.
The downside tells us something too. A loss of roughly $78.7K would make me question whether the recent recovery was genuine accumulation or simply a liquidity-driven rebound.
This is where my own approach has changed.
I don't want to predict the breakout anymore.
I want to see whether the market can absorb the sellers that appear after the breakout.
That is the difference between a move that looks bullish on a chart and one that can actually sustain itself. 🔎
$BTC #Bitcoin #Crypto #Trading
U.S. spot Bitcoin ETFs pulled in roughly $3.8B over the three weeks through September 4, yet $BTC still failed to hold its move above $82K and slipped back toward $80K. Futures open interest is still around $54.4B.
That creates a more interesting question than “Is Bitcoin bullish?”
If genuine demand is absorbing supply, why did price struggle to retain the breakout?
My read is that ETF demand may be providing strong underlying liquidity, but derivatives positioning is still influencing the marginal price.
That distinction matters.
A leveraged trader can move price quickly, but they cannot necessarily create durable demand. If $BTC rallies toward $81K–$82.4K while open interest expands aggressively and spot demand doesn't accelerate with it, I’d treat that strength cautiously.
But if Bitcoin reclaims that area while leverage stays contained and price continues holding higher after the initial breakout, the signal becomes much stronger.
The downside tells us something too. A loss of roughly $78.7K would make me question whether the recent recovery was genuine accumulation or simply a liquidity-driven rebound.
This is where my own approach has changed.
I don't want to predict the breakout anymore.
I want to see whether the market can absorb the sellers that appear after the breakout.
That is the difference between a move that looks bullish on a chart and one that can actually sustain itself. 🔎
$BTC #Bitcoin #Crypto #Trading
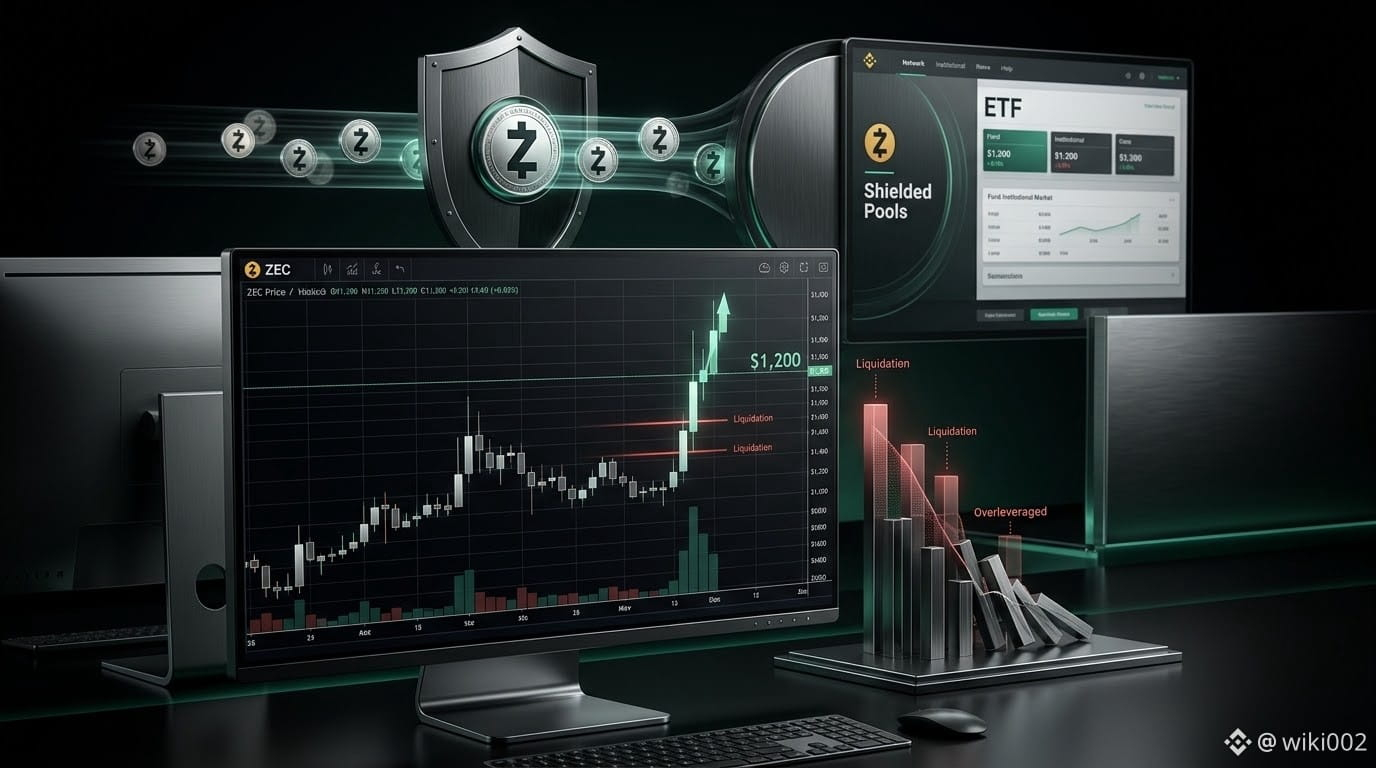
ZEC breaking above $1,200 is impressive.
But I’m not interested in buying a vertical candle. I’m interested in what happens after
the squeeze loses its fuel.
The recent move has clearly been amplified by leverage. ZEC futures open interest has reached about $2.4B, while roughly $34.5M in short positions were liquidated during the surge. That creates upside acceleration, but it also makes the move more fragile if momentum reverses.
There is a second demand channel worth watching.
Grayscale’s ZCSH has recorded at least $34.4M in net inflows since its August 25 debut. Its assets reached about $463M by September 4, although I would not treat that entire AUM increase as new buying because ZEC’s price appreciation also raises the fund’s asset value.
The network side is interesting too.
Shielded supply has climbed to roughly 4.9M ZEC, around 30% of supply. That doesn’t mean those coins are permanently locked. It does show that shielded balances now represent a materially larger share of ZEC’s supply.
That leaves me watching one thing.
The next signal is not another liquidation spike. It is whether ZEC can hold the breakout while leverage cools.
I’d become more constructive if price holds above the breakout area, open interest stabilizes or falls without a major price breakdown, and ETF net inflows continue.
That would tell me the market is absorbing the move rather than simply squeezing shorts.
If those conditions fail, I would wait.
Personally, I’d rather buy confirmation of strength than become liquidity for the final part of a squeeze.
$ZEC $SOL $ORCA #ZEC #Zcash #Crypto
But I’m not interested in buying a vertical candle. I’m interested in what happens after
the squeeze loses its fuel.
The recent move has clearly been amplified by leverage. ZEC futures open interest has reached about $2.4B, while roughly $34.5M in short positions were liquidated during the surge. That creates upside acceleration, but it also makes the move more fragile if momentum reverses.
There is a second demand channel worth watching.
Grayscale’s ZCSH has recorded at least $34.4M in net inflows since its August 25 debut. Its assets reached about $463M by September 4, although I would not treat that entire AUM increase as new buying because ZEC’s price appreciation also raises the fund’s asset value.
The network side is interesting too.
Shielded supply has climbed to roughly 4.9M ZEC, around 30% of supply. That doesn’t mean those coins are permanently locked. It does show that shielded balances now represent a materially larger share of ZEC’s supply.
That leaves me watching one thing.
The next signal is not another liquidation spike. It is whether ZEC can hold the breakout while leverage cools.
I’d become more constructive if price holds above the breakout area, open interest stabilizes or falls without a major price breakdown, and ETF net inflows continue.
That would tell me the market is absorbing the move rather than simply squeezing shorts.
If those conditions fail, I would wait.
Personally, I’d rather buy confirmation of strength than become liquidity for the final part of a squeeze.
$ZEC $SOL $ORCA #ZEC #Zcash #Crypto
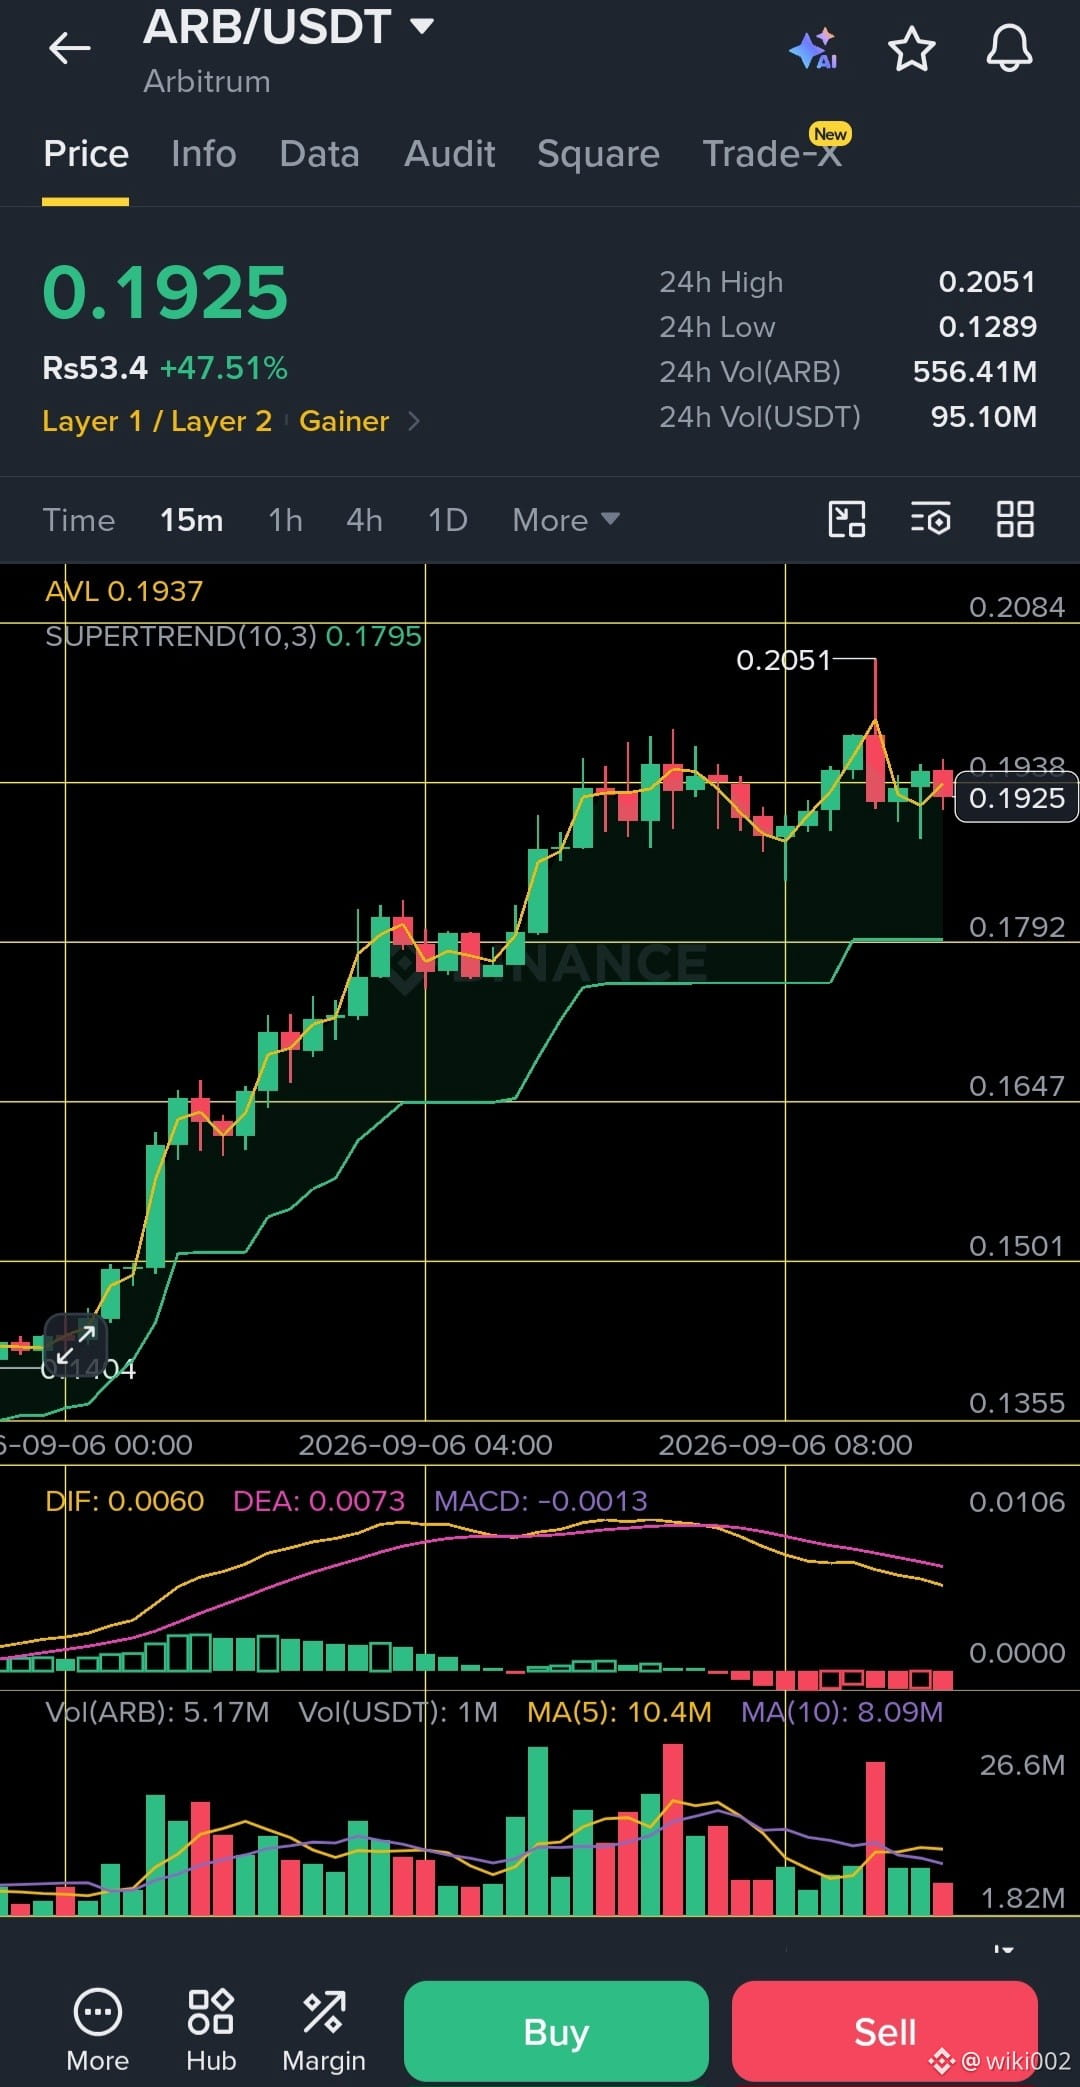
$ARB is holding strong after a sharp breakout, but the next move needs confirmation.
📍 Entry Zone: 0.190–0.194
🎯 Targets: 0.200 → 0.205 → 0.208
🛑 Stop Loss: Below 0.179
Price is consolidating near the breakout area while Supertrend remains bullish. A clean reclaim of 0.200–0.205 could open the way higher, while losing 0.179 would weaken the setup significantly.
Manage risk the move has already been aggressive.
$ARB $RAY #ARB #Arbitrum #CryptoTrading
📍 Entry Zone: 0.190–0.194
🎯 Targets: 0.200 → 0.205 → 0.208
🛑 Stop Loss: Below 0.179
Price is consolidating near the breakout area while Supertrend remains bullish. A clean reclaim of 0.200–0.205 could open the way higher, while losing 0.179 would weaken the setup significantly.
Manage risk the move has already been aggressive.
$ARB $RAY #ARB #Arbitrum #CryptoTrading
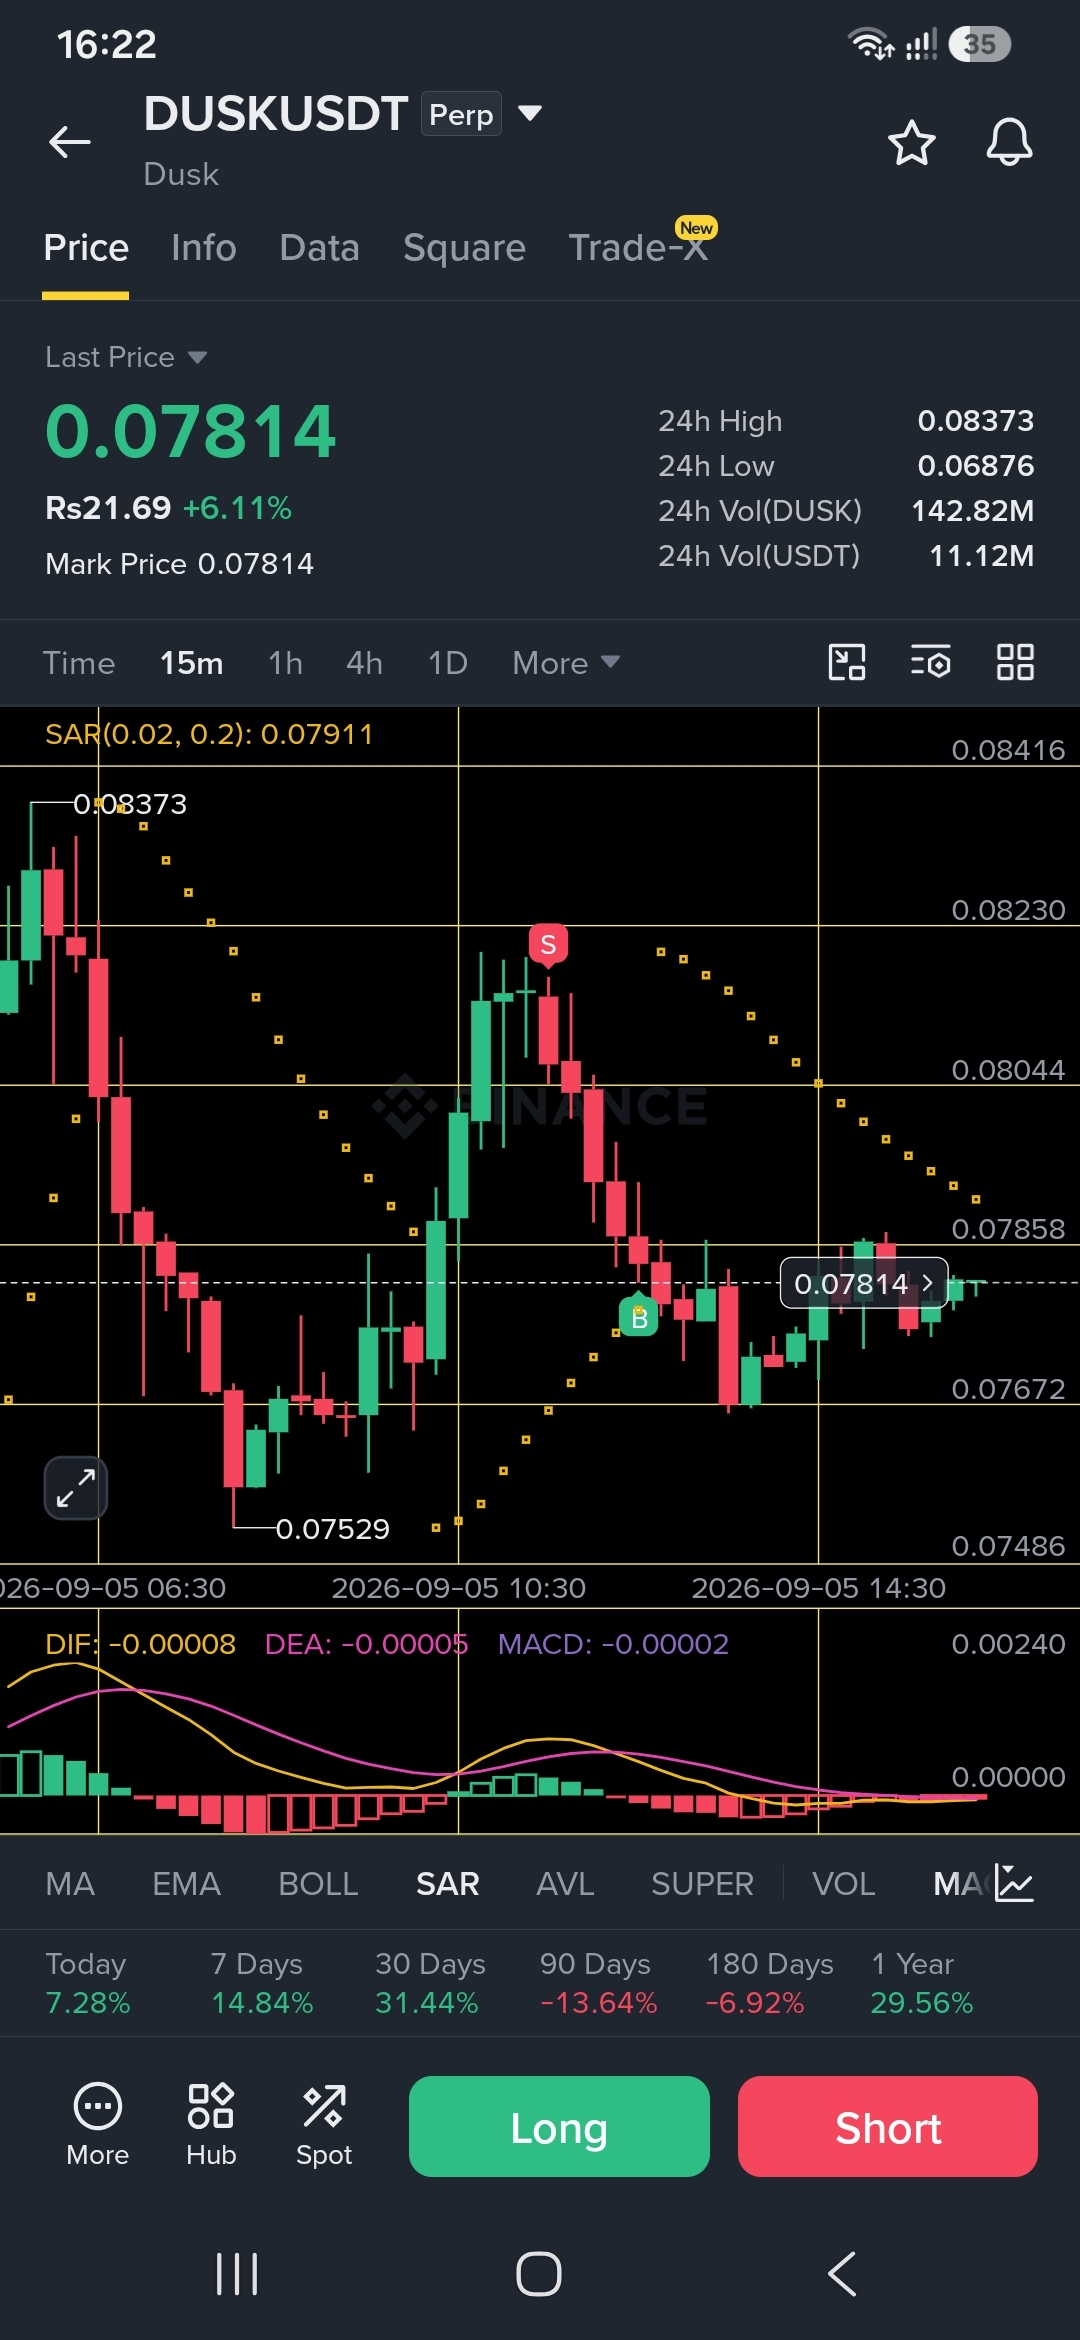
DUSK/USDT 📊
Bias: LONG on confirmation
DUSK is holding above the 0.0767 support zone after a sharp recovery. Momentum is stabilizing, but price is still below the 0.0791 SAR level, so confirmation matters.
Entry: 0.0776 – 0.0782
TP1: 0.0791
TP2: 0.0804
TP3: 0.0823
Stop Loss: 0.0765
A clean reclaim of 0.0791 would strengthen the bullish setup. Losing 0.0767 invalidates the idea.
Risk management first. Don’t chase the candle.
$DUSK $MARSCOIN $USDT #DUSK #CryptoTrading #Binance
Bias: LONG on confirmation
DUSK is holding above the 0.0767 support zone after a sharp recovery. Momentum is stabilizing, but price is still below the 0.0791 SAR level, so confirmation matters.
Entry: 0.0776 – 0.0782
TP1: 0.0791
TP2: 0.0804
TP3: 0.0823
Stop Loss: 0.0765
A clean reclaim of 0.0791 would strengthen the bullish setup. Losing 0.0767 invalidates the idea.
Risk management first. Don’t chase the candle.
$DUSK $MARSCOIN $USDT #DUSK #CryptoTrading #Binance
Verified
AI agents are moving from copilots toward economic actors.
The difficult problem isn’t giving an agent more autonomy. It’s controlling what that autonomy can reach.
An agent that only generates an answer needs to be accurate.
An agent that can access private data, use credentials, call external systems or execute transactions needs something harder: verifiable boundaries around its authority.
That is the part of the agent economy I think is still underestimated.
The key question becomes. Can I verify what the agent was permitted to do, where sensitive computation occurred, and what it actually executed?
This is where @NEAR Protocol gets interesting to me.
NEAR AI uses hardware-enforced Trusted Execution Environments to isolate sensitive inference and agent workloads, while remote attestation provides evidence that computation is running inside the expected environment.
Then there is Chain Signatures. NEAR enables an account on its network to control accounts on external chains through threshold cryptography, giving agents a native way to execute cross-chain transactions without maintaining a separate private key for every network.
To me, that creates a useful security split.
TEE protects sensitive computation. Attestation makes the execution environment verifiable. Chain Signatures extend execution authority across chains.
The second-order effect is bigger than AI + blockchain.
Once an agent can act across multiple systems, its permissions stop being merely an application feature. They become part of the infrastructure defining the agent’s economic boundaries.
My view is that the winning agent stack won’t simply make agents more autonomous.
It will make their autonomy private, verifiable and bounded.
That is the infrastructure problem @NEAR Protocol is actually interesting for.
$NEAR $DASH $S #NEAR
The difficult problem isn’t giving an agent more autonomy. It’s controlling what that autonomy can reach.
An agent that only generates an answer needs to be accurate.
An agent that can access private data, use credentials, call external systems or execute transactions needs something harder: verifiable boundaries around its authority.
That is the part of the agent economy I think is still underestimated.
The key question becomes. Can I verify what the agent was permitted to do, where sensitive computation occurred, and what it actually executed?
This is where @NEAR Protocol gets interesting to me.
NEAR AI uses hardware-enforced Trusted Execution Environments to isolate sensitive inference and agent workloads, while remote attestation provides evidence that computation is running inside the expected environment.
Then there is Chain Signatures. NEAR enables an account on its network to control accounts on external chains through threshold cryptography, giving agents a native way to execute cross-chain transactions without maintaining a separate private key for every network.
To me, that creates a useful security split.
TEE protects sensitive computation. Attestation makes the execution environment verifiable. Chain Signatures extend execution authority across chains.
The second-order effect is bigger than AI + blockchain.
Once an agent can act across multiple systems, its permissions stop being merely an application feature. They become part of the infrastructure defining the agent’s economic boundaries.
My view is that the winning agent stack won’t simply make agents more autonomous.
It will make their autonomy private, verifiable and bounded.
That is the infrastructure problem @NEAR Protocol is actually interesting for.
$NEAR $DASH $S #NEAR

CHIP/USDT 📊
Price: 0.06001$
Bias: Bullish above 0.0593
Entry Zone: 0.0593 – 0.0600
Targets: 0.0615 → 0.0624 → 0.0640
Stop Loss: Below 0.0562
Price is holding above the Bollinger mid-band while the recent pullback is showing signs of stabilization. The key test remains 0.0624–0.0625 resistance; a clean breakout can open the next upside leg.
⚠️ Manage risk. No setup is guaranteed.
#CHIP #USD_AI #TradingSignal #Crypto $CHIP
Price: 0.06001$
Bias: Bullish above 0.0593
Entry Zone: 0.0593 – 0.0600
Targets: 0.0615 → 0.0624 → 0.0640
Stop Loss: Below 0.0562
Price is holding above the Bollinger mid-band while the recent pullback is showing signs of stabilization. The key test remains 0.0624–0.0625 resistance; a clean breakout can open the next upside leg.
⚠️ Manage risk. No setup is guaranteed.
#CHIP #USD_AI #TradingSignal #Crypto $CHIP
I’m considering holding DOGE, but not because I expect another meme rally.
I’m looking at a different question. Can DOGE still justify a place in a portfolio after surviving more than a decade of crypto cycles? 🤔
What makes DOGE interesting to me is the combination of simplicity, liquidity and longevity.
DOGE has operated since 2013 as a Scrypt-based Proof-of-Work network focused on value transfer. It sacrifices smart-contract programmability and application composability, but that trade-off may suit an asset whose primary role is moving value rather than running complex applications.
The liquidity side matters too. DOGE remains a large-cap crypto asset with substantial daily trading activity. That gives holders broad conversion markets and makes its monetary role more practical than the market cap alone suggests.
But I don’t want to confuse durability with undervaluation.
DOGE has ongoing issuance, limited native programmability and sentiment-sensitive price discovery. So I’m not assuming today’s valuation automatically offers attractive risk/reward.
What I find compelling is the combination: a simple protocol, persistent liquidity and a network that has remained operational since 2013.
That doesn’t make DOGE the next Ethereum.
It gives DOGE a different potential role: a recognizable, liquid and durable digital asset for transferring value. 🧭
That’s why I’m considering holding it cautiously, and as a calculated allocation rather than a blind meme bet.
$DOGE $BONK $1000CAT
#Dogecoin #DOGE #Crypto #Web3
I’m looking at a different question. Can DOGE still justify a place in a portfolio after surviving more than a decade of crypto cycles? 🤔
What makes DOGE interesting to me is the combination of simplicity, liquidity and longevity.
DOGE has operated since 2013 as a Scrypt-based Proof-of-Work network focused on value transfer. It sacrifices smart-contract programmability and application composability, but that trade-off may suit an asset whose primary role is moving value rather than running complex applications.
The liquidity side matters too. DOGE remains a large-cap crypto asset with substantial daily trading activity. That gives holders broad conversion markets and makes its monetary role more practical than the market cap alone suggests.
But I don’t want to confuse durability with undervaluation.
DOGE has ongoing issuance, limited native programmability and sentiment-sensitive price discovery. So I’m not assuming today’s valuation automatically offers attractive risk/reward.
What I find compelling is the combination: a simple protocol, persistent liquidity and a network that has remained operational since 2013.
That doesn’t make DOGE the next Ethereum.
It gives DOGE a different potential role: a recognizable, liquid and durable digital asset for transferring value. 🧭
That’s why I’m considering holding it cautiously, and as a calculated allocation rather than a blind meme bet.
$DOGE $BONK $1000CAT
#Dogecoin #DOGE #Crypto #Web3

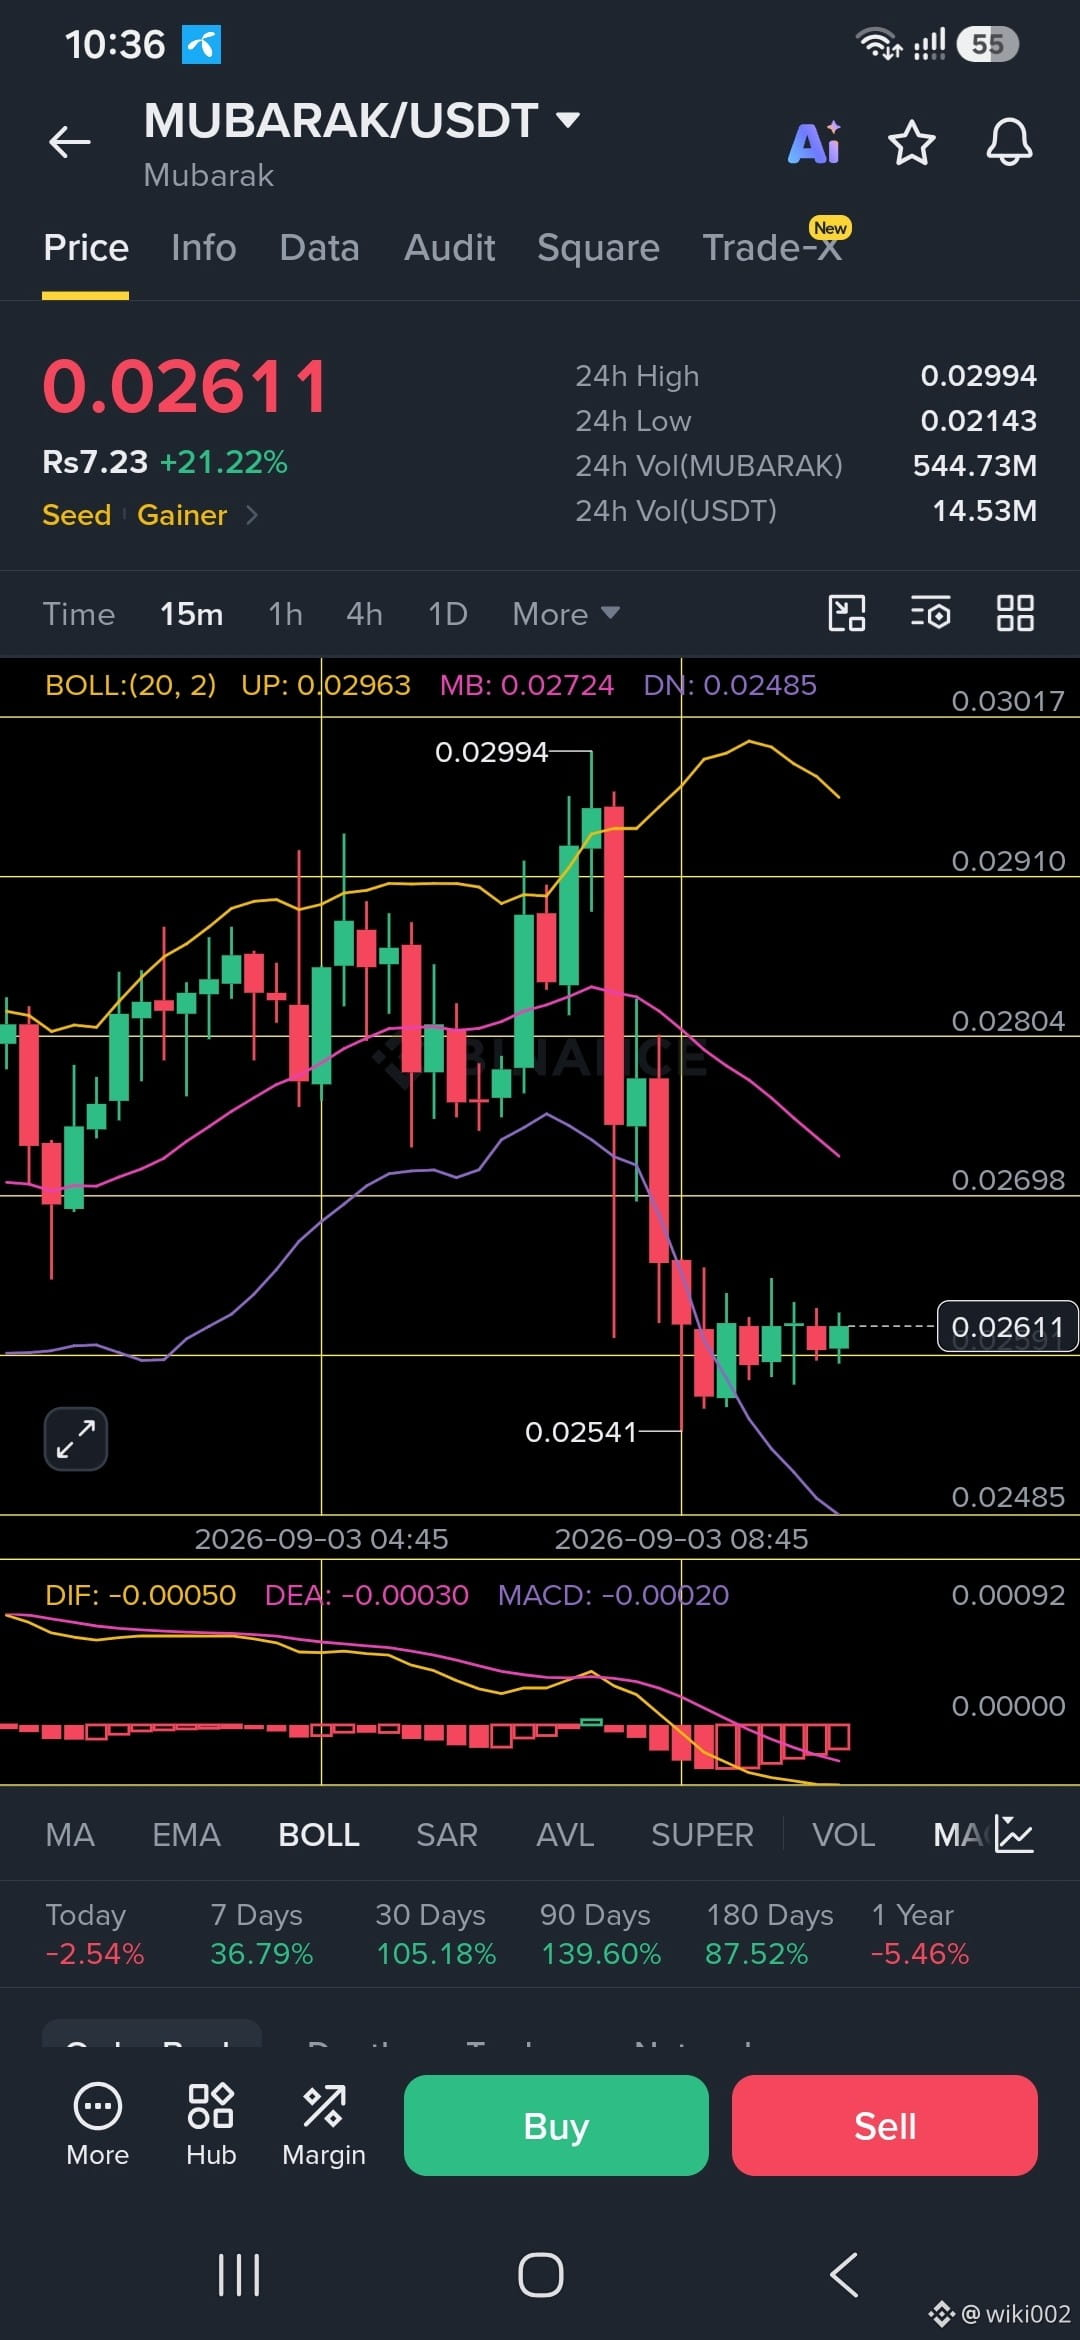
MUBARAK/USDT 📊
Bias: Cautious LONG
Entry Zone: 0.0256 – 0.0262
TP1: 0.0272
TP2: 0.0280
TP3: 0.0291 – 0.0296
Stop Loss: 0.0248
Price is consolidating above the 0.0254 support after a sharp rejection from 0.02994. Momentum remains weak, so the setup depends on holding the 0.0254–0.0256 area and reclaiming 0.0272.
⚠️ If 0.0248 breaks decisively, the long setup is invalidated.
$MUBARAK $HEMI $EGLD
#MUBARAK #Crypto #Trading #Binance
Bias: Cautious LONG
Entry Zone: 0.0256 – 0.0262
TP1: 0.0272
TP2: 0.0280
TP3: 0.0291 – 0.0296
Stop Loss: 0.0248
Price is consolidating above the 0.0254 support after a sharp rejection from 0.02994. Momentum remains weak, so the setup depends on holding the 0.0254–0.0256 area and reclaiming 0.0272.
⚠️ If 0.0248 breaks decisively, the long setup is invalidated.
$MUBARAK $HEMI $EGLD
#MUBARAK #Crypto #Trading #Binance
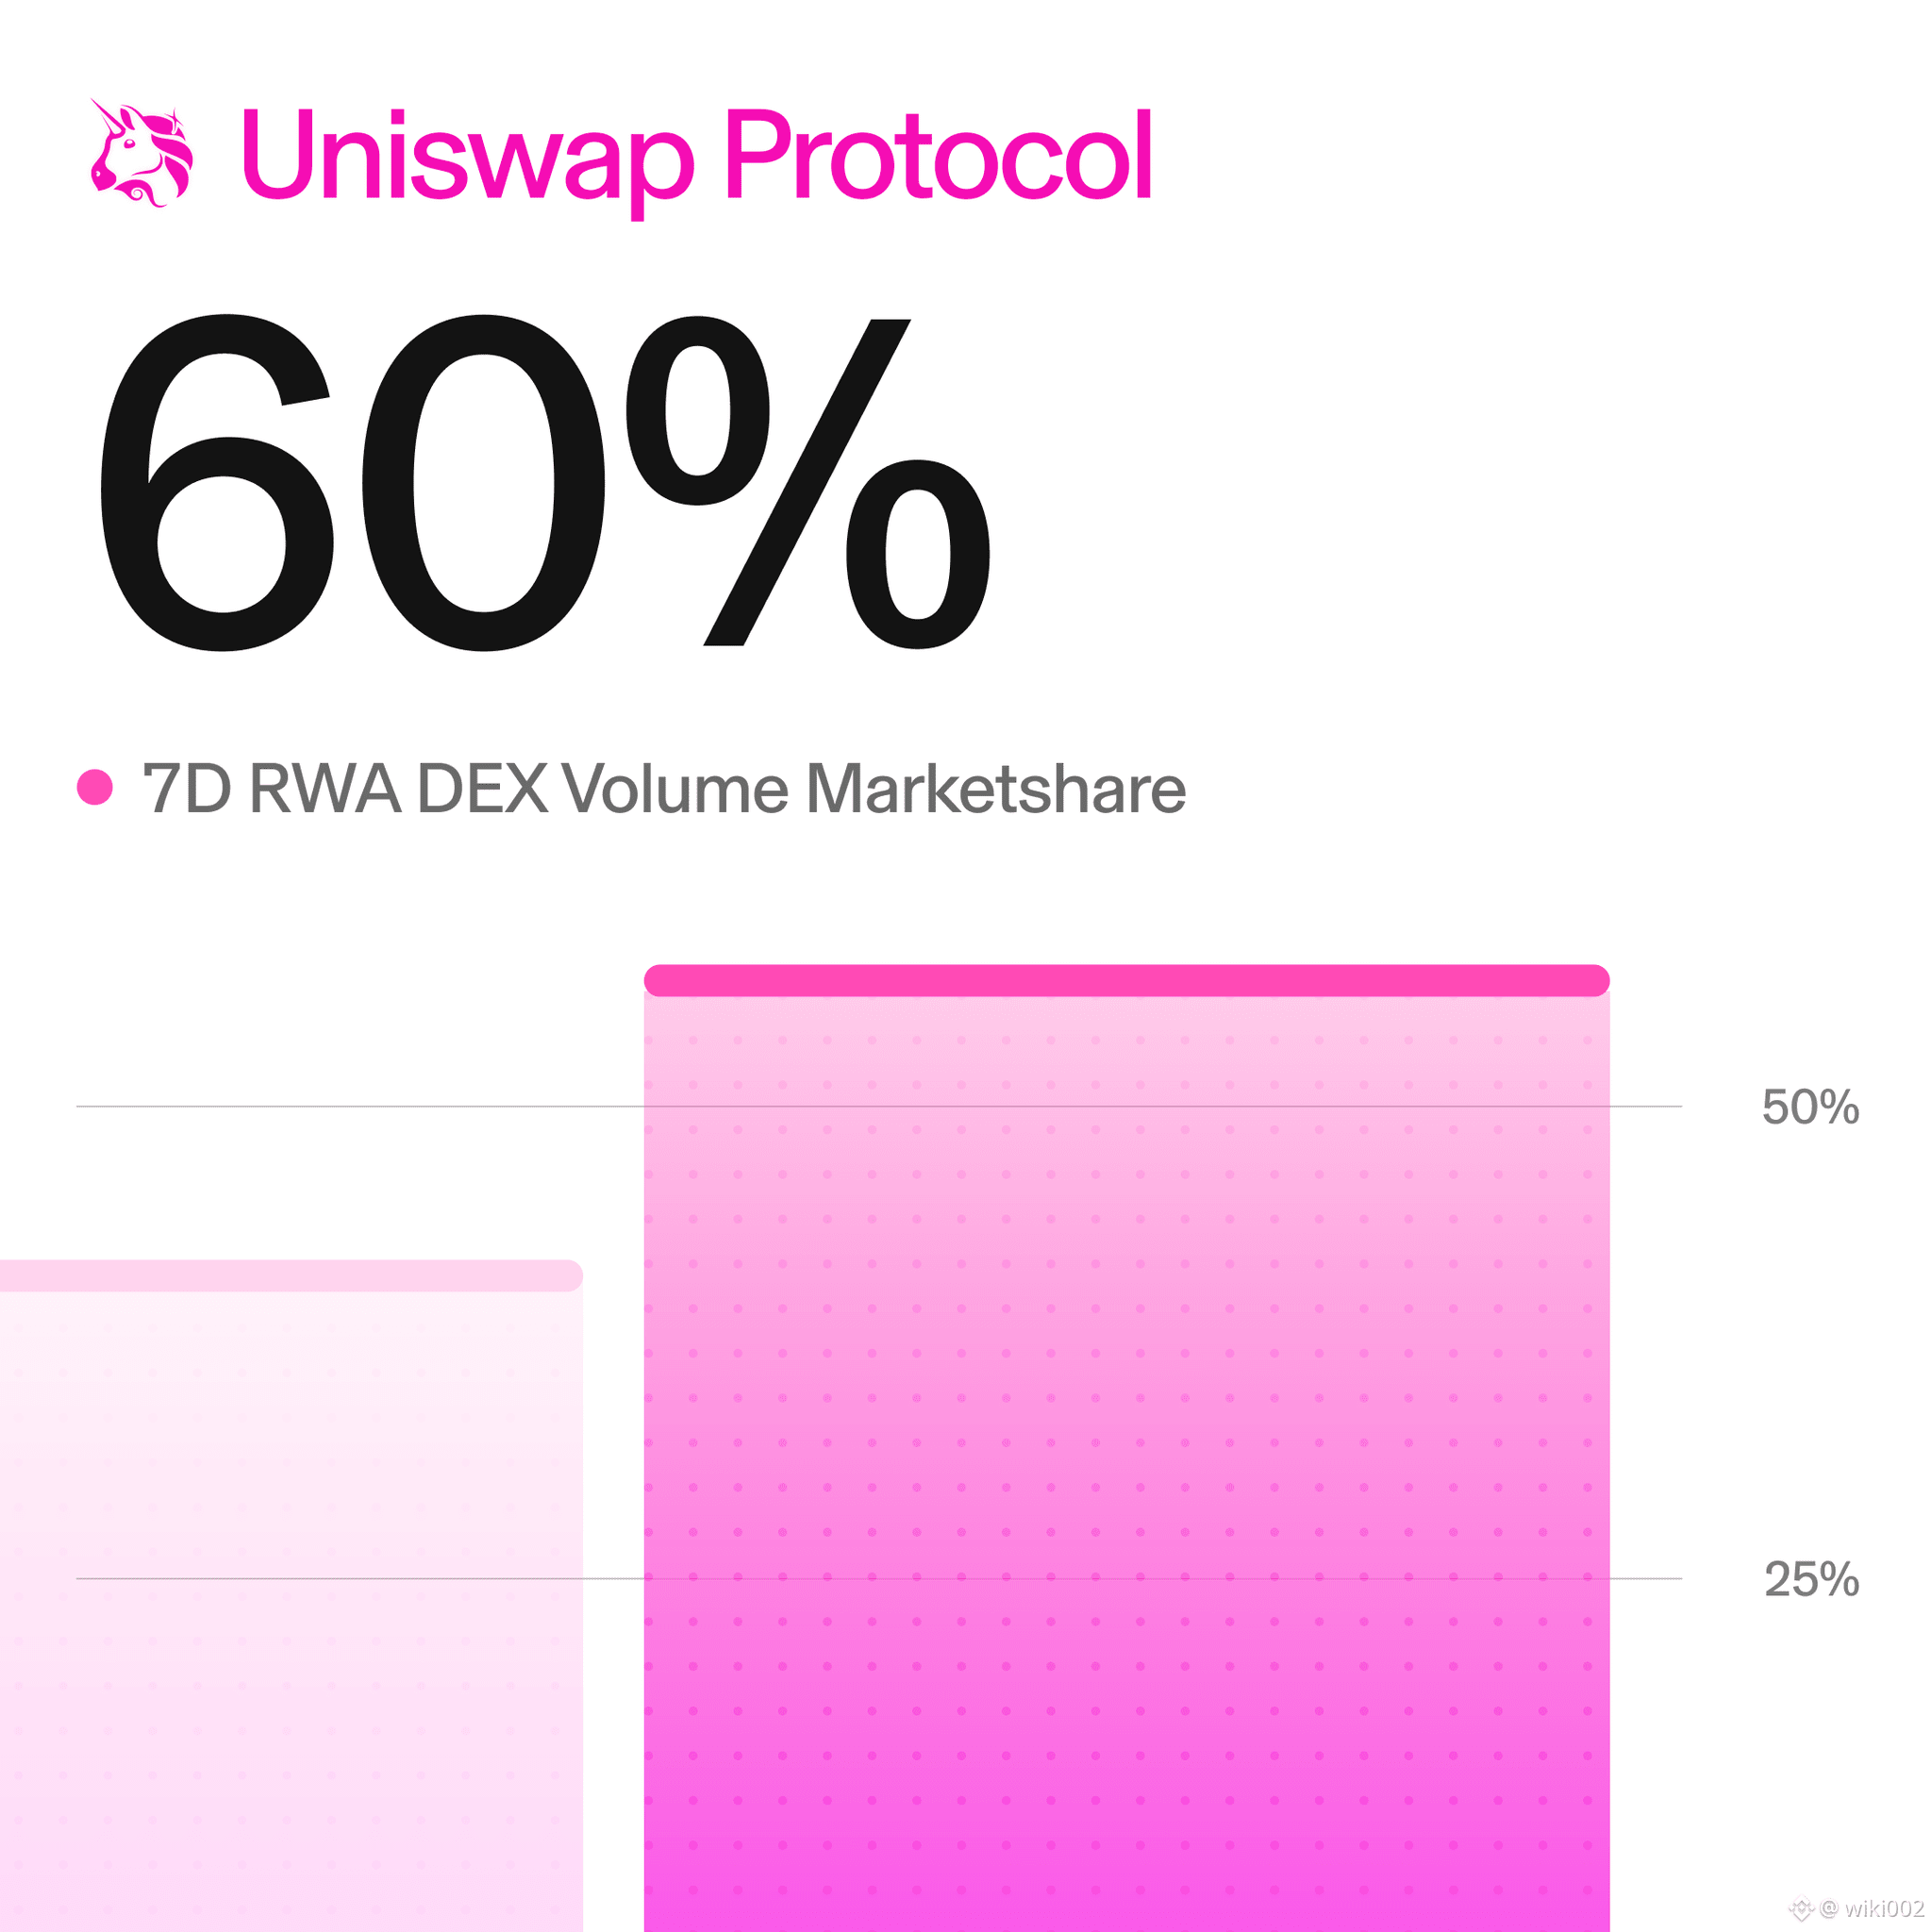
The bigger RWA shift isn’t tokenization. It’s where the liquidity is forming.
Last week, 60%+ of all RWA DEX volume ran through Uniswap, up from 40% the week before.
To me, that signals something more important than a single weekly volume jump.
RWA markets don’t necessarily need to build isolated liquidity venues from scratch. They can increasingly plug into infrastructure that already handles swaps, routing, liquidity and onchain settlement.
That creates a powerful second-order effect. The DeFi liquidity layer can become the distribution layer for Real-world assets.
Instead of creating separate markets for every tokenized asset, issuers can potentially tap into existing liquidity infrastructure and its established trading paths.
But there’s a trade-off.
If RWA activity concentrates heavily around a small number of venues, execution may improve while market participants become more dependent on those liquidity layers.
That’s why I’m watching liquidity structure more closely than tokenization headlines.
The important question is no longer just how much Real-world value comes onchain.
It’s whether that value can develop deep, composable markets once it gets there. 🔗
#RWA #DeFi #Uniswap #Tokenization
$UNI $LINK $AAVE
Last week, 60%+ of all RWA DEX volume ran through Uniswap, up from 40% the week before.
To me, that signals something more important than a single weekly volume jump.
RWA markets don’t necessarily need to build isolated liquidity venues from scratch. They can increasingly plug into infrastructure that already handles swaps, routing, liquidity and onchain settlement.
That creates a powerful second-order effect. The DeFi liquidity layer can become the distribution layer for Real-world assets.
Instead of creating separate markets for every tokenized asset, issuers can potentially tap into existing liquidity infrastructure and its established trading paths.
But there’s a trade-off.
If RWA activity concentrates heavily around a small number of venues, execution may improve while market participants become more dependent on those liquidity layers.
That’s why I’m watching liquidity structure more closely than tokenization headlines.
The important question is no longer just how much Real-world value comes onchain.
It’s whether that value can develop deep, composable markets once it gets there. 🔗
#RWA #DeFi #Uniswap #Tokenization
$UNI $LINK $AAVE
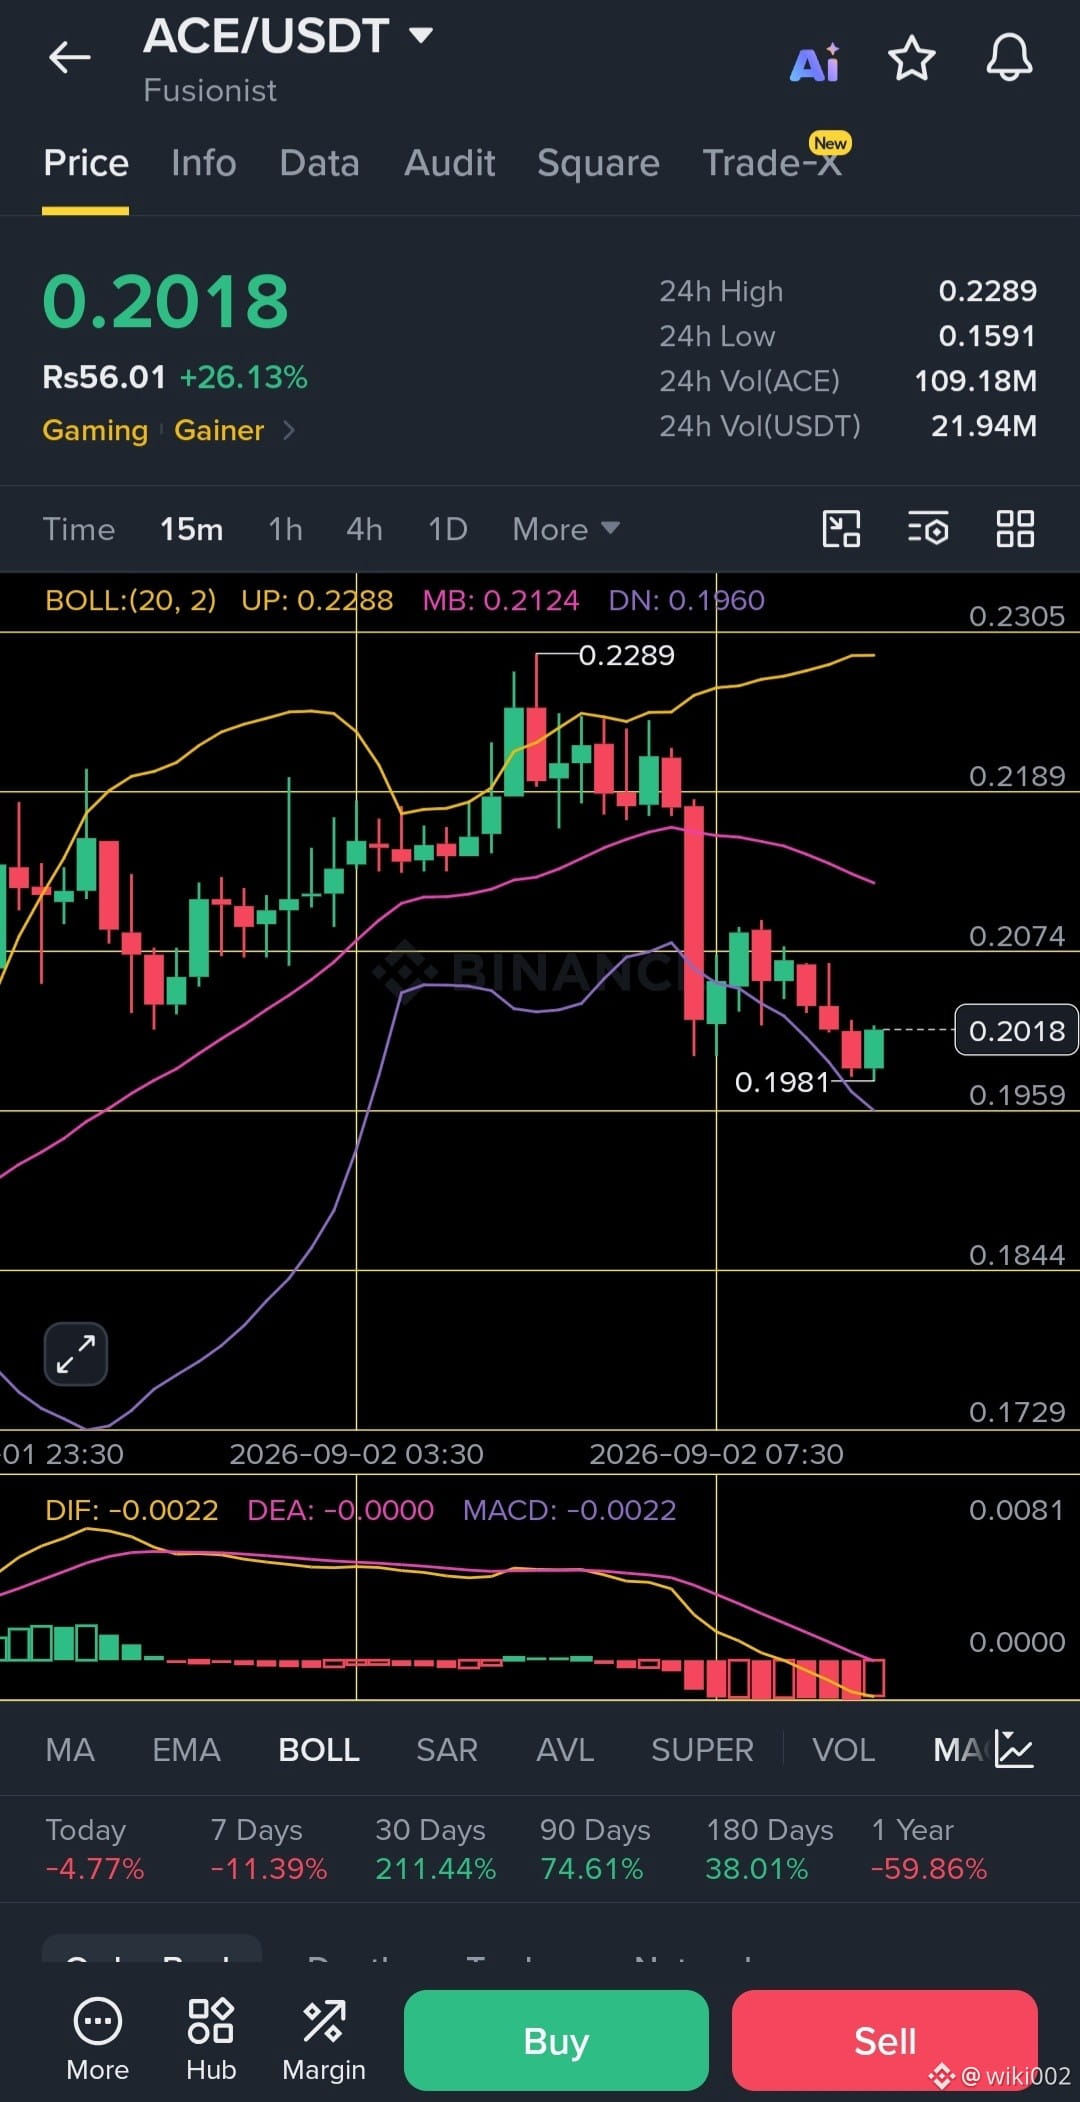
ACE/USDT 📊
Bias: SHORT / Sell
Entry: 0.2018–0.2040
TP1: 0.1981
TP2: 0.1960
TP3: 0.1844
Stop Loss: 0.2078
Technical view: Price remains below the Bollinger mid-band at 0.2124, while MACD is still bearish. The recent bounce looks weak unless ACE reclaims 0.2078 with strength.
Risk management matters don’t overleverage.
#ACE #USDT #CryptoTrading #Binance
$ACE $FF $FIL
Bias: SHORT / Sell
Entry: 0.2018–0.2040
TP1: 0.1981
TP2: 0.1960
TP3: 0.1844
Stop Loss: 0.2078
Technical view: Price remains below the Bollinger mid-band at 0.2124, while MACD is still bearish. The recent bounce looks weak unless ACE reclaims 0.2078 with strength.
Risk management matters don’t overleverage.
#ACE #USDT #CryptoTrading #Binance
$ACE $FF $FIL
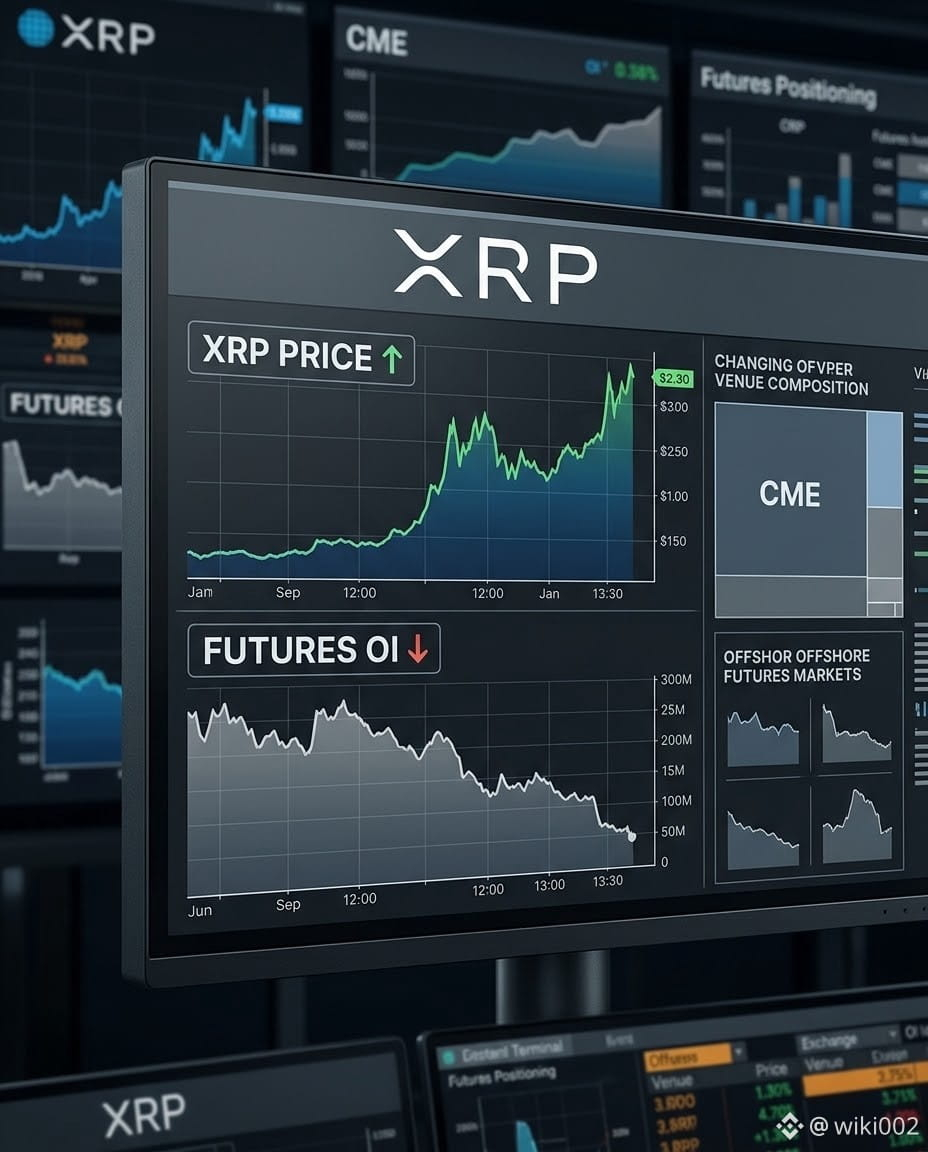
XRP’s rally gets more interesting when price and futures OI start moving in opposite directions.
From Aug. 17 to Aug. 31, XRP moved from roughly $0.99 to $1.38, while total futures OI fell from 2.77B to 2.34B XRP. That’s nearly a 40% price gain with about 16% less aggregate futures OI.
My first reaction was simple. If traders are taking on less futures exposure, what is
actually pushing the price higher?
The venue breakdown gives a better clue.
CME XRP futures OI increased from about 284M to 387M XRP, taking CME’s share of total futures OI from roughly 10% to 17%. Meanwhile, XRP futures OI outside CME fell by about 533M XRP, or 21%.
So looking only at total OI misses an important part of the picture. The amount of OI changed, but so did where that OI was held.
That doesn’t prove institutions are bullish, and it doesn’t tell us why traders shifted exposure. It simply shows that the futures market became more concentrated toward CME during the rally.
CFTC positioning adds another layer. Leveraged funds were net short roughly 116M XRP-equivalent, while dealers and asset managers were net long. Those positions can include hedges, so I wouldn’t treat the short figure as a straightforward bearish bet.
This is why I’m less interested in asking whether OI is rising or falling.
I want to see whether XRP can keep its gains without needing another big expansion in futures leverage.
If spot demand continues to support price while aggregate leverage stays controlled, that would be a much stronger signal than simply seeing OI climb alongside price.
That’s the part of this rally I’m watching now. 🔎
$XRP $SUI $NEAR #XRP
#XRPRises40%InTwoWeeksAsOpenInterestFalls
From Aug. 17 to Aug. 31, XRP moved from roughly $0.99 to $1.38, while total futures OI fell from 2.77B to 2.34B XRP. That’s nearly a 40% price gain with about 16% less aggregate futures OI.
My first reaction was simple. If traders are taking on less futures exposure, what is
actually pushing the price higher?
The venue breakdown gives a better clue.
CME XRP futures OI increased from about 284M to 387M XRP, taking CME’s share of total futures OI from roughly 10% to 17%. Meanwhile, XRP futures OI outside CME fell by about 533M XRP, or 21%.
So looking only at total OI misses an important part of the picture. The amount of OI changed, but so did where that OI was held.
That doesn’t prove institutions are bullish, and it doesn’t tell us why traders shifted exposure. It simply shows that the futures market became more concentrated toward CME during the rally.
CFTC positioning adds another layer. Leveraged funds were net short roughly 116M XRP-equivalent, while dealers and asset managers were net long. Those positions can include hedges, so I wouldn’t treat the short figure as a straightforward bearish bet.
This is why I’m less interested in asking whether OI is rising or falling.
I want to see whether XRP can keep its gains without needing another big expansion in futures leverage.
If spot demand continues to support price while aggregate leverage stays controlled, that would be a much stronger signal than simply seeing OI climb alongside price.
That’s the part of this rally I’m watching now. 🔎
$XRP $SUI $NEAR #XRP
#XRPRises40%InTwoWeeksAsOpenInterestFalls
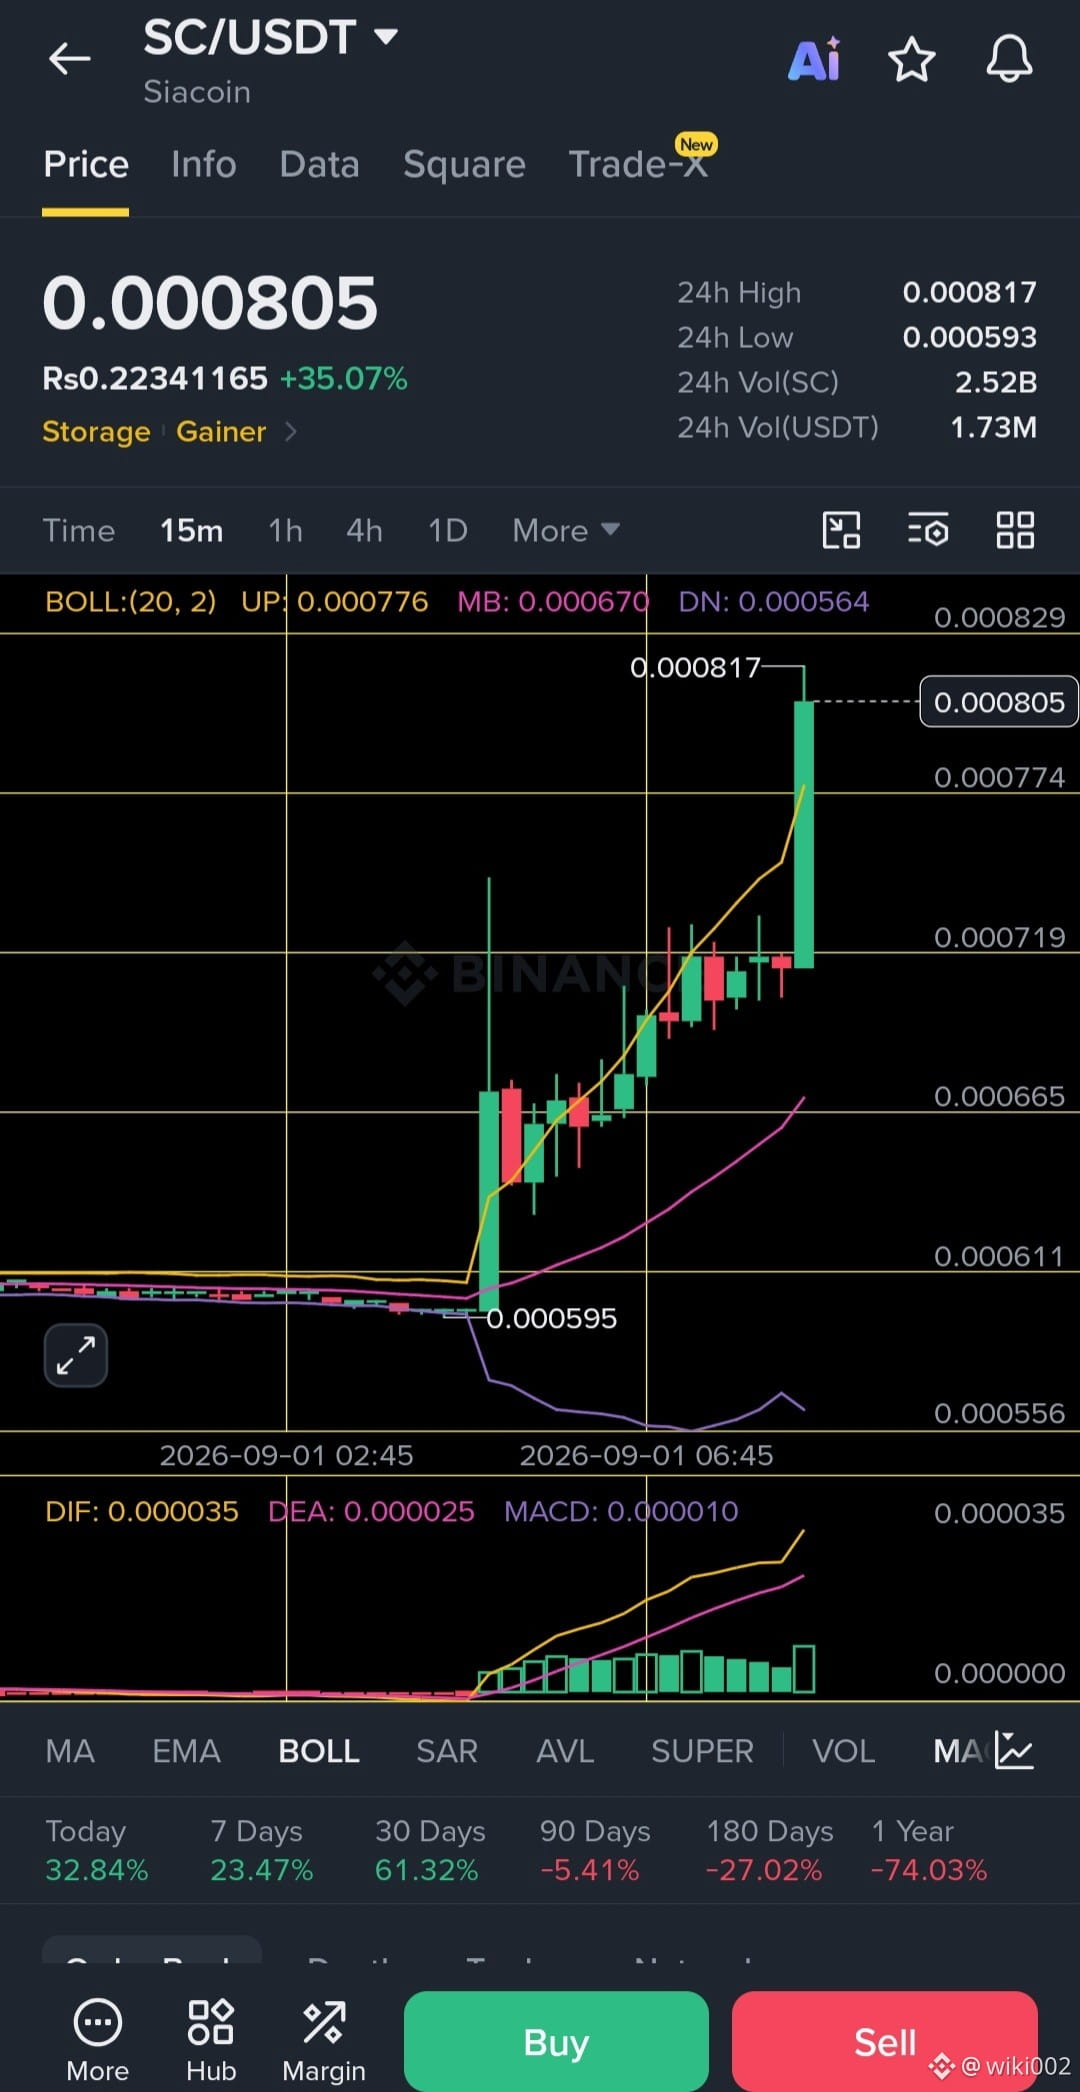
📈 SC/USDT — Bullish Breakout Signal
Entry: 0.000775 – 0.000795
Targets: 0.000817 → 0.000850 → 0.000900
Invalidation: Below 0.000755
SC has broken above the key 0.000774 resistance with strong momentum and rising MACD. A controlled retest of the breakout zone would offer a cleaner entry than chasing the current spike.
Trade smart. Manage risk.
$SC $ARB $OG #SC #Siacoin #CryptoTrading #Altcoins
Entry: 0.000775 – 0.000795
Targets: 0.000817 → 0.000850 → 0.000900
Invalidation: Below 0.000755
SC has broken above the key 0.000774 resistance with strong momentum and rising MACD. A controlled retest of the breakout zone would offer a cleaner entry than chasing the current spike.
Trade smart. Manage risk.
$SC $ARB $OG #SC #Siacoin #CryptoTrading #Altcoins
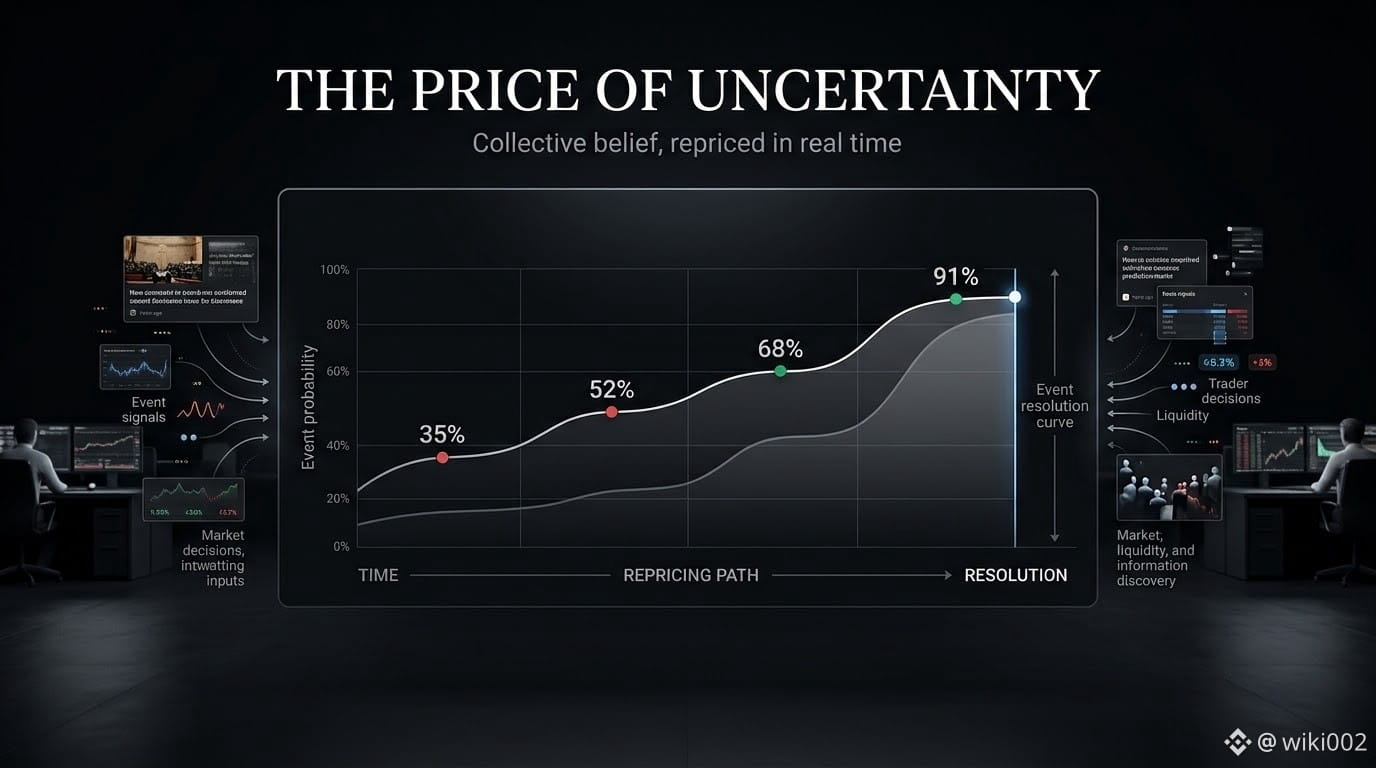
I think Polymarket’s bigger opportunity isn’t predicting events. It’s turning uncertainty into a piece of market infrastructure.
What I find genuinely interesting is the information that exists before the final outcome.
Imagine a market sitting at 35%, then moving to 52%, 68% and eventually 91%. The final result gives you one data point, right or wrong.
The repricing path gives you much more.
It shows when collective expectations changed, how quickly they changed, and how strongly the market reacted as new evidence arrived.
That creates a Second-order use case I rarely see discussed: prediction markets can potentially become datasets for studying how information propagates through markets.
Not just what happened, but how belief changed before it happened.
Of course, I wouldn’t assume every move represents genuine information. Liquidity shocks, concentrated positions, temporary order flow and market design can all distort the signal. Resolution quality matters too.
But that’s precisely why the market history becomes interesting.
If Polymarket can maintain sufficiently liquid, Well-defined markets, its archive could become more than a collection of resolved predictions. It could capture the evolution of market expectations across elections, crypto events, technology, sports and breaking news.
That changes how I think about @Polymarket
The obvious product is the probability.
The less obvious product may be the time series of collective belief behind that probability.
And that dataset could eventually be useful even after the original question has been resolved. 📊
#Polymarket #PredictionMarkets #Crypto #Web3 $POLYX $ETH $BTC
What I find genuinely interesting is the information that exists before the final outcome.
Imagine a market sitting at 35%, then moving to 52%, 68% and eventually 91%. The final result gives you one data point, right or wrong.
The repricing path gives you much more.
It shows when collective expectations changed, how quickly they changed, and how strongly the market reacted as new evidence arrived.
That creates a Second-order use case I rarely see discussed: prediction markets can potentially become datasets for studying how information propagates through markets.
Not just what happened, but how belief changed before it happened.
Of course, I wouldn’t assume every move represents genuine information. Liquidity shocks, concentrated positions, temporary order flow and market design can all distort the signal. Resolution quality matters too.
But that’s precisely why the market history becomes interesting.
If Polymarket can maintain sufficiently liquid, Well-defined markets, its archive could become more than a collection of resolved predictions. It could capture the evolution of market expectations across elections, crypto events, technology, sports and breaking news.
That changes how I think about @Polymarket
The obvious product is the probability.
The less obvious product may be the time series of collective belief behind that probability.
And that dataset could eventually be useful even after the original question has been resolved. 📊
#Polymarket #PredictionMarkets #Crypto #Web3 $POLYX $ETH $BTC
Verified
Chainlink Adoption Update 🔗
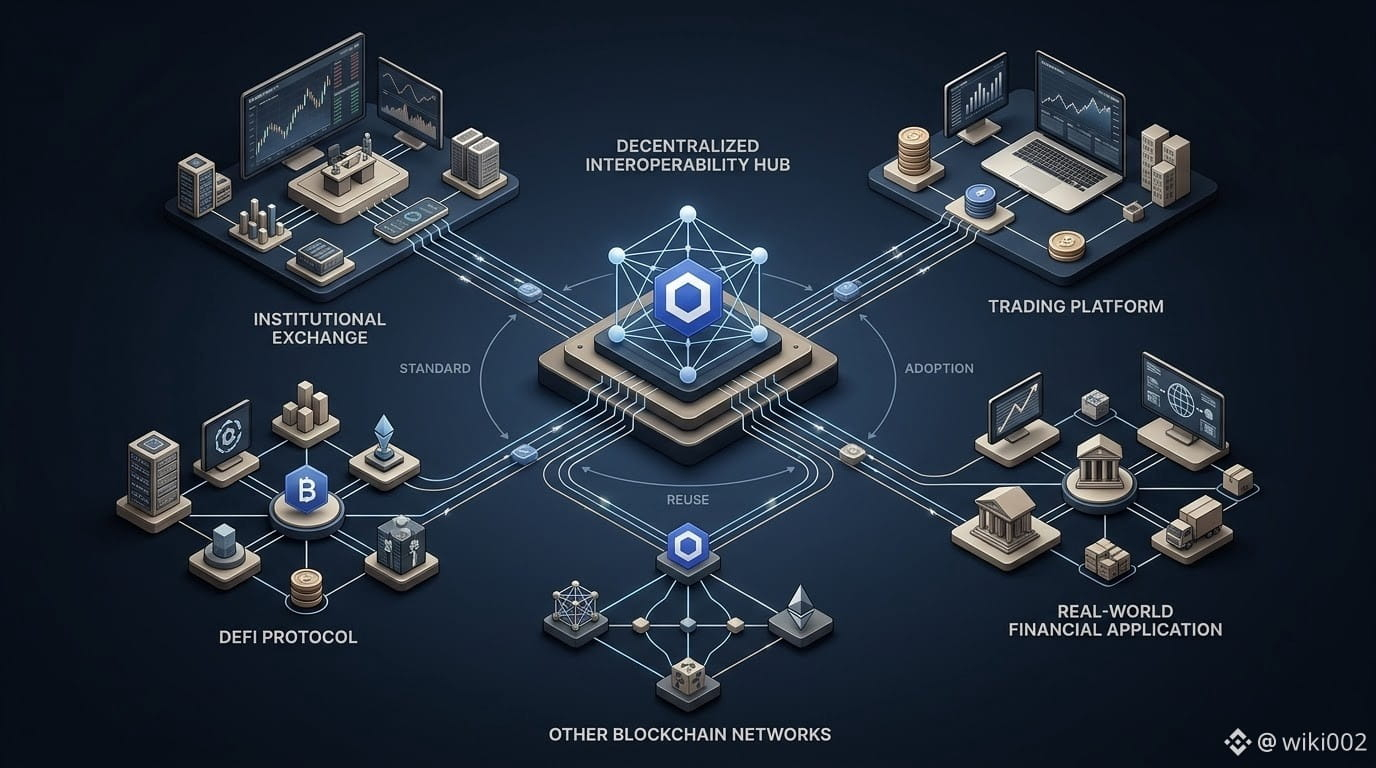
To be honest, I keep coming back to one detail in Chainlink’s latest update. It’s not just the number of integrations, but the variety of places where the same standard is being used.
There were 9 integrations across 5 services and 5 different chains, including @Coinbase, @generaltensor, @Herd_Finance, @kpk_io, @Lighter_xyz, @metricxyz, @NUVAFinance, and @RobinhoodCrypto.
What I find interesting is what happens when a standard gets reused repeatedly.
A developer doesn’t necessarily need to approach every new integration as a completely separate infrastructure problem. Familiar interfaces, established tooling and existing implementation patterns can make a standard easier to work with over time.
I mean, that doesn’t mean nine integrations have created a network effect already. The announcement alone can’t prove that.
But it does create something worth watching. A growing base of implementations that could make the standard increasingly familiar to developers across different ecosystems.
Basically, I’d pay more attention to that compounding effect than to partnership counts.
If developers start choosing Chainlink’s standard partly because other applications already use it, could adoption itself become one of the strongest reasons for the next integration? 🧠
#Chainlink #LINK #DeFi #Web3
$LINK $HEMI $ZK
To be honest, I keep coming back to one detail in Chainlink’s latest update. It’s not just the number of integrations, but the variety of places where the same standard is being used.
There were 9 integrations across 5 services and 5 different chains, including @Coinbase, @generaltensor, @Herd_Finance, @kpk_io, @Lighter_xyz, @metricxyz, @NUVAFinance, and @RobinhoodCrypto.
What I find interesting is what happens when a standard gets reused repeatedly.
A developer doesn’t necessarily need to approach every new integration as a completely separate infrastructure problem. Familiar interfaces, established tooling and existing implementation patterns can make a standard easier to work with over time.
I mean, that doesn’t mean nine integrations have created a network effect already. The announcement alone can’t prove that.
But it does create something worth watching. A growing base of implementations that could make the standard increasingly familiar to developers across different ecosystems.
Basically, I’d pay more attention to that compounding effect than to partnership counts.
If developers start choosing Chainlink’s standard partly because other applications already use it, could adoption itself become one of the strongest reasons for the next integration? 🧠
#Chainlink #LINK #DeFi #Web3
$LINK $HEMI $ZK
Look, BNB Chain leading in tokenized equity supply is interesting, but the supply number itself isn’t the part I care about most.
BNB Chain’s tokenized equities grew from about $34M at the start of 2026 to $652M in July, putting it ahead of Ethereum and close to a third of the On-chain total. Tokenized stock trading volume also passed $4.5B in July.
What I’m watching now is what happens after the stocks are issued.
If more equity supply brings in more liquidity, those assets become easier to trade. If that liquidity becomes deep enough, the tokens can become useful as collateral. Then capital can move into lending, liquidity provision and other financial applications.
That’s the flywheel I find more interesting.
equity supply → liquidity → collateral utility → capital efficiency → more financial activity.
And this is where BNB Chain’s lead could become meaningful. It isn’t just about having more tokenized stocks, it’s about whether those assets can actually plug into the financial infrastructure already being built around them.
But I wouldn’t confuse issuance with adoption.
The real test is secondary-market liquidity, collateral mobility and whether people actually use these assets instead of simply holding them. Binance Research makes essentially the same distinction. The next phase depends on whether secondary liquidity and collateral mobility grow as quickly as primary issuance.
For me, that’s the bigger lesson, the winning tokenization chain won’t necessarily be the one that issues the most assets. It will be the one that makes those assets useful after issuance. 🧩
#BNBChain #BNB #ASTER #CAKE
$BNB $ASTER $CAKE
BNB Chain’s tokenized equities grew from about $34M at the start of 2026 to $652M in July, putting it ahead of Ethereum and close to a third of the On-chain total. Tokenized stock trading volume also passed $4.5B in July.
What I’m watching now is what happens after the stocks are issued.
If more equity supply brings in more liquidity, those assets become easier to trade. If that liquidity becomes deep enough, the tokens can become useful as collateral. Then capital can move into lending, liquidity provision and other financial applications.
That’s the flywheel I find more interesting.
equity supply → liquidity → collateral utility → capital efficiency → more financial activity.
And this is where BNB Chain’s lead could become meaningful. It isn’t just about having more tokenized stocks, it’s about whether those assets can actually plug into the financial infrastructure already being built around them.
But I wouldn’t confuse issuance with adoption.
The real test is secondary-market liquidity, collateral mobility and whether people actually use these assets instead of simply holding them. Binance Research makes essentially the same distinction. The next phase depends on whether secondary liquidity and collateral mobility grow as quickly as primary issuance.
For me, that’s the bigger lesson, the winning tokenization chain won’t necessarily be the one that issues the most assets. It will be the one that makes those assets useful after issuance. 🧩
#BNBChain #BNB #ASTER #CAKE
$BNB $ASTER $CAKE

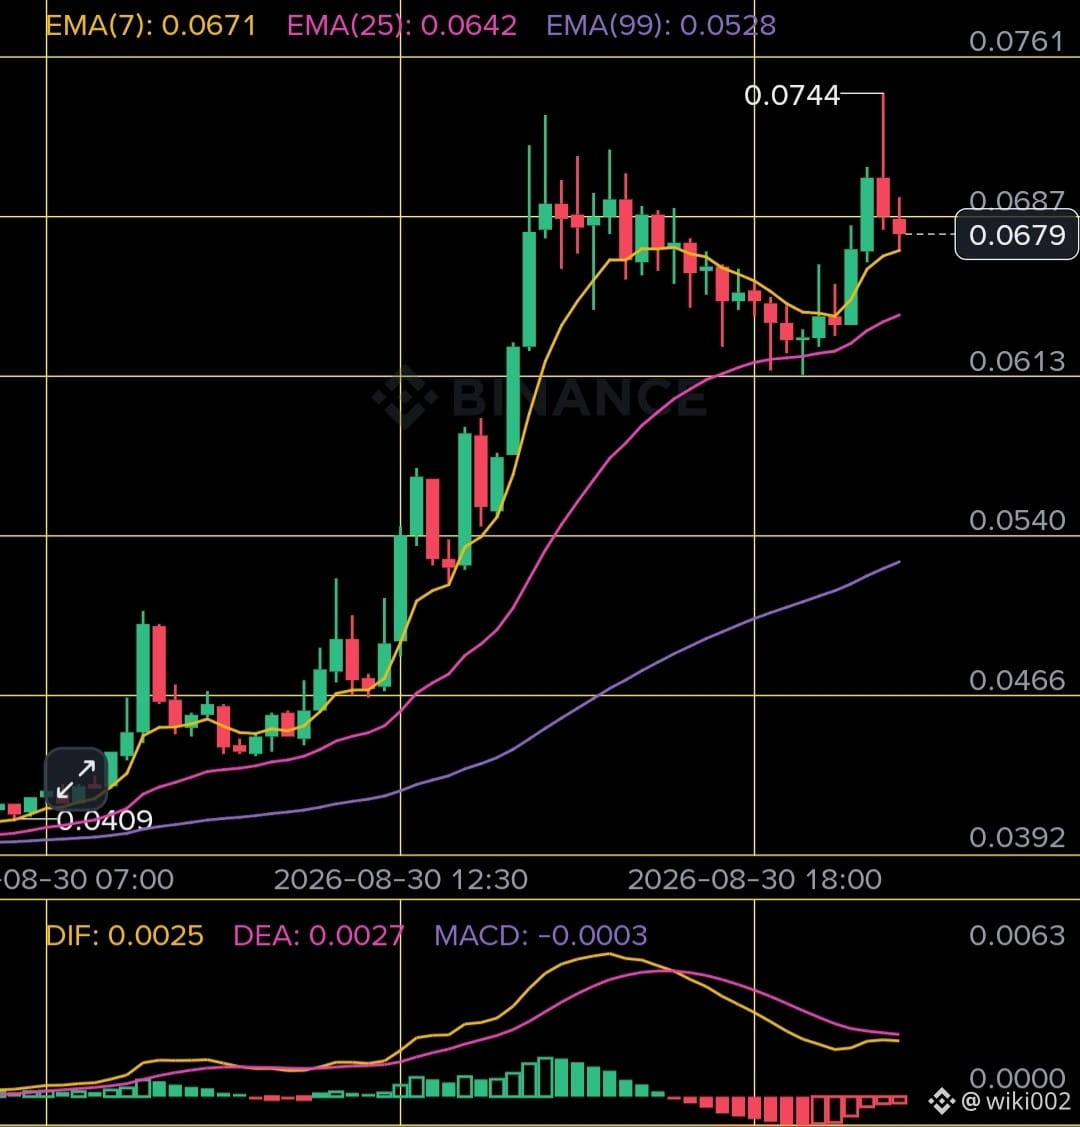
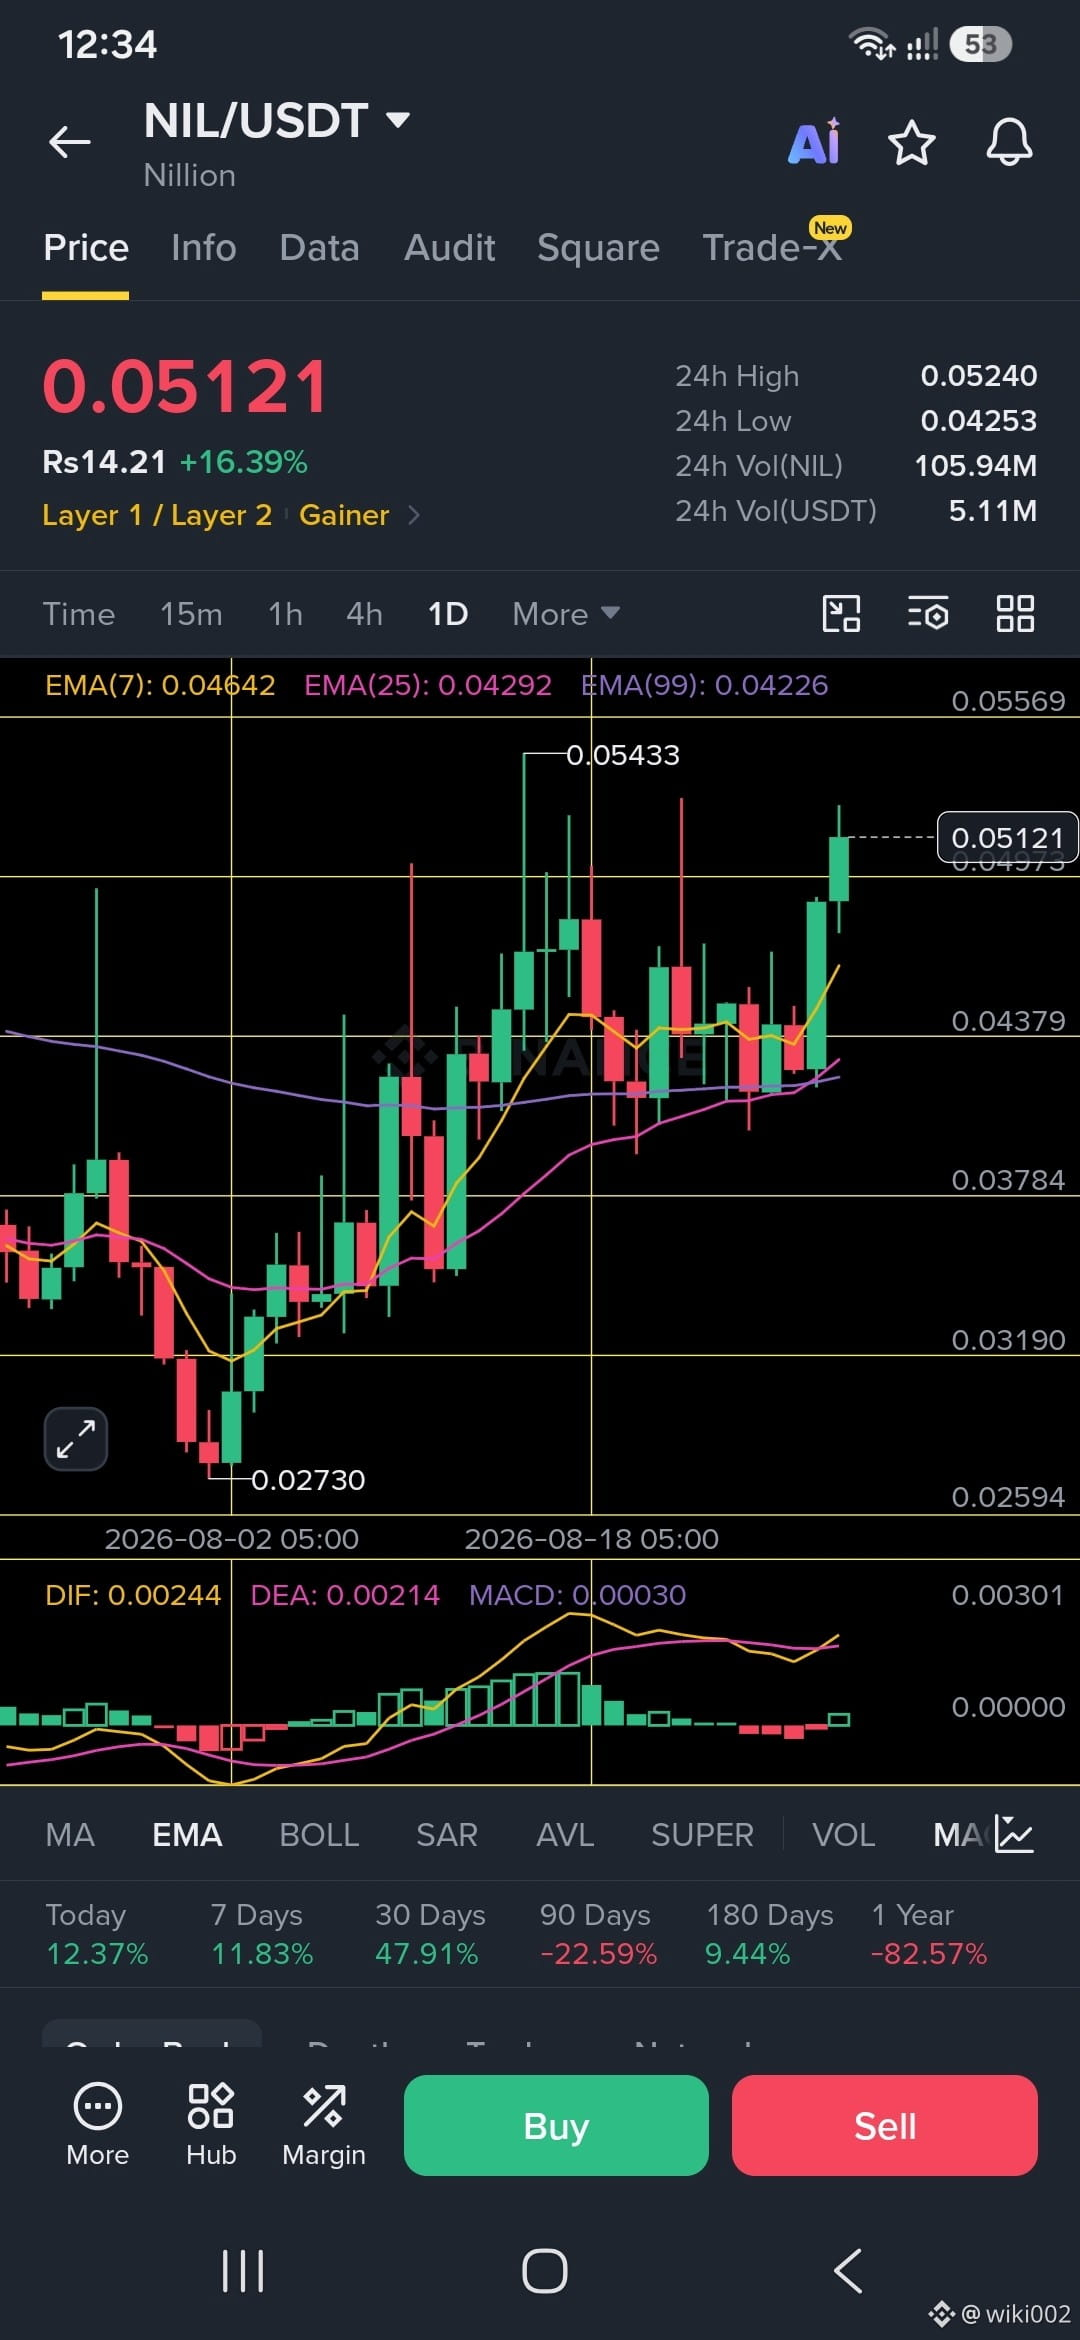
NIL/USDT 📈
Price is holding above the key EMA cluster with momentum turning positive. A sustained move above 0.05240 could open the path toward 0.05433 and potentially 0.05570.
Entry: 0.04980–0.05120
Targets: 0.05240 / 0.05433 / 0.05570
Stop Loss: 0.04780
Invalidation below the support zone weakens the setup. Manage risk and avoid chasing extended candles.
#NIL #Nillion $NIL $ROBO $LSK
Price is holding above the key EMA cluster with momentum turning positive. A sustained move above 0.05240 could open the path toward 0.05433 and potentially 0.05570.
Entry: 0.04980–0.05120
Targets: 0.05240 / 0.05433 / 0.05570
Stop Loss: 0.04780
Invalidation below the support zone weakens the setup. Manage risk and avoid chasing extended candles.
#NIL #Nillion $NIL $ROBO $LSK
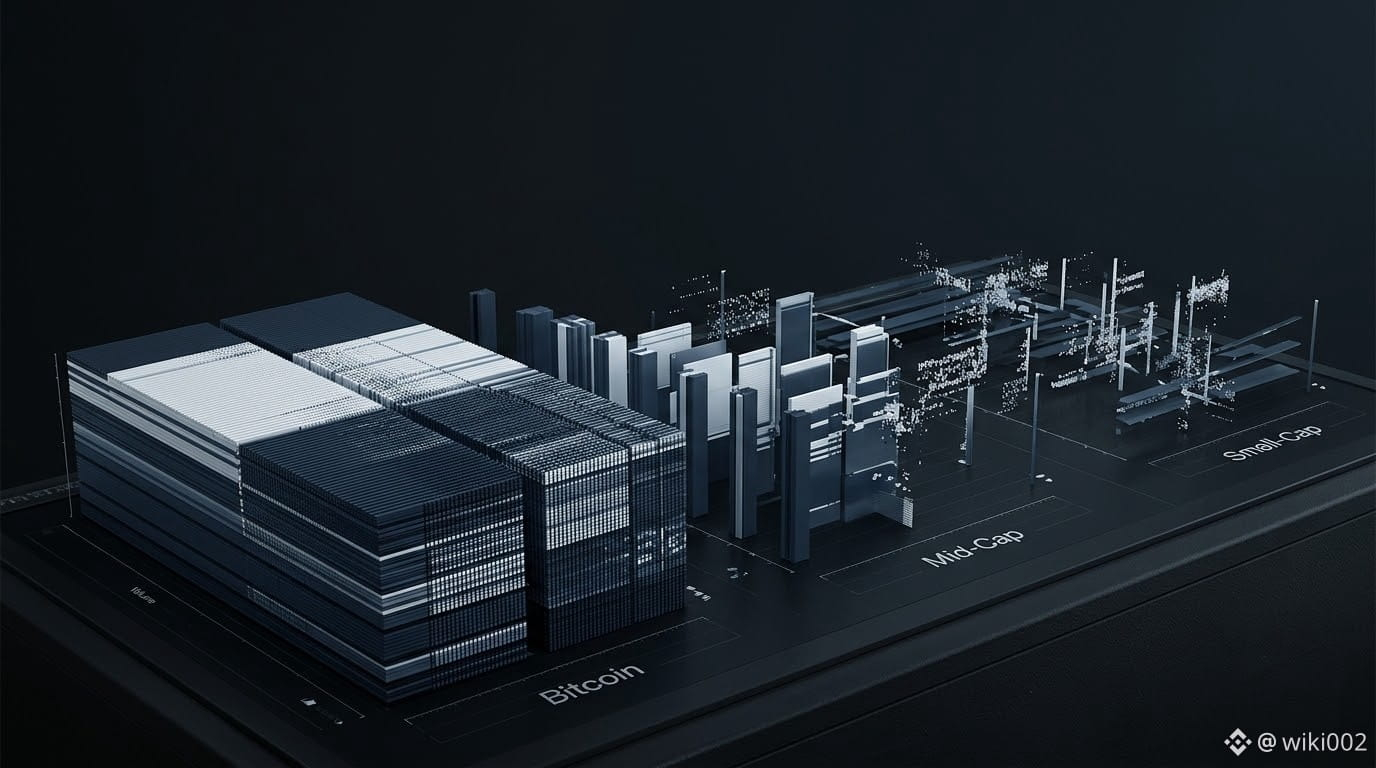
Crypto’s latest selloff is revealing something beyond Bitcoin. liquidity is being repriced unevenly across the market.
The seven-day numbers make that divergence hard to ignore. The Digital Assets 100 Mid Cap Index fell 10.15%, while the Small Cap Index dropped 7.12%. Bitcoin was roughly flat on the weekly view, despite moving from around $81.4K to $77.4K.
I’m less interested in calling this a simple market-wide decline than in what the dispersion tells us about risk transmission.
When risk appetite contracts, selling pressure does not distribute evenly. BTC’s deeper liquidity may help absorb large flows with less price impact, while thinner markets can experience sharper repricing as marginal buyers disappear.
That creates a useful distinction: Bitcoin stability can coexist with deteriorating market breadth.
If BTC stabilizes while mid- and small-caps continue weakening, I would read that as defensive positioning not necessarily a recovery.
But if BTC stabilizes and breadth starts improving afterward, the signal changes. Recovery across mid- and small-caps would suggest liquidity is moving back down the risk curve rather than remaining concentrated in BTC.
That is the relationship I would watch.
A Bitcoin floor matters, but it becomes much more meaningful when stability stops being isolated and starts propagating through the rest of the market. 📉
#Bitcoin #Crypto #BTC
$BTC $BNB $ETH
The seven-day numbers make that divergence hard to ignore. The Digital Assets 100 Mid Cap Index fell 10.15%, while the Small Cap Index dropped 7.12%. Bitcoin was roughly flat on the weekly view, despite moving from around $81.4K to $77.4K.
I’m less interested in calling this a simple market-wide decline than in what the dispersion tells us about risk transmission.
When risk appetite contracts, selling pressure does not distribute evenly. BTC’s deeper liquidity may help absorb large flows with less price impact, while thinner markets can experience sharper repricing as marginal buyers disappear.
That creates a useful distinction: Bitcoin stability can coexist with deteriorating market breadth.
If BTC stabilizes while mid- and small-caps continue weakening, I would read that as defensive positioning not necessarily a recovery.
But if BTC stabilizes and breadth starts improving afterward, the signal changes. Recovery across mid- and small-caps would suggest liquidity is moving back down the risk curve rather than remaining concentrated in BTC.
That is the relationship I would watch.
A Bitcoin floor matters, but it becomes much more meaningful when stability stops being isolated and starts propagating through the rest of the market. 📉
#Bitcoin #Crypto #BTC
$BTC $BNB $ETH
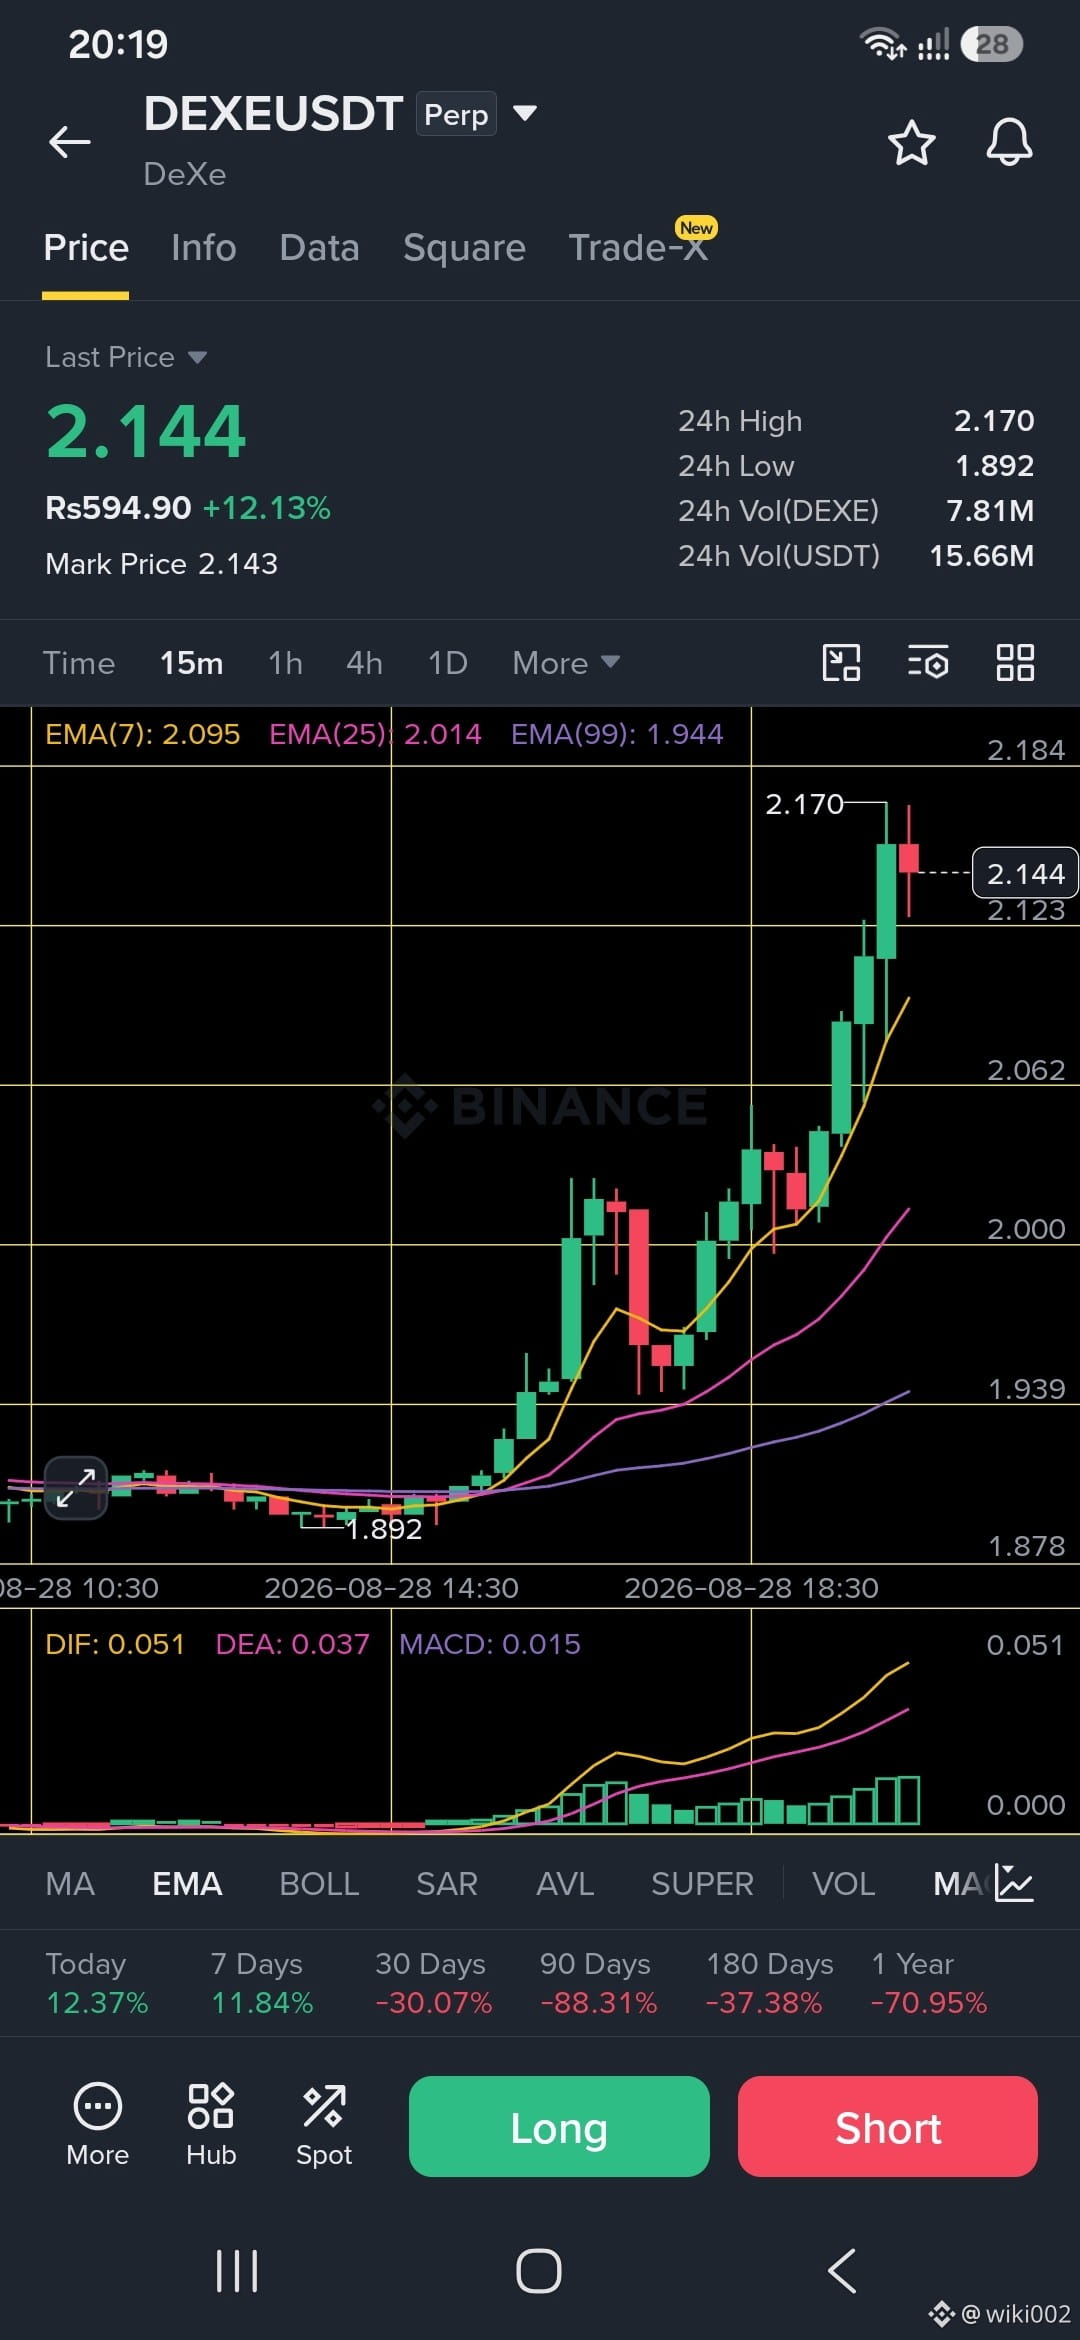
🚨 DEXEUSDT
$DEXE is showing strong bullish momentum with price holding above key EMAs and MACD continuing to expand upward.
Entry: 2.120 – 2.150
Take Profit: 2.170 → 2.250 → 2.350
Stop Loss: 2.050
A clean hold above the breakout zone could keep the upside structure intact. Manage risk and avoid chasing an extended candle.
$DEXE $TST #DEXE #Binance #CryptoTrading #TradingSignal
$DEXE is showing strong bullish momentum with price holding above key EMAs and MACD continuing to expand upward.
Entry: 2.120 – 2.150
Take Profit: 2.170 → 2.250 → 2.350
Stop Loss: 2.050
A clean hold above the breakout zone could keep the upside structure intact. Manage risk and avoid chasing an extended candle.
$DEXE $TST #DEXE #Binance #CryptoTrading #TradingSignal
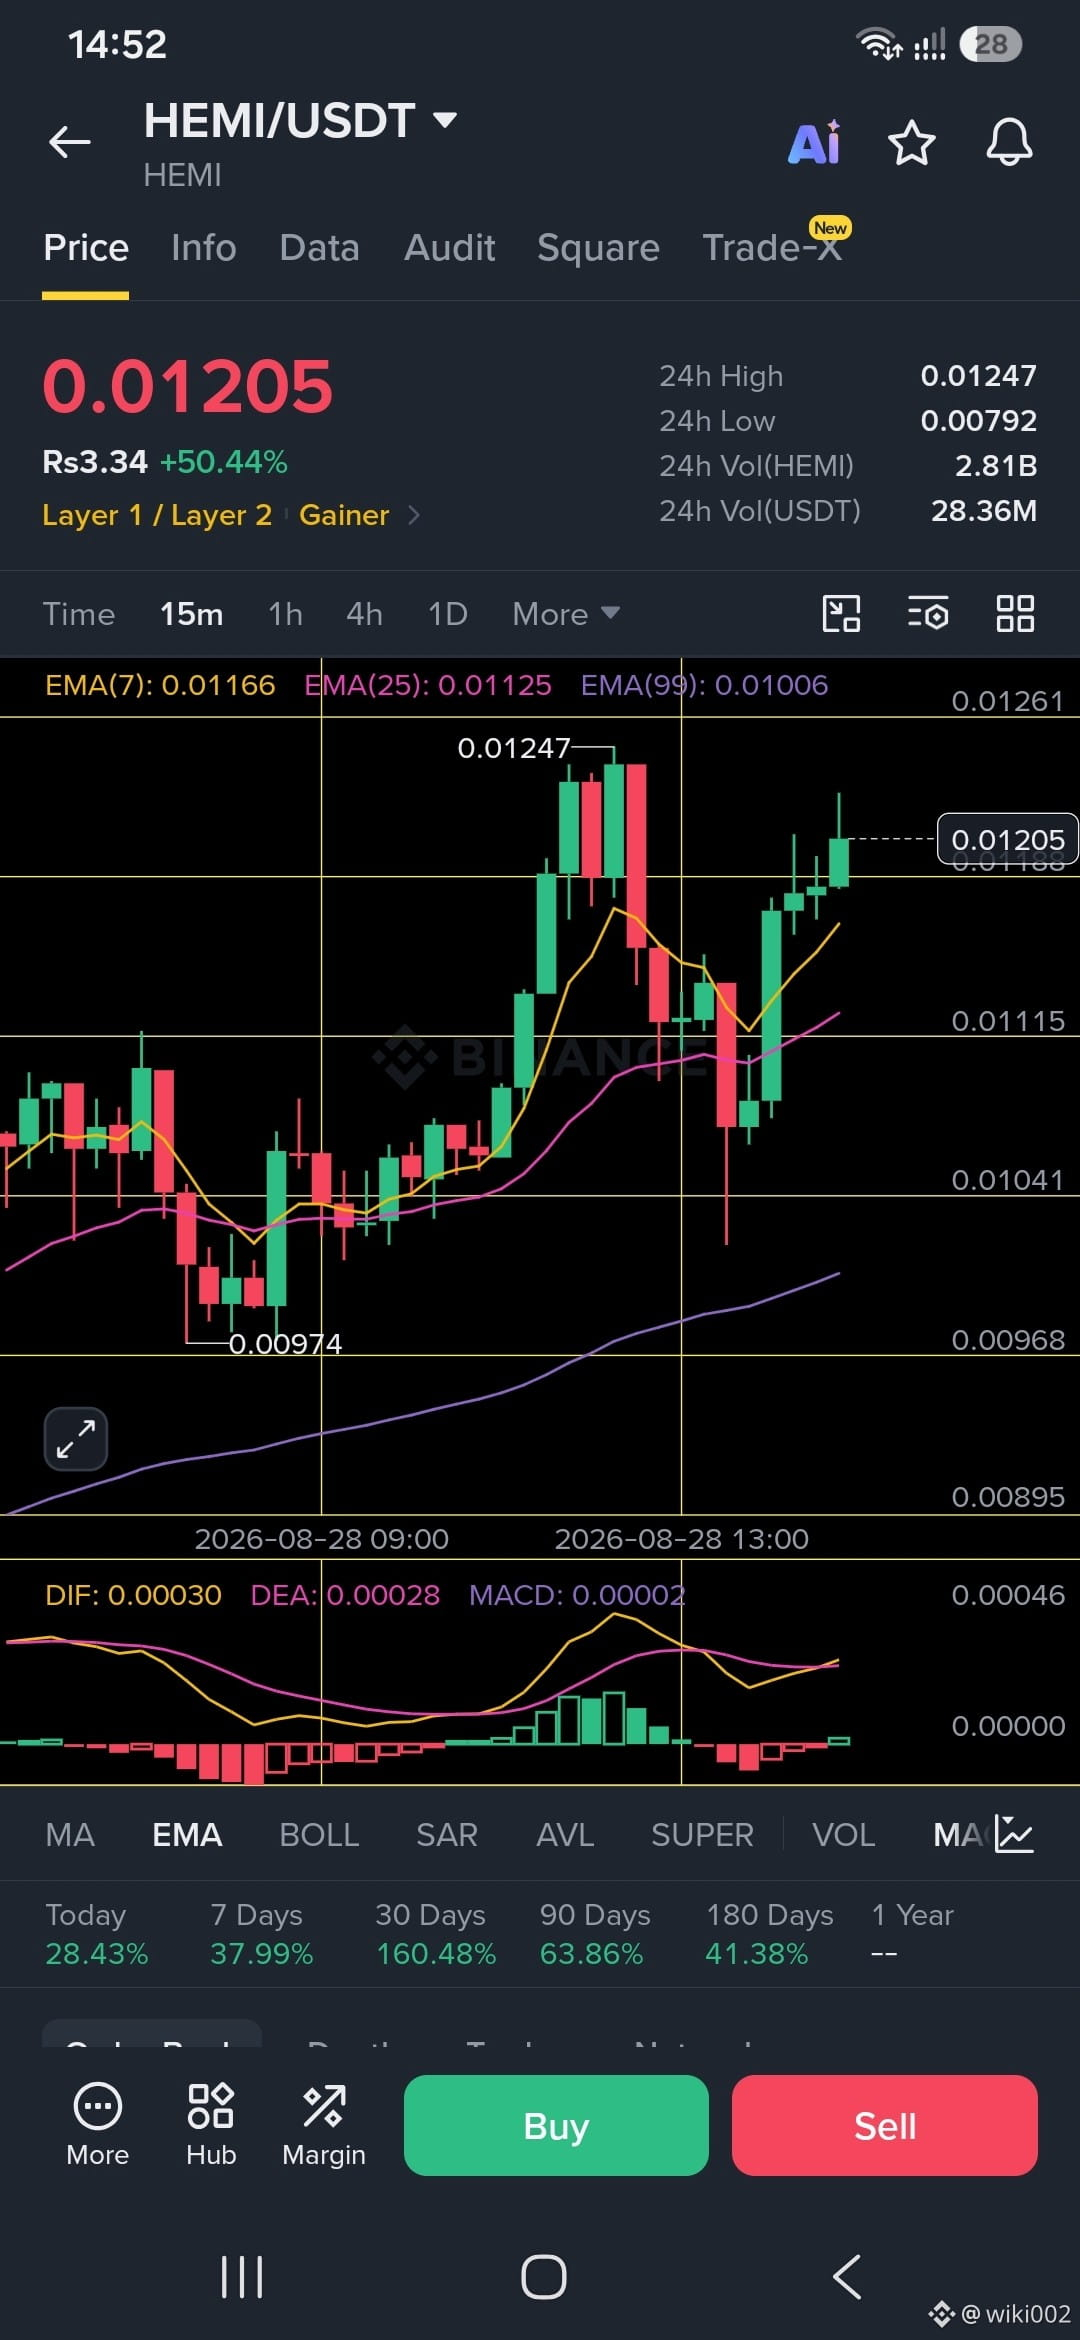
📈 $HEMI / USDT
Hemi is showing bullish structure after reclaiming the key EMA levels. Price is holding above EMA(7), EMA(25) and EMA(99), while MACD momentum is starting to recover.
Signal: LONG 🟢
Entry: 0.01190–0.01210
TP1: 0.01247
TP2: 0.01280
TP3: 0.01320
SL: 0.01145
A clean break above 0.01247 could trigger the next momentum leg. As long as the Short-term EMA structure remains intact, buyers still have control.
#HEMI #Crypto #Trading $EDEN $TRUMP
Hemi is showing bullish structure after reclaiming the key EMA levels. Price is holding above EMA(7), EMA(25) and EMA(99), while MACD momentum is starting to recover.
Signal: LONG 🟢
Entry: 0.01190–0.01210
TP1: 0.01247
TP2: 0.01280
TP3: 0.01320
SL: 0.01145
A clean break above 0.01247 could trigger the next momentum leg. As long as the Short-term EMA structure remains intact, buyers still have control.
#HEMI #Crypto #Trading $EDEN $TRUMP
Log in to explore more content