
#bard
bard
1.3M views
7,116 Discussing
Hot
Latest

·
--
🔥 $BARD — Short Squeeze or Bull Trap? ⚠️
🔥 $BARD
Lombard ($BARD) is on fire, pumping +36% in 24 hours! 🚀
📊 The Bullish Case: Open Interest is up 52%, and funding rates are deeply negative. Shorts are paying longs, which could fuel a massive short squeeze! 📈
Are you riding the momentum or waiting for the unlock? 👇
#BARD #DeFi #Crypto #BinanceSquare
🔥 $BARD — Short Squeeze or Bull Trap? ⚠️
🔥 $BARD
Lombard ($BARD ) is on fire, pumping +36% in 24 hours! 🚀
📊 The Bullish Case: Open Interest is up 52%, and funding rates are deeply negative. Shorts are paying longs, which could fuel a massive short squeeze! 📈
Are you riding the momentum or waiting for the unlock? 👇
#BARD #DeFi #Crypto #BinanceSquare
🔥 $BARD
Lombard ($BARD ) is on fire, pumping +36% in 24 hours! 🚀
📊 The Bullish Case: Open Interest is up 52%, and funding rates are deeply negative. Shorts are paying longs, which could fuel a massive short squeeze! 📈
Are you riding the momentum or waiting for the unlock? 👇
#BARD #DeFi #Crypto #BinanceSquare
3
388

·
--
Bullish
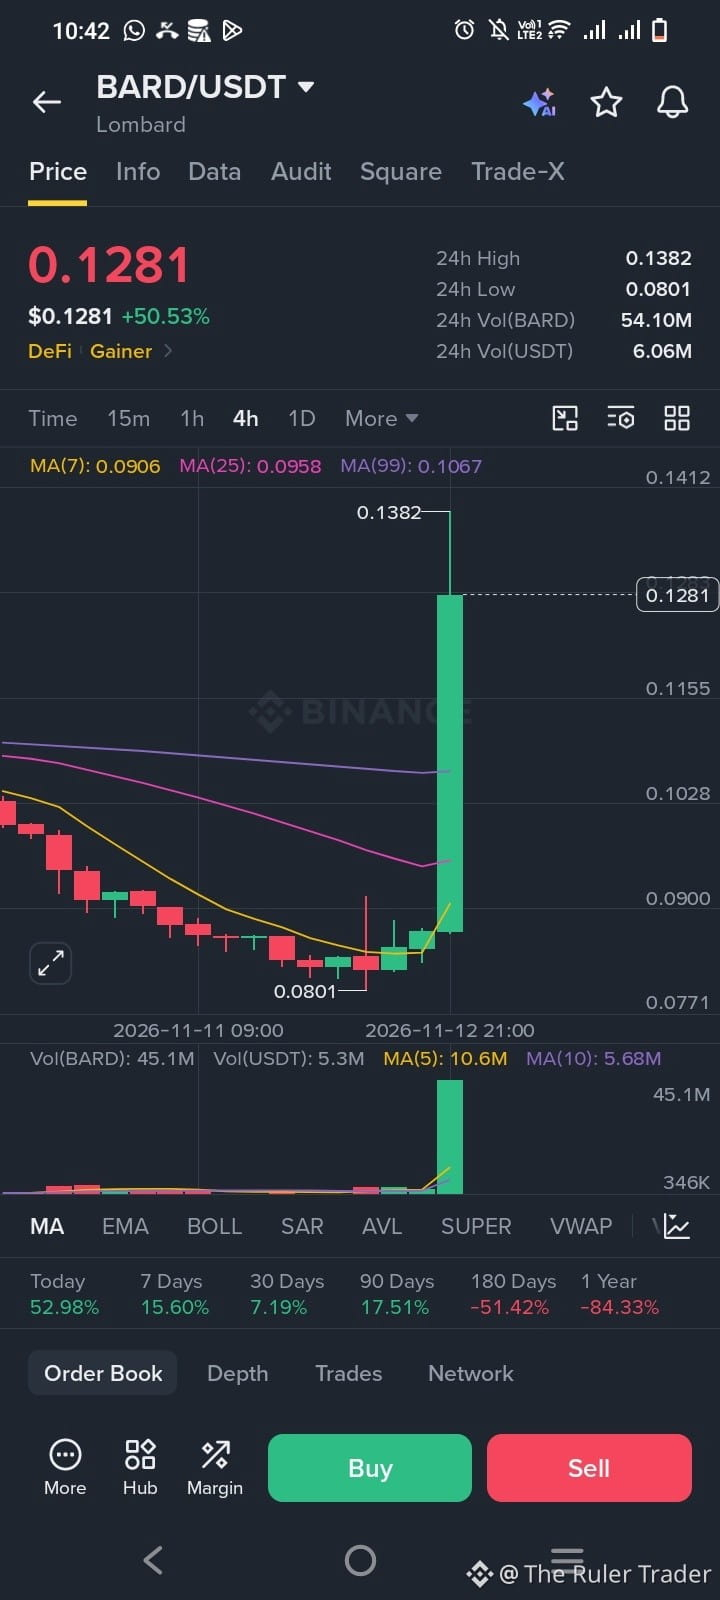
🚀 #Bard is flying! Up 45.6% with a huge green candle and strong buying volume,
⚠️ But after such a sharp pump, a pullback can happen anytime,
Watch $0.138 resistance and $0.115 support, 😂 Don't FOMO at the top let the chart settle before jumping in! $BARD #BARDUSDT #BinanceSquareFamily #CryptoBullRun #crypto2027
{spot}(BARDUSDT)
{spot}(ICPUSDT)
{spot}(AXSUSDT)
🚀 #Bard is flying! Up 45.6% with a huge green candle and strong buying volume,
⚠️ But after such a sharp pump, a pullback can happen anytime,
Watch $0.138 resistance and $0.115 support, 😂 Don't FOMO at the top let the chart settle before jumping in! $BARD #BARDUSDT #BinanceSquareFamily #CryptoBullRun #crypto2027
⚠️ But after such a sharp pump, a pullback can happen anytime,
Watch $0.138 resistance and $0.115 support, 😂 Don't FOMO at the top let the chart settle before jumping in! $BARD #BARDUSDT #BinanceSquareFamily #CryptoBullRun #crypto2027
1
2.1k

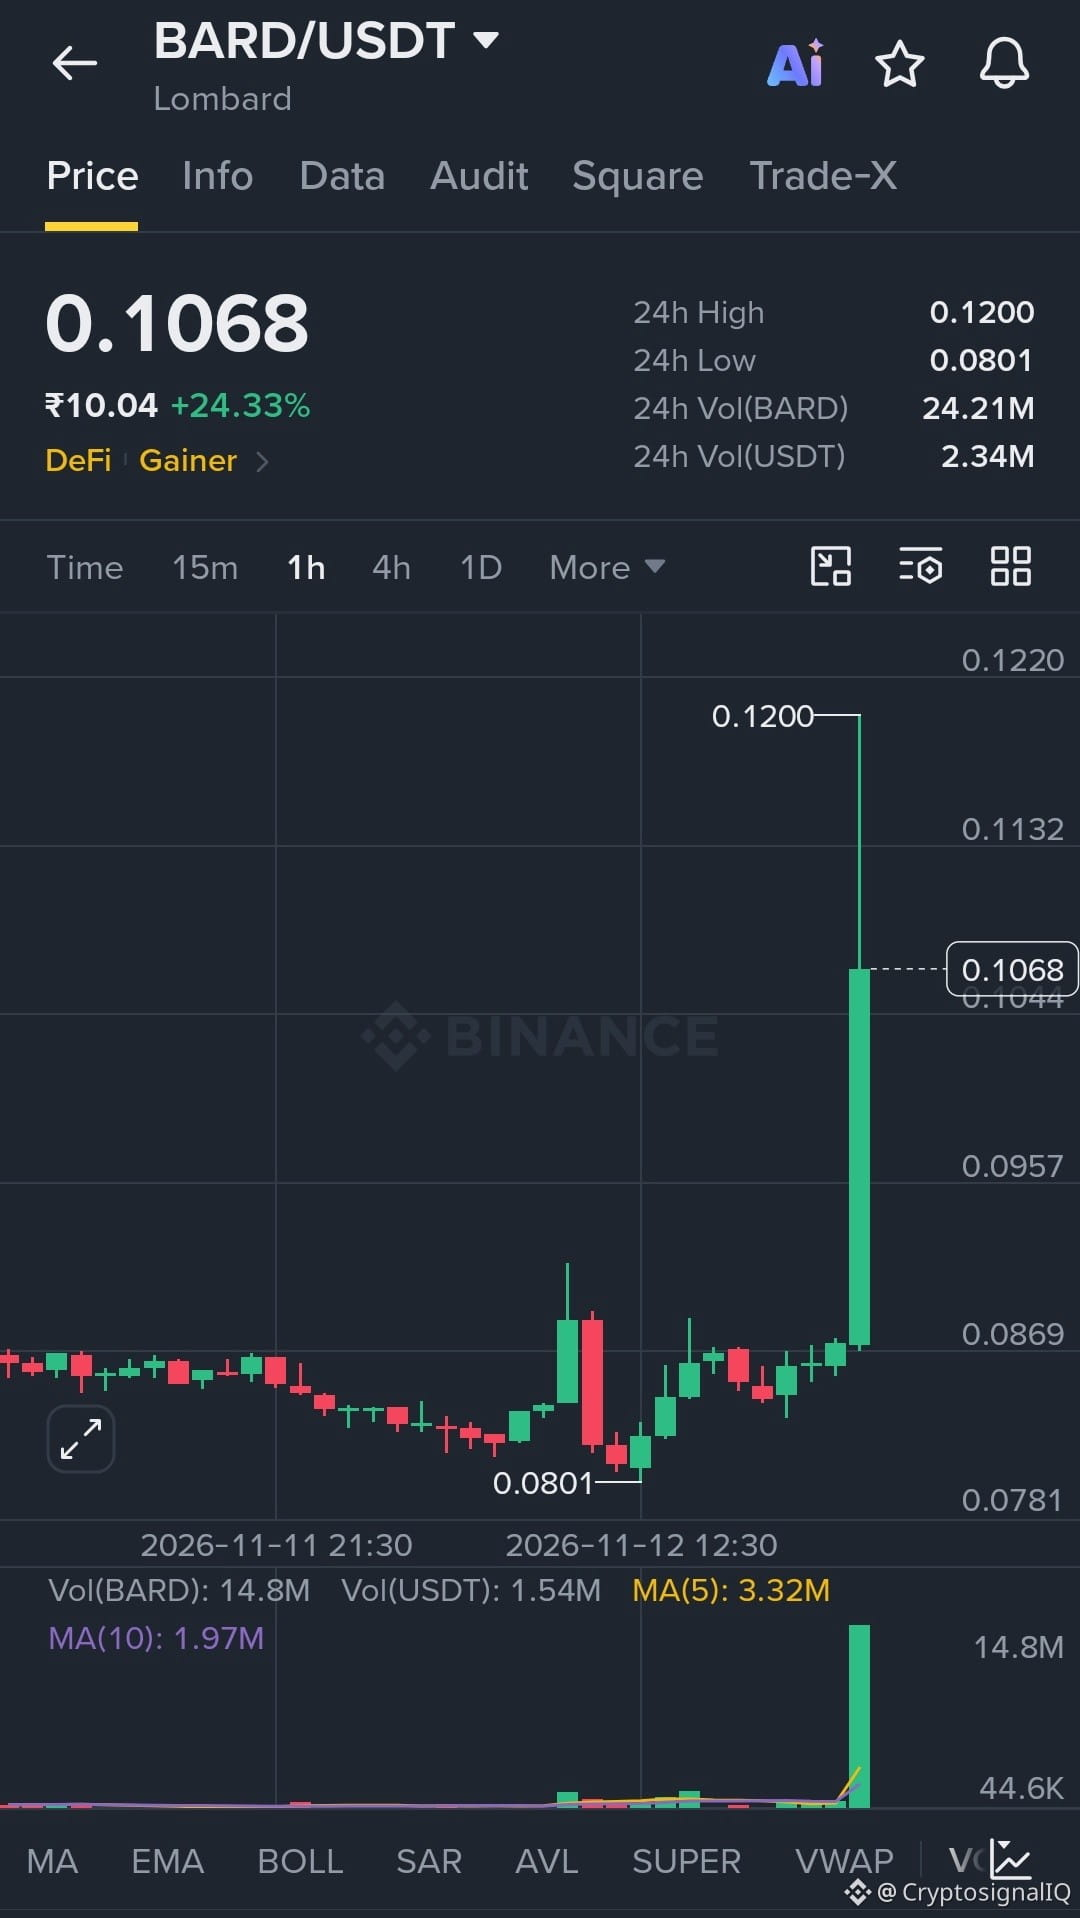
$BARD — Price has broken above the $0.0869 consolidation zone with a massive 1H volume surge, reaching $0.1200 before pulling back to $0.1068.
Entry: $0.1030–$0.1060
🎯 TP1: $0.1132
🎯 TP2: $0.1200
🎯 TP3: $0.1260
🛑 SL: $0.0990
The 1H chart shows a strong bullish breakout backed by exceptional volume expansion. Holding above $0.1044 could support another move toward $0.1200. Watch for a successful retest and renewed buying volume before entering — avoid chasing the initial pump.
Trade #Bard here
{future}(BARDUSDT)
$FOREST
{alpha}(560x11cf6bf6d87cb0eb9c294fd6cbfec91ee3a1a7d0)
$R2
{alpha}(560x223a20e1b83aa3832e78d4b7b132df022e739222)
$BARD — Price has broken above the $0.0869 consolidation zone with a massive 1H volume surge, reaching $0.1200 before pulling back to $0.1068.
Entry: $0.1030–$0.1060
🎯 TP1: $0.1132
🎯 TP2: $0.1200
🎯 TP3: $0.1260
🛑 SL: $0.0990
The 1H chart shows a strong bullish breakout backed by exceptional volume expansion. Holding above $0.1044 could support another move toward $0.1200. Watch for a successful retest and renewed buying volume before entering — avoid chasing the initial pump.
Trade #Bard here
$FOREST
$R2
Entry: $0.1030–$0.1060
🎯 TP1: $0.1132
🎯 TP2: $0.1200
🎯 TP3: $0.1260
🛑 SL: $0.0990
The 1H chart shows a strong bullish breakout backed by exceptional volume expansion. Holding above $0.1044 could support another move toward $0.1200. Watch for a successful retest and renewed buying volume before entering — avoid chasing the initial pump.
Trade #Bard here
$FOREST
$R2
1
180


·
--
Bullish
$BARD long — Parabolic breakout with heavy buy pressure, targeting $0.150 🚀
BARD is going absolutely parabolic today, pumping over 60% in a single hour from the $0.080 zone. The 1H chart shows massive volume spikes, and the order book is heavily bullish with a 72% buy wall. Price is currently consolidating just below its 24h high. A clean 1H close above the $0.1385 resistance will confirm the continuation of this explosive uptrend.
Entry: 1H close above $0.1385
SL: Below $0.1180 (Under the breakout candle body)
Target 1: $0.1450
Target 2: $0.1550
If $0.1180 breaks down, the setup is invalid — cut your losses.
$BARD
{future}(BARDUSDT)
DYOR. NFA. Extremely high volatility, use strict risk management.
#BARD #Lombard #TradeIdea #IMPACTbyTrade
$BARD long — Parabolic breakout with heavy buy pressure, targeting $0.150 🚀
BARD is going absolutely parabolic today, pumping over 60% in a single hour from the $0.080 zone. The 1H chart shows massive volume spikes, and the order book is heavily bullish with a 72% buy wall. Price is currently consolidating just below its 24h high. A clean 1H close above the $0.1385 resistance will confirm the continuation of this explosive uptrend.
Entry: 1H close above $0.1385
SL: Below $0.1180 (Under the breakout candle body)
Target 1: $0.1450
Target 2: $0.1550
If $0.1180 breaks down, the setup is invalid — cut your losses.
$BARD
DYOR. NFA. Extremely high volatility, use strict risk management.
#BARD #Lombard #TradeIdea #IMPACTbyTrade
BARD is going absolutely parabolic today, pumping over 60% in a single hour from the $0.080 zone. The 1H chart shows massive volume spikes, and the order book is heavily bullish with a 72% buy wall. Price is currently consolidating just below its 24h high. A clean 1H close above the $0.1385 resistance will confirm the continuation of this explosive uptrend.
Entry: 1H close above $0.1385
SL: Below $0.1180 (Under the breakout candle body)
Target 1: $0.1450
Target 2: $0.1550
If $0.1180 breaks down, the setup is invalid — cut your losses.
$BARD
DYOR. NFA. Extremely high volatility, use strict risk management.
#BARD #Lombard #TradeIdea #IMPACTbyTrade
265

·
--
Bearish
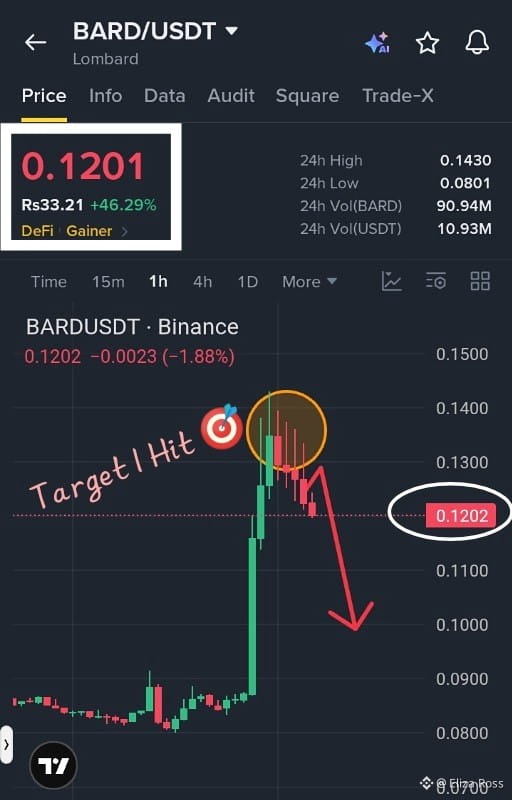
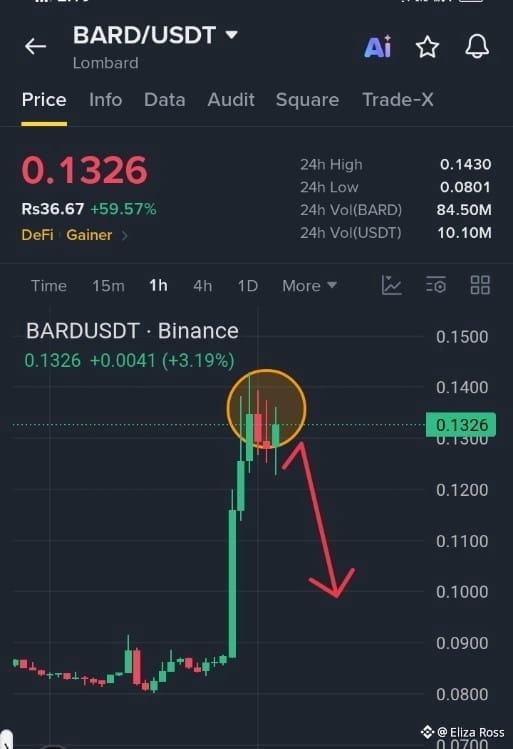
Listen, dear fam❗❗ As I warned you 1 hour ago, $BARD is continuing its downward move, and our community has successfully captured this move. Our first target at $0.120 has finally been reached! 🎯
The next levels I'm watching are $0.100, followed by $0.090 and potentially even lower.
The downside momentum is still in focus. Stay patient, keep watching the levels, and don't rush into any decision. More downside could be ahead!
Stay alert, fam. The move isn't over yet!
Sell Short Now And Trade Here $BARD 👇
{spot}(BARDUSDT)
#BARD #CryptoTrading #BearishMomentum #RossFamily
Listen, dear fam❗❗ As I warned you 1 hour ago, $BARD is continuing its downward move, and our community has successfully captured this move. Our first target at $0.120 has finally been reached! 🎯
The next levels I'm watching are $0.100, followed by $0.090 and potentially even lower.
The downside momentum is still in focus. Stay patient, keep watching the levels, and don't rush into any decision. More downside could be ahead!
Stay alert, fam. The move isn't over yet!
Sell Short Now And Trade Here $BARD 👇
#BARD #CryptoTrading #BearishMomentum #RossFamily
The next levels I'm watching are $0.100, followed by $0.090 and potentially even lower.
The downside momentum is still in focus. Stay patient, keep watching the levels, and don't rush into any decision. More downside could be ahead!
Stay alert, fam. The move isn't over yet!
Sell Short Now And Trade Here $BARD 👇
#BARD #CryptoTrading #BearishMomentum #RossFamily
Eliza Ross
·
--
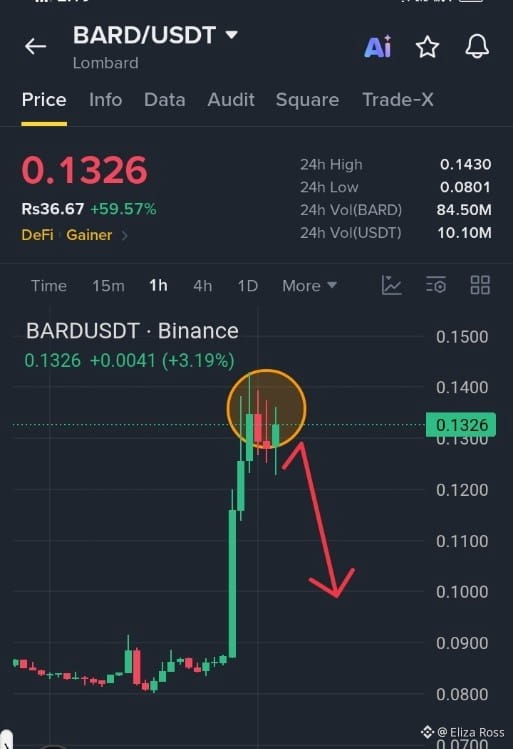
Bearish🚨 ATTENTION TRADERS!
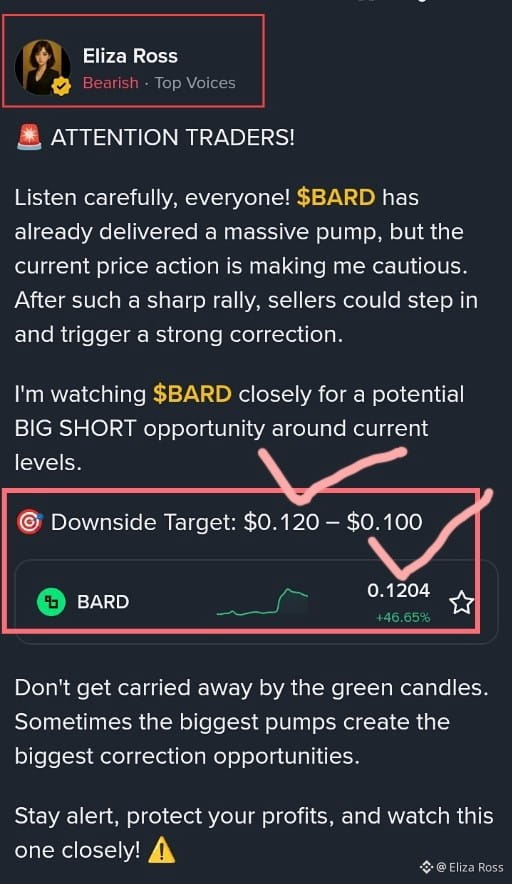
Listen carefully, everyone! $BARD has already delivered a massive pump, but the current price action is making me cautious. After such a sharp rally, sellers could step in and trigger a strong correction.
I'm watching $BARD closely for a potential BIG SHORT opportunity around current levels.
🎯 Downside Target: $0.120 – $0.100
Don't get carried away by the green candles. Sometimes the biggest pumps create the biggest correction opportunities.
Stay alert, protect your profits, and watch this one closely! ⚠️
#BARD #CryptoSignals #Binance #Trading
Listen carefully, everyone! $BARD has already delivered a massive pump, but the current price action is making me cautious. After such a sharp rally, sellers could step in and trigger a strong correction.
I'm watching $BARD closely for a potential BIG SHORT opportunity around current levels.
🎯 Downside Target: $0.120 – $0.100
Don't get carried away by the green candles. Sometimes the biggest pumps create the biggest correction opportunities.
Stay alert, protect your profits, and watch this one closely! ⚠️
#BARD #CryptoSignals #Binance #Trading
1
2
224

·
--
🚀 $BARD : Bullish Breakout Loading?
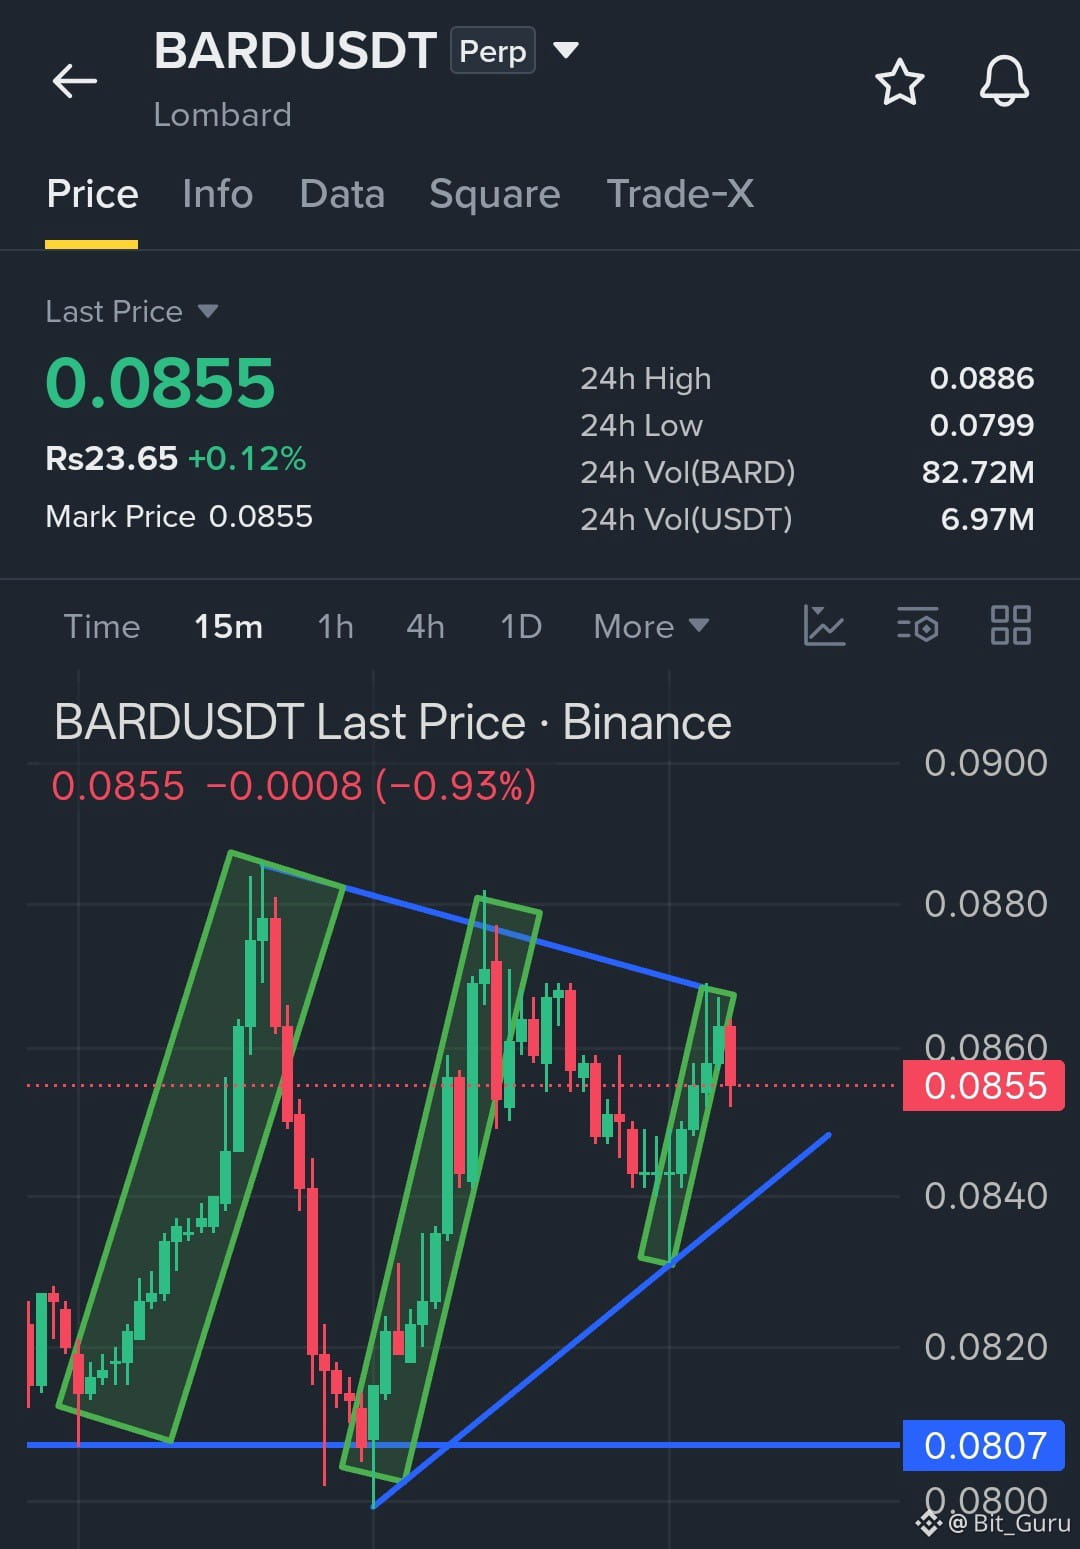
$BARD is forming a tightening triangle pattern, with $0.0870 as key resistance. A breakout could push the price toward $0.0890–$0.0920, while support remains near $0.0840.
Long Entry: $0.0845–$0.0855 SL: $0.0828 TP1: $0.0870 TP2: $0.0890 TP3: $0.0920
#BARD
{spot}(BARDUSDT)
🚀 $BARD : Bullish Breakout Loading?
$BARD is forming a tightening triangle pattern, with $0.0870 as key resistance. A breakout could push the price toward $0.0890–$0.0920, while support remains near $0.0840.
Long Entry: $0.0845–$0.0855 SL: $0.0828 TP1: $0.0870 TP2: $0.0890 TP3: $0.0920
#BARD
$BARD is forming a tightening triangle pattern, with $0.0870 as key resistance. A breakout could push the price toward $0.0890–$0.0920, while support remains near $0.0840.
Long Entry: $0.0845–$0.0855 SL: $0.0828 TP1: $0.0870 TP2: $0.0890 TP3: $0.0920
#BARD
1
353

·
--
Bullish
$BARD just made a serious comeback. But is this move the start of something bigger?
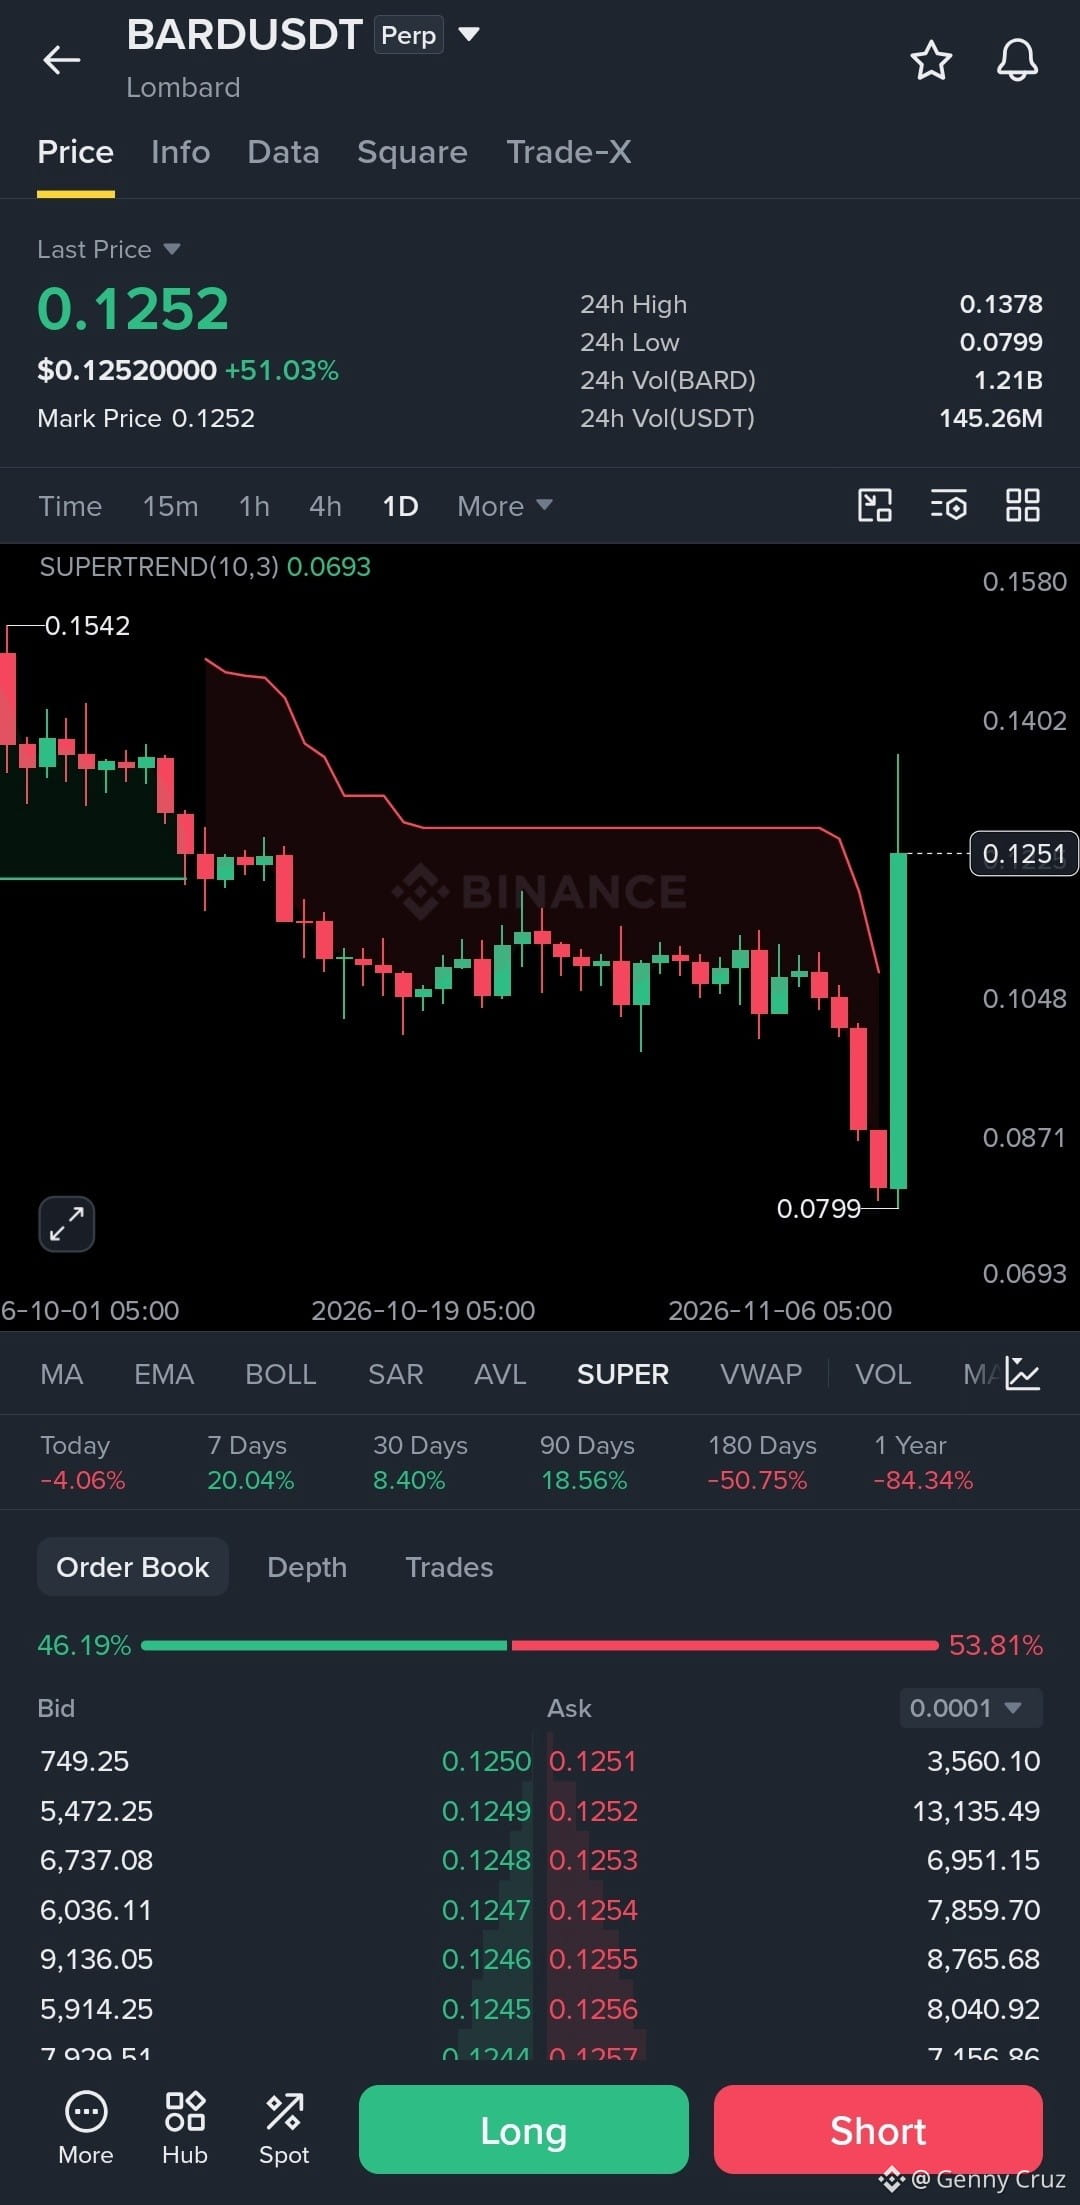
After weeks of pressure, BARD bounced sharply from $0.0799 and surged over 51% in 24 hours, reclaiming the $0.12 area. That's a notable shift in momentum, and buyers have finally stepped back in.
Key levels on my radar:
Support: $0.115 to $0.105
Major support: $0.087
Resistance: $0.1378
Next target zone: $0.1542
A clean break above $0.1378 could give the recovery more room to run. If the price slips below $0.105, this breakout attempt may need a reset.
Credit to buyers for that strong response. Now the real test is whether BARD can hold the reclaimed levels instead of giving them back.
#Write2Earn #Bard
{spot}(BARDUSDT)
$BARD just made a serious comeback. But is this move the start of something bigger?
After weeks of pressure, BARD bounced sharply from $0.0799 and surged over 51% in 24 hours, reclaiming the $0.12 area. That's a notable shift in momentum, and buyers have finally stepped back in.
Key levels on my radar:
Support: $0.115 to $0.105
Major support: $0.087
Resistance: $0.1378
Next target zone: $0.1542
A clean break above $0.1378 could give the recovery more room to run. If the price slips below $0.105, this breakout attempt may need a reset.
Credit to buyers for that strong response. Now the real test is whether BARD can hold the reclaimed levels instead of giving them back.
#Write2Earn #Bard
After weeks of pressure, BARD bounced sharply from $0.0799 and surged over 51% in 24 hours, reclaiming the $0.12 area. That's a notable shift in momentum, and buyers have finally stepped back in.
Key levels on my radar:
Support: $0.115 to $0.105
Major support: $0.087
Resistance: $0.1378
Next target zone: $0.1542
A clean break above $0.1378 could give the recovery more room to run. If the price slips below $0.105, this breakout attempt may need a reset.
Credit to buyers for that strong response. Now the real test is whether BARD can hold the reclaimed levels instead of giving them back.
#Write2Earn #Bard
Elon Jamess:
Strong bounce, but holding $0.115 will be key.
4
4
478

🎭 $BARD /USDT — 🔴 SHORT · Conf 95%
━━━━━━━━━━━━━━
📍 Entry: 0.1259 – 0.1275
🛑 SL: 0.1500
🎯 TP1: 0.1157
✅ TP2: 0.1081
🏆 TP3: 0.0937
⚖️ R:R to TP1: 1:0.5
━━━━━━━━━━━━━━
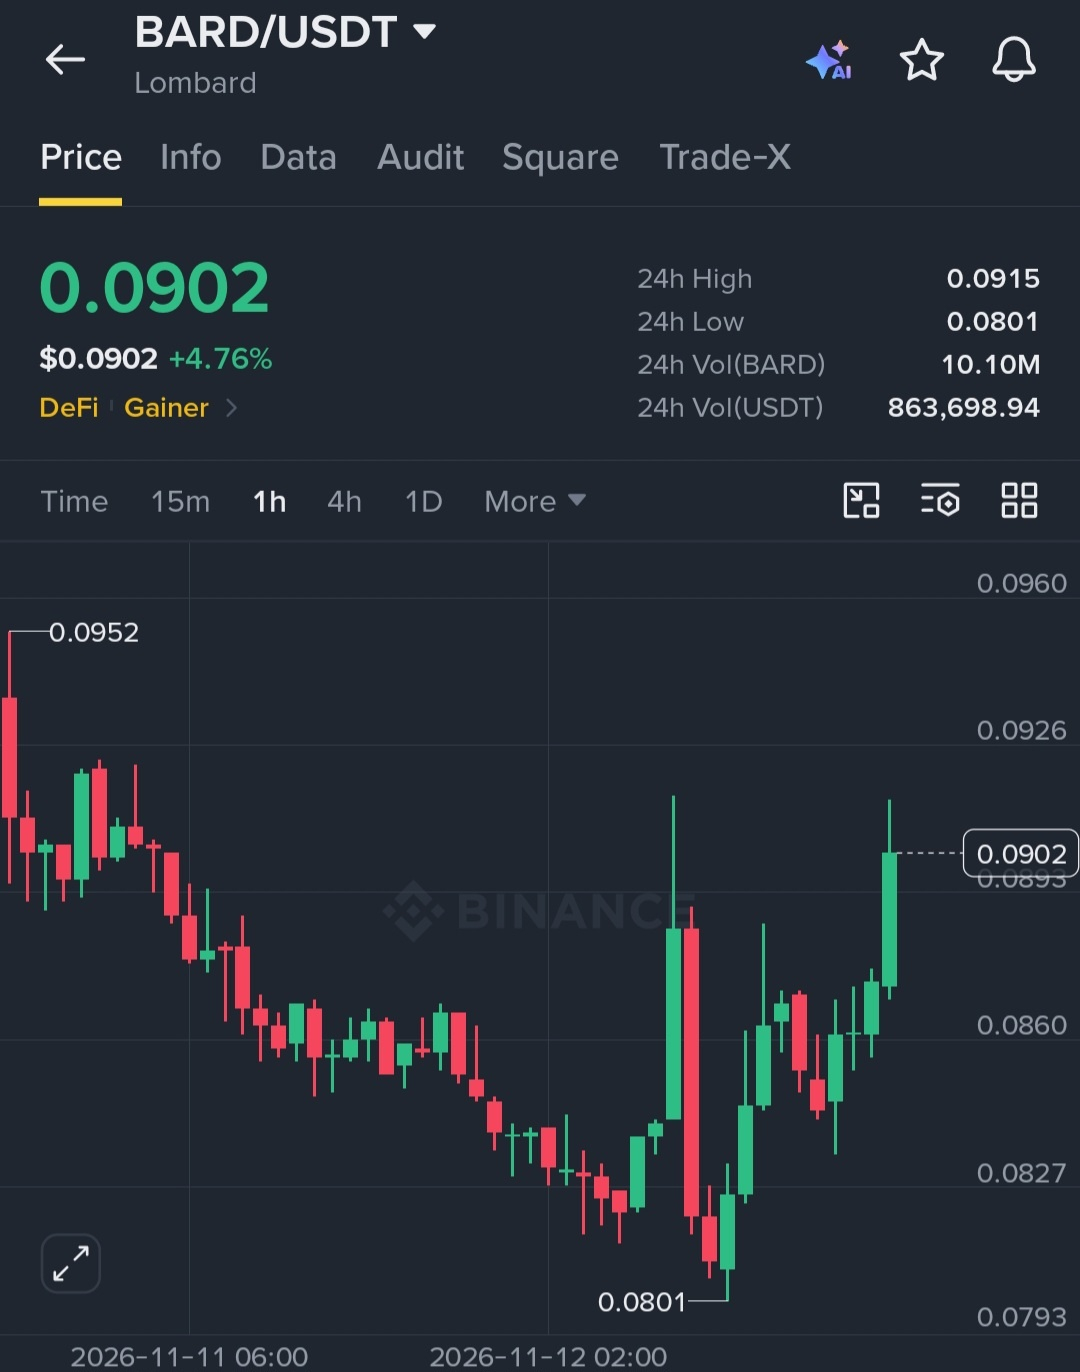
🔎 1H made higher lows off 0.0801 (4H conflict), but 7d (−18.76%) and 30d (−24.67%) stay red, so I follow the 1D.
🧠 $BARD : Lombard's LBTC is a Bitcoin token backed 1:1 that earns yield via Babylon staking; risk is the token's −88.99% 1Y move and about $864K of 24h volume.
💬 Is there a real market for BTC liquid staking when most holders rarely move their coins?
⚠️ Not financial advice. Manage your risk.
#BARD #Lombard #BTC #Babylon #Staking
{future}(BARDUSDT)
🎭 $BARD /USDT — 🔴 SHORT · Conf 95%
━━━━━━━━━━━━━━
📍 Entry: 0.1259 – 0.1275
🛑 SL: 0.1500
🎯 TP1: 0.1157
✅ TP2: 0.1081
🏆 TP3: 0.0937
⚖️ R:R to TP1: 1:0.5
━━━━━━━━━━━━━━
🔎 1H made higher lows off 0.0801 (4H conflict), but 7d (−18.76%) and 30d (−24.67%) stay red, so I follow the 1D.
🧠 $BARD : Lombard's LBTC is a Bitcoin token backed 1:1 that earns yield via Babylon staking; risk is the token's −88.99% 1Y move and about $864K of 24h volume.
💬 Is there a real market for BTC liquid staking when most holders rarely move their coins?
⚠️ Not financial advice. Manage your risk.
#BARD #Lombard #BTC #Babylon #Staking
━━━━━━━━━━━━━━
📍 Entry: 0.1259 – 0.1275
🛑 SL: 0.1500
🎯 TP1: 0.1157
✅ TP2: 0.1081
🏆 TP3: 0.0937
⚖️ R:R to TP1: 1:0.5
━━━━━━━━━━━━━━
🔎 1H made higher lows off 0.0801 (4H conflict), but 7d (−18.76%) and 30d (−24.67%) stay red, so I follow the 1D.
🧠 $BARD : Lombard's LBTC is a Bitcoin token backed 1:1 that earns yield via Babylon staking; risk is the token's −88.99% 1Y move and about $864K of 24h volume.
💬 Is there a real market for BTC liquid staking when most holders rarely move their coins?
⚠️ Not financial advice. Manage your risk.
#BARD #Lombard #BTC #Babylon #Staking

2
784
·
--
Bearish
🚨 ATTENTION TRADERS!
Listen carefully, everyone! $BARD has already delivered a massive pump, but the current price action is making me cautious. After such a sharp rally, sellers could step in and trigger a strong correction.
I'm watching $BARD closely for a potential BIG SHORT opportunity around current levels.
🎯 Downside Target: $0.120 – $0.100
{spot}(BARDUSDT)
Don't get carried away by the green candles. Sometimes the biggest pumps create the biggest correction opportunities.
Stay alert, protect your profits, and watch this one closely! ⚠️
#BARD #CryptoSignals #Binance #Trading
🚨 ATTENTION TRADERS!
Listen carefully, everyone! $BARD has already delivered a massive pump, but the current price action is making me cautious. After such a sharp rally, sellers could step in and trigger a strong correction.
I'm watching $BARD closely for a potential BIG SHORT opportunity around current levels.
🎯 Downside Target: $0.120 – $0.100
Don't get carried away by the green candles. Sometimes the biggest pumps create the biggest correction opportunities.
Stay alert, protect your profits, and watch this one closely! ⚠️
#BARD #CryptoSignals #Binance #Trading
Listen carefully, everyone! $BARD has already delivered a massive pump, but the current price action is making me cautious. After such a sharp rally, sellers could step in and trigger a strong correction.
I'm watching $BARD closely for a potential BIG SHORT opportunity around current levels.
🎯 Downside Target: $0.120 – $0.100
Don't get carried away by the green candles. Sometimes the biggest pumps create the biggest correction opportunities.
Stay alert, protect your profits, and watch this one closely! ⚠️
#BARD #CryptoSignals #Binance #Trading
1
3
811
·
--
Bullish
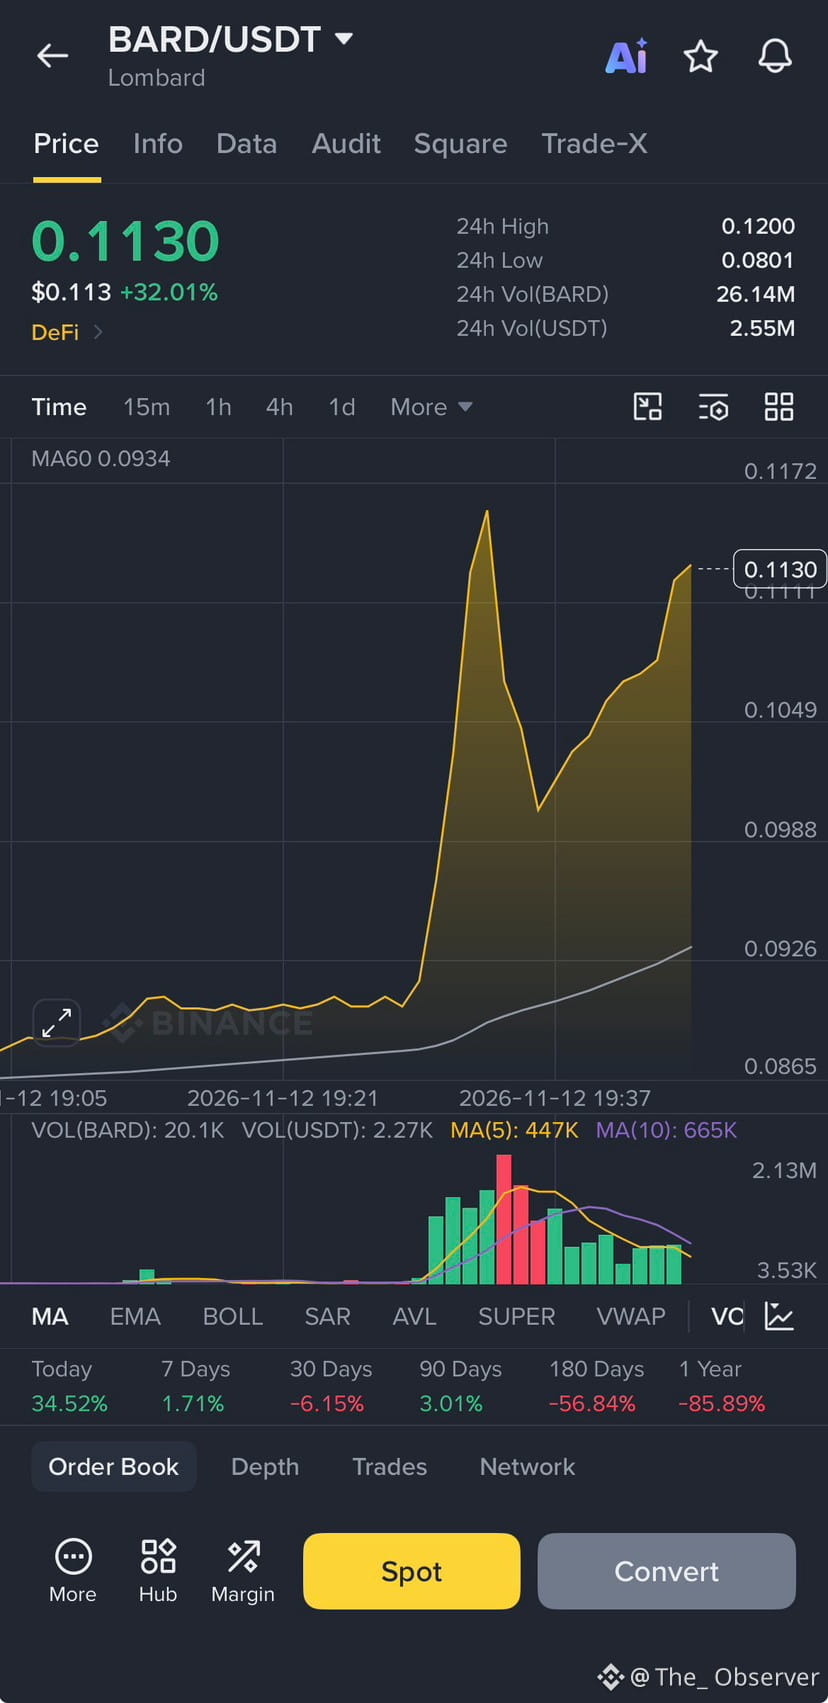
$BARD is absolutely flying, up +32% to $0.1130! 🚀📊
Looking at the chart, the technicals are clear: This is currently a BULLISH structure 🟢. Why? We’ve seen a massive volume spike alongside a sharp breakout, completely outpacing the MA60 (currently at $0.0934). The buyers are clearly in control right now. 🔥
Here’s what I’m watching closely:
🛡️ Key Support: 0.1200 (the 24h high). Bulls need to break and hold this level to confirm the next leg up.
Scenarios:
📈 Bullish: A retest and bounce off $0.093 sends us back to challenge $0.1200.
📉 Bearish: A high-volume breakdown below $0.093 invalidates the setup and likely triggers a deeper retracement.
Outlook: Short-term momentum is undeniably strong, but remember—after a vertical 32% pump, expect volatility. Don't chase blindly; let the price come to your levels. 🎯💯
What’s your next move on $BARD ? Let me know below! 👇💬 #Crypto #DeFi #BARD
$BARD is absolutely flying, up +32% to $0.1130! 🚀📊
Looking at the chart, the technicals are clear: This is currently a BULLISH structure 🟢. Why? We’ve seen a massive volume spike alongside a sharp breakout, completely outpacing the MA60 (currently at $0.0934). The buyers are clearly in control right now. 🔥
Here’s what I’m watching closely:
🛡️ Key Support: 0.1200 (the 24h high). Bulls need to break and hold this level to confirm the next leg up.
Scenarios:
📈 Bullish: A retest and bounce off $0.093 sends us back to challenge $0.1200.
📉 Bearish: A high-volume breakdown below $0.093 invalidates the setup and likely triggers a deeper retracement.
Outlook: Short-term momentum is undeniably strong, but remember—after a vertical 32% pump, expect volatility. Don't chase blindly; let the price come to your levels. 🎯💯
What’s your next move on $BARD ? Let me know below! 👇💬 #Crypto #DeFi #BARD
Looking at the chart, the technicals are clear: This is currently a BULLISH structure 🟢. Why? We’ve seen a massive volume spike alongside a sharp breakout, completely outpacing the MA60 (currently at $0.0934). The buyers are clearly in control right now. 🔥
Here’s what I’m watching closely:
🛡️ Key Support: 0.1200 (the 24h high). Bulls need to break and hold this level to confirm the next leg up.
Scenarios:
📈 Bullish: A retest and bounce off $0.093 sends us back to challenge $0.1200.
📉 Bearish: A high-volume breakdown below $0.093 invalidates the setup and likely triggers a deeper retracement.
Outlook: Short-term momentum is undeniably strong, but remember—after a vertical 32% pump, expect volatility. Don't chase blindly; let the price come to your levels. 🎯💯
What’s your next move on $BARD ? Let me know below! 👇💬 #Crypto #DeFi #BARD
269

$BARD : $1M+ IN EXCHANGE WALLET MOVEMENTS AS LIQUIDATION RISK BUILDS
$BARD has made a sharp move, climbing from around $0.087 to a high of $0.1306. It's now trading near $0.1209.
But the on-chain activity is worth watching.
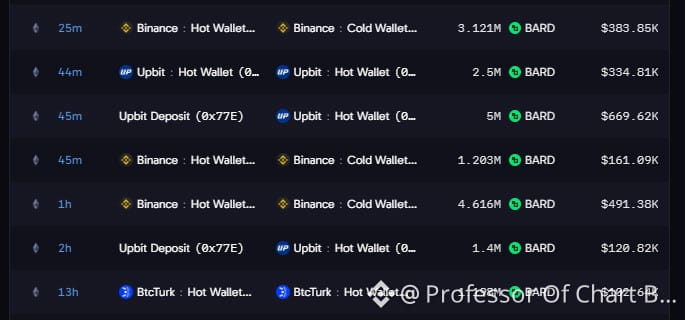
I spotted several large movements:
Binance:
4.616M BARD (~$491K) moved from hot to cold storage.
3.121M BARD (~$384K) moved from hot to cold storage.
1.203M BARD (~$161K) moved from hot to cold storage.
That's approximately 8.94M BARD worth over $1M moved into Binance cold storage across these transactions.
On Upbit, another 5M BARD (~$670K) moved from a deposit address to its hot wallet, alongside additional wallet movements.
Now look at the liquidation map.
Long liquidation zones:
$0.11074: $416K
$0.09849: $166K
$0.07802: $28K
The long-side magnet strength is 90.6, significantly highlighting the downside liquidation liquidity.
#Bard
$BARD : $1M+ IN EXCHANGE WALLET MOVEMENTS AS LIQUIDATION RISK BUILDS
$BARD has made a sharp move, climbing from around $0.087 to a high of $0.1306. It's now trading near $0.1209.
But the on-chain activity is worth watching.
I spotted several large movements:
Binance:
4.616M BARD (~$491K) moved from hot to cold storage.
3.121M BARD (~$384K) moved from hot to cold storage.
1.203M BARD (~$161K) moved from hot to cold storage.
That's approximately 8.94M BARD worth over $1M moved into Binance cold storage across these transactions.
On Upbit, another 5M BARD (~$670K) moved from a deposit address to its hot wallet, alongside additional wallet movements.
Now look at the liquidation map.
Long liquidation zones:
$0.11074: $416K
$0.09849: $166K
$0.07802: $28K
The long-side magnet strength is 90.6, significantly highlighting the downside liquidation liquidity.
#Bard
$BARD has made a sharp move, climbing from around $0.087 to a high of $0.1306. It's now trading near $0.1209.
But the on-chain activity is worth watching.
I spotted several large movements:
Binance:
4.616M BARD (~$491K) moved from hot to cold storage.
3.121M BARD (~$384K) moved from hot to cold storage.
1.203M BARD (~$161K) moved from hot to cold storage.
That's approximately 8.94M BARD worth over $1M moved into Binance cold storage across these transactions.
On Upbit, another 5M BARD (~$670K) moved from a deposit address to its hot wallet, alongside additional wallet movements.
Now look at the liquidation map.
Long liquidation zones:
$0.11074: $416K
$0.09849: $166K
$0.07802: $28K
The long-side magnet strength is 90.6, significantly highlighting the downside liquidation liquidity.
#Bard
264

·
--
Bullish
$BARD
{future}(BARDUSDT)
- Perfect Breakout Play 🎯
I shared this setup early and price did exactly as planned.
Strong breakout + volume confirmation = Quick win.
Final target $0.11 HIT ✅
Another clean and bold trade delivered.
No chasing, no panic, just plan and patience.
Follow for more clean setups. Next one coming soon.
#BARD #CryptoTrading #Breakout #BinanceSquare
$BARD
- Perfect Breakout Play 🎯
I shared this setup early and price did exactly as planned.
Strong breakout + volume confirmation = Quick win.
Final target $0.11 HIT ✅
Another clean and bold trade delivered.
No chasing, no panic, just plan and patience.
Follow for more clean setups. Next one coming soon.
#BARD #CryptoTrading #Breakout #BinanceSquare
- Perfect Breakout Play 🎯
I shared this setup early and price did exactly as planned.
Strong breakout + volume confirmation = Quick win.
Final target $0.11 HIT ✅
Another clean and bold trade delivered.
No chasing, no panic, just plan and patience.
Follow for more clean setups. Next one coming soon.
#BARD #CryptoTrading #Breakout #BinanceSquare
479
·
--
Bearish
💰 INVEST BETWEEN $10 AND $100 💰
🔴 $BARD
{future}(BARDUSDT)
QUICK SHORT ALERT – BEARISH OPPORTUNITY!
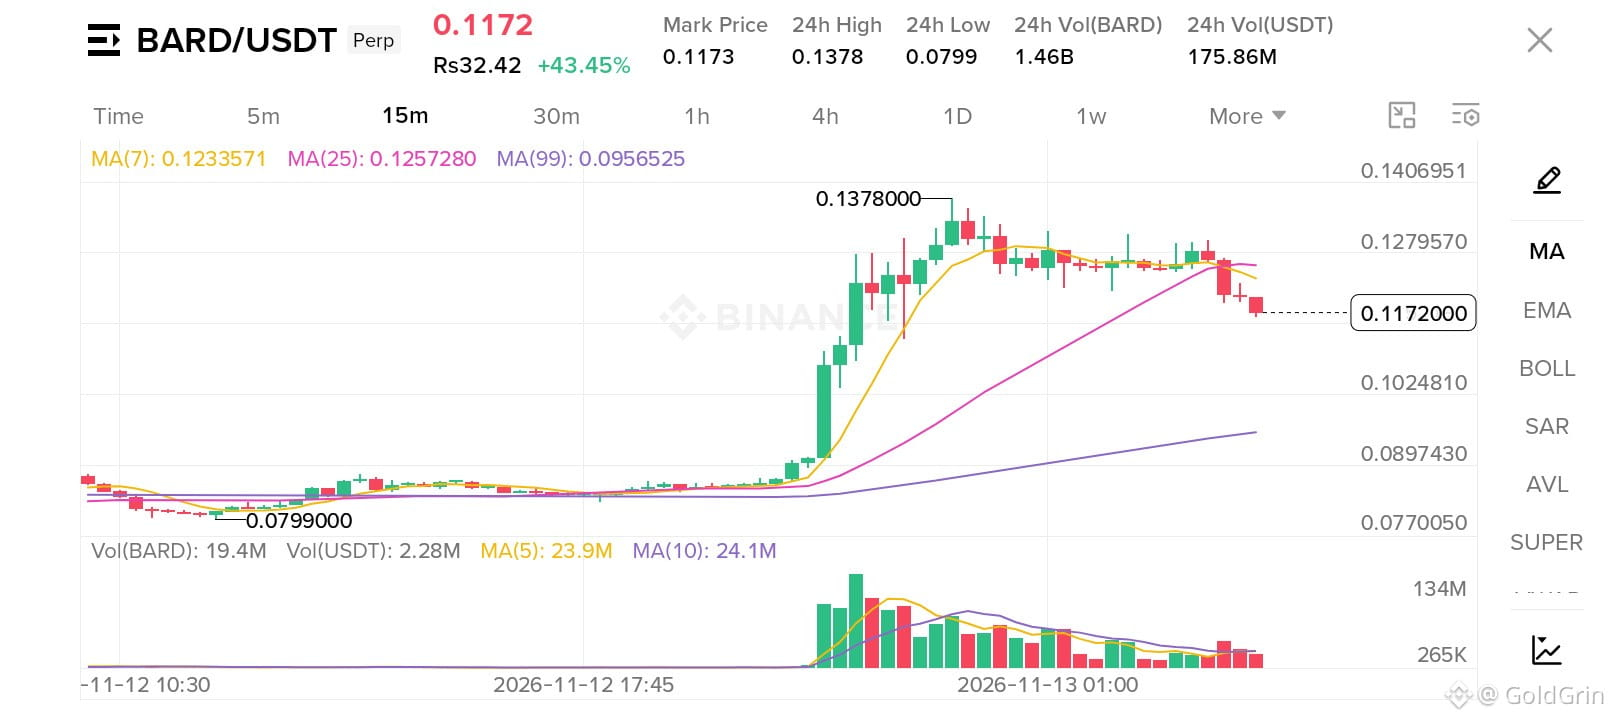
A quick short trade has been opened on $BARD. Sellers are targeting lower price levels, with $0.1100 as the final downside target.
📉 SHORT TRADE SETUP
Entry: $0.1250 – $0.1280
TP1: $0.1200
TP2: $0.1180
TP3: $0.1160
Final Target: $0.1100
Stop Loss: Above $0.1500
🎯 TRADE STRATEGY
Take partial profits at each target.
Monitor price movement closely.
Maintain proper stop-loss discipline.
Avoid risking more than you can afford.
💵 INVESTMENT RANGE: Start with $10 and invest up to $100 according to your budget and risk tolerance.
⚠️ Trade carefully. Market conditions can change quickly, and targets are not guaranteed.
#BARD #Binance #CryptoTrading #ShortSignal #USDT
💰 INVEST BETWEEN $10 AND $100 💰
🔴 $BARD
QUICK SHORT ALERT – BEARISH OPPORTUNITY!
A quick short trade has been opened on $BARD . Sellers are targeting lower price levels, with $0.1100 as the final downside target.
📉 SHORT TRADE SETUP
Entry: $0.1250 – $0.1280
TP1: $0.1200
TP2: $0.1180
TP3: $0.1160
Final Target: $0.1100
Stop Loss: Above $0.1500
🎯 TRADE STRATEGY
Take partial profits at each target.
Monitor price movement closely.
Maintain proper stop-loss discipline.
Avoid risking more than you can afford.
💵 INVESTMENT RANGE: Start with $10 and invest up to $100 according to your budget and risk tolerance.
⚠️ Trade carefully. Market conditions can change quickly, and targets are not guaranteed.
#BARD #Binance #CryptoTrading #ShortSignal #USDT
🔴 $BARD
QUICK SHORT ALERT – BEARISH OPPORTUNITY!
A quick short trade has been opened on $BARD . Sellers are targeting lower price levels, with $0.1100 as the final downside target.
📉 SHORT TRADE SETUP
Entry: $0.1250 – $0.1280
TP1: $0.1200
TP2: $0.1180
TP3: $0.1160
Final Target: $0.1100
Stop Loss: Above $0.1500
🎯 TRADE STRATEGY
Take partial profits at each target.
Monitor price movement closely.
Maintain proper stop-loss discipline.
Avoid risking more than you can afford.
💵 INVESTMENT RANGE: Start with $10 and invest up to $100 according to your budget and risk tolerance.
⚠️ Trade carefully. Market conditions can change quickly, and targets are not guaranteed.
#BARD #Binance #CryptoTrading #ShortSignal #USDT
177
·
--
Bullish
💰 INVEST BETWEEN $10 AND $100 💰
🚀 $BARD
{future}(BARDUSDT)
LONG ALERT – NEXT TARGET $0.110!
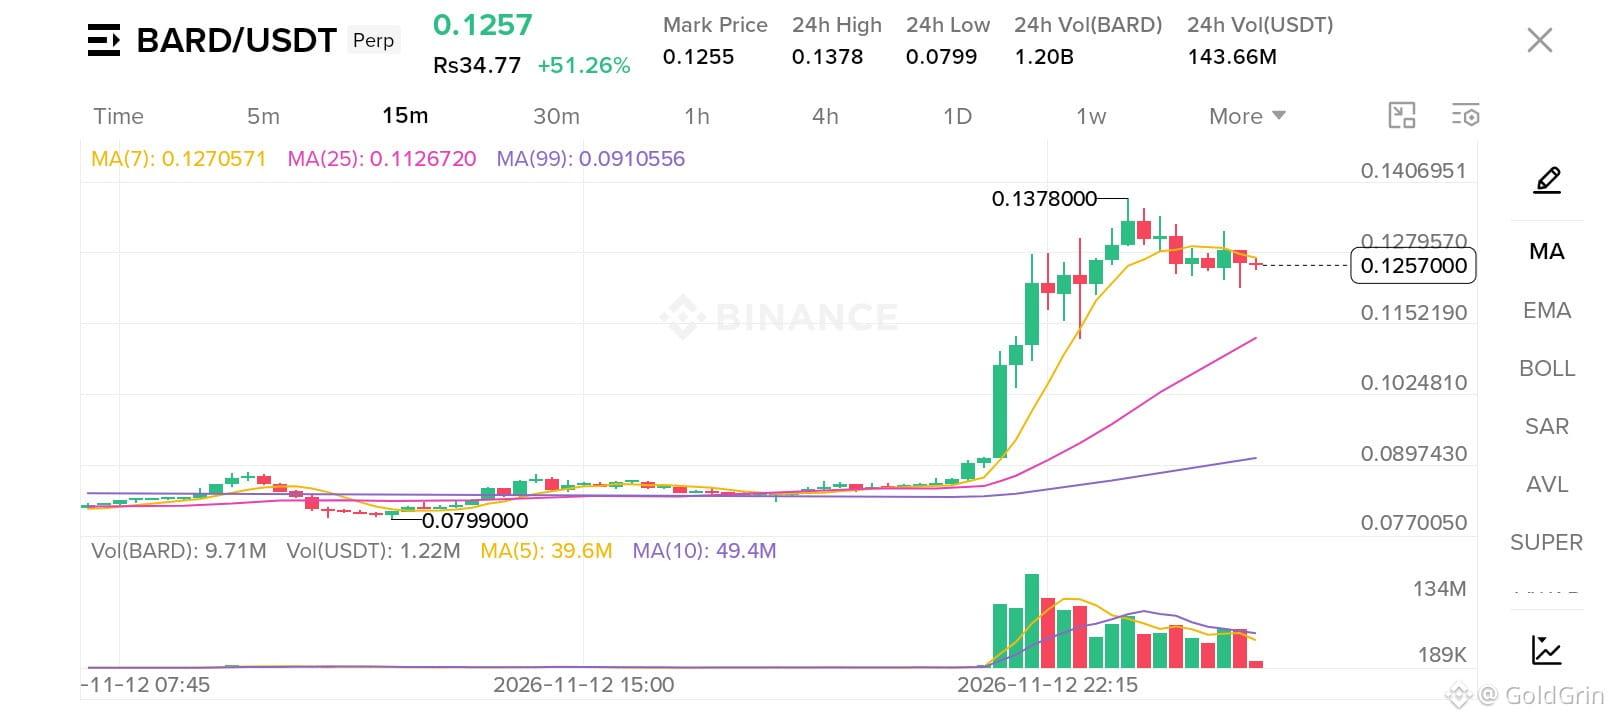
$BARD is showing strong recovery momentum after bouncing from the $0.0799 support zone. Buyers are stepping back into the market, and bullish momentum is building. A continued recovery could push the price toward the next resistance levels.
📈 LONG TRADE SETUP
Entry: $0.0903
TP1: $0.0950
TP2: $0.1000
TP3: $0.1100
Stop Loss: $0.0800
🔥 Investment Range: Invest between $10 and $100 according to your budget and risk tolerance.
⚠️ Manage your risk carefully. Targets are not guaranteed. Always do your own research before trading.
#BARD #Binance #CryptoTrading #LongSignal #Bullish
💰 INVEST BETWEEN $10 AND $100 💰
🚀 $BARD
LONG ALERT – NEXT TARGET $0.110!
$BARD is showing strong recovery momentum after bouncing from the $0.0799 support zone. Buyers are stepping back into the market, and bullish momentum is building. A continued recovery could push the price toward the next resistance levels.
📈 LONG TRADE SETUP
Entry: $0.0903
TP1: $0.0950
TP2: $0.1000
TP3: $0.1100
Stop Loss: $0.0800
🔥 Investment Range: Invest between $10 and $100 according to your budget and risk tolerance.
⚠️ Manage your risk carefully. Targets are not guaranteed. Always do your own research before trading.
#BARD #Binance #CryptoTrading #LongSignal #Bullish
🚀 $BARD
LONG ALERT – NEXT TARGET $0.110!
$BARD is showing strong recovery momentum after bouncing from the $0.0799 support zone. Buyers are stepping back into the market, and bullish momentum is building. A continued recovery could push the price toward the next resistance levels.
📈 LONG TRADE SETUP
Entry: $0.0903
TP1: $0.0950
TP2: $0.1000
TP3: $0.1100
Stop Loss: $0.0800
🔥 Investment Range: Invest between $10 and $100 according to your budget and risk tolerance.
⚠️ Manage your risk carefully. Targets are not guaranteed. Always do your own research before trading.
#BARD #Binance #CryptoTrading #LongSignal #Bullish
77

·
--
Bearish
$BARD Skyrockets +56%! Massive Breakout or Bull Trap? 🤔
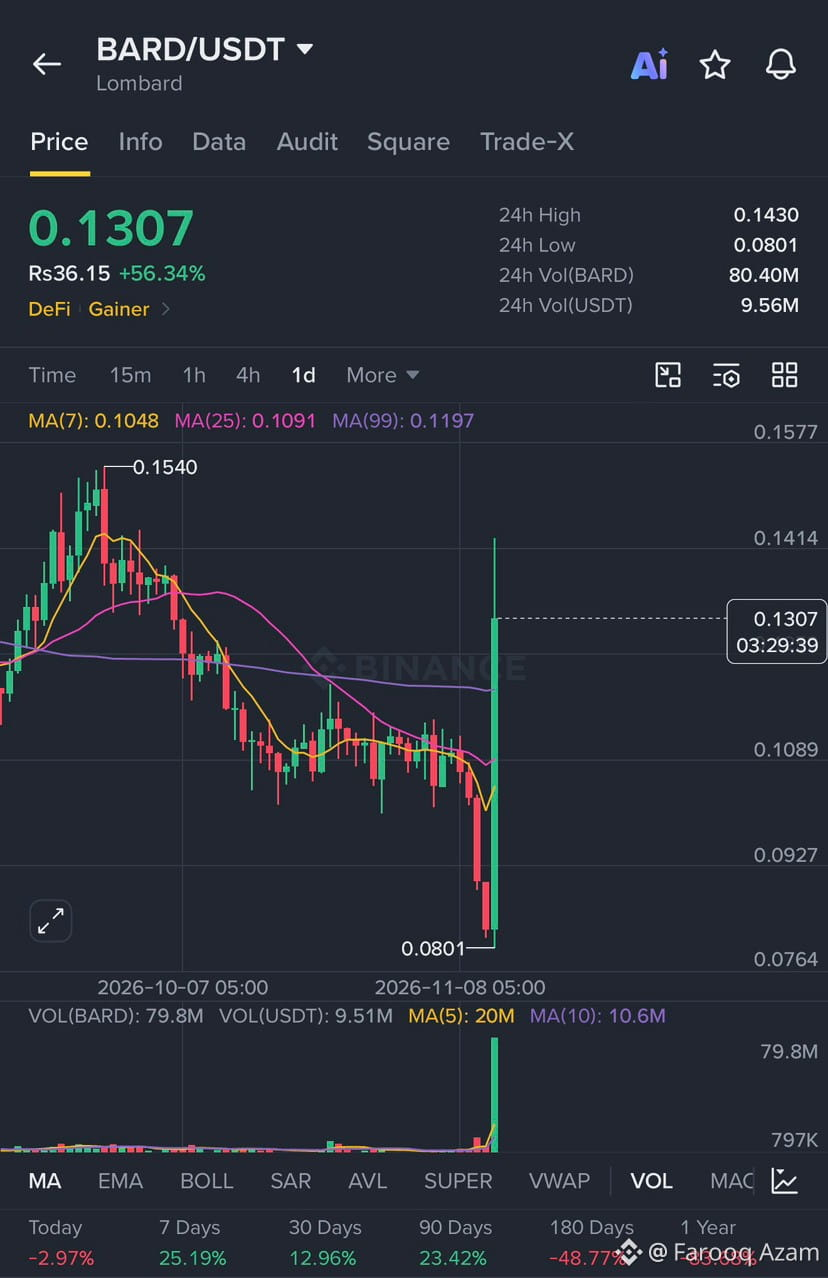
$BARD is currently one of the top gainers on Binance, printing a massive daily green candle. Let’s break down the chart! 👇
The Current Setup (1D Chart):
- Price: $0.1307
- 24h Surge: +56.34% 🔥
- The Move: After a prolonged downtrend, BARD found a hard bottom at $0.0801 and immediately rocketed to a high of $0.1430.
Technicals:
- Moving Averages Smashed: The price has aggressively broken above the MA(7), MA(25) and MA(99). The yellow MA(7) is crossing upwards a strong short-term bullish signal.
- Volume Explosion: Look at that volume bar! A massive influx of capital is driving this move, confirming the pump is not just thin order books.
- Support/Resistance: Immediate resistance is at the recent wick high of $0.1430. Immediate support sits around the MA99 ($0.1197) and MA25 ($0.1091).
⚠️ The Reality Check (Zoom Out):
Before you hit the buy button out of FOMO, look at the long-term metrics at the bottom of the chart:
- 90 Days: +23%
- 180 Days: -48%
- 1 Year: -83% 📉
This is a massive relief rally after a brutal year-long downtrend.
My Trading Strategy:
Buying directly into a +56% daily candle is highly risky. Historically, assets usually retrace to test the moving averages after such a violent pump.
- Watch for: A daily close above the MA99 ($0.1197) to confirm strength.
- Wait for: A pullback to the $0.10 - $0.11 zone for a safer entry.
- Always: Use a tight stop loss.
What’s your play on $BARD ? Are you buying the breakout or waiting for a retrace? Let me know in the comments! 👇
Disclaimer: Not financial advice. Always do your own research (DYOR). Crypto is highly volatile.
#Bard #BinanceSquare
$BARD Skyrockets +56%! Massive Breakout or Bull Trap? 🤔
$BARD is currently one of the top gainers on Binance, printing a massive daily green candle. Let’s break down the chart! 👇
The Current Setup (1D Chart):
- Price: $0.1307
- 24h Surge: +56.34% 🔥
- The Move: After a prolonged downtrend, BARD found a hard bottom at $0.0801 and immediately rocketed to a high of $0.1430.
Technicals:
- Moving Averages Smashed: The price has aggressively broken above the MA(7), MA(25) and MA(99). The yellow MA(7) is crossing upwards a strong short-term bullish signal.
- Volume Explosion: Look at that volume bar! A massive influx of capital is driving this move, confirming the pump is not just thin order books.
- Support/Resistance: Immediate resistance is at the recent wick high of $0.1430. Immediate support sits around the MA99 ($0.1197) and MA25 ($0.1091).
⚠️ The Reality Check (Zoom Out):
Before you hit the buy button out of FOMO, look at the long-term metrics at the bottom of the chart:
- 90 Days: +23%
- 180 Days: -48%
- 1 Year: -83% 📉
This is a massive relief rally after a brutal year-long downtrend.
My Trading Strategy:
Buying directly into a +56% daily candle is highly risky. Historically, assets usually retrace to test the moving averages after such a violent pump.
- Watch for: A daily close above the MA99 ($0.1197) to confirm strength.
- Wait for: A pullback to the $0.10 - $0.11 zone for a safer entry.
- Always: Use a tight stop loss.
What’s your play on $BARD ? Are you buying the breakout or waiting for a retrace? Let me know in the comments! 👇
Disclaimer: Not financial advice. Always do your own research (DYOR). Crypto is highly volatile.
#Bard #BinanceSquare
$BARD is currently one of the top gainers on Binance, printing a massive daily green candle. Let’s break down the chart! 👇
The Current Setup (1D Chart):
- Price: $0.1307
- 24h Surge: +56.34% 🔥
- The Move: After a prolonged downtrend, BARD found a hard bottom at $0.0801 and immediately rocketed to a high of $0.1430.
Technicals:
- Moving Averages Smashed: The price has aggressively broken above the MA(7), MA(25) and MA(99). The yellow MA(7) is crossing upwards a strong short-term bullish signal.
- Volume Explosion: Look at that volume bar! A massive influx of capital is driving this move, confirming the pump is not just thin order books.
- Support/Resistance: Immediate resistance is at the recent wick high of $0.1430. Immediate support sits around the MA99 ($0.1197) and MA25 ($0.1091).
⚠️ The Reality Check (Zoom Out):
Before you hit the buy button out of FOMO, look at the long-term metrics at the bottom of the chart:
- 90 Days: +23%
- 180 Days: -48%
- 1 Year: -83% 📉
This is a massive relief rally after a brutal year-long downtrend.
My Trading Strategy:
Buying directly into a +56% daily candle is highly risky. Historically, assets usually retrace to test the moving averages after such a violent pump.
- Watch for: A daily close above the MA99 ($0.1197) to confirm strength.
- Wait for: A pullback to the $0.10 - $0.11 zone for a safer entry.
- Always: Use a tight stop loss.
What’s your play on $BARD ? Are you buying the breakout or waiting for a retrace? Let me know in the comments! 👇
Disclaimer: Not financial advice. Always do your own research (DYOR). Crypto is highly volatile.
#Bard #BinanceSquare
296

·
--
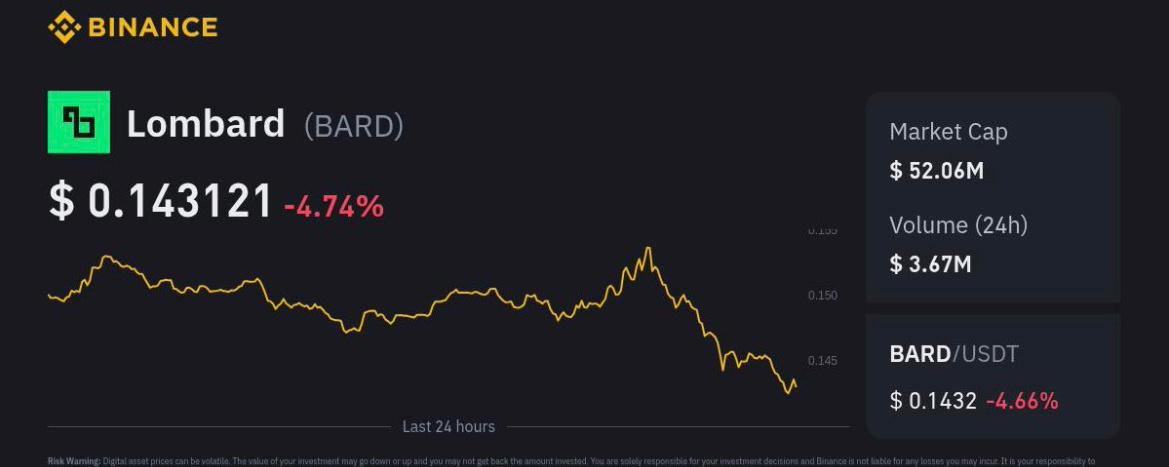
Article
🚨 BARD COIN: BEARISH PRESSURE OR A POWERFUL RECOVERY AHEAD?📉 TECHNICAL ANALYSIS
Lombard ( $BARD ) is facing significant selling pressure. Daily RSI recently reached oversold territory near 26.6, suggesting a possible relief bounce, but the broader trend remains bearish.
🐂 BULLISH SCENARIO: A recovery above $0.0858 could attract buyers, with $0.0899 as the next resistance.
🐻 BEARISH SCENARIO: Losing $0.0810 support could expose $0.0760 and $0.0712.
🌍 MARKET OUTLOOK: Bitcoin’s direction and overall altcoin sentiment will be important for BARD’s next move.
📚 TRADER TIP: Oversold doesn’t automatically mean a reversal. Wait for volume confirmation and a stronger candle close.
💎 FINAL VERDICT: BARD is at a critical technical zone. Watch support, resistance and volume before taking a position.
#Bard #lombard #BARDUpdate #LombardBTC
#altcoins
{future}(BARDUSDT)
🚨 BARD COIN: BEARISH PRESSURE OR A POWERFUL RECOVERY AHEAD?
📉 TECHNICAL ANALYSIS
Lombard ( $BARD ) is facing significant selling pressure. Daily RSI recently reached oversold territory near 26.6, suggesting a possible relief bounce, but the broader trend remains bearish.
🐂 BULLISH SCENARIO: A recovery above $0.0858 could attract buyers, with $0.0899 as the next resistance.
🐻 BEARISH SCENARIO: Losing $0.0810 support could expose $0.0760 and $0.0712.
🌍 MARKET OUTLOOK: Bitcoin’s direction and overall altcoin sentiment will be important for BARD’s next move.
📚 TRADER TIP: Oversold doesn’t automatically mean a reversal. Wait for volume confirmation and a stronger candle close.
💎 FINAL VERDICT: BARD is at a critical technical zone. Watch support, resistance and volume before taking a position.
#Bard #lombard #BARDUpdate #LombardBTC
#altcoins
Lombard ( $BARD ) is facing significant selling pressure. Daily RSI recently reached oversold territory near 26.6, suggesting a possible relief bounce, but the broader trend remains bearish.
🐂 BULLISH SCENARIO: A recovery above $0.0858 could attract buyers, with $0.0899 as the next resistance.
🐻 BEARISH SCENARIO: Losing $0.0810 support could expose $0.0760 and $0.0712.
🌍 MARKET OUTLOOK: Bitcoin’s direction and overall altcoin sentiment will be important for BARD’s next move.
📚 TRADER TIP: Oversold doesn’t automatically mean a reversal. Wait for volume confirmation and a stronger candle close.
💎 FINAL VERDICT: BARD is at a critical technical zone. Watch support, resistance and volume before taking a position.
#Bard #lombard #BARDUpdate #LombardBTC
#altcoins
1
227

·
--
Bullish
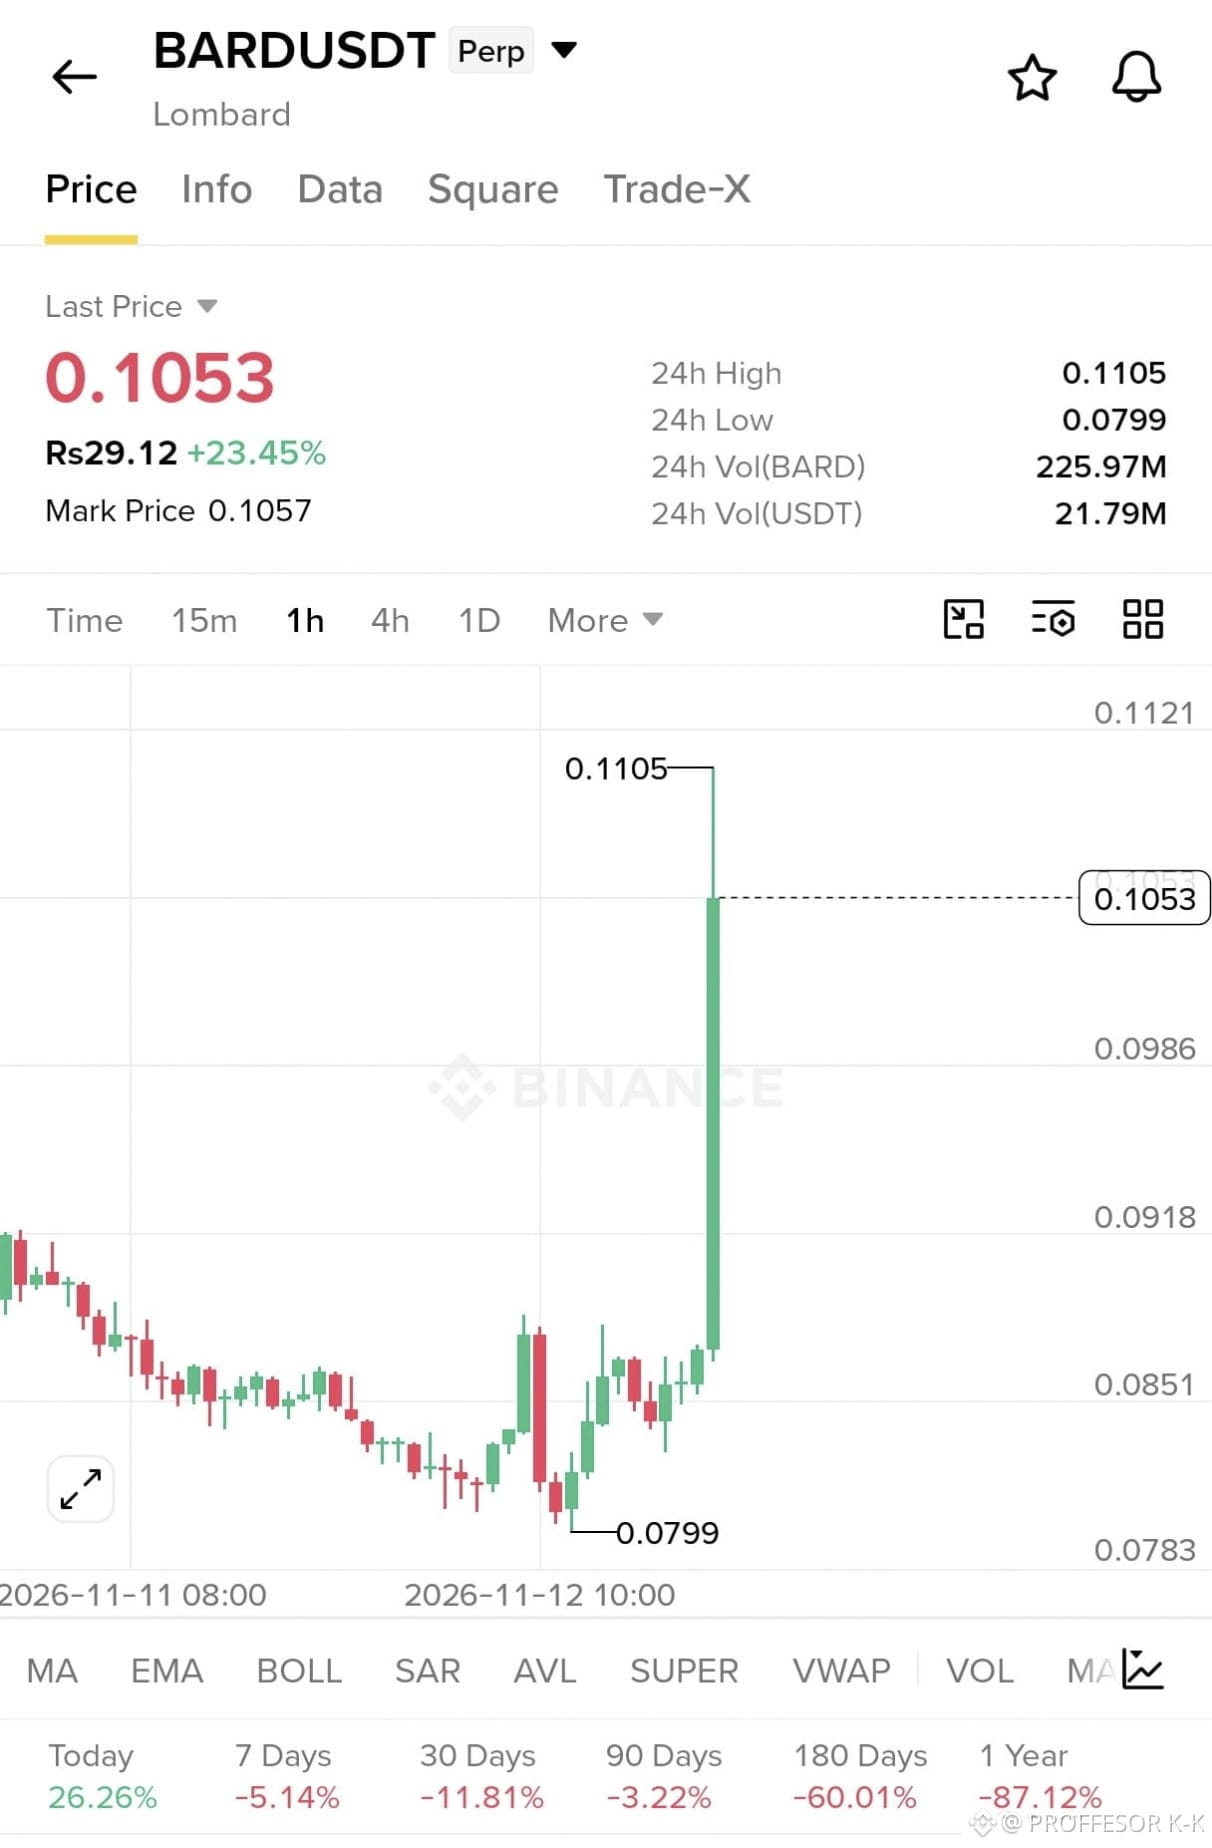
🚀 $BARD BULLISH BREAKOUT CONFIRMED! 📈
Buyers just flipped the 1H structure with an explosive vertical candle from $0.0799 to $0.1105, backed by $21.8M in 24h volume! 🔥
Instead of chasing the top, we are waiting for a healthy pullback to catch the next leg up:
🟢 LONG SETUP ($BARD )
Entry: $0.0986
TP1: $0.1053
TP2: $0.1105
TP3: $0.1121
SL: $0.0918
As long as $0.0918 holds, bulls remain in full control. A clean reclaim of $0.1053 clears the runway straight back to the highs! ⚡
NFA — Manage your risk & size accordingly. 🛡️
Are you longing this pullback? Drop your targets below! 👇 $BARD
#BARD #BinanceSquare #CryptoSignals #Altcoins #CryptoTrading
🚀 $BARD BULLISH BREAKOUT CONFIRMED! 📈
Buyers just flipped the 1H structure with an explosive vertical candle from $0.0799 to $0.1105, backed by $21.8M in 24h volume! 🔥
Instead of chasing the top, we are waiting for a healthy pullback to catch the next leg up:
🟢 LONG SETUP ($BARD )
Entry: $0.0986
TP1: $0.1053
TP2: $0.1105
TP3: $0.1121
SL: $0.0918
As long as $0.0918 holds, bulls remain in full control. A clean reclaim of $0.1053 clears the runway straight back to the highs! ⚡
NFA — Manage your risk & size accordingly. 🛡️
Are you longing this pullback? Drop your targets below! 👇 $BARD
#BARD #BinanceSquare #CryptoSignals #Altcoins #CryptoTrading
Buyers just flipped the 1H structure with an explosive vertical candle from $0.0799 to $0.1105, backed by $21.8M in 24h volume! 🔥
Instead of chasing the top, we are waiting for a healthy pullback to catch the next leg up:
🟢 LONG SETUP ($BARD )
Entry: $0.0986
TP1: $0.1053
TP2: $0.1105
TP3: $0.1121
SL: $0.0918
As long as $0.0918 holds, bulls remain in full control. A clean reclaim of $0.1053 clears the runway straight back to the highs! ⚡
NFA — Manage your risk & size accordingly. 🛡️
Are you longing this pullback? Drop your targets below! 👇 $BARD
#BARD #BinanceSquare #CryptoSignals #Altcoins #CryptoTrading
52

·
--
Partly True
📉 $BARD Technical Analysis: Struggling Near Historic Lows!
$BARD
Lombard's token is under heavy pressure right now. BARD is trading around the $0.09-$0.11 zone, which is roughly 95% below its all-time high.
📊 The Technical Picture:
The chart shows a clear bearish structure. Price is sitting well below key moving averages, and momentum indicators aren't showing any strong reversal signs yet.
⚠️ Fundamental Headwind:
The staking program for BARD was closed back in September. With its primary utility removed, the token is now mainly governance-only. This structural change has reduced demand significantly.
Unless we see a major catalyst or a break above the recent resistance, the path of least resistance remains down. Are you watching this one? 👇
#BARD #Lombard #Crypto #BinanceSquare
📉 $BARD Technical Analysis: Struggling Near Historic Lows!
$BARD
Lombard's token is under heavy pressure right now. BARD is trading around the $0.09-$0.11 zone, which is roughly 95% below its all-time high.
📊 The Technical Picture:
The chart shows a clear bearish structure. Price is sitting well below key moving averages, and momentum indicators aren't showing any strong reversal signs yet.
⚠️ Fundamental Headwind:
The staking program for BARD was closed back in September. With its primary utility removed, the token is now mainly governance-only. This structural change has reduced demand significantly.
Unless we see a major catalyst or a break above the recent resistance, the path of least resistance remains down. Are you watching this one? 👇
#BARD #Lombard #Crypto #BinanceSquare
$BARD
Lombard's token is under heavy pressure right now. BARD is trading around the $0.09-$0.11 zone, which is roughly 95% below its all-time high.
📊 The Technical Picture:
The chart shows a clear bearish structure. Price is sitting well below key moving averages, and momentum indicators aren't showing any strong reversal signs yet.
⚠️ Fundamental Headwind:
The staking program for BARD was closed back in September. With its primary utility removed, the token is now mainly governance-only. This structural change has reduced demand significantly.
Unless we see a major catalyst or a break above the recent resistance, the path of least resistance remains down. Are you watching this one? 👇
#BARD #Lombard #Crypto #BinanceSquare
6
75


·
--
Bullish
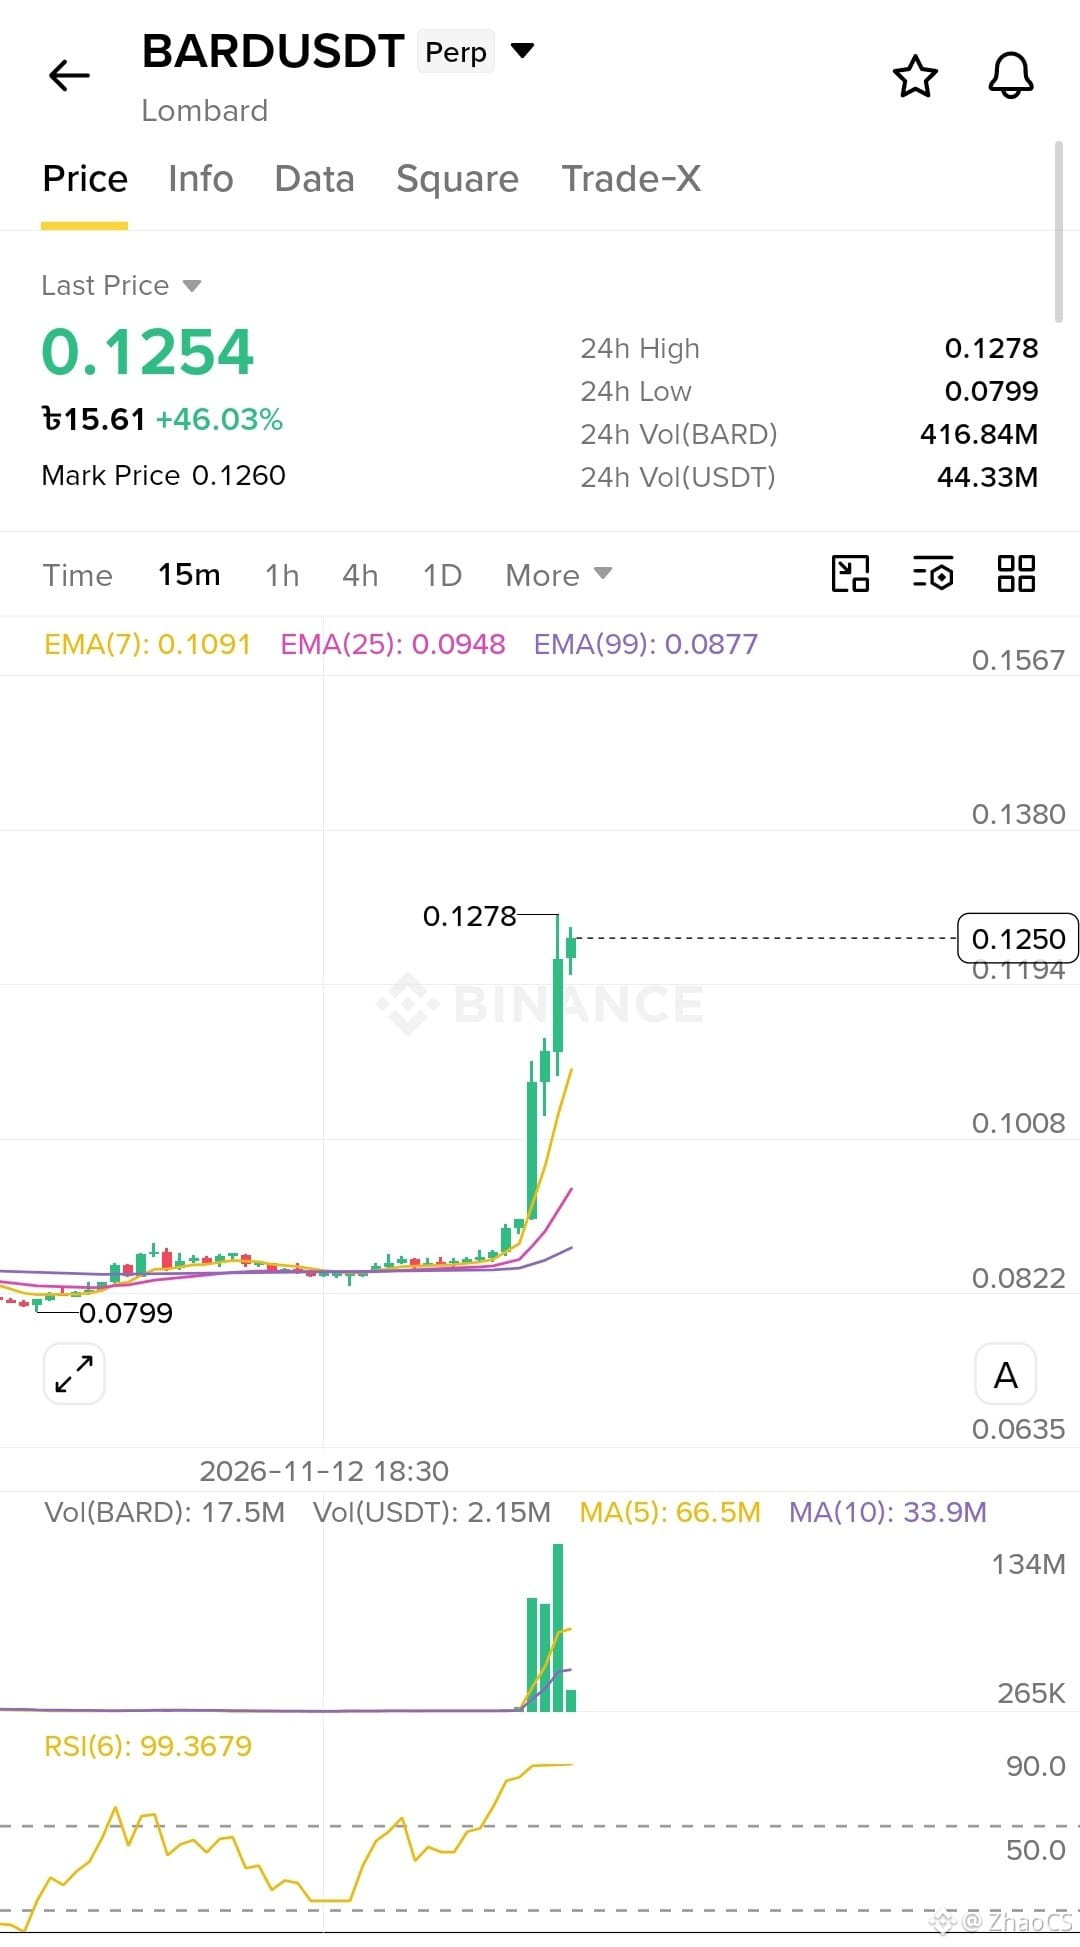
🟢$BARD is showing a powerful bullish breakout, surging 40.21% to $0.1198 after breaking above the previous consolidation zone and all major moving averages. Price is above MA(7) at $0.0891, MA(25) at $0.0952, MA(99) at $0.1063, with bullish Supertrend at $0.0838 and massive volume confirming strong buying pressure. However, RSI(6) at 89.03 indicates extreme overbought conditions, so a pullback toward $0.1090–$0.1060 is possible before another bullish continuation toward $0.1280.
Trade Setup
Entry: $0.1080 – $0.1130
Stop-Loss: $0.1030
Targets: $0.1280 - $0.1350 - $0.1450
Trade smart, protect your capital, and always manage your own risk. Personal analysis only not financial advice.
#BARD #BARDUSDT #CryptoSignals #BinanceSquare
{future}(BARDUSDT)
🟢$BARD is showing a powerful bullish breakout, surging 40.21% to $0.1198 after breaking above the previous consolidation zone and all major moving averages. Price is above MA(7) at $0.0891, MA(25) at $0.0952, MA(99) at $0.1063, with bullish Supertrend at $0.0838 and massive volume confirming strong buying pressure. However, RSI(6) at 89.03 indicates extreme overbought conditions, so a pullback toward $0.1090–$0.1060 is possible before another bullish continuation toward $0.1280.
Trade Setup
Entry: $0.1080 – $0.1130
Stop-Loss: $0.1030
Targets: $0.1280 - $0.1350 - $0.1450
Trade smart, protect your capital, and always manage your own risk. Personal analysis only not financial advice.
#BARD #BARDUSDT #CryptoSignals #BinanceSquare
Trade Setup
Entry: $0.1080 – $0.1130
Stop-Loss: $0.1030
Targets: $0.1280 - $0.1350 - $0.1450
Trade smart, protect your capital, and always manage your own risk. Personal analysis only not financial advice.
#BARD #BARDUSDT #CryptoSignals #BinanceSquare
1
348
Log in to explore more content
Join global crypto users on Binance Square
⚡️ Get latest and useful information about crypto.
💬 Trusted by the world’s largest crypto exchange.
👍 Discover real insights from verified creators.
Email / Phone number
Trending Topics
1
#HuangExitNvidiaStrategyInFocus
82,053 views
932 Discussing
2
#AnthropicRejectsIPODelayValuationinQuestion
680,198 views
5,211 Discussing
3
#BitMineReports$6.3BNetLossForFiscal2026
10,320 views
115 Discussing
4
#ChipStocksExtendLossesAfterNvidiaCEOChange
31,479 views
407 Discussing
5
#ThailandProposes$148KDailyStablecoinDepositWithdrawalCaps
3,000 views
45 Discussing
6
#CoreWeaveJumps10%On168%RevenueGrowth
184,136 views
1,645 Discussing
7
#ZcashFallsBelow$1000ForFirstTimeSinceSeptember
86,899 views
259 Discussing
8
#MSCIRemovalMayCurbStrategy’sBitcoinBuying
53,136 views
586 Discussing
9
#TradFiForBeginners
530,568 views
3,682 Discussing
10
#USJoblessClaimsRise
19.1M views
7,792 Discussing