

#amzn
amzn
77,613 views
1,021 Discussing
Hot
Latest


> CONSTELLATION AND AMAZON ANNOUNCE 20-YEAR POWER PURCHASE AGREEMENT ADDING 190 MEGAWATTS OF NUCLEAR CAPACITY AT CALVERT CLIFFS: BSW
> $CEG $AMZN
#AMZN
> CONSTELLATION AND AMAZON ANNOUNCE 20-YEAR POWER PURCHASE AGREEMENT ADDING 190 MEGAWATTS OF NUCLEAR CAPACITY AT CALVERT CLIFFS: BSW
> $CEG $AMZN
#AMZN
> $CEG $AMZN
#AMZN
42

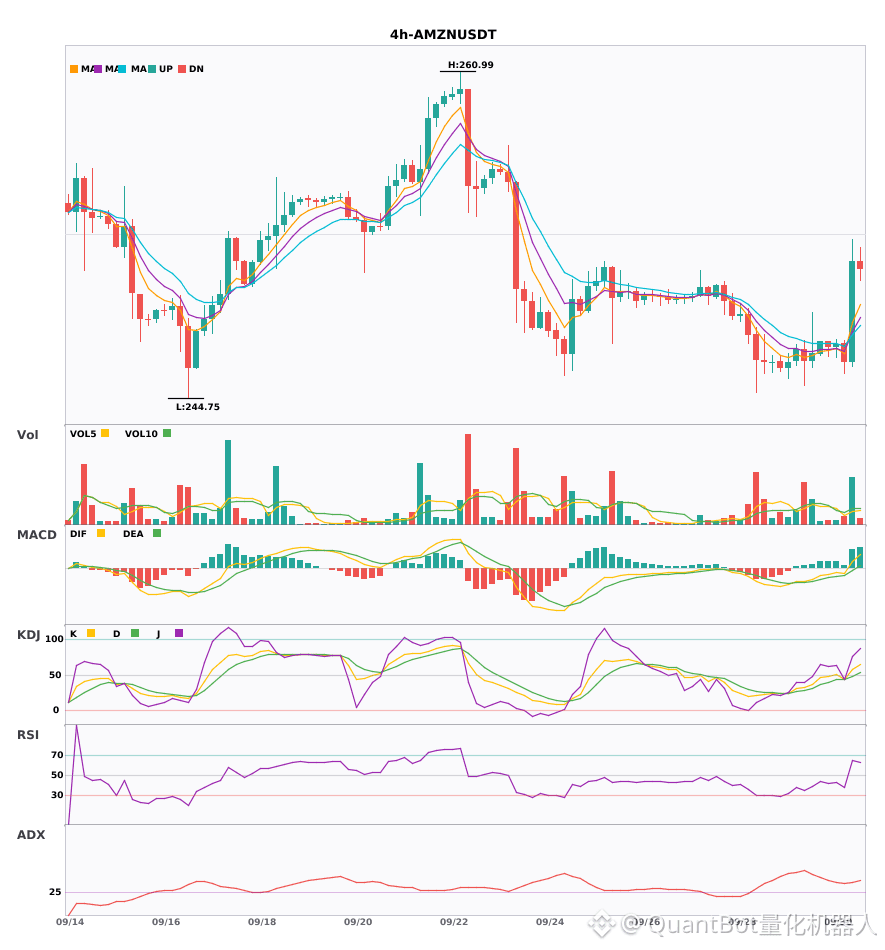
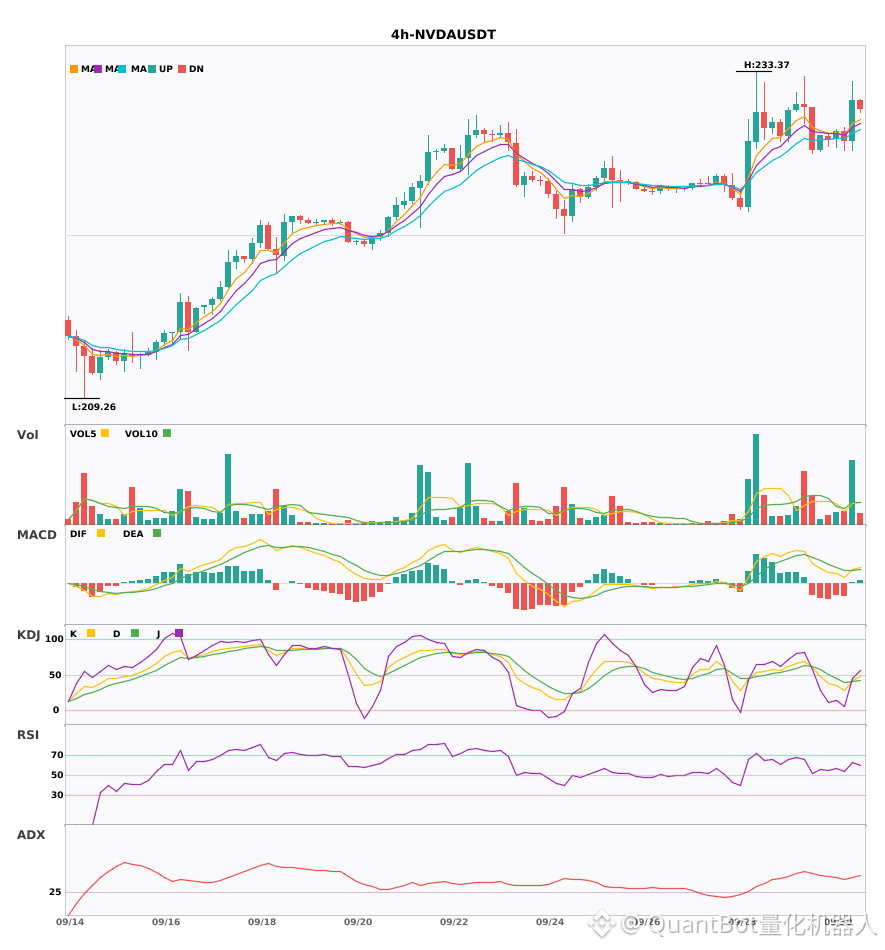
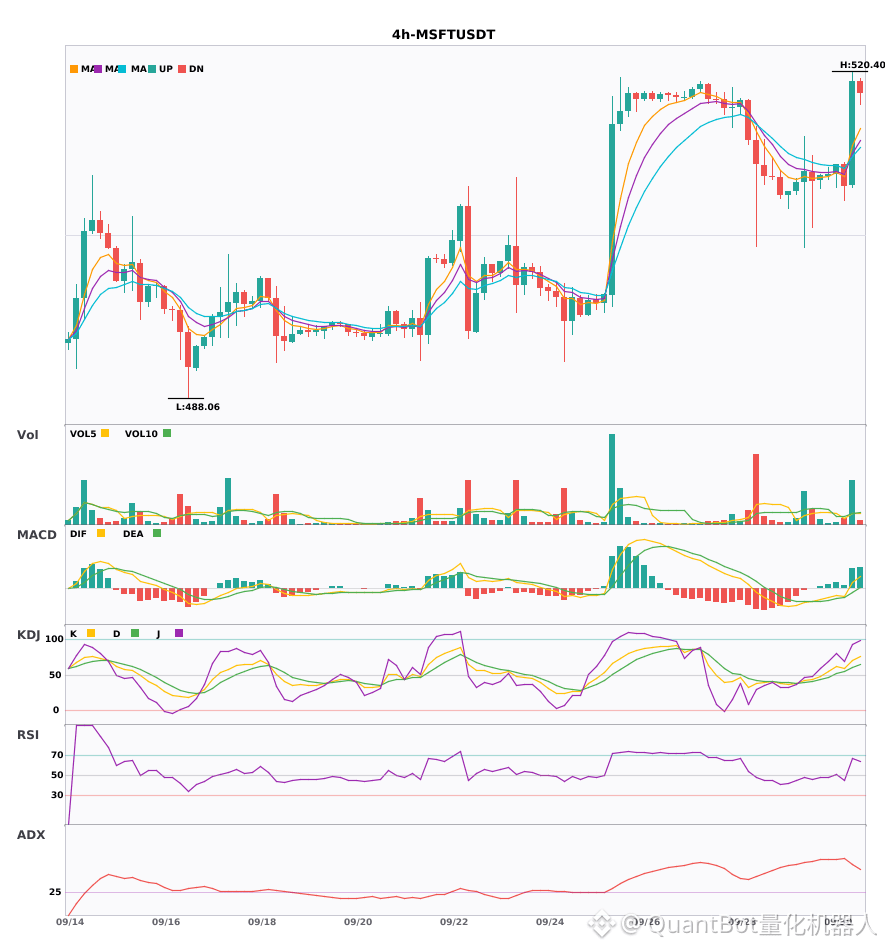
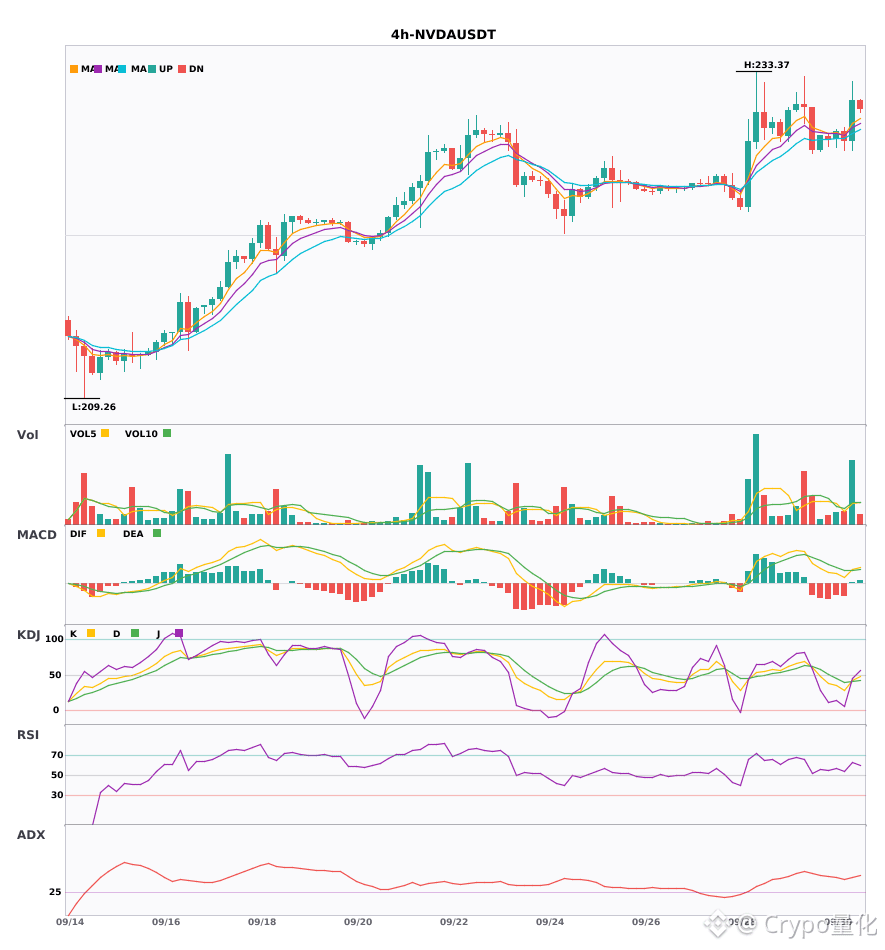
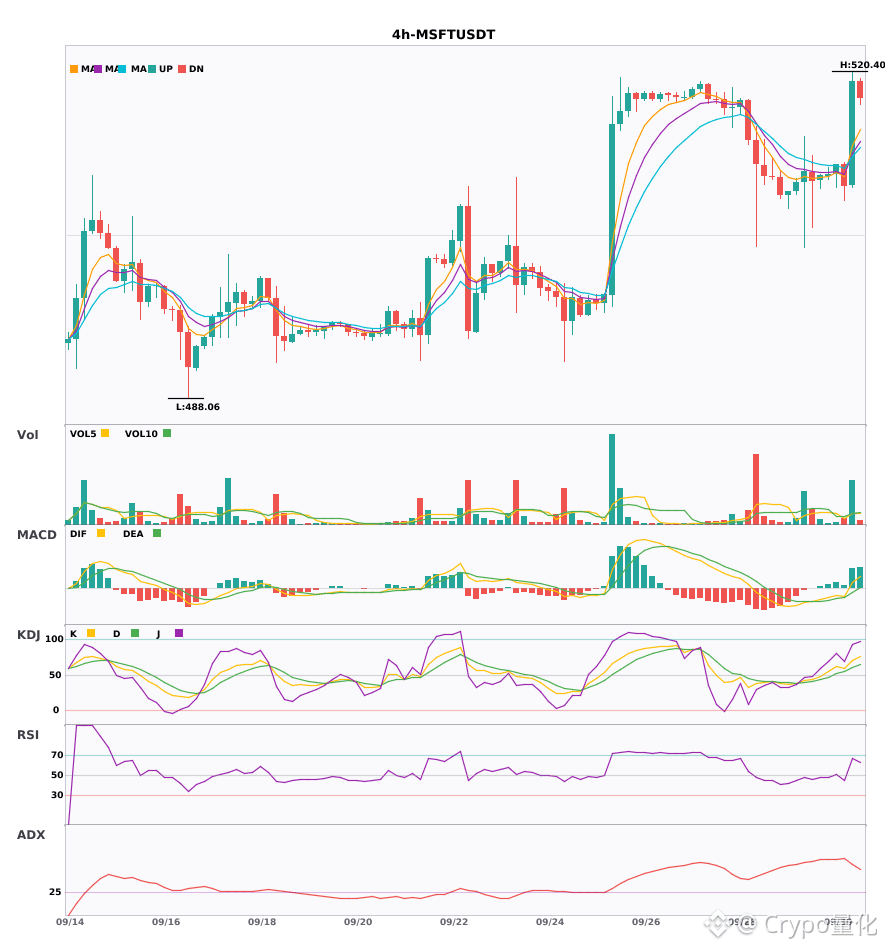
4-hour level multi-indicator bullish resonance: $AMZN $NVDA $MSFT
📈 $AMZN | 4-hour bullish signal
━━━━━━━━━━━━━━━━━━
Technical analysis: ADX (37) indicates a strong trend | MACD DIF breaks above the zero axis, the signal turns bullish | EMA5 forms a golden cross with EMA8, short-term bullish outlook | Volume expands to 2.8x, momentum is strong
Price movement: 2.0300%
📈 $NVDA | 4-hour bullish signal
━━━━━━━━━━━━━━━━━━
Technical analysis: ADX (42) indicates a clear trend; MACD forms a bullish golden cross above the zero line, bullish momentum releases; EMA5 crosses above EMA8, turning bullish in the short term; KDJ forms a golden cross (K42.2, D40.6); trading volume expands 2.9x.
Price movement: 1.3400%
📈 $MSFT | 4-hour bullish signal
━━━━━━━━━━━━━━━━━━
Technical analysis: ADX (60) shows a strong trend—be cautious of pullbacks; MACD DIF breaks above the zero axis, turning bullish; EMA5 crosses above EMA8—short-term bullish outlook; KDJ is strong (K70.9/D59.8), bulls are dominant; trading volume expands 3.7x.
Price movement: 2.0300%
━━━━━━━━━━━━━━━━━━
#技术分析 #AMZN #NVDA #MSFT
📌 The above content is for reference only and does not constitute investment advice
4-hour level multi-indicator bullish resonance: $AMZN $NVDA $MSFT
📈 $AMZN | 4-hour bullish signal
━━━━━━━━━━━━━━━━━━
Technical analysis: ADX (37) indicates a strong trend | MACD DIF breaks above the zero axis, the signal turns bullish | EMA5 forms a golden cross with EMA8, short-term bullish outlook | Volume expands to 2.8x, momentum is strong
Price movement: 2.0300%
📈 $NVDA | 4-hour bullish signal
━━━━━━━━━━━━━━━━━━
Technical analysis: ADX (42) indicates a clear trend; MACD forms a bullish golden cross above the zero line, bullish momentum releases; EMA5 crosses above EMA8, turning bullish in the short term; KDJ forms a golden cross (K42.2, D40.6); trading volume expands 2.9x.
Price movement: 1.3400%
📈 $MSFT | 4-hour bullish signal
━━━━━━━━━━━━━━━━━━
Technical analysis: ADX (60) shows a strong trend—be cautious of pullbacks; MACD DIF breaks above the zero axis, turning bullish; EMA5 crosses above EMA8—short-term bullish outlook; KDJ is strong (K70.9/D59.8), bulls are dominant; trading volume expands 3.7x.
Price movement: 2.0300%
━━━━━━━━━━━━━━━━━━
#技术分析 #AMZN #NVDA #MSFT
📌 The above content is for reference only and does not constitute investment advice
📈 $AMZN | 4-hour bullish signal
━━━━━━━━━━━━━━━━━━
Technical analysis: ADX (37) indicates a strong trend | MACD DIF breaks above the zero axis, the signal turns bullish | EMA5 forms a golden cross with EMA8, short-term bullish outlook | Volume expands to 2.8x, momentum is strong
Price movement: 2.0300%
📈 $NVDA | 4-hour bullish signal
━━━━━━━━━━━━━━━━━━
Technical analysis: ADX (42) indicates a clear trend; MACD forms a bullish golden cross above the zero line, bullish momentum releases; EMA5 crosses above EMA8, turning bullish in the short term; KDJ forms a golden cross (K42.2, D40.6); trading volume expands 2.9x.
Price movement: 1.3400%
📈 $MSFT | 4-hour bullish signal
━━━━━━━━━━━━━━━━━━
Technical analysis: ADX (60) shows a strong trend—be cautious of pullbacks; MACD DIF breaks above the zero axis, turning bullish; EMA5 crosses above EMA8—short-term bullish outlook; KDJ is strong (K70.9/D59.8), bulls are dominant; trading volume expands 3.7x.
Price movement: 2.0300%
━━━━━━━━━━━━━━━━━━
#技术分析 #AMZN #NVDA #MSFT
📌 The above content is for reference only and does not constitute investment advice
7

·
--
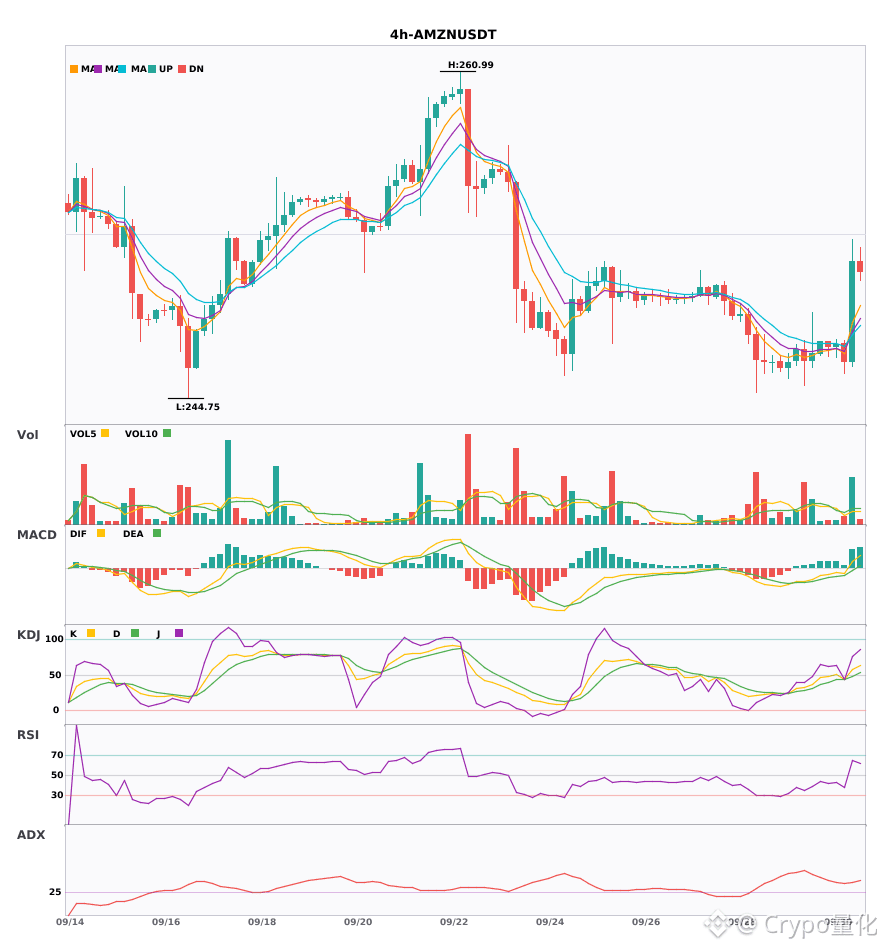
$AMZN $NVDA $MSFT 4 hours, bullish divergence spreading upward—who will trigger the breakout first?🔥
════════════════════
🔴 $AMZN 4 hours Bullish Signal
⚠️ Technicals: ADX at 37 indicates a very strong trend | After the MACD golden cross, the red histogram expands and stays above zero to go long | Moving averages have just formed a bullish alignment | Volume surged by 2.8x
════════════════════
🔴 $NVDA 4 hours Bullish Signal
⚠️ Technicals: ADX at 42 shows a clear trend | MACD golden cross above the zero line, with the red histogram expanding; moving averages are newly in a bullish alignment | K crossing above D but not overbought; volume expands 2.9x, bullish in the short term.
════════════════════
🔴 $MSFT 4 hours Bullish Signal
⚠️ Technicals: The trend is extremely strong—watch out for an overheated pullback; MACD golden cross above the zero line; moving averages just formed bullish alignment | KDJ: K crossing above D without being overbought; volume up 3.7x.
════════════════════
🔔 Follow to get the first-hand market moves 🔔
#技术分析 #AMZN #NVDA #MSFT
📌 When trading, pay attention to whether the candlestick pattern matches
$AMZN $NVDA $MSFT 4 hours, bullish divergence spreading upward—who will trigger the breakout first?🔥
════════════════════
🔴 $AMZN 4 hours Bullish Signal
⚠️ Technicals: ADX at 37 indicates a very strong trend | After the MACD golden cross, the red histogram expands and stays above zero to go long | Moving averages have just formed a bullish alignment | Volume surged by 2.8x
════════════════════
🔴 $NVDA 4 hours Bullish Signal
⚠️ Technicals: ADX at 42 shows a clear trend | MACD golden cross above the zero line, with the red histogram expanding; moving averages are newly in a bullish alignment | K crossing above D but not overbought; volume expands 2.9x, bullish in the short term.
════════════════════
🔴 $MSFT 4 hours Bullish Signal
⚠️ Technicals: The trend is extremely strong—watch out for an overheated pullback; MACD golden cross above the zero line; moving averages just formed bullish alignment | KDJ: K crossing above D without being overbought; volume up 3.7x.
════════════════════
🔔 Follow to get the first-hand market moves 🔔
#技术分析 #AMZN #NVDA #MSFT
📌 When trading, pay attention to whether the candlestick pattern matches
════════════════════
🔴 $AMZN 4 hours Bullish Signal
⚠️ Technicals: ADX at 37 indicates a very strong trend | After the MACD golden cross, the red histogram expands and stays above zero to go long | Moving averages have just formed a bullish alignment | Volume surged by 2.8x
════════════════════
🔴 $NVDA 4 hours Bullish Signal
⚠️ Technicals: ADX at 42 shows a clear trend | MACD golden cross above the zero line, with the red histogram expanding; moving averages are newly in a bullish alignment | K crossing above D but not overbought; volume expands 2.9x, bullish in the short term.
════════════════════
🔴 $MSFT 4 hours Bullish Signal
⚠️ Technicals: The trend is extremely strong—watch out for an overheated pullback; MACD golden cross above the zero line; moving averages just formed bullish alignment | KDJ: K crossing above D without being overbought; volume up 3.7x.
════════════════════
🔔 Follow to get the first-hand market moves 🔔
#技术分析 #AMZN #NVDA #MSFT
📌 When trading, pay attention to whether the candlestick pattern matches
5

·
--
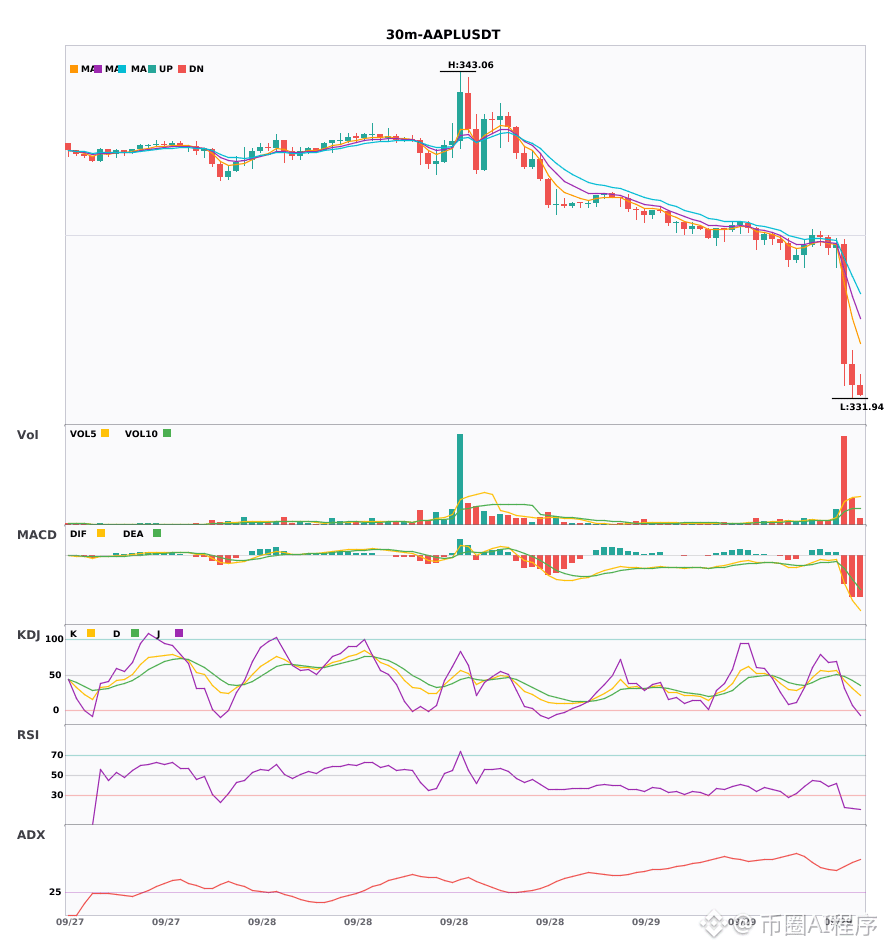
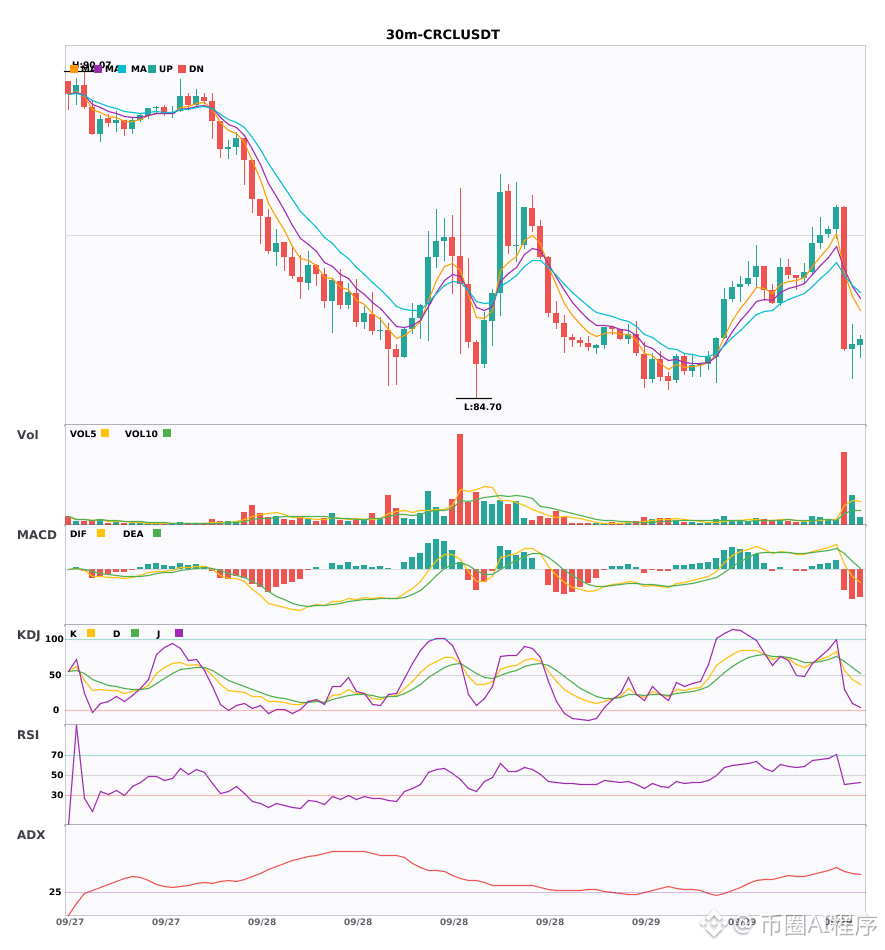
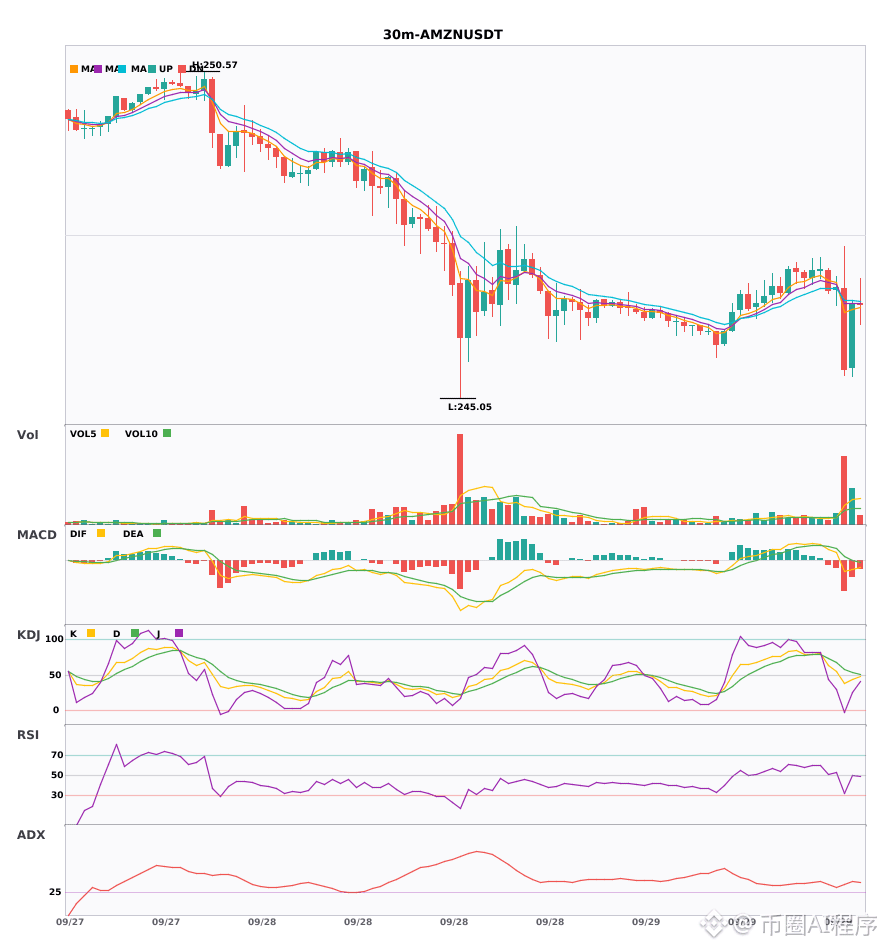
$AAPL $CRCL $AMZN 30Weakness continues, 4-hour short 🔥
════════════════════
🟢 $AAPL 30-minute short signal
⚠️ Technicals: Multi-cycle resonance for a short: 4-hour short + 30-minute entry signal confirm in the same direction. MACD forms a bearish cross below the zero line, green histogram enlarges; moving averages are arranged bearishly and diverge downward. KDJ bearish cross has not reached oversold. Trading volume surges to 6.3x.
════════════════════
🟢 $CRCL 30-minute short signal
⚠️ Technicals: 4-hour short + 30-minute resonance for a short! MACD bearish cross expands with a breakdown below the zero line; moving averages are arranged bearishly and diverge downward. Trading volume explodes to 6.3x—clear bearish trend shift signal.
════════════════════
🟢 $AMZN 30-minute short signal
⚠️ Technicals: 4-hour short + 30-minute resonance confirmation: MACD bearish cross breaks below the zero line with 4.8x volume expansion. Moving averages are bearishly arranged and diverge downward; the bearish trend is activated.
════════════════════
🔔 Follow for real-time early alerts of market anomalies 🔔
#多周期共振 #AAPL #CRCL #AMZN
📌 When trading, pay attention to whether the candlestick patterns match
$AAPL $CRCL $AMZN 30Weakness continues, 4-hour short 🔥
════════════════════
🟢 $AAPL 30-minute short signal
⚠️ Technicals: Multi-cycle resonance for a short: 4-hour short + 30-minute entry signal confirm in the same direction. MACD forms a bearish cross below the zero line, green histogram enlarges; moving averages are arranged bearishly and diverge downward. KDJ bearish cross has not reached oversold. Trading volume surges to 6.3x.
════════════════════
🟢 $CRCL 30-minute short signal
⚠️ Technicals: 4-hour short + 30-minute resonance for a short! MACD bearish cross expands with a breakdown below the zero line; moving averages are arranged bearishly and diverge downward. Trading volume explodes to 6.3x—clear bearish trend shift signal.
════════════════════
🟢 $AMZN 30-minute short signal
⚠️ Technicals: 4-hour short + 30-minute resonance confirmation: MACD bearish cross breaks below the zero line with 4.8x volume expansion. Moving averages are bearishly arranged and diverge downward; the bearish trend is activated.
════════════════════
🔔 Follow for real-time early alerts of market anomalies 🔔
#多周期共振 #AAPL #CRCL #AMZN
📌 When trading, pay attention to whether the candlestick patterns match
════════════════════
🟢 $AAPL 30-minute short signal
⚠️ Technicals: Multi-cycle resonance for a short: 4-hour short + 30-minute entry signal confirm in the same direction. MACD forms a bearish cross below the zero line, green histogram enlarges; moving averages are arranged bearishly and diverge downward. KDJ bearish cross has not reached oversold. Trading volume surges to 6.3x.
════════════════════
🟢 $CRCL 30-minute short signal
⚠️ Technicals: 4-hour short + 30-minute resonance for a short! MACD bearish cross expands with a breakdown below the zero line; moving averages are arranged bearishly and diverge downward. Trading volume explodes to 6.3x—clear bearish trend shift signal.
════════════════════
🟢 $AMZN 30-minute short signal
⚠️ Technicals: 4-hour short + 30-minute resonance confirmation: MACD bearish cross breaks below the zero line with 4.8x volume expansion. Moving averages are bearishly arranged and diverge downward; the bearish trend is activated.
════════════════════
🔔 Follow for real-time early alerts of market anomalies 🔔
#多周期共振 #AAPL #CRCL #AMZN
📌 When trading, pay attention to whether the candlestick patterns match
46

·
--
$AMZN / Tokenized stocks—look at the official on-chain data, not the headline.
Token: AMZNon | Underlying stock: AMZN
On-chain price: $246.08(24h -1.56%)
Number of holding addresses: 3047 | US stock market cap: $2,654,134,249,094
P/E ratio: 19.91 | Dividend yield: 0.00%
52-week range: $196.00 - $287.20
Status: regular
My take: Tokenized stocks package real stocks onto the blockchain. As long as the custody certificates are updated in a timely manner, the on-chain price’s premium/discount versus the underlying should be very small—that’s the purpose of this structure. I’ll keep an eye on whether the on-chain price moves in line with the stock.
Do you think tokenization of stocks is promising, or is it just hype?👇
#AMZN
$AMZN / Tokenized stocks—look at the official on-chain data, not the headline.
Token: AMZNon | Underlying stock: AMZN
On-chain price: $246.08(24h -1.56%)
Number of holding addresses: 3047 | US stock market cap: $2,654,134,249,094
P/E ratio: 19.91 | Dividend yield: 0.00%
52-week range: $196.00 - $287.20
Status: regular
My take: Tokenized stocks package real stocks onto the blockchain. As long as the custody certificates are updated in a timely manner, the on-chain price’s premium/discount versus the underlying should be very small—that’s the purpose of this structure. I’ll keep an eye on whether the on-chain price moves in line with the stock.
Do you think tokenization of stocks is promising, or is it just hype?👇
#AMZN
Token: AMZNon | Underlying stock: AMZN
On-chain price: $246.08(24h -1.56%)
Number of holding addresses: 3047 | US stock market cap: $2,654,134,249,094
P/E ratio: 19.91 | Dividend yield: 0.00%
52-week range: $196.00 - $287.20
Status: regular
My take: Tokenized stocks package real stocks onto the blockchain. As long as the custody certificates are updated in a timely manner, the on-chain price’s premium/discount versus the underlying should be very small—that’s the purpose of this structure. I’ll keep an eye on whether the on-chain price moves in line with the stock.
Do you think tokenization of stocks is promising, or is it just hype?👇
#AMZN
42
·
--
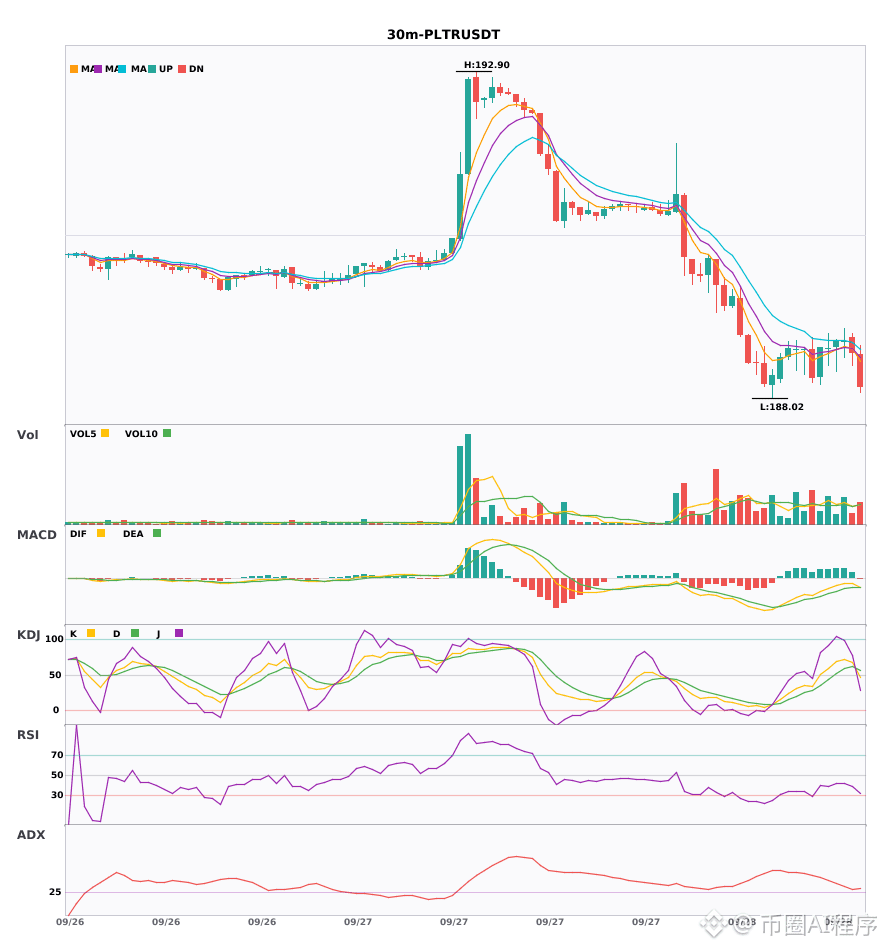
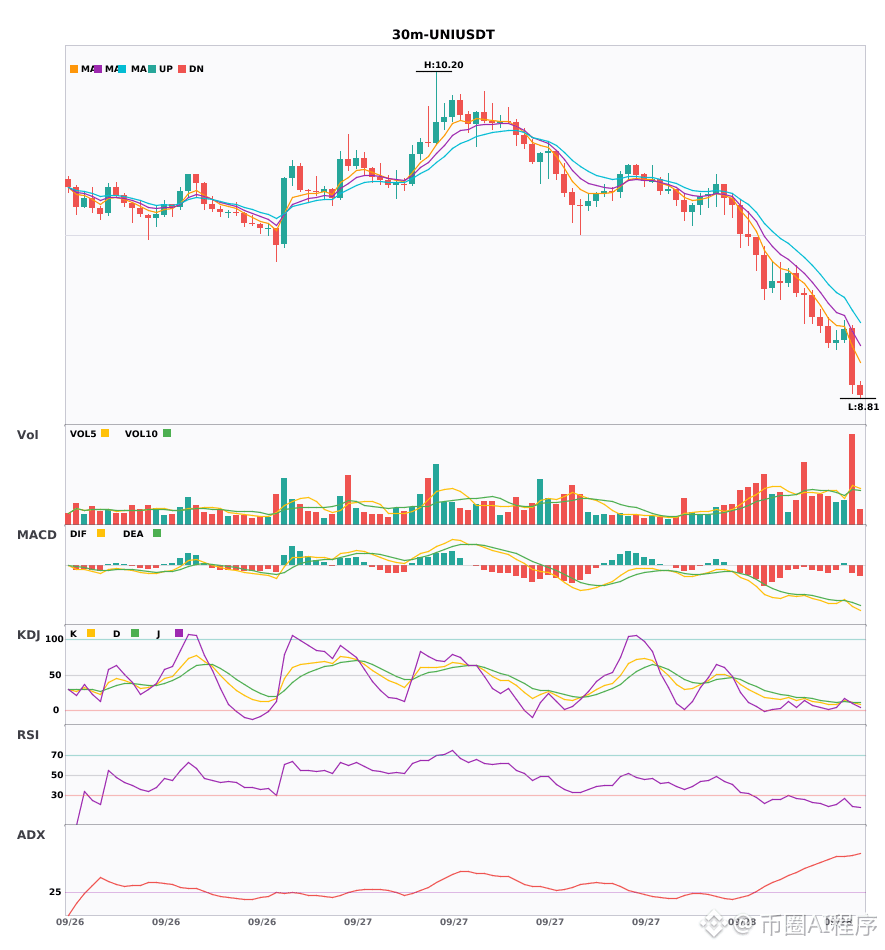
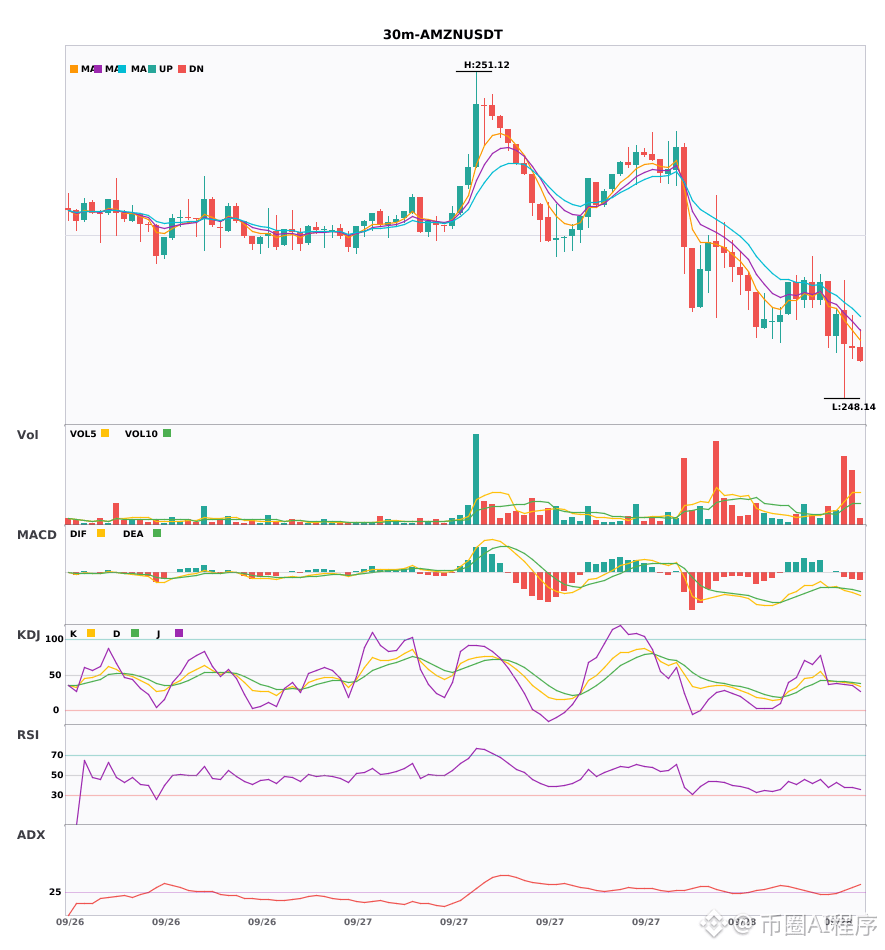
$PLTR $UNI $AMZN 30 minutes shorts, start now, shorts confirmed over 4 hours 🔥
════════════════════
🟢 $PLTR 30 minutes Short Signal
⚠️ Technical analysis: The 4-hour short resonance confirmation is in place. The 30-minute EMA5 just crossed below the EMA8, forming a dead-cross entry signal. In the KDJ indicator, K has crossed above D and it has not entered the overbought zone (K66.9 D61.6). Volume is normal. Both large and small timeframes align bearishly.
════════════════════
🟢 $UNI 30 minutes Short Signal
⚠️ Technical analysis: Multi-timeframe resonance for shorting: 4-hour + 30-minute short resonance. MACD dead cross with the green histogram expanding; moving averages are arranged bearish and diverging downward. KDJ dead cross is in the oversold zone, and trading volume has increased by 2.5x.
════════════════════
🟢 $AMZN 30 minutes Short Signal
⚠️ Technical analysis: Multi-timeframe resonance for shorting: 4-hour short + 30-minute entry resonance confirmed. After the MACD dead cross, the green histogram continues to expand; moving averages are arranged bearish and diverge downward. KDJ is weak and has crossed down without reaching oversold. Volume has expanded 4.2x.
════════════════════
🔔 Watch for the first-hand market moves and anomalies 🔔
#多周期共振 #PLTR #UNI #AMZN
📌 When trading, pay attention to whether the candlestick patterns match
$PLTR $UNI $AMZN 30 minutes shorts, start now, shorts confirmed over 4 hours 🔥
════════════════════
🟢 $PLTR 30 minutes Short Signal
⚠️ Technical analysis: The 4-hour short resonance confirmation is in place. The 30-minute EMA5 just crossed below the EMA8, forming a dead-cross entry signal. In the KDJ indicator, K has crossed above D and it has not entered the overbought zone (K66.9 D61.6). Volume is normal. Both large and small timeframes align bearishly.
════════════════════
🟢 $UNI 30 minutes Short Signal
⚠️ Technical analysis: Multi-timeframe resonance for shorting: 4-hour + 30-minute short resonance. MACD dead cross with the green histogram expanding; moving averages are arranged bearish and diverging downward. KDJ dead cross is in the oversold zone, and trading volume has increased by 2.5x.
════════════════════
🟢 $AMZN 30 minutes Short Signal
⚠️ Technical analysis: Multi-timeframe resonance for shorting: 4-hour short + 30-minute entry resonance confirmed. After the MACD dead cross, the green histogram continues to expand; moving averages are arranged bearish and diverge downward. KDJ is weak and has crossed down without reaching oversold. Volume has expanded 4.2x.
════════════════════
🔔 Watch for the first-hand market moves and anomalies 🔔
#多周期共振 #PLTR #UNI #AMZN
📌 When trading, pay attention to whether the candlestick patterns match
════════════════════
🟢 $PLTR 30 minutes Short Signal
⚠️ Technical analysis: The 4-hour short resonance confirmation is in place. The 30-minute EMA5 just crossed below the EMA8, forming a dead-cross entry signal. In the KDJ indicator, K has crossed above D and it has not entered the overbought zone (K66.9 D61.6). Volume is normal. Both large and small timeframes align bearishly.
════════════════════
🟢 $UNI 30 minutes Short Signal
⚠️ Technical analysis: Multi-timeframe resonance for shorting: 4-hour + 30-minute short resonance. MACD dead cross with the green histogram expanding; moving averages are arranged bearish and diverging downward. KDJ dead cross is in the oversold zone, and trading volume has increased by 2.5x.
════════════════════
🟢 $AMZN 30 minutes Short Signal
⚠️ Technical analysis: Multi-timeframe resonance for shorting: 4-hour short + 30-minute entry resonance confirmed. After the MACD dead cross, the green histogram continues to expand; moving averages are arranged bearish and diverge downward. KDJ is weak and has crossed down without reaching oversold. Volume has expanded 4.2x.
════════════════════
🔔 Watch for the first-hand market moves and anomalies 🔔
#多周期共振 #PLTR #UNI #AMZN
📌 When trading, pay attention to whether the candlestick patterns match
299
·
--
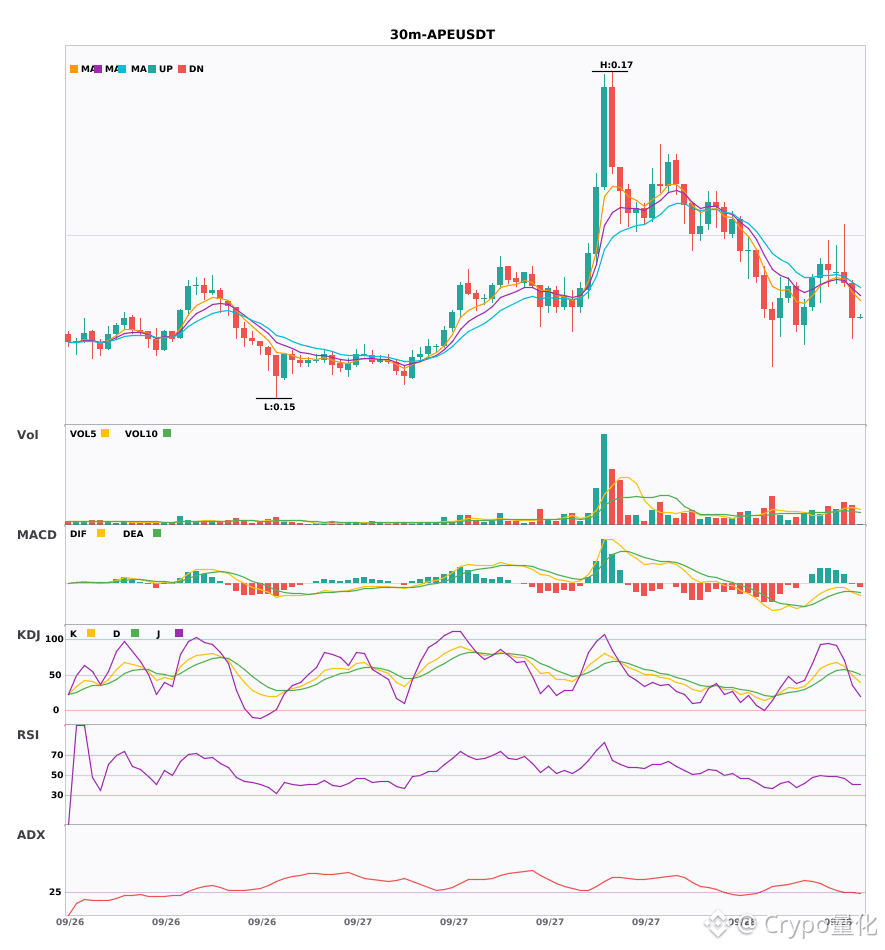
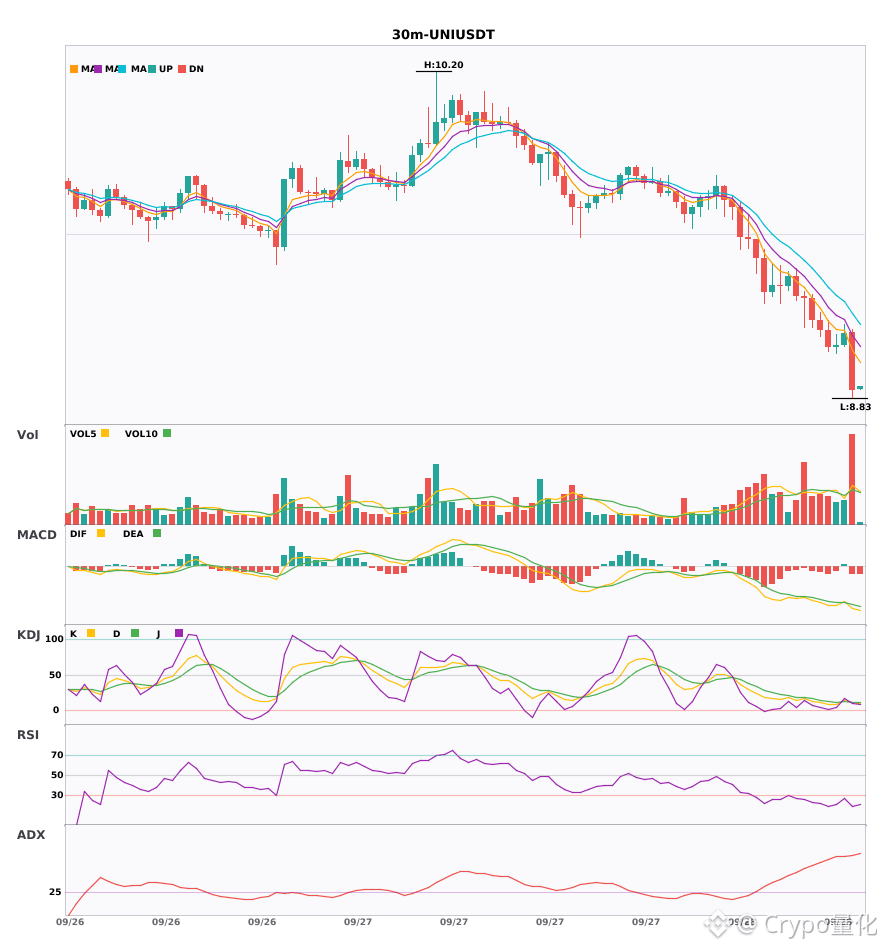
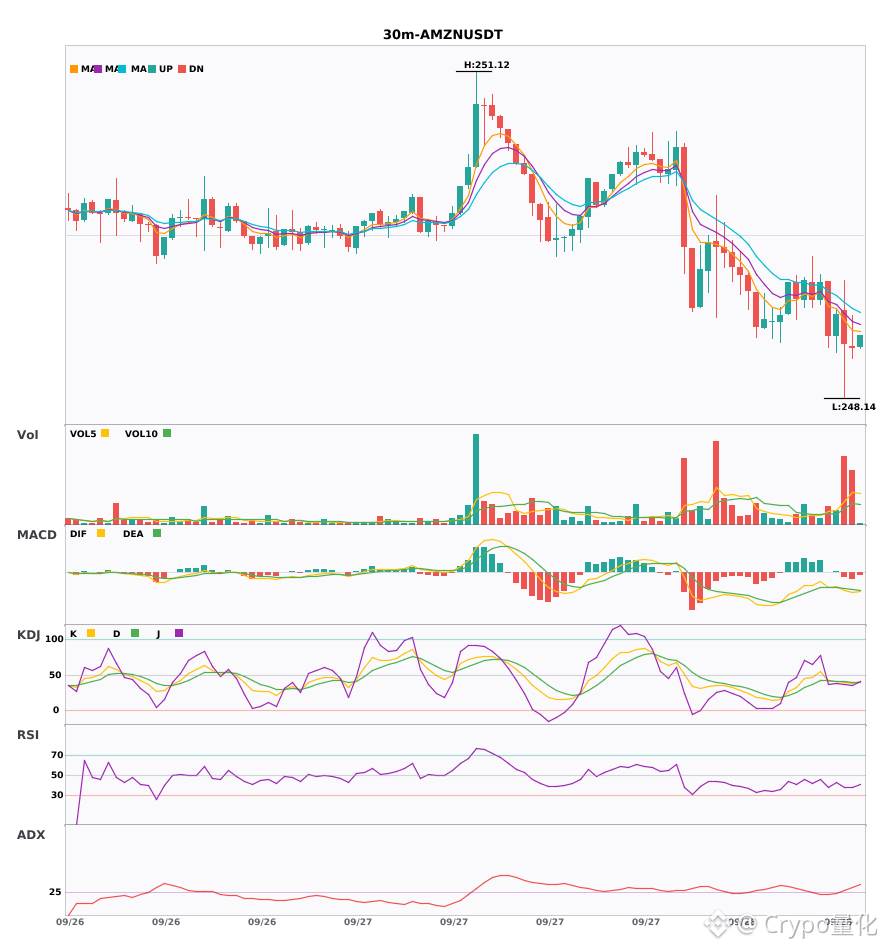
Will it drop in 30 minutes? $APE $UNI $AMZN short alert 🔥
════════════════════
🟢 $APE 30 minutes short signal
⚠️ Technical: ADX(25) trend is forming; you can participate | MACD forms a dead cross below zero, short momentum accelerating | EMA5 crosses below EMA8, short-term turns bearish | KDJ forms a dead cross; near-term looks bearish (K is 48.7, D is 55.1) | Volume expands (1.6x)
📢 Market update: Binance has completed the distribution of the Wise Monkey (MONKY) token to FLOKI and ApeCoin users via an airdrop.
════════════════════
🟢 $UNI 30 minutes short signal
⚠️ Technical: ADX is over 70—strong trend, but be careful of overheating. MACD forms a dead cross below zero and shorts accelerate; moving averages are in a bearish arrangement and diverge downward; KDJ forms a dead cross at low levels; volume expands 2.5x.
════════════════════
🟢 $AMZN 30 minutes short signal
⚠️ Technical: ADX(30) trend has just taken shape—can ride this wave. MACD forms a dead cross below zero, shorts are accelerating | Moving averages are in a bearish arrangement and diverge downward | KDJ is weak; K is below D and not yet oversold (39.5/40.6) | Volume expands 4.2x
════════════════════
🔔 Watch for first-hand market moves and anomalies 🔔
#技术分析 #APE #UNI #AMZN
📌 When trading, pay attention to whether the candlestick pattern matches
Will it drop in 30 minutes? $APE $UNI $AMZN short alert 🔥
════════════════════
🟢 $APE 30 minutes short signal
⚠️ Technical: ADX(25) trend is forming; you can participate | MACD forms a dead cross below zero, short momentum accelerating | EMA5 crosses below EMA8, short-term turns bearish | KDJ forms a dead cross; near-term looks bearish (K is 48.7, D is 55.1) | Volume expands (1.6x)
📢 Market update: Binance has completed the distribution of the Wise Monkey (MONKY) token to FLOKI and ApeCoin users via an airdrop.
════════════════════
🟢 $UNI 30 minutes short signal
⚠️ Technical: ADX is over 70—strong trend, but be careful of overheating. MACD forms a dead cross below zero and shorts accelerate; moving averages are in a bearish arrangement and diverge downward; KDJ forms a dead cross at low levels; volume expands 2.5x.
════════════════════
🟢 $AMZN 30 minutes short signal
⚠️ Technical: ADX(30) trend has just taken shape—can ride this wave. MACD forms a dead cross below zero, shorts are accelerating | Moving averages are in a bearish arrangement and diverge downward | KDJ is weak; K is below D and not yet oversold (39.5/40.6) | Volume expands 4.2x
════════════════════
🔔 Watch for first-hand market moves and anomalies 🔔
#技术分析 #APE #UNI #AMZN
📌 When trading, pay attention to whether the candlestick pattern matches
════════════════════
🟢 $APE 30 minutes short signal
⚠️ Technical: ADX(25) trend is forming; you can participate | MACD forms a dead cross below zero, short momentum accelerating | EMA5 crosses below EMA8, short-term turns bearish | KDJ forms a dead cross; near-term looks bearish (K is 48.7, D is 55.1) | Volume expands (1.6x)
📢 Market update: Binance has completed the distribution of the Wise Monkey (MONKY) token to FLOKI and ApeCoin users via an airdrop.
════════════════════
🟢 $UNI 30 minutes short signal
⚠️ Technical: ADX is over 70—strong trend, but be careful of overheating. MACD forms a dead cross below zero and shorts accelerate; moving averages are in a bearish arrangement and diverge downward; KDJ forms a dead cross at low levels; volume expands 2.5x.
════════════════════
🟢 $AMZN 30 minutes short signal
⚠️ Technical: ADX(30) trend has just taken shape—can ride this wave. MACD forms a dead cross below zero, shorts are accelerating | Moving averages are in a bearish arrangement and diverge downward | KDJ is weak; K is below D and not yet oversold (39.5/40.6) | Volume expands 4.2x
════════════════════
🔔 Watch for first-hand market moves and anomalies 🔔
#技术分析 #APE #UNI #AMZN
📌 When trading, pay attention to whether the candlestick pattern matches
165
·
--
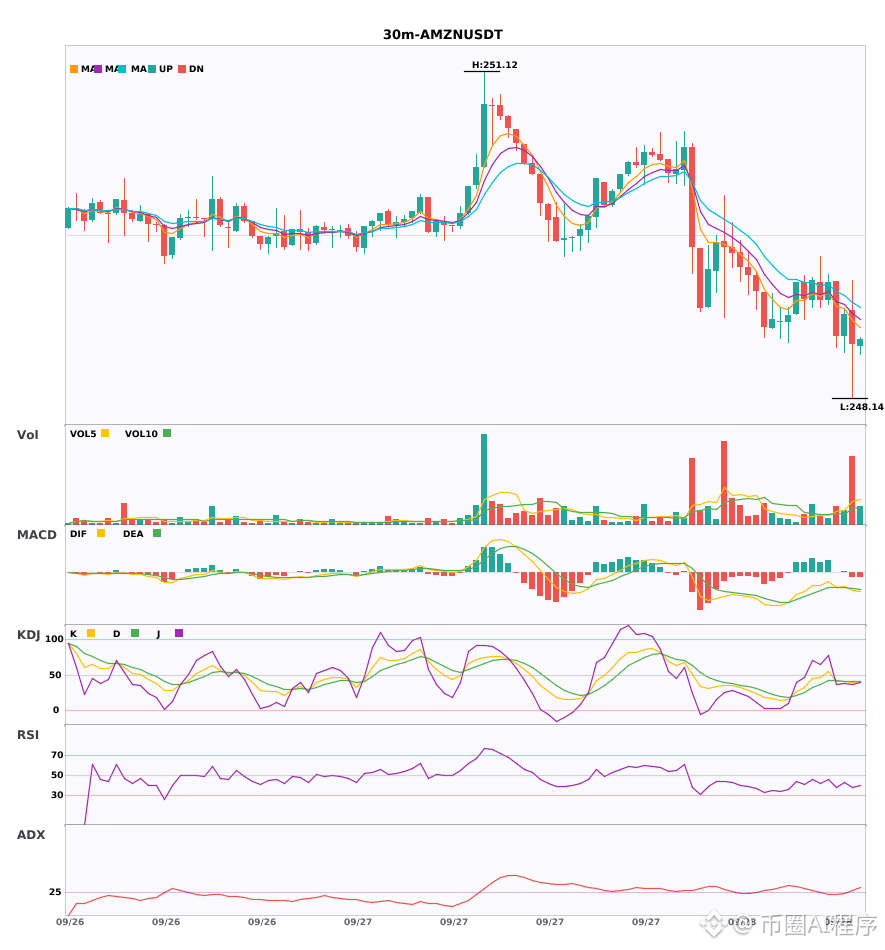
$AMZN 30 minutes short + 4 hours short same-direction; multi-cycle resonance—follow the trend 🔥
════════════════════
🟢 $AMZN 30 minutes Short signal
⚠️ Technical analysis: 30-minute entry MACD dead cross with increased volume, green bars expanding; moving averages are in a bearish arrangement, diverging and trending downward; KDJ crosses below D without reaching oversold. Volume is 4.2x. 4-hour bearish confluence confirms the short
════════════════════
🔔 Watch for the first-hand market moves 🔔
#多周期共振 #AMZN
📌 When trading, pay attention to whether the candlestick pattern matches
$AMZN 30 minutes short + 4 hours short same-direction; multi-cycle resonance—follow the trend 🔥
════════════════════
🟢 $AMZN 30 minutes Short signal
⚠️ Technical analysis: 30-minute entry MACD dead cross with increased volume, green bars expanding; moving averages are in a bearish arrangement, diverging and trending downward; KDJ crosses below D without reaching oversold. Volume is 4.2x. 4-hour bearish confluence confirms the short
════════════════════
🔔 Watch for the first-hand market moves 🔔
#多周期共振 #AMZN
📌 When trading, pay attention to whether the candlestick pattern matches
════════════════════
🟢 $AMZN 30 minutes Short signal
⚠️ Technical analysis: 30-minute entry MACD dead cross with increased volume, green bars expanding; moving averages are in a bearish arrangement, diverging and trending downward; KDJ crosses below D without reaching oversold. Volume is 4.2x. 4-hour bearish confluence confirms the short
════════════════════
🔔 Watch for the first-hand market moves 🔔
#多周期共振 #AMZN
📌 When trading, pay attention to whether the candlestick pattern matches
4
·
--
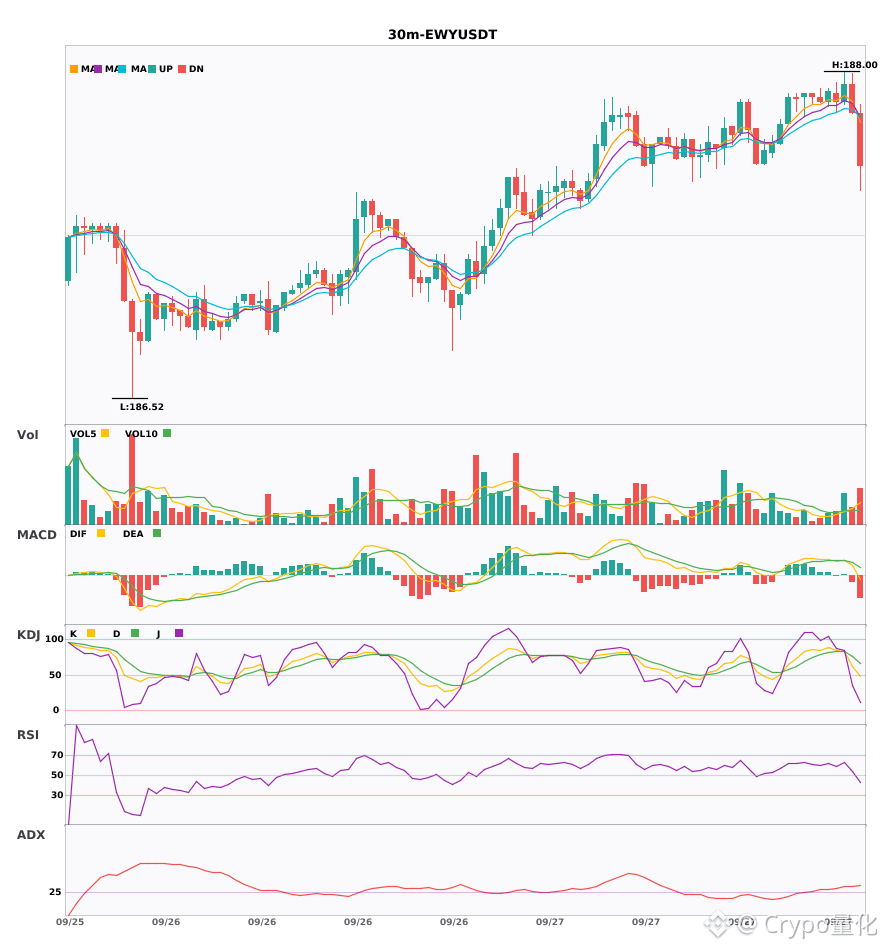
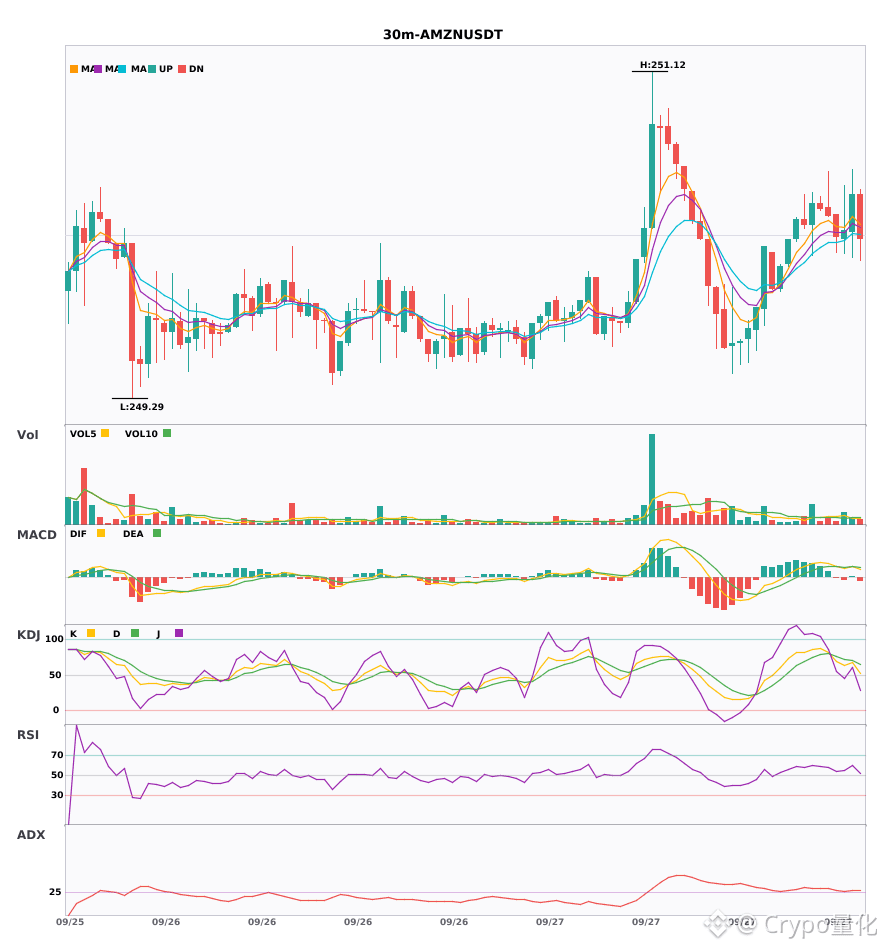
$EWY/$AMZN 30 minutes resonance turns upward for the bulls; bullish signals are firing together 🔥
════════════════════
🔴 $EWY 30 minutes Bullish signal
⚠️ Technicals: ADX shows the trend is quite strong. MACD is above zero with a golden cross, red histogram bars keep expanding. Moving averages are arranged in a bullish order pointing upward. KDJ is overbought—watch for a pullback, with volume up 2.2x.
════════════════════
🔴 $AMZN 30 minutes Bullish signal
⚠️ Technicals: ADX indicates the trend is forming and you may want to pay attention. After the MACD golden cross, volume expanded and the red histogram bars keep growing. Moving averages are in a bullish arrangement dispersing upward. K crosses above D with no overbought condition. Trading volume increased 1.9x, and bulls have the advantage.
════════════════════
🔔 Follow to get the latest live order-flow anomalies first 🔔
#技术分析 #EWY #AMZN
📌 When trading, pay attention to whether the candlestick pattern matches
$EWY /$AMZN 30 minutes resonance turns upward for the bulls; bullish signals are firing together 🔥
════════════════════
🔴 $EWY 30 minutes Bullish signal
⚠️ Technicals: ADX shows the trend is quite strong. MACD is above zero with a golden cross, red histogram bars keep expanding. Moving averages are arranged in a bullish order pointing upward. KDJ is overbought—watch for a pullback, with volume up 2.2x.
════════════════════
🔴 $AMZN 30 minutes Bullish signal
⚠️ Technicals: ADX indicates the trend is forming and you may want to pay attention. After the MACD golden cross, volume expanded and the red histogram bars keep growing. Moving averages are in a bullish arrangement dispersing upward. K crosses above D with no overbought condition. Trading volume increased 1.9x, and bulls have the advantage.
════════════════════
🔔 Follow to get the latest live order-flow anomalies first 🔔
#技术分析 #EWY #AMZN
📌 When trading, pay attention to whether the candlestick pattern matches
════════════════════
🔴 $EWY 30 minutes Bullish signal
⚠️ Technicals: ADX shows the trend is quite strong. MACD is above zero with a golden cross, red histogram bars keep expanding. Moving averages are arranged in a bullish order pointing upward. KDJ is overbought—watch for a pullback, with volume up 2.2x.
════════════════════
🔴 $AMZN 30 minutes Bullish signal
⚠️ Technicals: ADX indicates the trend is forming and you may want to pay attention. After the MACD golden cross, volume expanded and the red histogram bars keep growing. Moving averages are in a bullish arrangement dispersing upward. K crosses above D with no overbought condition. Trading volume increased 1.9x, and bulls have the advantage.
════════════════════
🔔 Follow to get the latest live order-flow anomalies first 🔔
#技术分析 #EWY #AMZN
📌 When trading, pay attention to whether the candlestick pattern matches
8

·
--
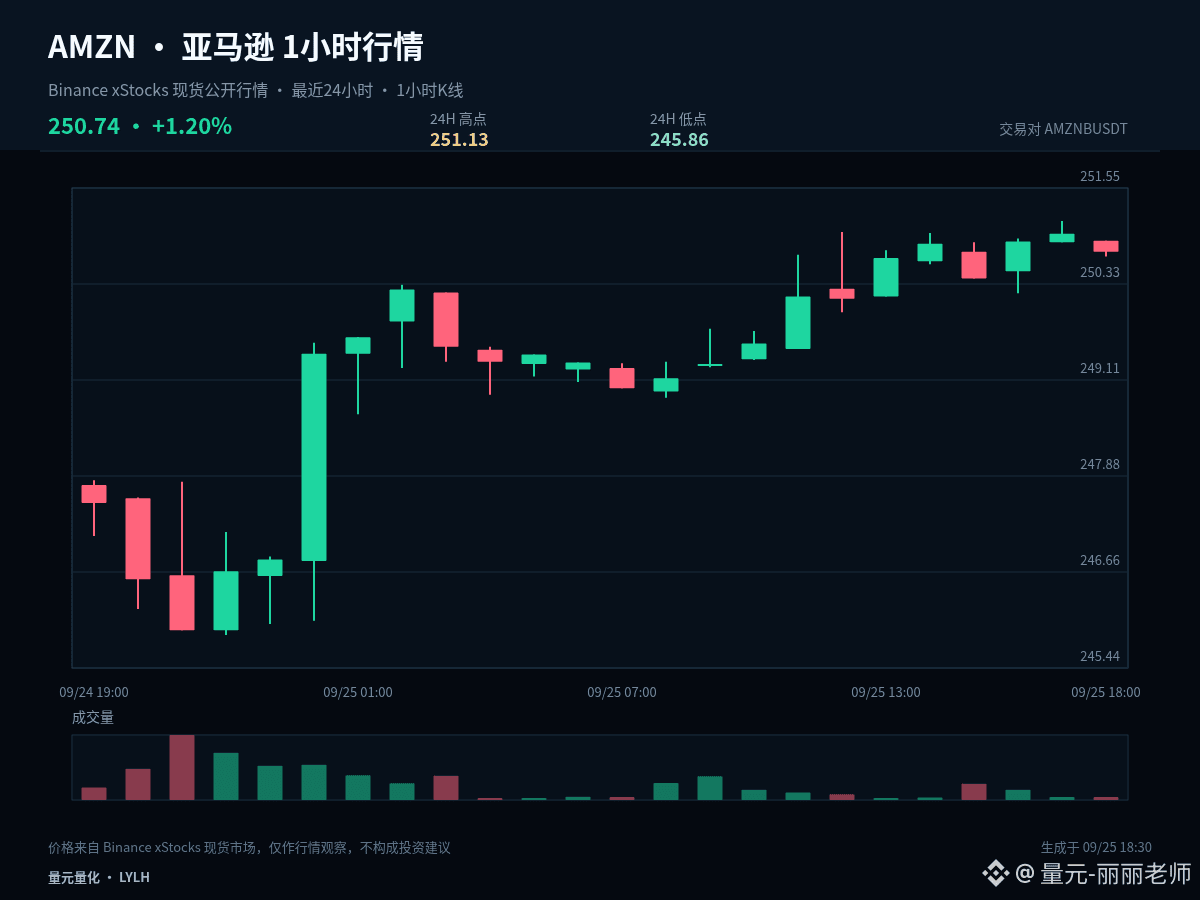
$AMZNB #AMZN It now looks more like range trading and turnover; there’s no need to interpret every 1-hour candlestick as a brand-new trend. Current price: 250.74; 1 hour: -0.09%, 24 hours: +1.28%.
The current price is close to the upper edge of the past 24-hour range: 1 hour -0.09%, 24 hours +1.28%. The most important thing at the highs is to confirm post-breakout acceptance. If price can stay above the upper edge, it shows the market is recognizing a higher range; if it only briefly pierces and then quickly snaps back, you need to watch out for a false breakout.
Upper edge: 251.13, lower edge: 245.86, midline: 248.495. When near the upper edge, look at breakout quality; when near the lower edge, look at how well it holds/gets support. Around the midline, reduce frequent trading because it’s not far enough from either side—direction and risk/reward aren’t clear.
The signals worth acting on are: after a boundary break, price is willing to remain in the new range; or after testing the boundary downward, it quickly reclaims. Without such confirmation, keep treating it as consolidation—don’t let brief intraday fluctuations change the overall plan.
Existing positions can be handled in segments based on key levels to avoid making all decisions at once. Those with no position should wait for breakout confirmation or a pullback to stabilize. For U.S. market assets, also watch for volatility caused by trading-session transitions; the plan should be based on price conditions—don’t let emotion replace execution.
Risk control still comes before the conclusion: only execute when conditions are met, and re-evaluate promptly if the price becomes invalid. The larger the volatility, the more restrained each single position should be. The above is a scenario analysis based on current 1-hour and 24-hour data; it does not constitute a promise of returns.
#OndoFinanceSoughtSaleAfterFoundersDeath
$AMZNB #AMZN It now looks more like range trading and turnover; there’s no need to interpret every 1-hour candlestick as a brand-new trend. Current price: 250.74; 1 hour: -0.09%, 24 hours: +1.28%.
The current price is close to the upper edge of the past 24-hour range: 1 hour -0.09%, 24 hours +1.28%. The most important thing at the highs is to confirm post-breakout acceptance. If price can stay above the upper edge, it shows the market is recognizing a higher range; if it only briefly pierces and then quickly snaps back, you need to watch out for a false breakout.
Upper edge: 251.13, lower edge: 245.86, midline: 248.495. When near the upper edge, look at breakout quality; when near the lower edge, look at how well it holds/gets support. Around the midline, reduce frequent trading because it’s not far enough from either side—direction and risk/reward aren’t clear.
The signals worth acting on are: after a boundary break, price is willing to remain in the new range; or after testing the boundary downward, it quickly reclaims. Without such confirmation, keep treating it as consolidation—don’t let brief intraday fluctuations change the overall plan.
Existing positions can be handled in segments based on key levels to avoid making all decisions at once. Those with no position should wait for breakout confirmation or a pullback to stabilize. For U.S. market assets, also watch for volatility caused by trading-session transitions; the plan should be based on price conditions—don’t let emotion replace execution.
Risk control still comes before the conclusion: only execute when conditions are met, and re-evaluate promptly if the price becomes invalid. The larger the volatility, the more restrained each single position should be. The above is a scenario analysis based on current 1-hour and 24-hour data; it does not constitute a promise of returns.
#OndoFinanceSoughtSaleAfterFoundersDeath
The current price is close to the upper edge of the past 24-hour range: 1 hour -0.09%, 24 hours +1.28%. The most important thing at the highs is to confirm post-breakout acceptance. If price can stay above the upper edge, it shows the market is recognizing a higher range; if it only briefly pierces and then quickly snaps back, you need to watch out for a false breakout.
Upper edge: 251.13, lower edge: 245.86, midline: 248.495. When near the upper edge, look at breakout quality; when near the lower edge, look at how well it holds/gets support. Around the midline, reduce frequent trading because it’s not far enough from either side—direction and risk/reward aren’t clear.
The signals worth acting on are: after a boundary break, price is willing to remain in the new range; or after testing the boundary downward, it quickly reclaims. Without such confirmation, keep treating it as consolidation—don’t let brief intraday fluctuations change the overall plan.
Existing positions can be handled in segments based on key levels to avoid making all decisions at once. Those with no position should wait for breakout confirmation or a pullback to stabilize. For U.S. market assets, also watch for volatility caused by trading-session transitions; the plan should be based on price conditions—don’t let emotion replace execution.
Risk control still comes before the conclusion: only execute when conditions are met, and re-evaluate promptly if the price becomes invalid. The larger the volatility, the more restrained each single position should be. The above is a scenario analysis based on current 1-hour and 24-hour data; it does not constitute a promise of returns.
#OndoFinanceSoughtSaleAfterFoundersDeath
25
·
--
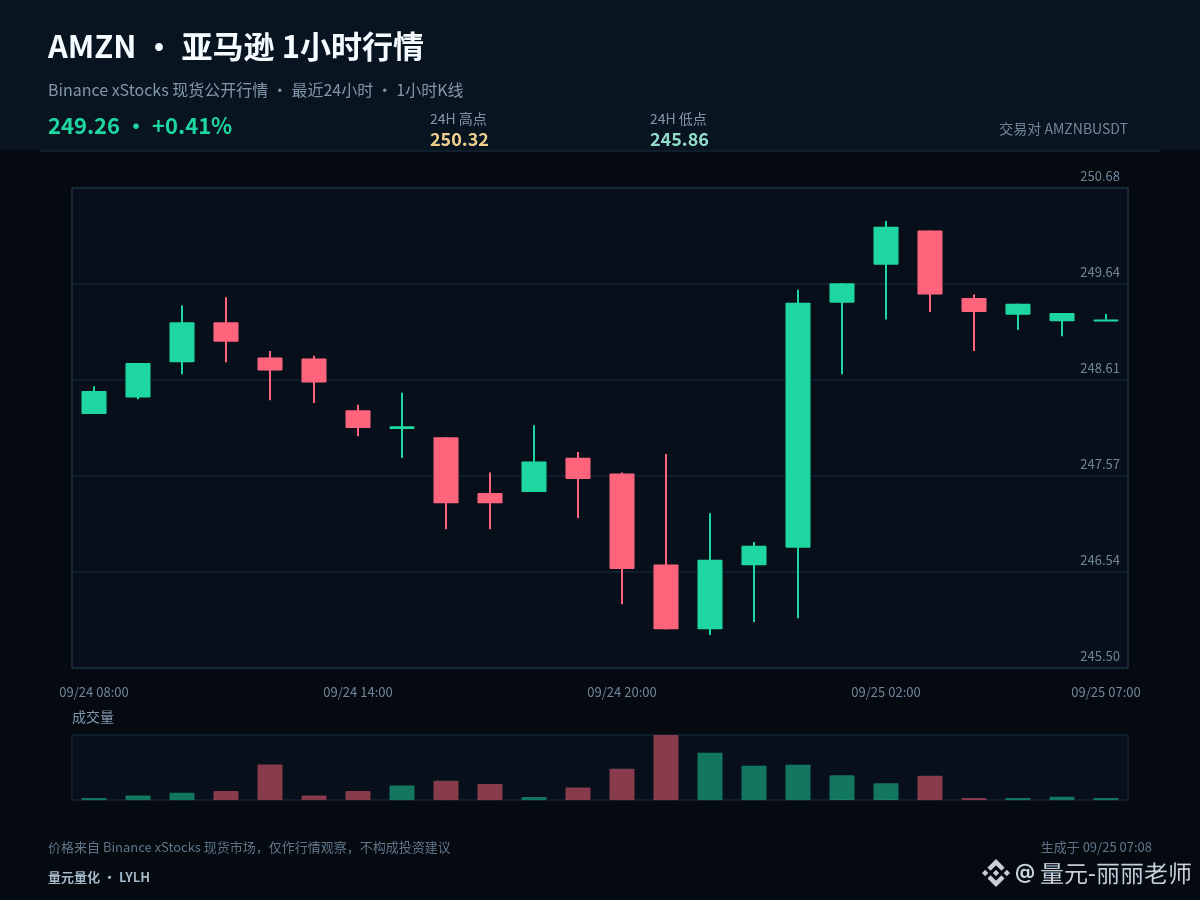
$AMZNB #AMZN It currently looks more like interval (range) trading with turnover; there’s no need to explain every 1-hour candlestick as a brand-new trend. Current price 249.26, 1 hour -0.03%, 24 hours -0.12%.
Right now, 1 hour (-0.03%) and 24 hours (-0.12%) haven’t formed sufficiently clear, same-direction alignment. In a range market, the tolerance for chasing and getting stopped is lower; it’s better to confirm direction with the upper boundary, confirm support with the lower boundary, and treat the midline only as a strength/weakness divider.
Upper boundary 250.32, lower boundary 245.86, midline 248.09. Observe breakout quality near the upper boundary; observe support near the lower boundary. Around the midline, do fewer frequent trades—it's not far enough from either side, so both direction and risk-reward are not clear.
The signals truly worth acting on are: after a break of the boundary, price is willing to stay in the new range; or after a dip to the boundary, it quickly reclaims. Without such confirmation, keep treating it as consolidation and don’t change the overall plan due to brief intraday fluctuations.
Existing positions can be handled in segments based on key levels to avoid making all decisions at once. Those with no position should wait for a breakout confirmation or a pullback that holds. For US stock instruments, also watch for volatility caused by trading-session transitions; the plan should be based on price conditions, not emotion substituting for execution.
The focus of a short-term position isn’t predicting every candlestick, but ensuring there’s a basis for entry, trimming, and exiting. If there’s no confirmation, do less. If a key level fails, redo the plan—control single-trade risk first, then discuss potential follow-up space.
#USWeighsPromotingDollarStablecoinsAbroad
$AMZNB #AMZN It currently looks more like interval (range) trading with turnover; there’s no need to explain every 1-hour candlestick as a brand-new trend. Current price 249.26, 1 hour -0.03%, 24 hours -0.12%.
Right now, 1 hour (-0.03%) and 24 hours (-0.12%) haven’t formed sufficiently clear, same-direction alignment. In a range market, the tolerance for chasing and getting stopped is lower; it’s better to confirm direction with the upper boundary, confirm support with the lower boundary, and treat the midline only as a strength/weakness divider.
Upper boundary 250.32, lower boundary 245.86, midline 248.09. Observe breakout quality near the upper boundary; observe support near the lower boundary. Around the midline, do fewer frequent trades—it's not far enough from either side, so both direction and risk-reward are not clear.
The signals truly worth acting on are: after a break of the boundary, price is willing to stay in the new range; or after a dip to the boundary, it quickly reclaims. Without such confirmation, keep treating it as consolidation and don’t change the overall plan due to brief intraday fluctuations.
Existing positions can be handled in segments based on key levels to avoid making all decisions at once. Those with no position should wait for a breakout confirmation or a pullback that holds. For US stock instruments, also watch for volatility caused by trading-session transitions; the plan should be based on price conditions, not emotion substituting for execution.
The focus of a short-term position isn’t predicting every candlestick, but ensuring there’s a basis for entry, trimming, and exiting. If there’s no confirmation, do less. If a key level fails, redo the plan—control single-trade risk first, then discuss potential follow-up space.
#USWeighsPromotingDollarStablecoinsAbroad
Right now, 1 hour (-0.03%) and 24 hours (-0.12%) haven’t formed sufficiently clear, same-direction alignment. In a range market, the tolerance for chasing and getting stopped is lower; it’s better to confirm direction with the upper boundary, confirm support with the lower boundary, and treat the midline only as a strength/weakness divider.
Upper boundary 250.32, lower boundary 245.86, midline 248.09. Observe breakout quality near the upper boundary; observe support near the lower boundary. Around the midline, do fewer frequent trades—it's not far enough from either side, so both direction and risk-reward are not clear.
The signals truly worth acting on are: after a break of the boundary, price is willing to stay in the new range; or after a dip to the boundary, it quickly reclaims. Without such confirmation, keep treating it as consolidation and don’t change the overall plan due to brief intraday fluctuations.
Existing positions can be handled in segments based on key levels to avoid making all decisions at once. Those with no position should wait for a breakout confirmation or a pullback that holds. For US stock instruments, also watch for volatility caused by trading-session transitions; the plan should be based on price conditions, not emotion substituting for execution.
The focus of a short-term position isn’t predicting every candlestick, but ensuring there’s a basis for entry, trimming, and exiting. If there’s no confirmation, do less. If a key level fails, redo the plan—control single-trade risk first, then discuss potential follow-up space.
#USWeighsPromotingDollarStablecoinsAbroad
9
·
--
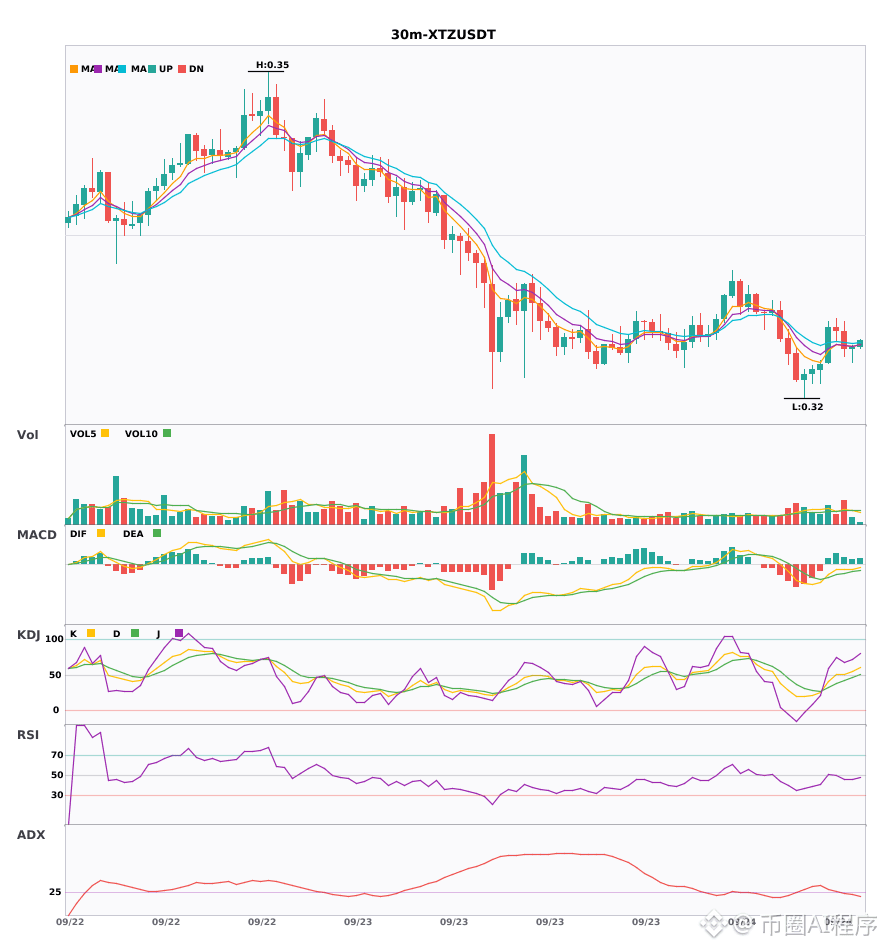
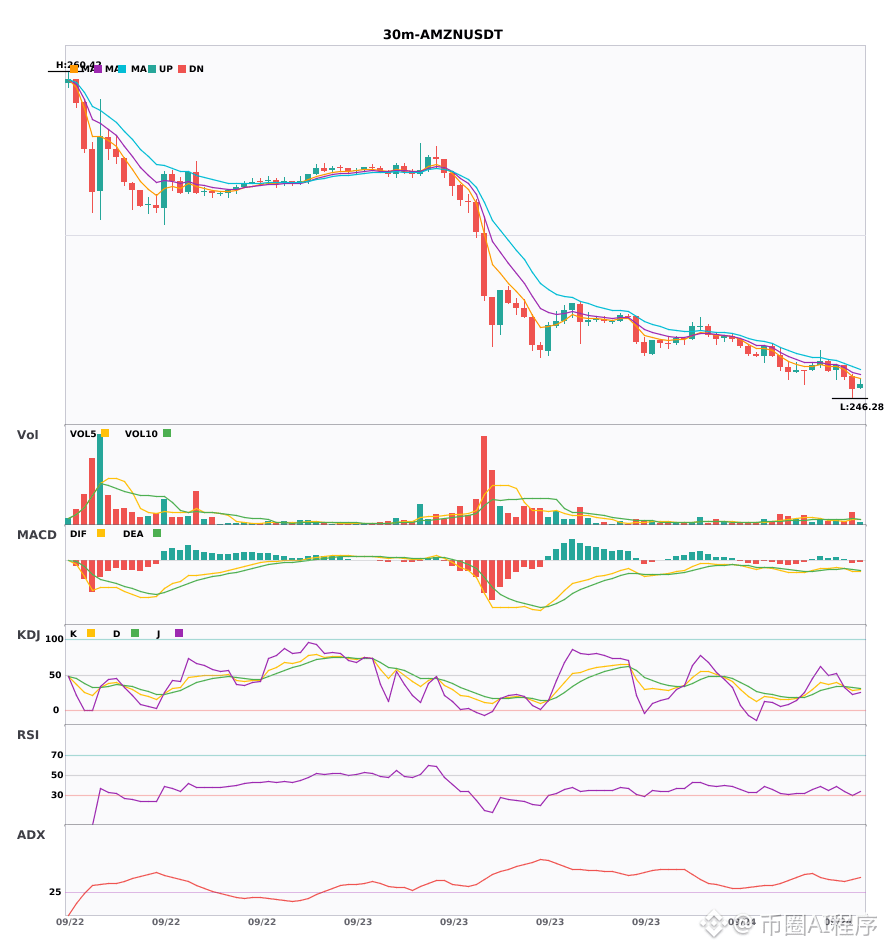
$XTZ / $AMZN 30 minutes 4 hours all go empty, multi-cycle resonance direction consistent 🔥
════════════════════
🟢 $XTZ 30 minutes Bearish signal
⚠️ Technical analysis: 4-hour bearish + 30-minute bearish resonance confirmation. The 30-minute EMA5 just crossed below the EMA8, turning short-term bearish, with volume increasing by 1.7x
════════════════════
🟢 $AMZN 30 minutes Bearish signal
⚠️ Technical analysis: Enter short on the 30-minute chart; 4-hour bearish resonance confirmation! MACD dead cross with green histogram amplification, moving averages arranged bearishly and diverging downward; KDJ shows weak K crossing below D, with volume expanding 2x.
════════════════════
🔔 Follow to get real-time market movements first-hand 🔔
#多周期共振 #XTZ #AMZN
📌 When trading, pay attention to whether the candlestick pattern matches
$XTZ / $AMZN 30 minutes 4 hours all go empty, multi-cycle resonance direction consistent 🔥
════════════════════
🟢 $XTZ 30 minutes Bearish signal
⚠️ Technical analysis: 4-hour bearish + 30-minute bearish resonance confirmation. The 30-minute EMA5 just crossed below the EMA8, turning short-term bearish, with volume increasing by 1.7x
════════════════════
🟢 $AMZN 30 minutes Bearish signal
⚠️ Technical analysis: Enter short on the 30-minute chart; 4-hour bearish resonance confirmation! MACD dead cross with green histogram amplification, moving averages arranged bearishly and diverging downward; KDJ shows weak K crossing below D, with volume expanding 2x.
════════════════════
🔔 Follow to get real-time market movements first-hand 🔔
#多周期共振 #XTZ #AMZN
📌 When trading, pay attention to whether the candlestick pattern matches
════════════════════
🟢 $XTZ 30 minutes Bearish signal
⚠️ Technical analysis: 4-hour bearish + 30-minute bearish resonance confirmation. The 30-minute EMA5 just crossed below the EMA8, turning short-term bearish, with volume increasing by 1.7x
════════════════════
🟢 $AMZN 30 minutes Bearish signal
⚠️ Technical analysis: Enter short on the 30-minute chart; 4-hour bearish resonance confirmation! MACD dead cross with green histogram amplification, moving averages arranged bearishly and diverging downward; KDJ shows weak K crossing below D, with volume expanding 2x.
════════════════════
🔔 Follow to get real-time market movements first-hand 🔔
#多周期共振 #XTZ #AMZN
📌 When trading, pay attention to whether the candlestick pattern matches
26
·
--
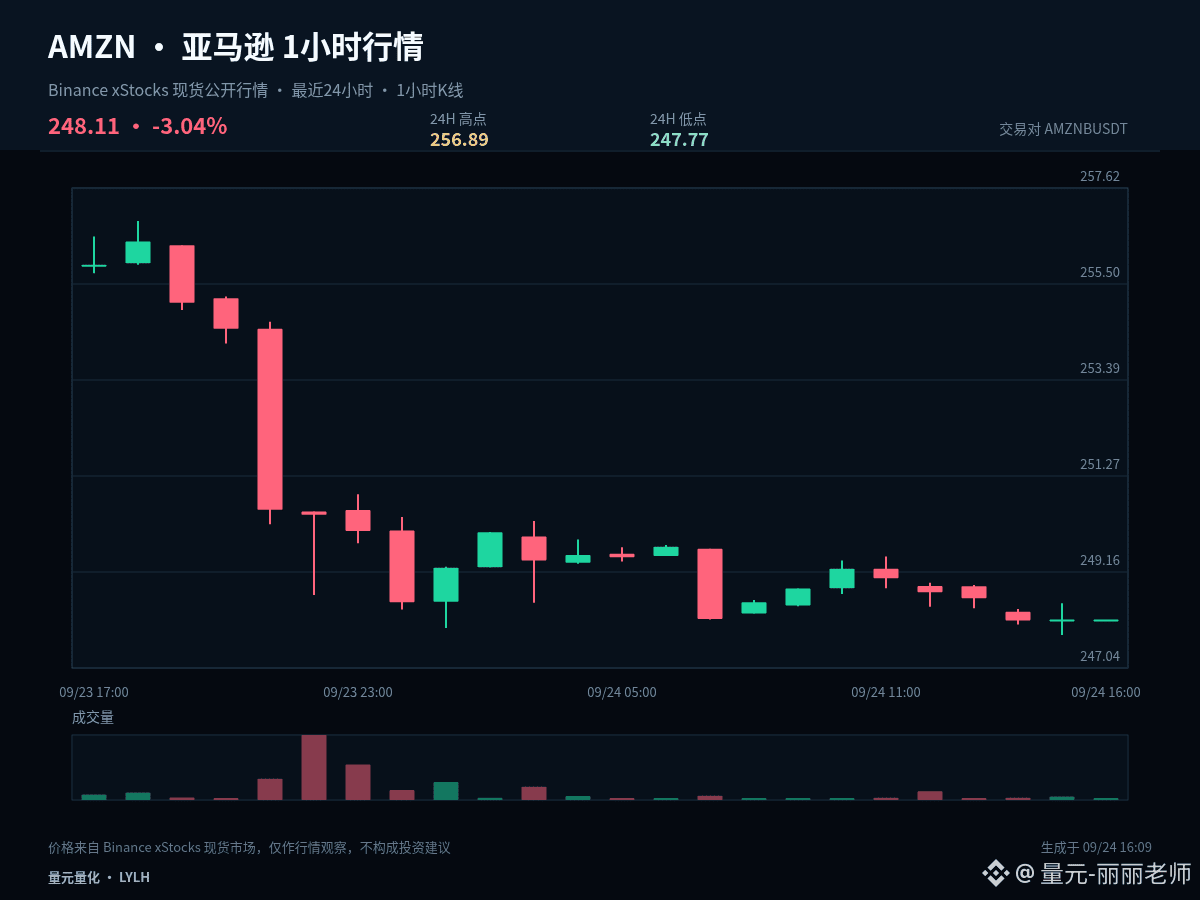
$AMZNB #AMZN A quick conclusion first: hold 252.33, then there will be conditions to continue testing 256.89. Current price is 248.11, 1 hour 0.00%, 24 hours -3.07%.
The current price is close to the lower end of the last 24-hour range: 1 hour 0.00%, 24 hours -3.07%. The core of low-level analysis isn’t trying to bottom-fish early; it’s to watch whether it can quickly reclaim after a breakdown. If it can reclaim, it indicates sell pressure is being absorbed. If it keeps lingering below the lower band, that suggests the weakness hasn’t ended.
For key levels, 252.33 is the center pivot of the current structure and the first benchmark for judging whether a pullback is healthy. As long as price can hold steadily above it, the bulls still have the initiative. The first target above is 256.89. If price drops back below the pivot, then attention shifts to the second support at 247.77.
My scenario isn’t betting on just one direction. A breakout above 256.89 and the ability to hold it means upside space has been reopened. A breakdown below 247.77 with no successful retest indicates the structure is further weakening. If it stays trading between the two, then continue monitoring the closing behavior on both sides of 252.33.
Existing positions can be handled in stages based on the key levels to avoid making all decisions at once. Those with no position should wait for a confirmed breakout or a sign that pullback has stabilized. For US equities, also watch for volatility caused by session transitions. Your plan should be based on price conditions—not let emotions replace execution.
Simplifying the conclusion doesn’t mean simplifying risk control. In real execution, you still need to wait for price confirmation and leave room to exit if your judgment proves invalid. Next, I’ll focus on tracking what happens around 252.33—whether it’s defended or lost. Do you think it’s more likely to test 256.89 first, or return to 247.77 first? Feel free to share your view and reasoning.
#DollarIndexReclaims101
$AMZNB #AMZN A quick conclusion first: hold 252.33, then there will be conditions to continue testing 256.89. Current price is 248.11, 1 hour 0.00%, 24 hours -3.07%.
The current price is close to the lower end of the last 24-hour range: 1 hour 0.00%, 24 hours -3.07%. The core of low-level analysis isn’t trying to bottom-fish early; it’s to watch whether it can quickly reclaim after a breakdown. If it can reclaim, it indicates sell pressure is being absorbed. If it keeps lingering below the lower band, that suggests the weakness hasn’t ended.
For key levels, 252.33 is the center pivot of the current structure and the first benchmark for judging whether a pullback is healthy. As long as price can hold steadily above it, the bulls still have the initiative. The first target above is 256.89. If price drops back below the pivot, then attention shifts to the second support at 247.77.
My scenario isn’t betting on just one direction. A breakout above 256.89 and the ability to hold it means upside space has been reopened. A breakdown below 247.77 with no successful retest indicates the structure is further weakening. If it stays trading between the two, then continue monitoring the closing behavior on both sides of 252.33.
Existing positions can be handled in stages based on the key levels to avoid making all decisions at once. Those with no position should wait for a confirmed breakout or a sign that pullback has stabilized. For US equities, also watch for volatility caused by session transitions. Your plan should be based on price conditions—not let emotions replace execution.
Simplifying the conclusion doesn’t mean simplifying risk control. In real execution, you still need to wait for price confirmation and leave room to exit if your judgment proves invalid. Next, I’ll focus on tracking what happens around 252.33—whether it’s defended or lost. Do you think it’s more likely to test 256.89 first, or return to 247.77 first? Feel free to share your view and reasoning.
#DollarIndexReclaims101
The current price is close to the lower end of the last 24-hour range: 1 hour 0.00%, 24 hours -3.07%. The core of low-level analysis isn’t trying to bottom-fish early; it’s to watch whether it can quickly reclaim after a breakdown. If it can reclaim, it indicates sell pressure is being absorbed. If it keeps lingering below the lower band, that suggests the weakness hasn’t ended.
For key levels, 252.33 is the center pivot of the current structure and the first benchmark for judging whether a pullback is healthy. As long as price can hold steadily above it, the bulls still have the initiative. The first target above is 256.89. If price drops back below the pivot, then attention shifts to the second support at 247.77.
My scenario isn’t betting on just one direction. A breakout above 256.89 and the ability to hold it means upside space has been reopened. A breakdown below 247.77 with no successful retest indicates the structure is further weakening. If it stays trading between the two, then continue monitoring the closing behavior on both sides of 252.33.
Existing positions can be handled in stages based on the key levels to avoid making all decisions at once. Those with no position should wait for a confirmed breakout or a sign that pullback has stabilized. For US equities, also watch for volatility caused by session transitions. Your plan should be based on price conditions—not let emotions replace execution.
Simplifying the conclusion doesn’t mean simplifying risk control. In real execution, you still need to wait for price confirmation and leave room to exit if your judgment proves invalid. Next, I’ll focus on tracking what happens around 252.33—whether it’s defended or lost. Do you think it’s more likely to test 256.89 first, or return to 247.77 first? Feel free to share your view and reasoning.
#DollarIndexReclaims101
5

·
--
Positioning is everything, and the current levels on $AMZN have hit the exact sweet spot for my execution strategy.
⚡ $AMZN — LONG SETUP
📍 Entry: 246.35 – 247.84
🎯 TP1: 250.83
🎯 TP2: 252.82
🎯 TP3: 255.81
🛑 Stop Loss: 244.86
Trade here 👇
📌 Trade management rules: see pinned post.
Are you bidding these exact levels, or staying on the sidelines? Drop a follow to catch my next update.
#AMZN
Positioning is everything, and the current levels on $AMZN have hit the exact sweet spot for my execution strategy.
⚡ $AMZN — LONG SETUP
📍 Entry: 246.35 – 247.84
🎯 TP1: 250.83
🎯 TP2: 252.82
🎯 TP3: 255.81
🛑 Stop Loss: 244.86
Trade here 👇
📌 Trade management rules: see pinned post.
Are you bidding these exact levels, or staying on the sidelines? Drop a follow to catch my next update.
#AMZN
⚡ $AMZN — LONG SETUP
📍 Entry: 246.35 – 247.84
🎯 TP1: 250.83
🎯 TP2: 252.82
🎯 TP3: 255.81
🛑 Stop Loss: 244.86
Trade here 👇
📌 Trade management rules: see pinned post.
Are you bidding these exact levels, or staying on the sidelines? Drop a follow to catch my next update.
#AMZN
1
34
·
--
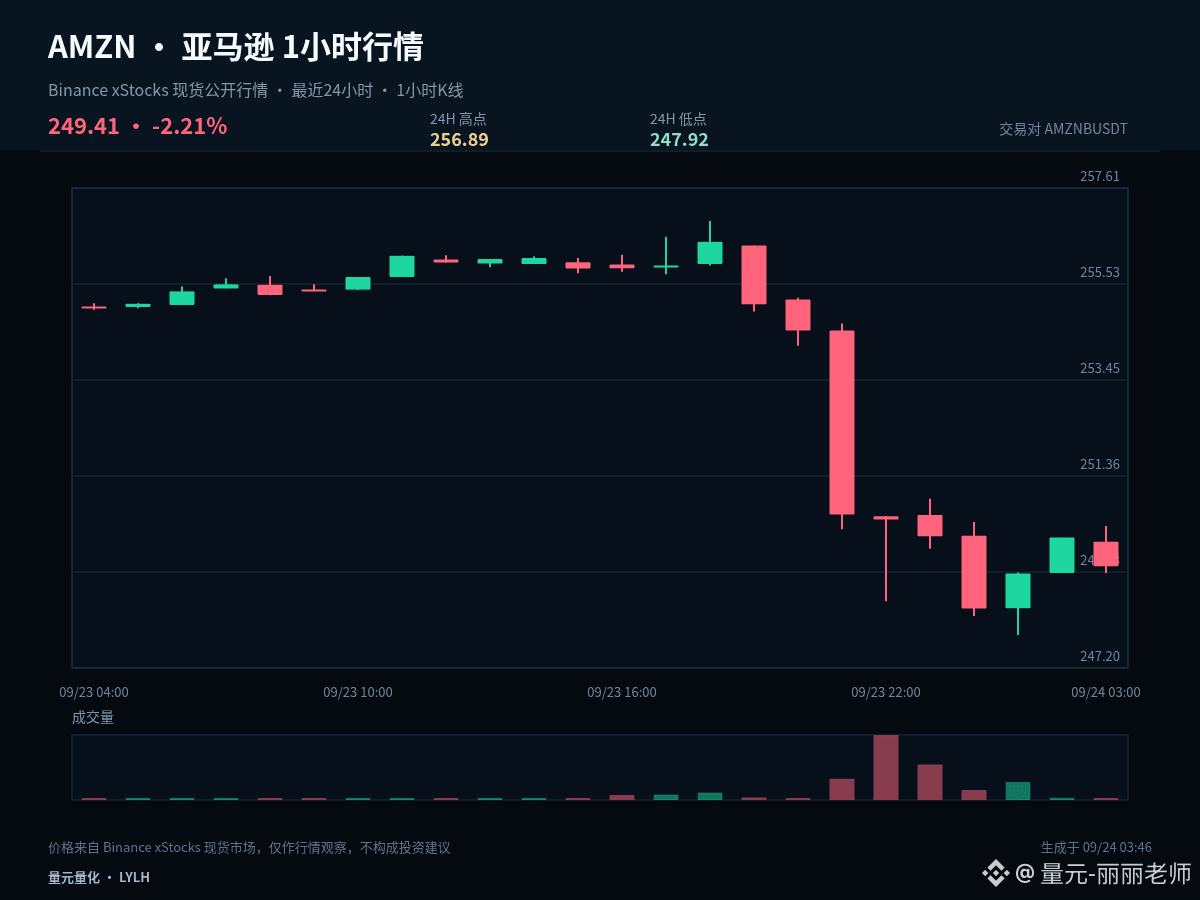
$AMZNB #AMZN This time, I break down the situation from a position perspective. In the same chart, the key points you see with an existing position versus being in cash are different. Current price: 249.41, 1 hour: -0.25%, 24 hours: -2.57%.
The current price is near the lower end of the last 24-hour range: -0.25% in 1 hour and -2.57% in 24 hours. The core of analyzing the lower area is not to front-run a bottom, but to observe whether, after a breakdown, price can quickly reclaim. If it can reclaim, it means selling pressure is being absorbed; if it keeps lingering below the lower end, it indicates weakness hasn’t ended.
For holders with existing positions: watch whether 247.92 is broken. If it is, reduce risk exposure first. For those on the sidelines: wait for the low to stop making lower lows, and confirm that price has returned back above 252.405—don’t catch a falling structure early.
My scenario analysis is not a single-direction bet. A breakout above 256.89 and the ability to hold it reopens upside room. A drop below 247.92 with failure to rebound indicates the structure weakens further. If price keeps ranging between the two, continue observing the closing behavior on both sides of 252.405.
Existing-position holders can handle decisions in stages based on key levels to avoid making all judgments at once. Cash-only traders should wait for confirmation of a breakout or for a pullback to stabilize. For U.S. market instruments, also pay attention to volatility caused by trading session transitions. Your plan should be based on price conditions—don’t let emotions replace execution.
Risk control still comes before the conclusion: execute only when conditions are met; if the price thesis fails, reassess promptly. The larger the volatility, the more restraint you should apply to each position. The above is a market-scenario projection based on current 1-hour and 24-hour data, and does not constitute any promise of returns.
#21SharesLaunchesEuropesFirstZcashETP
$AMZNB #AMZN This time, I break down the situation from a position perspective. In the same chart, the key points you see with an existing position versus being in cash are different. Current price: 249.41, 1 hour: -0.25%, 24 hours: -2.57%.
The current price is near the lower end of the last 24-hour range: -0.25% in 1 hour and -2.57% in 24 hours. The core of analyzing the lower area is not to front-run a bottom, but to observe whether, after a breakdown, price can quickly reclaim. If it can reclaim, it means selling pressure is being absorbed; if it keeps lingering below the lower end, it indicates weakness hasn’t ended.
For holders with existing positions: watch whether 247.92 is broken. If it is, reduce risk exposure first. For those on the sidelines: wait for the low to stop making lower lows, and confirm that price has returned back above 252.405—don’t catch a falling structure early.
My scenario analysis is not a single-direction bet. A breakout above 256.89 and the ability to hold it reopens upside room. A drop below 247.92 with failure to rebound indicates the structure weakens further. If price keeps ranging between the two, continue observing the closing behavior on both sides of 252.405.
Existing-position holders can handle decisions in stages based on key levels to avoid making all judgments at once. Cash-only traders should wait for confirmation of a breakout or for a pullback to stabilize. For U.S. market instruments, also pay attention to volatility caused by trading session transitions. Your plan should be based on price conditions—don’t let emotions replace execution.
Risk control still comes before the conclusion: execute only when conditions are met; if the price thesis fails, reassess promptly. The larger the volatility, the more restraint you should apply to each position. The above is a market-scenario projection based on current 1-hour and 24-hour data, and does not constitute any promise of returns.
#21SharesLaunchesEuropesFirstZcashETP
The current price is near the lower end of the last 24-hour range: -0.25% in 1 hour and -2.57% in 24 hours. The core of analyzing the lower area is not to front-run a bottom, but to observe whether, after a breakdown, price can quickly reclaim. If it can reclaim, it means selling pressure is being absorbed; if it keeps lingering below the lower end, it indicates weakness hasn’t ended.
For holders with existing positions: watch whether 247.92 is broken. If it is, reduce risk exposure first. For those on the sidelines: wait for the low to stop making lower lows, and confirm that price has returned back above 252.405—don’t catch a falling structure early.
My scenario analysis is not a single-direction bet. A breakout above 256.89 and the ability to hold it reopens upside room. A drop below 247.92 with failure to rebound indicates the structure weakens further. If price keeps ranging between the two, continue observing the closing behavior on both sides of 252.405.
Existing-position holders can handle decisions in stages based on key levels to avoid making all judgments at once. Cash-only traders should wait for confirmation of a breakout or for a pullback to stabilize. For U.S. market instruments, also pay attention to volatility caused by trading session transitions. Your plan should be based on price conditions—don’t let emotions replace execution.
Risk control still comes before the conclusion: execute only when conditions are met; if the price thesis fails, reassess promptly. The larger the volatility, the more restraint you should apply to each position. The above is a market-scenario projection based on current 1-hour and 24-hour data, and does not constitute any promise of returns.
#21SharesLaunchesEuropesFirstZcashETP
8
·
--
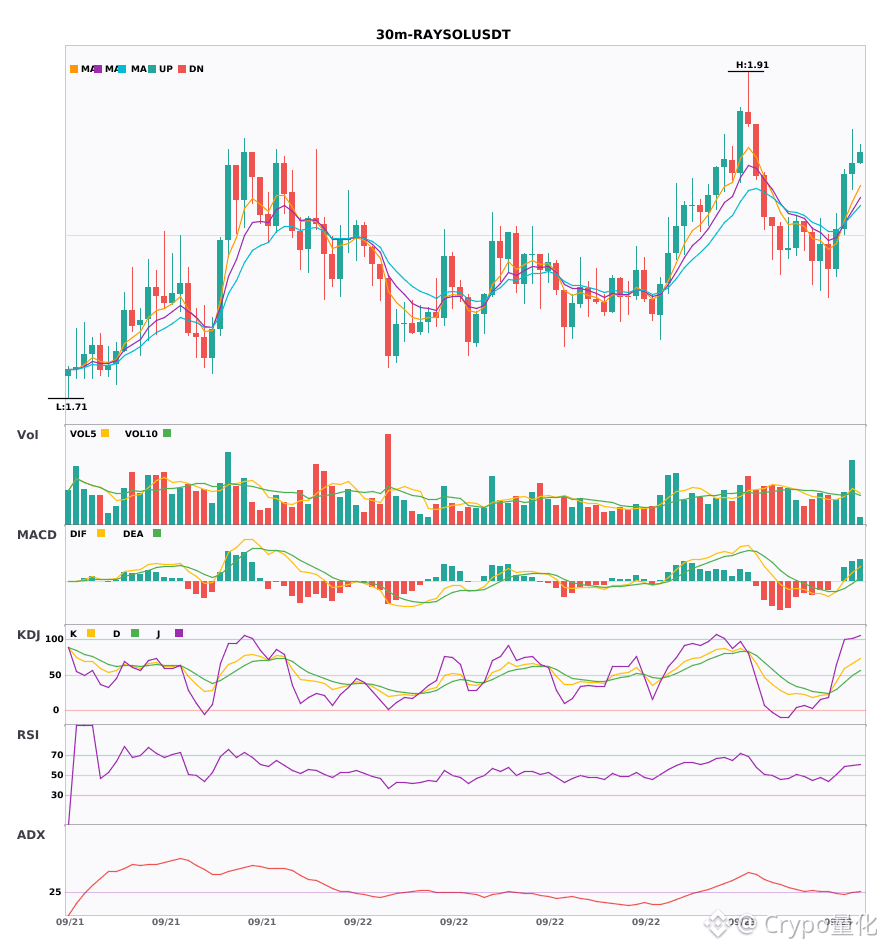
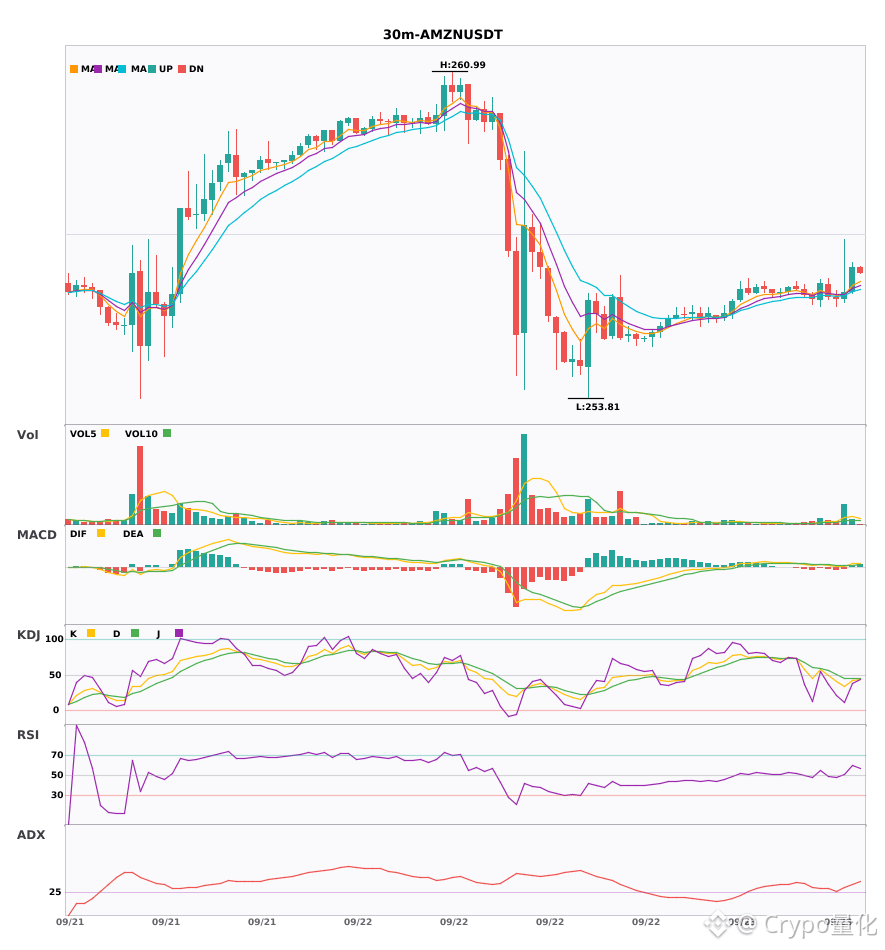
$RAYSOL and $AMZN 30-minute technicals move in sync to strengthen—who has more explosive potential?🔥
════════════════════
🔴 $RAYSOL 30 minutes Bullish signal
⚠️Technical view: ADX at 28—trend has just formed and is suitable to get involved; MACD bullish momentum expands with rising volume; short moving averages are bullishly aligned; trading volume increases by 2x.
════════════════════
🔴 $AMZN 30 minutes Bullish signal
⚠️Technical view: ADX (37) shows a clear trending market | MACD forms a bullish cross above zero, bullish momentum is releasing | EMA5 > EMA8 > EMA13 with a bullish alignment | KDJ is running weakly with bears in control (K is 42.2, D is 44.5) | Volume explodes (4.6x)
════════════════════
🔔 Follow to get the first-hand market moves and anomalies 🔔
#技术分析 #RAYSOL #AMZN
📌 When trading, pay attention to whether the candlestick patterns match
$RAYSOL and $AMZN 30-minute technicals move in sync to strengthen—who has more explosive potential?🔥
════════════════════
🔴 $RAYSOL 30 minutes Bullish signal
⚠️Technical view: ADX at 28—trend has just formed and is suitable to get involved; MACD bullish momentum expands with rising volume; short moving averages are bullishly aligned; trading volume increases by 2x.
════════════════════
🔴 $AMZN 30 minutes Bullish signal
⚠️Technical view: ADX (37) shows a clear trending market | MACD forms a bullish cross above zero, bullish momentum is releasing | EMA5 > EMA8 > EMA13 with a bullish alignment | KDJ is running weakly with bears in control (K is 42.2, D is 44.5) | Volume explodes (4.6x)
════════════════════
🔔 Follow to get the first-hand market moves and anomalies 🔔
#技术分析 #RAYSOL #AMZN
📌 When trading, pay attention to whether the candlestick patterns match
════════════════════
🔴 $RAYSOL 30 minutes Bullish signal
⚠️Technical view: ADX at 28—trend has just formed and is suitable to get involved; MACD bullish momentum expands with rising volume; short moving averages are bullishly aligned; trading volume increases by 2x.
════════════════════
🔴 $AMZN 30 minutes Bullish signal
⚠️Technical view: ADX (37) shows a clear trending market | MACD forms a bullish cross above zero, bullish momentum is releasing | EMA5 > EMA8 > EMA13 with a bullish alignment | KDJ is running weakly with bears in control (K is 42.2, D is 44.5) | Volume explodes (4.6x)
════════════════════
🔔 Follow to get the first-hand market moves and anomalies 🔔
#技术分析 #RAYSOL #AMZN
📌 When trading, pay attention to whether the candlestick patterns match
100

·
--
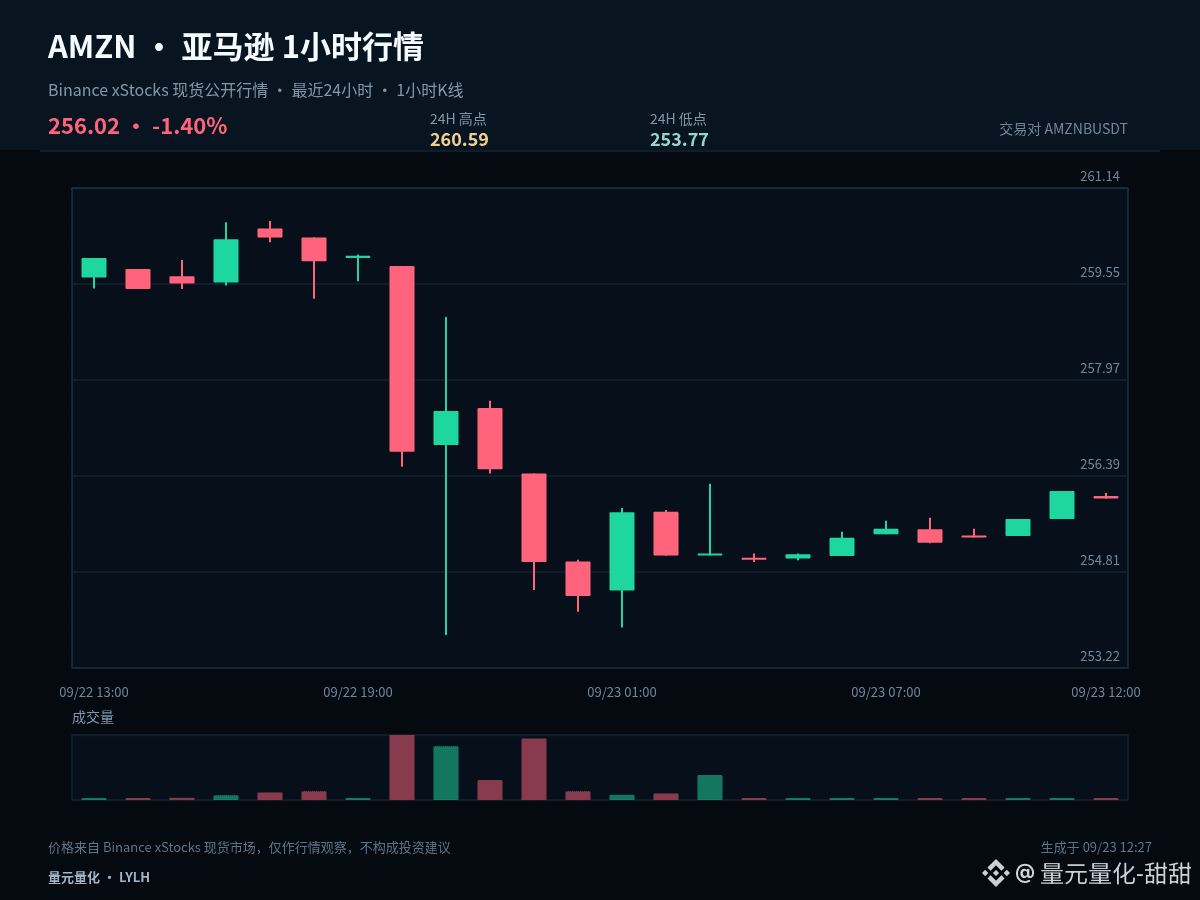
$AMZNB #AMZN has not yet formed a clear one-sided bias; the 1-hour and 24-hour rhythms are still tugging at each other. In this phase, focus on the boundaries of the range rather than the color of every single candlestick.
Currently, the 1-hour is -0.05%, and the 24-hour is -1.41%. The two cycles have not yet produced sufficiently clear alignment in the same direction. In range trading, the tolerance for chasing and killing moves is low; it’s more suitable to use confirmation at the upper boundary to define direction, and confirmation at the lower boundary to judge whether it is being held, while the midline should only be treated as the line separating strength and weakness.
For the short term, first watch whether 253.77 can form continuous support, and then whether 257.18 can be reclaimed again. The former determines whether the selloff can slow down; the latter determines whether the rebound can strengthen. Without confirmations for both, it’s not advisable to judge opportunity based on drawdown alone.
The subsequent path can be handled in three ways: if price rises and successfully holds above 260.59, wait for a pullback that doesn’t break, then reassess continuation; if it breaks down below 253.77, prioritize risk control and wait for new support; if it continues to oscillate around 257.18, treat it as range turnover and don’t repeatedly chase direction from the middle of the range.
Position management should distinguish between swing positions and short-term positions. For existing swing holdings, first check whether the structure is broken; don’t let repeated 1-hour single-candle fluctuations keep changing your view. For short-term positions, execute around support, resistance, and closing confirmation. If you’re currently in cash, you don’t need to chase prices in the middle of the range—waiting for a clearer location usually offers an advantage.
The key for short-term positions is not to predict every single candlestick; it’s to ensure that entries, trimming, and exits all have a basis. Do less without confirmation; when a key level fails, redo the plan. Control risk on each trade first, then talk about potential upside later.
#AIStocksWhatNext
$AMZNB #AMZN has not yet formed a clear one-sided bias; the 1-hour and 24-hour rhythms are still tugging at each other. In this phase, focus on the boundaries of the range rather than the color of every single candlestick.
Currently, the 1-hour is -0.05%, and the 24-hour is -1.41%. The two cycles have not yet produced sufficiently clear alignment in the same direction. In range trading, the tolerance for chasing and killing moves is low; it’s more suitable to use confirmation at the upper boundary to define direction, and confirmation at the lower boundary to judge whether it is being held, while the midline should only be treated as the line separating strength and weakness.
For the short term, first watch whether 253.77 can form continuous support, and then whether 257.18 can be reclaimed again. The former determines whether the selloff can slow down; the latter determines whether the rebound can strengthen. Without confirmations for both, it’s not advisable to judge opportunity based on drawdown alone.
The subsequent path can be handled in three ways: if price rises and successfully holds above 260.59, wait for a pullback that doesn’t break, then reassess continuation; if it breaks down below 253.77, prioritize risk control and wait for new support; if it continues to oscillate around 257.18, treat it as range turnover and don’t repeatedly chase direction from the middle of the range.
Position management should distinguish between swing positions and short-term positions. For existing swing holdings, first check whether the structure is broken; don’t let repeated 1-hour single-candle fluctuations keep changing your view. For short-term positions, execute around support, resistance, and closing confirmation. If you’re currently in cash, you don’t need to chase prices in the middle of the range—waiting for a clearer location usually offers an advantage.
The key for short-term positions is not to predict every single candlestick; it’s to ensure that entries, trimming, and exits all have a basis. Do less without confirmation; when a key level fails, redo the plan. Control risk on each trade first, then talk about potential upside later.
#AIStocksWhatNext
Currently, the 1-hour is -0.05%, and the 24-hour is -1.41%. The two cycles have not yet produced sufficiently clear alignment in the same direction. In range trading, the tolerance for chasing and killing moves is low; it’s more suitable to use confirmation at the upper boundary to define direction, and confirmation at the lower boundary to judge whether it is being held, while the midline should only be treated as the line separating strength and weakness.
For the short term, first watch whether 253.77 can form continuous support, and then whether 257.18 can be reclaimed again. The former determines whether the selloff can slow down; the latter determines whether the rebound can strengthen. Without confirmations for both, it’s not advisable to judge opportunity based on drawdown alone.
The subsequent path can be handled in three ways: if price rises and successfully holds above 260.59, wait for a pullback that doesn’t break, then reassess continuation; if it breaks down below 253.77, prioritize risk control and wait for new support; if it continues to oscillate around 257.18, treat it as range turnover and don’t repeatedly chase direction from the middle of the range.
Position management should distinguish between swing positions and short-term positions. For existing swing holdings, first check whether the structure is broken; don’t let repeated 1-hour single-candle fluctuations keep changing your view. For short-term positions, execute around support, resistance, and closing confirmation. If you’re currently in cash, you don’t need to chase prices in the middle of the range—waiting for a clearer location usually offers an advantage.
The key for short-term positions is not to predict every single candlestick; it’s to ensure that entries, trimming, and exits all have a basis. Do less without confirmation; when a key level fails, redo the plan. Control risk on each trade first, then talk about potential upside later.
#AIStocksWhatNext
8

$AMZN LONG
1. Quotes have consolidated above the Swing High level of 255.04, indicating that buyers are prepared to defend the achieved high.
2. The bullish sentiment is supported by the current price position near the entry point 255.1, where the initiative still remains on the side of the upside.
3. The potential for a move remains intact up to the upper target level at 257.51, provided the protective zone is held.
🏁Entry: 255.1
💰Target 1: 255.7477603 (+0.25%)
💰Target 2: 256.45552059 (+0.53%)
💰Target 3: 257.51716103 (+0.95%)
⛔️Stop: 253.97835956 (-0.44%)
⚠️ This is not financial advice. Trade at your own risk. DYOR.
#AMZN #ETH #trumpdisclosestradesincludingmarastock 📈
$AMZN
$AMZN LONG
1. Quotes have consolidated above the Swing High level of 255.04, indicating that buyers are prepared to defend the achieved high.
2. The bullish sentiment is supported by the current price position near the entry point 255.1, where the initiative still remains on the side of the upside.
3. The potential for a move remains intact up to the upper target level at 257.51, provided the protective zone is held.
🏁Entry: 255.1
💰Target 1: 255.7477603 (+0.25%)
💰Target 2: 256.45552059 (+0.53%)
💰Target 3: 257.51716103 (+0.95%)
⛔️Stop: 253.97835956 (-0.44%)
⚠️ This is not financial advice. Trade at your own risk. DYOR.
#AMZN #ETH #trumpdisclosestradesincludingmarastock 📈
$AMZN
1. Quotes have consolidated above the Swing High level of 255.04, indicating that buyers are prepared to defend the achieved high.
2. The bullish sentiment is supported by the current price position near the entry point 255.1, where the initiative still remains on the side of the upside.
3. The potential for a move remains intact up to the upper target level at 257.51, provided the protective zone is held.
🏁Entry: 255.1
💰Target 1: 255.7477603 (+0.25%)
💰Target 2: 256.45552059 (+0.53%)
💰Target 3: 257.51716103 (+0.95%)
⛔️Stop: 253.97835956 (-0.44%)
⚠️ This is not financial advice. Trade at your own risk. DYOR.
#AMZN #ETH #trumpdisclosestradesincludingmarastock 📈
$AMZN
41
·
--
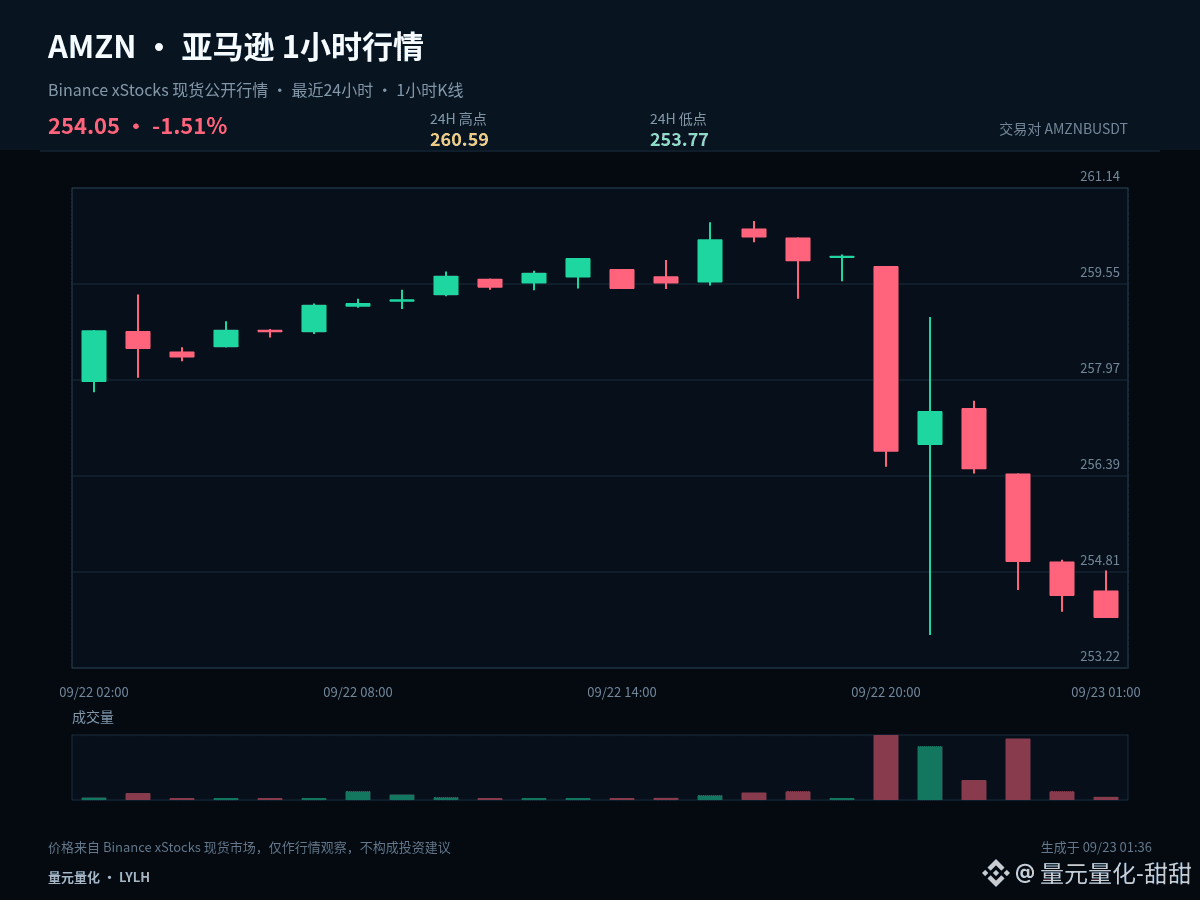
$AMZNB #AMZN Over the past 24 hours, the high-low swing amplitude is about 2.7%. The current price is 254.05. This is not a calm range suitable for opening a trade on a whim. When volatility expands, you should first adjust your position size, and only then discuss direction.
$AMZNB #AMZN is testing the lower bound of the past 24-hour range. It may look like the price is lower, but the real trading value depends on whether the buying support can keep holding—not just on the feeling that it’s “cheap.”
The current price is near the lower end of the past 24-hour volatility range: 1 hour -0.14%, 24 hours -1.46%. The core of analyzing lows is not to try to catch the bottom early, but to observe whether price can quickly reclaim after a breakdown. If it can reclaim, it suggests sell pressure is being absorbed. If it continues to linger below the lower bound, it indicates weakness has not ended.
For the short term, first watch whether 253.77 can form sustained buy support, and then whether 257.18 can be reclaimed. The former determines whether the downside can slow; the latter determines whether the rebound can strengthen. Without confirmation on both, you shouldn’t judge opportunities based solely on the magnitude of the drop.
In high-volatility phases, execution principles are: reduce single-trade exposure, avoid chasing prices back and forth in the middle of the range, and write the invalidation conditions before entering. If price doesn’t provide confirmation, it’s better to do fewer trades than to make up uncertainty with a larger position.
There are three ways to handle the next path: If price holds effectively above 260.59, wait for a pullback that does not break and then re-evaluate whether the move can continue. If it breaks down below 253.77, prioritize risk control and wait for new support. If it continues to oscillate around 257.18, treat it as range rotation and don’t repeatedly chase a direction in the middle.
The focus for short-term positioning is not to predict every individual candlestick, but to ensure there is a basis for entry, trimming, and exit. If there is no confirmation, do less. If a key level fails, redo the plan. Control single-trade risk first, then discuss potential further upside/downside space.
#AIStocksWhatNext
$AMZNB #AMZN Over the past 24 hours, the high-low swing amplitude is about 2.7%. The current price is 254.05. This is not a calm range suitable for opening a trade on a whim. When volatility expands, you should first adjust your position size, and only then discuss direction.
$AMZNB #AMZN is testing the lower bound of the past 24-hour range. It may look like the price is lower, but the real trading value depends on whether the buying support can keep holding—not just on the feeling that it’s “cheap.”
The current price is near the lower end of the past 24-hour volatility range: 1 hour -0.14%, 24 hours -1.46%. The core of analyzing lows is not to try to catch the bottom early, but to observe whether price can quickly reclaim after a breakdown. If it can reclaim, it suggests sell pressure is being absorbed. If it continues to linger below the lower bound, it indicates weakness has not ended.
For the short term, first watch whether 253.77 can form sustained buy support, and then whether 257.18 can be reclaimed. The former determines whether the downside can slow; the latter determines whether the rebound can strengthen. Without confirmation on both, you shouldn’t judge opportunities based solely on the magnitude of the drop.
In high-volatility phases, execution principles are: reduce single-trade exposure, avoid chasing prices back and forth in the middle of the range, and write the invalidation conditions before entering. If price doesn’t provide confirmation, it’s better to do fewer trades than to make up uncertainty with a larger position.
There are three ways to handle the next path: If price holds effectively above 260.59, wait for a pullback that does not break and then re-evaluate whether the move can continue. If it breaks down below 253.77, prioritize risk control and wait for new support. If it continues to oscillate around 257.18, treat it as range rotation and don’t repeatedly chase a direction in the middle.
The focus for short-term positioning is not to predict every individual candlestick, but to ensure there is a basis for entry, trimming, and exit. If there is no confirmation, do less. If a key level fails, redo the plan. Control single-trade risk first, then discuss potential further upside/downside space.
#AIStocksWhatNext
$AMZNB #AMZN is testing the lower bound of the past 24-hour range. It may look like the price is lower, but the real trading value depends on whether the buying support can keep holding—not just on the feeling that it’s “cheap.”
The current price is near the lower end of the past 24-hour volatility range: 1 hour -0.14%, 24 hours -1.46%. The core of analyzing lows is not to try to catch the bottom early, but to observe whether price can quickly reclaim after a breakdown. If it can reclaim, it suggests sell pressure is being absorbed. If it continues to linger below the lower bound, it indicates weakness has not ended.
For the short term, first watch whether 253.77 can form sustained buy support, and then whether 257.18 can be reclaimed. The former determines whether the downside can slow; the latter determines whether the rebound can strengthen. Without confirmation on both, you shouldn’t judge opportunities based solely on the magnitude of the drop.
In high-volatility phases, execution principles are: reduce single-trade exposure, avoid chasing prices back and forth in the middle of the range, and write the invalidation conditions before entering. If price doesn’t provide confirmation, it’s better to do fewer trades than to make up uncertainty with a larger position.
There are three ways to handle the next path: If price holds effectively above 260.59, wait for a pullback that does not break and then re-evaluate whether the move can continue. If it breaks down below 253.77, prioritize risk control and wait for new support. If it continues to oscillate around 257.18, treat it as range rotation and don’t repeatedly chase a direction in the middle.
The focus for short-term positioning is not to predict every individual candlestick, but to ensure there is a basis for entry, trimming, and exit. If there is no confirmation, do less. If a key level fails, redo the plan. Control single-trade risk first, then discuss potential further upside/downside space.
#AIStocksWhatNext
2
·
--
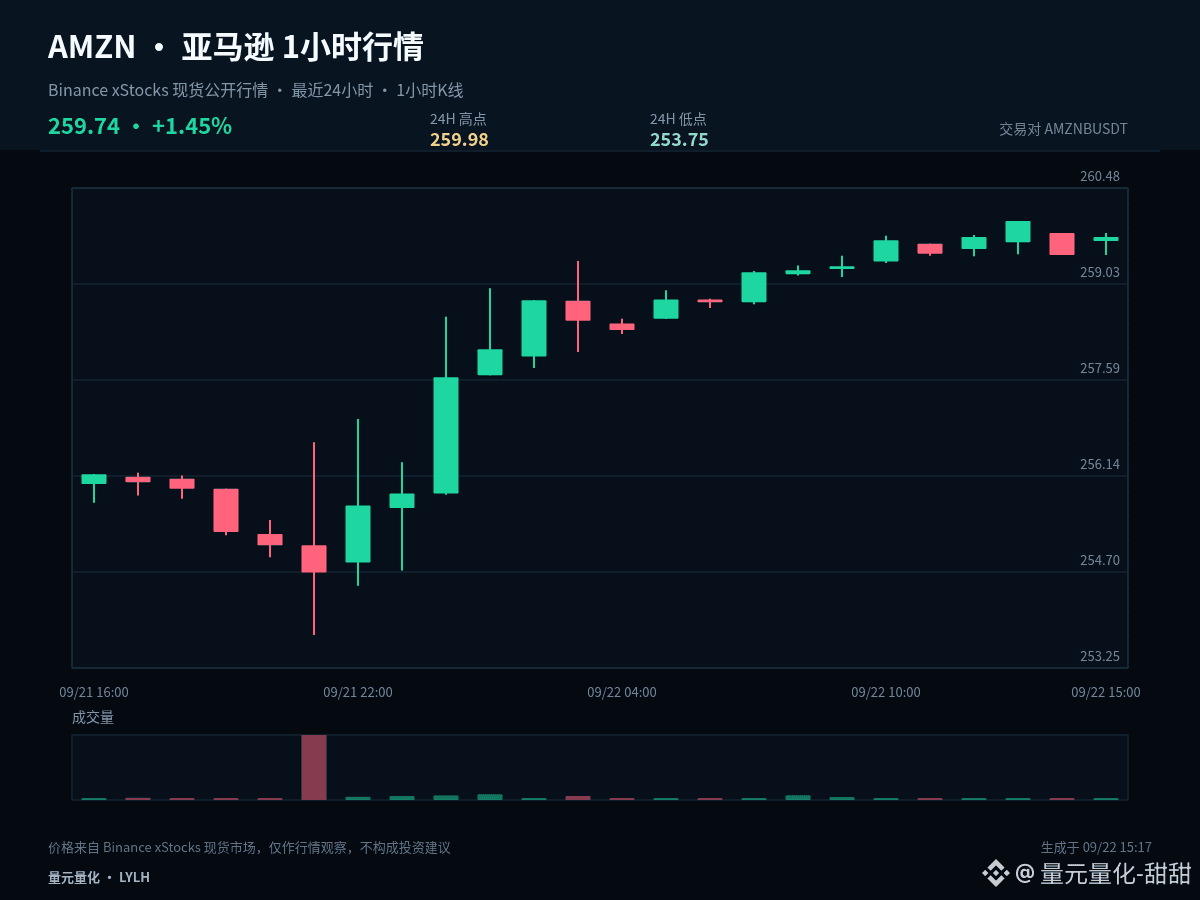
$AMZNB #AMZN Current price 259.74, 1 hour +0.10%, 24 hours +1.48%. Rather than deciding long or short too early, it’s better to lay out the possible paths and the corresponding actions.
The current price is close to the upper bound of the past 24-hour range: 1 hour +0.10%, 24 hours +1.48%. The most important thing at the high end is to confirm the market’s acceptance after a breakout: if the price can stay above the upper band, it means the market recognizes a higher range; if it only briefly pierces and then quickly snaps back, be cautious of a false breakout.
The first scenario is upward: the price needs to break above 259.98 and form a stable closing above it; then only after a pullback that does not break back below it can it be considered a valid confirmation. The second scenario is downward: once 253.75 is lost and any rebound fails to reclaim it, it indicates insufficient support—so prioritize defense rather than rushing to add positions.
If the price continues to stay between 259.98 and 253.75, then 256.865 is only a reference for short-term initiative. In the middle of the range there is no clear advantage, so don’t force a trade just for the sake of having a position—wait for the market to show direction.
Position management should distinguish between swing trades and short-term trades. For existing swing positions, first check whether the structure is broken; don’t be repeatedly influenced by a single 1-hour candlestick. For short-term positions, execute around support, resistance, and closing confirmations. If you’re currently in cash (no position), you don’t need to chase price in the middle of the range—waiting for a clearer location is often more advantageous.
Risk control still comes before any conclusion: execute only when conditions are met, and reassess promptly if the price becomes invalid. The greater the volatility, the more restraint you should exercise with each position. The above is a scenario projection based on the current 1-hour and 24-hour data, and it does not constitute a promise of returns.
#AgoraGetsPreliminaryOCCApprovalForTrustBank
$AMZNB #AMZN Current price 259.74, 1 hour +0.10%, 24 hours +1.48%. Rather than deciding long or short too early, it’s better to lay out the possible paths and the corresponding actions.
The current price is close to the upper bound of the past 24-hour range: 1 hour +0.10%, 24 hours +1.48%. The most important thing at the high end is to confirm the market’s acceptance after a breakout: if the price can stay above the upper band, it means the market recognizes a higher range; if it only briefly pierces and then quickly snaps back, be cautious of a false breakout.
The first scenario is upward: the price needs to break above 259.98 and form a stable closing above it; then only after a pullback that does not break back below it can it be considered a valid confirmation. The second scenario is downward: once 253.75 is lost and any rebound fails to reclaim it, it indicates insufficient support—so prioritize defense rather than rushing to add positions.
If the price continues to stay between 259.98 and 253.75, then 256.865 is only a reference for short-term initiative. In the middle of the range there is no clear advantage, so don’t force a trade just for the sake of having a position—wait for the market to show direction.
Position management should distinguish between swing trades and short-term trades. For existing swing positions, first check whether the structure is broken; don’t be repeatedly influenced by a single 1-hour candlestick. For short-term positions, execute around support, resistance, and closing confirmations. If you’re currently in cash (no position), you don’t need to chase price in the middle of the range—waiting for a clearer location is often more advantageous.
Risk control still comes before any conclusion: execute only when conditions are met, and reassess promptly if the price becomes invalid. The greater the volatility, the more restraint you should exercise with each position. The above is a scenario projection based on the current 1-hour and 24-hour data, and it does not constitute a promise of returns.
#AgoraGetsPreliminaryOCCApprovalForTrustBank
The current price is close to the upper bound of the past 24-hour range: 1 hour +0.10%, 24 hours +1.48%. The most important thing at the high end is to confirm the market’s acceptance after a breakout: if the price can stay above the upper band, it means the market recognizes a higher range; if it only briefly pierces and then quickly snaps back, be cautious of a false breakout.
The first scenario is upward: the price needs to break above 259.98 and form a stable closing above it; then only after a pullback that does not break back below it can it be considered a valid confirmation. The second scenario is downward: once 253.75 is lost and any rebound fails to reclaim it, it indicates insufficient support—so prioritize defense rather than rushing to add positions.
If the price continues to stay between 259.98 and 253.75, then 256.865 is only a reference for short-term initiative. In the middle of the range there is no clear advantage, so don’t force a trade just for the sake of having a position—wait for the market to show direction.
Position management should distinguish between swing trades and short-term trades. For existing swing positions, first check whether the structure is broken; don’t be repeatedly influenced by a single 1-hour candlestick. For short-term positions, execute around support, resistance, and closing confirmations. If you’re currently in cash (no position), you don’t need to chase price in the middle of the range—waiting for a clearer location is often more advantageous.
Risk control still comes before any conclusion: execute only when conditions are met, and reassess promptly if the price becomes invalid. The greater the volatility, the more restraint you should exercise with each position. The above is a scenario projection based on the current 1-hour and 24-hour data, and it does not constitute a promise of returns.
#AgoraGetsPreliminaryOCCApprovalForTrustBank
14
Log in to explore more content
Join global crypto users on Binance Square
⚡️ Get latest and useful information about crypto.
💬 Trusted by the world’s largest crypto exchange.
👍 Discover real insights from verified creators.
Email / Phone number
Trending Topics
1
#NFPWatch
10.4M views
16,772 Discussing
2
#BitcoinRisesToward$85K
4,565 views
27 Discussing
3
#AmazonPlansToSell$8BNvidiaChips
764 views
30 Discussing
4
#NEARFallsToAround$4.70Down14%
29,770 views
63 Discussing
5
#EthereumFoundationLaunchesZkAPIOnMainnet
37,201 views
541 Discussing
6
#EvernorthPlansNasdaqListingOct8
60,106 views
484 Discussing
7
#SECProposesCryptoCustodyFramework
53,020 views
420 Discussing
8
#IMFApproves$139MDisbursementToElSalvador
28,131 views
27 Discussing
9
#AnthropicTargetsIPOAsSoonAsMidNovember
35,387 views
359 Discussing
10
#EtherGains70.9%InQ3
254,908 views
1,719 Discussing