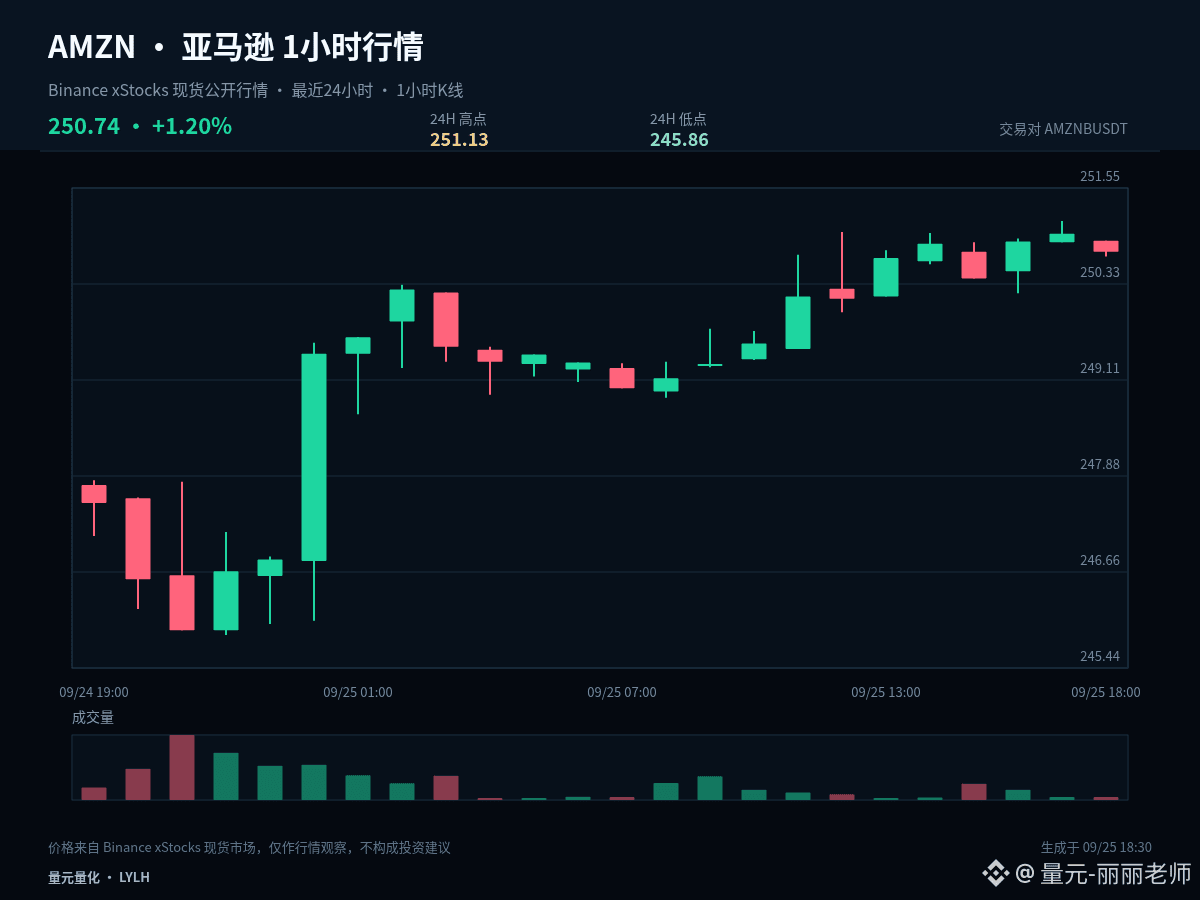
$AMZNB #AMZN It now looks more like range trading and turnover; there’s no need to interpret every 1-hour candlestick as a brand-new trend. Current price: 250.74; 1 hour: -0.09%, 24 hours: +1.28%.
The current price is close to the upper edge of the past 24-hour range: 1 hour -0.09%, 24 hours +1.28%. The most important thing at the highs is to confirm post-breakout acceptance. If price can stay above the upper edge, it shows the market is recognizing a higher range; if it only briefly pierces and then quickly snaps back, you need to watch out for a false breakout.
Upper edge: 251.13, lower edge: 245.86, midline: 248.495. When near the upper edge, look at breakout quality; when near the lower edge, look at how well it holds/gets support. Around the midline, reduce frequent trading because it’s not far enough from either side—direction and risk/reward aren’t clear.
The signals worth acting on are: after a boundary break, price is willing to remain in the new range; or after testing the boundary downward, it quickly reclaims. Without such confirmation, keep treating it as consolidation—don’t let brief intraday fluctuations change the overall plan.
Existing positions can be handled in segments based on key levels to avoid making all decisions at once. Those with no position should wait for breakout confirmation or a pullback to stabilize. For U.S. market assets, also watch for volatility caused by trading-session transitions; the plan should be based on price conditions—don’t let emotion replace execution.
Risk control still comes before the conclusion: only execute when conditions are met, and re-evaluate promptly if the price becomes invalid. The larger the volatility, the more restrained each single position should be. The above is a scenario analysis based on current 1-hour and 24-hour data; it does not constitute a promise of returns.
#OndoFinanceSoughtSaleAfterFoundersDeath
The current price is close to the upper edge of the past 24-hour range: 1 hour -0.09%, 24 hours +1.28%. The most important thing at the highs is to confirm post-breakout acceptance. If price can stay above the upper edge, it shows the market is recognizing a higher range; if it only briefly pierces and then quickly snaps back, you need to watch out for a false breakout.
Upper edge: 251.13, lower edge: 245.86, midline: 248.495. When near the upper edge, look at breakout quality; when near the lower edge, look at how well it holds/gets support. Around the midline, reduce frequent trading because it’s not far enough from either side—direction and risk/reward aren’t clear.
The signals worth acting on are: after a boundary break, price is willing to remain in the new range; or after testing the boundary downward, it quickly reclaims. Without such confirmation, keep treating it as consolidation—don’t let brief intraday fluctuations change the overall plan.
Existing positions can be handled in segments based on key levels to avoid making all decisions at once. Those with no position should wait for breakout confirmation or a pullback to stabilize. For U.S. market assets, also watch for volatility caused by trading-session transitions; the plan should be based on price conditions—don’t let emotion replace execution.
Risk control still comes before the conclusion: only execute when conditions are met, and re-evaluate promptly if the price becomes invalid. The larger the volatility, the more restrained each single position should be. The above is a scenario analysis based on current 1-hour and 24-hour data; it does not constitute a promise of returns.
#OndoFinanceSoughtSaleAfterFoundersDeath