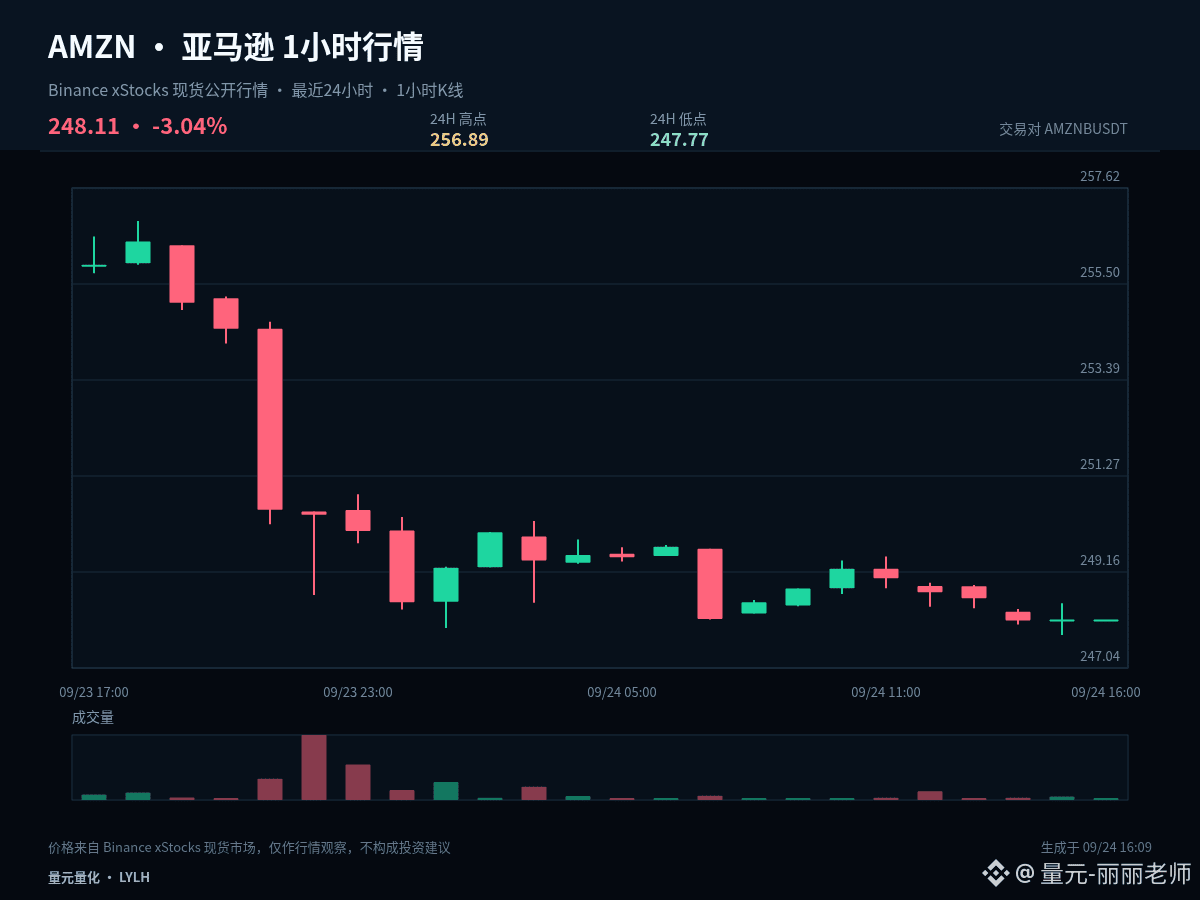
$AMZNB #AMZN A quick conclusion first: hold 252.33, then there will be conditions to continue testing 256.89. Current price is 248.11, 1 hour 0.00%, 24 hours -3.07%.
The current price is close to the lower end of the last 24-hour range: 1 hour 0.00%, 24 hours -3.07%. The core of low-level analysis isn’t trying to bottom-fish early; it’s to watch whether it can quickly reclaim after a breakdown. If it can reclaim, it indicates sell pressure is being absorbed. If it keeps lingering below the lower band, that suggests the weakness hasn’t ended.
For key levels, 252.33 is the center pivot of the current structure and the first benchmark for judging whether a pullback is healthy. As long as price can hold steadily above it, the bulls still have the initiative. The first target above is 256.89. If price drops back below the pivot, then attention shifts to the second support at 247.77.
My scenario isn’t betting on just one direction. A breakout above 256.89 and the ability to hold it means upside space has been reopened. A breakdown below 247.77 with no successful retest indicates the structure is further weakening. If it stays trading between the two, then continue monitoring the closing behavior on both sides of 252.33.
Existing positions can be handled in stages based on the key levels to avoid making all decisions at once. Those with no position should wait for a confirmed breakout or a sign that pullback has stabilized. For US equities, also watch for volatility caused by session transitions. Your plan should be based on price conditions—not let emotions replace execution.
Simplifying the conclusion doesn’t mean simplifying risk control. In real execution, you still need to wait for price confirmation and leave room to exit if your judgment proves invalid. Next, I’ll focus on tracking what happens around 252.33—whether it’s defended or lost. Do you think it’s more likely to test 256.89 first, or return to 247.77 first? Feel free to share your view and reasoning.
#DollarIndexReclaims101
The current price is close to the lower end of the last 24-hour range: 1 hour 0.00%, 24 hours -3.07%. The core of low-level analysis isn’t trying to bottom-fish early; it’s to watch whether it can quickly reclaim after a breakdown. If it can reclaim, it indicates sell pressure is being absorbed. If it keeps lingering below the lower band, that suggests the weakness hasn’t ended.
For key levels, 252.33 is the center pivot of the current structure and the first benchmark for judging whether a pullback is healthy. As long as price can hold steadily above it, the bulls still have the initiative. The first target above is 256.89. If price drops back below the pivot, then attention shifts to the second support at 247.77.
My scenario isn’t betting on just one direction. A breakout above 256.89 and the ability to hold it means upside space has been reopened. A breakdown below 247.77 with no successful retest indicates the structure is further weakening. If it stays trading between the two, then continue monitoring the closing behavior on both sides of 252.33.
Existing positions can be handled in stages based on the key levels to avoid making all decisions at once. Those with no position should wait for a confirmed breakout or a sign that pullback has stabilized. For US equities, also watch for volatility caused by session transitions. Your plan should be based on price conditions—not let emotions replace execution.
Simplifying the conclusion doesn’t mean simplifying risk control. In real execution, you still need to wait for price confirmation and leave room to exit if your judgment proves invalid. Next, I’ll focus on tracking what happens around 252.33—whether it’s defended or lost. Do you think it’s more likely to test 256.89 first, or return to 247.77 first? Feel free to share your view and reasoning.
#DollarIndexReclaims101