

#12
12
33,806 views
478 Discussing
Hot
Latest

·
--
$JCT This move rallied 4.41% in 15m, with volume surging to 2.29x. The buy/sell ratio was 1.71, aggressive trade imbalance was 26.1%, and the close finished above the high of nearly 20 recent 5m candles—a classic breakout with rising price and volume. OI edged up 0.27% over 15m, with a notional change of 361K, while the 1h notional change was 1.08M alongside a 0.16% dip in OI. This looks more like fresh short-term leveraged longs driving the move than short covering. It ranked #20 for anomalies across the pool and #12 for notional change, and passed the depth confirmation check. Its 24h trading volume of 43.61M is substantial. As long as volume holds up, there may be more upside, but don't chase a 15m breakout too aggressively—waiting for a pullback confirmation is safer.
$JCT This move rallied 4.41% in 15m, with volume surging to 2.29x. The buy/sell ratio was 1.71, aggressive trade imbalance was 26.1%, and the close finished above the high of nearly 20 recent 5m candles—a classic breakout with rising price and volume. OI edged up 0.27% over 15m, with a notional change of 361K, while the 1h notional change was 1.08M alongside a 0.16% dip in OI. This looks more like fresh short-term leveraged longs driving the move than short covering. It ranked #20 for anomalies across the pool and #12 for notional change, and passed the depth confirmation check. Its 24h trading volume of 43.61M is substantial. As long as volume holds up, there may be more upside, but don't chase a 15m breakout too aggressively—waiting for a pullback confirmation is safer.
2

·
--
$Q has dropped 8.48% in the last 15 minutes, while volume has climbed to more than 2x. OI is also up 4% over 1h, against the trend. Price down + open interest up looks more like new shorts entering with leverage than a simple long liquidation.
The funding rate plunged to -2.0000%, putting it at the 100th percentile for the near term. It ranks #12 among all-pool anomalies—this level of crowding is pretty conspicuous. Taker trade delta is -4.3%, so there’s definitely selling pressure.
I’ll keep an eye on this area: if the funding rate hits an extreme while OI keeps building but the price stops falling, watch out for shorts squeezing themselves.

·
--
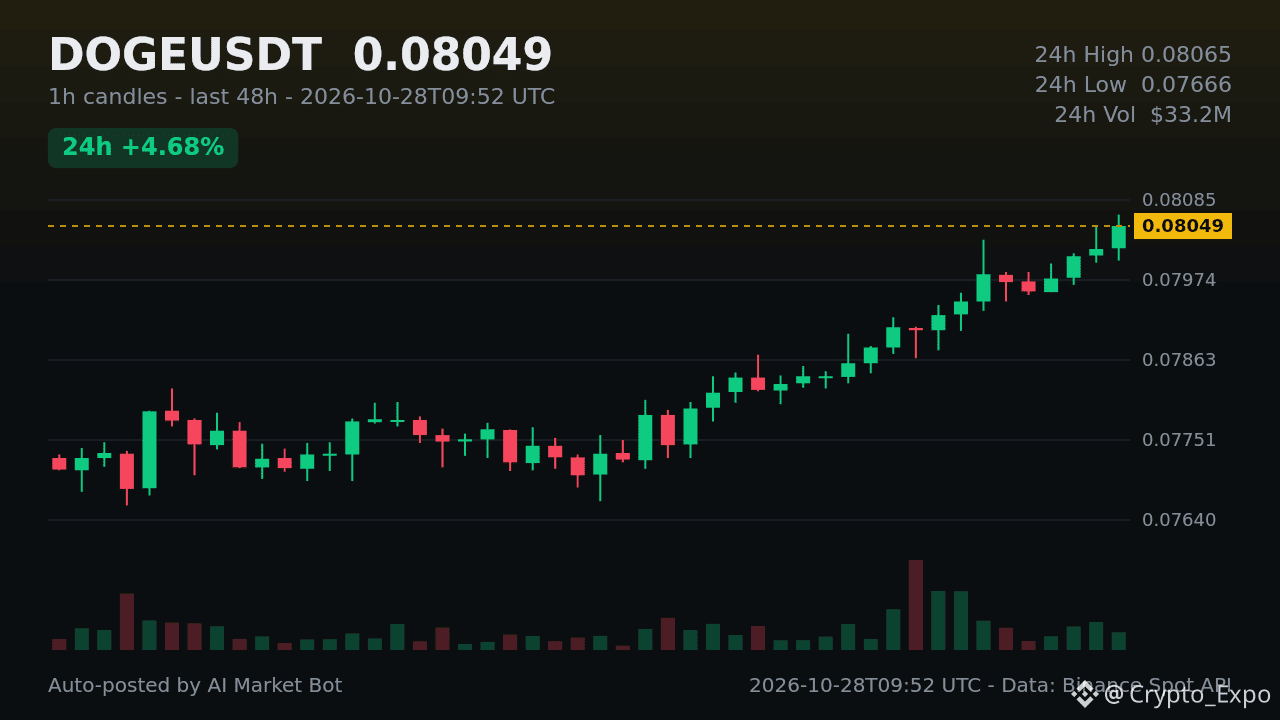
Dogecoin surged 4.54% over the past 24 hours, landing it at #12 on CoinGecko’s trending page. The meme‑coin, driven by its active community, is seeing renewed interest as social sentiment lifts. Hourly candles show the nearest support around $0.08001 and resistance near $0.08065. How are traders positioning around these levels? #DOGE# #Altcoins# #Trending#
Dogecoin surged 4.54% over the past 24 hours, landing it at #12 on CoinGecko’s trending page. The meme‑coin, driven by its active community, is seeing renewed interest as social sentiment lifts. Hourly candles show the nearest support around $0.08001 and resistance near $0.08065. How are traders positioning around these levels? #DOGE# #Altcoins# #Trending#
31
·
--
WLD’s sell-off this time is pretty brutal: it plunged 4% in just 15m, with volume surging to 16 times its usual level. The key is that OI is dropping at the same time—down 2.83% over 15m and 3.23% over 1h, with notional value shrinking by over $8 million. This isn’t fresh short positioning; longs are being liquidated, stopped out, and actively reducing their positions. The aggressive trade delta is -18.9%, and the buy/sell ratio is 0.68, showing clearly one-sided selling pressure.
The OI anomaly percentile hit 100%, ranking #18 across the entire pool, while notional change ranked #12. And this has persisted over several consecutive intervals, so it’s not just a single wick. 24h trading volume is still $250 million, and market depth has been confirmed—don’t expect this to be a false move caused by a liquidity vacuum.
Price down + OI down: a classic deleveraging structure. I’m in no rush to catch the dip here. I’ll wait until the leverage is flushed out and OI stabilizes.
5
·
--
$Bull Arrives, this rally is getting interesting: it surged 1.57% in 15m, volume hit 2.12x, and the closing price broke above the highs of the last 20 5m candles.
But look closer: OI barely moved, and the 1h figure is still negative—the price went up, but positions didn't follow. This looks more like short covering or existing positions driving the move, rather than fresh money flowing in. The taker volume delta is 18%, and the buy/sell ratio is 1.44, so buyers really are scrambling to get in over the short term.
The funding rate has already climbed to a high percentile for recent periods. Be careful chasing longs with this kind of setup: if sentiment cools and the short-covering money exits, the gains could easily be given back. 24h trading volume is only a little over 11M, so the pool isn't deep. The abnormal percentile is 86.5%, ranking #12 across the whole pool. It's lively, but don't get carried away.
12
·
--
$CT This 15m high-volume drop is worth paying attention to: volume surged to over 6x, and the price broke below the lower bound of the past 20 5m ranges. The taker buy/sell ratio is 0.77, with selling pressure clearly skewed to one side. OI is still edging up; falling prices alongside rising open interest suggest new leveraged shorts are entering, rather than this being merely a long squeeze. The anomaly percentile is 88.3%, ranking #12 across the entire pool, and depth confirmation is also solid. 24h trading volume is under 20 million, so liquidity is relatively thin; a sudden spike in volume like this warrants extra caution. First, watch whether price can reclaim the lower bound of this range. If it can't, short-term sentiment may come under further pressure.
$CT This 15m high-volume drop is worth paying attention to: volume surged to over 6x, and the price broke below the lower bound of the past 20 5m ranges. The taker buy/sell ratio is 0.77, with selling pressure clearly skewed to one side. OI is still edging up; falling prices alongside rising open interest suggest new leveraged shorts are entering, rather than this being merely a long squeeze. The anomaly percentile is 88.3%, ranking #12 across the entire pool, and depth confirmation is also solid. 24h trading volume is under 20 million, so liquidity is relatively thin; a sudden spike in volume like this warrants extra caution. First, watch whether price can reclaim the lower bound of this range. If it can't, short-term sentiment may come under further pressure.
41

Article
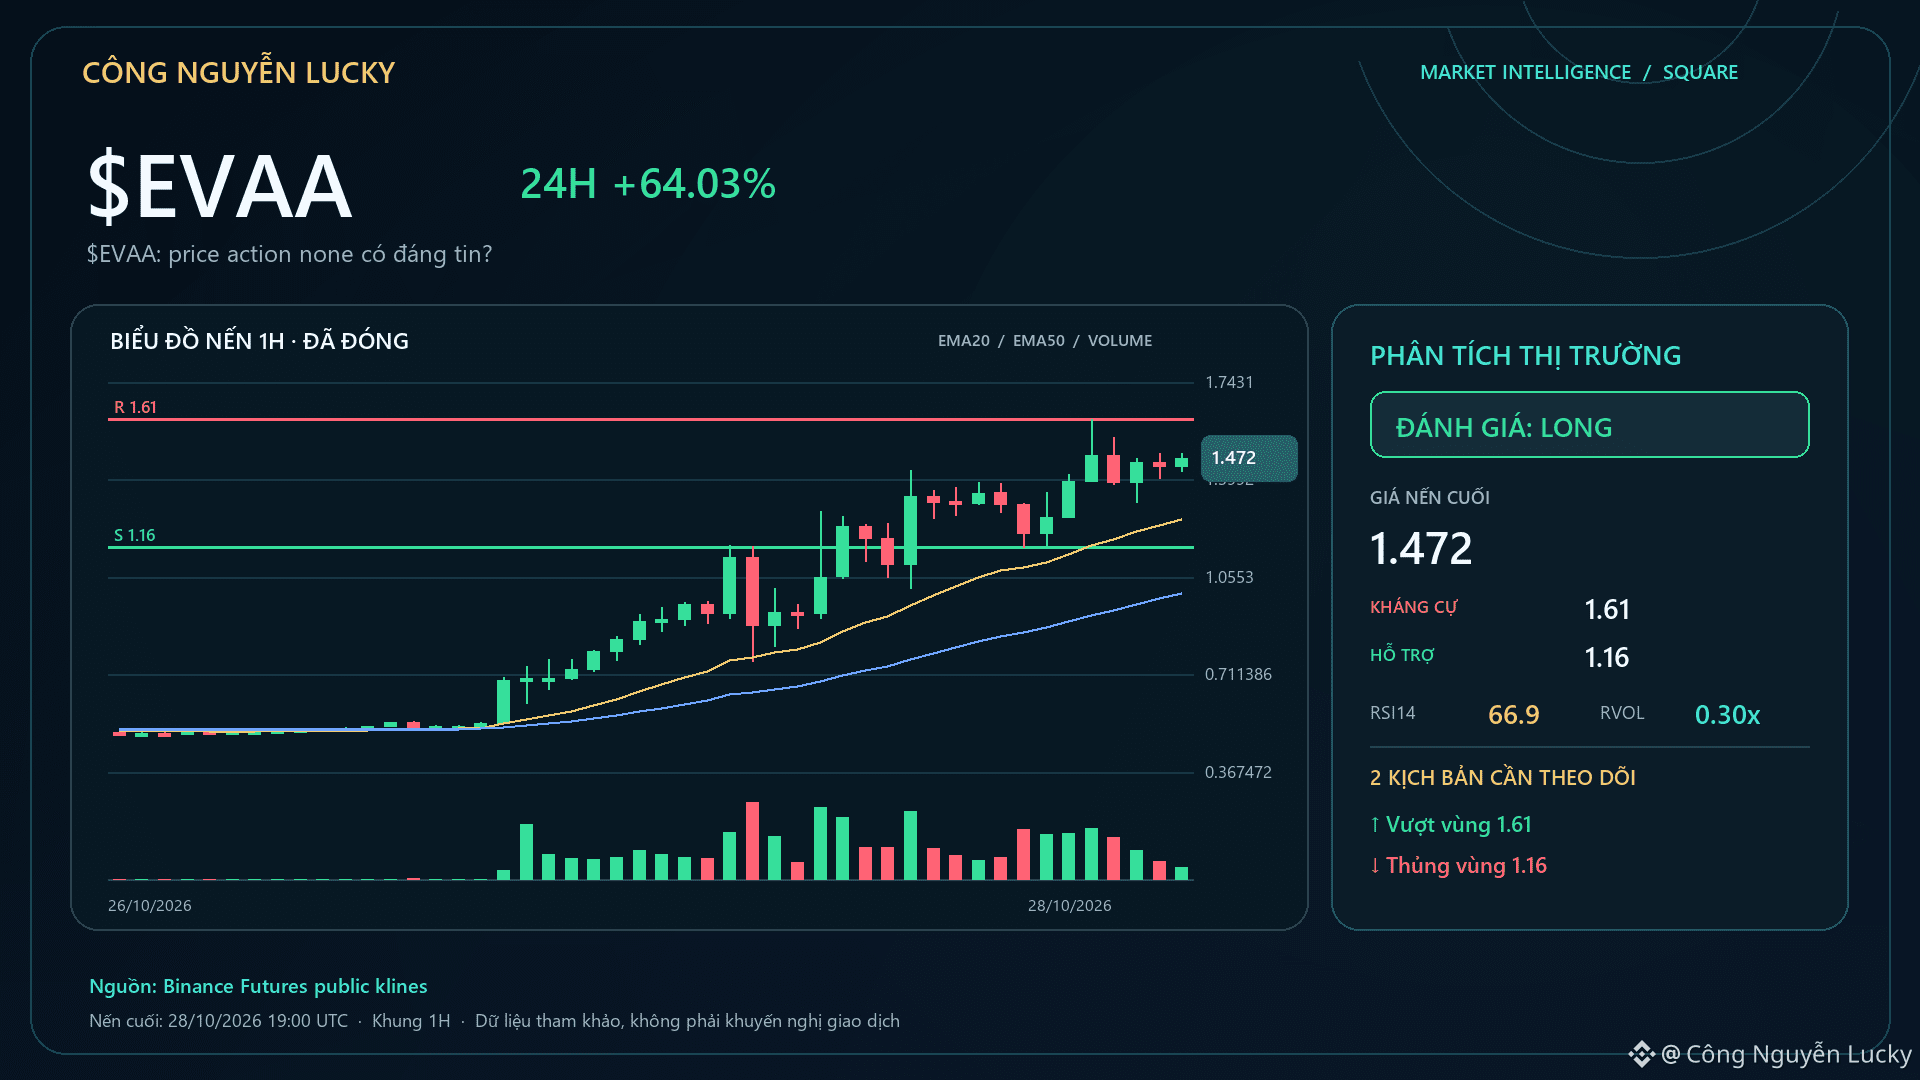
$EVAA: Is “price action none” reliable?🔥 $EVAA is up +60.23% — but a percentage gain/loss alone isn’t enough to call this a good setup. Market: 1.4416 · 24h +60.23% · volume ~567.8M USDT · 8,844,970 trades.
Technical bias LONG 83/100 · support 1.16 · resistance 1.61. Candlestick patterns only matter when they appear in the right structural context and are confirmed by the next candle/volume; otherwise, ignore them. Technical layers are currently being selected by regime:
1H status: UPTREND · technical bias LONG 83/100 · 1H/4H: MIXED.
$EVAA: Is “price action none” reliable?
🔥 $EVAA is up +60.23% — but a percentage gain/loss alone isn’t enough to call this a good setup. Market: 1.4416 · 24h +60.23% · volume ~567.8M USDT · 8,844,970 trades.
Technical bias LONG 83/100 · support 1.16 · resistance 1.61. Candlestick patterns only matter when they appear in the right structural context and are confirmed by the next candle/volume; otherwise, ignore them. Technical layers are currently being selected by regime:
1H status: UPTREND · technical bias LONG 83/100 · 1H/4H: MIXED.
7
Article
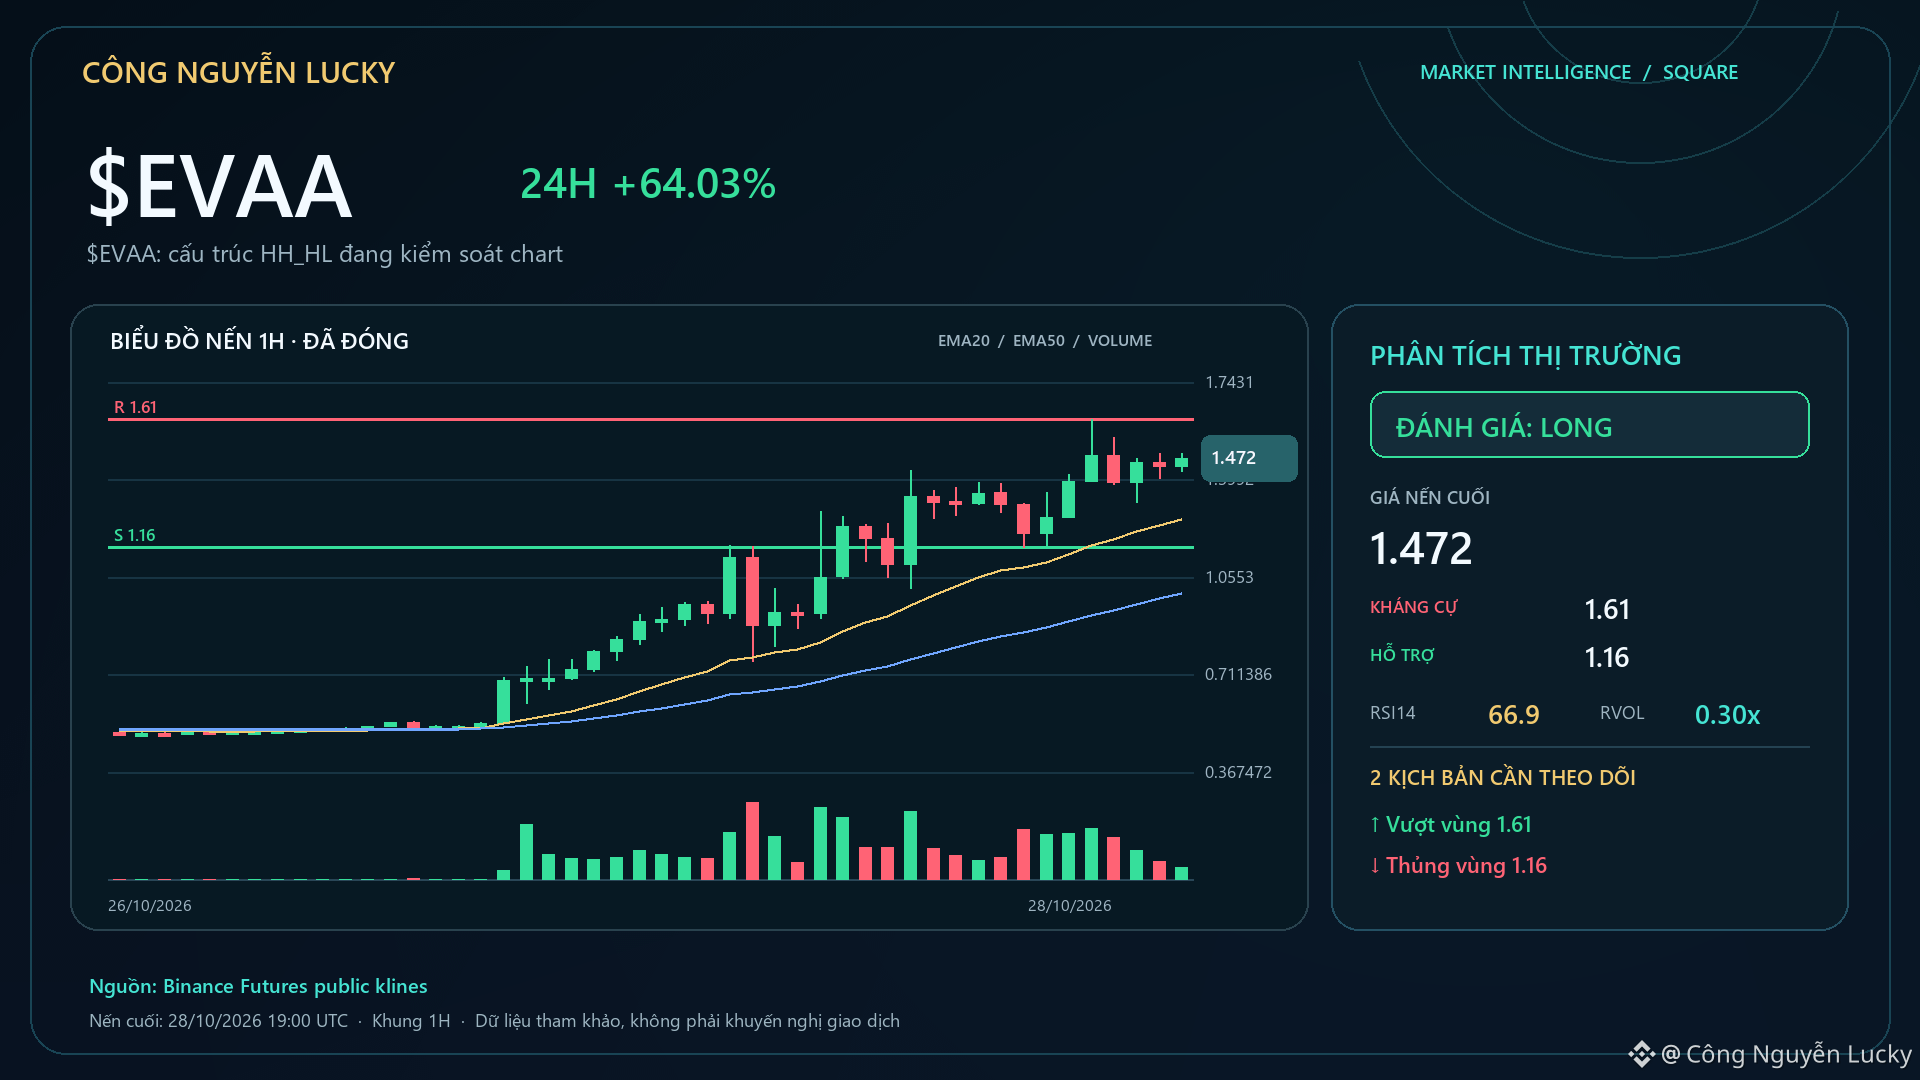
$EVAA: HH_HL structure is in control of the chart🔥 $EVAA is up +57.19% — but a percentage gain or loss alone isn’t enough to call this a good setup. Market: 1.4468 · 24h +57.19% · volume ~567.4M USDT · 8,841,762 trades.
Swing high near 1.61 · swing low near 1.16.
EMA50 0.99763211 · RSI14 66.9 · LONG bias 83/100. Indicators are used to confirm the structure, not replace it. Losing 1.16 or breaking above 1.61 would be the clearest points at which the narrative changes. The technical layers are being selected according to the regime:
$EVAA: HH_HL structure is in control of the chart
🔥 $EVAA is up +57.19% — but a percentage gain or loss alone isn’t enough to call this a good setup. Market: 1.4468 · 24h +57.19% · volume ~567.4M USDT · 8,841,762 trades.
Swing high near 1.61 · swing low near 1.16.
EMA50 0.99763211 · RSI14 66.9 · LONG bias 83/100. Indicators are used to confirm the structure, not replace it. Losing 1.16 or breaking above 1.61 would be the clearest points at which the narrative changes. The technical layers are being selected according to the regime:
228
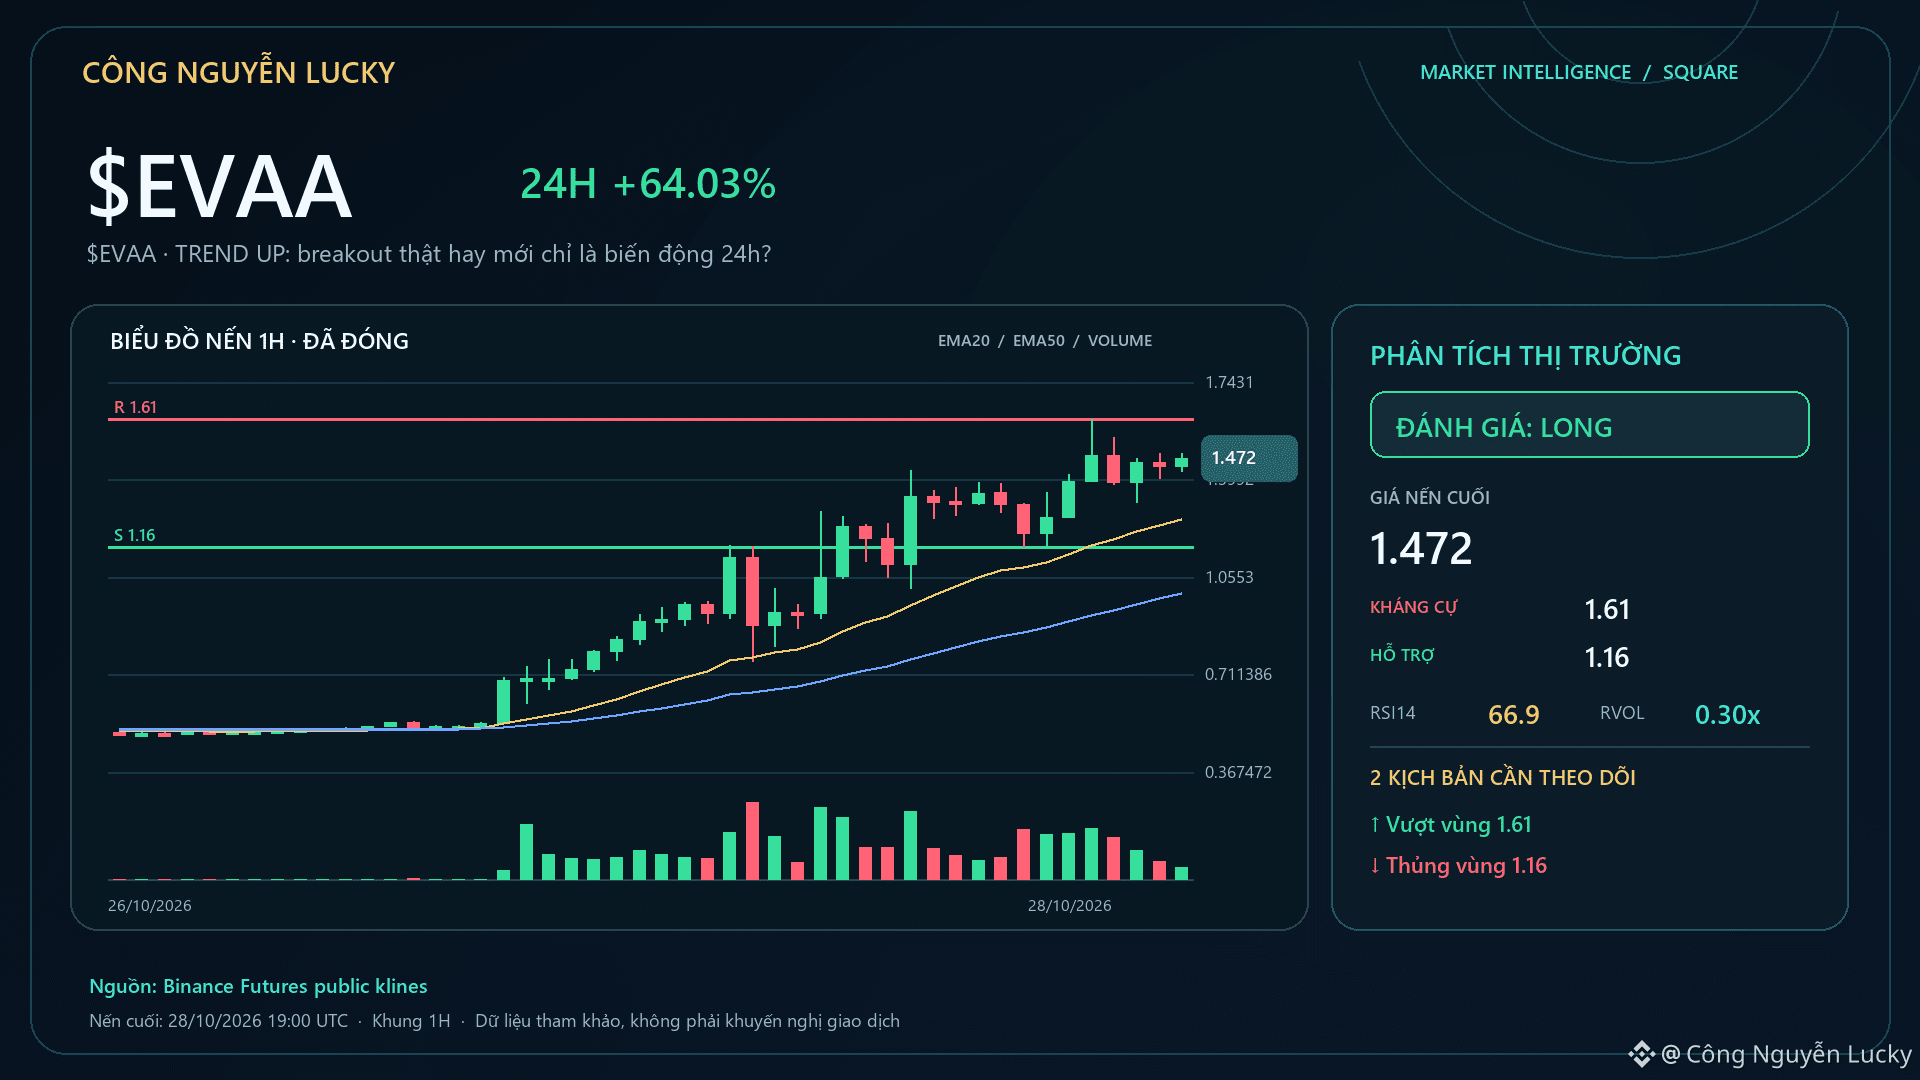
Article
$EVAA · TREND UP: a genuine breakout or just 24-hour volatility?🔥 $EVAA is up +67.88% — but a percentage gain or loss alone isn’t enough to call this a good setup. Market: 1.4777 · 24h +67.88% · volume ~566.4M USDT · 8,828,061 trades.
User interest: 38/100. If interest translates into actual trading: Breaking above 1.61 with expanding volume would make the continuation scenario more credible.
If search interest rises but the market doesn’t confirm: Failing to hold the highs and falling back below the 1.1842 midpoint would make the cooldown scenario more likely. 🧭 Current bias: **LONG · STRONG · 87/100**.
$EVAA · TREND UP: a genuine breakout or just 24-hour volatility?
🔥 $EVAA is up +67.88% — but a percentage gain or loss alone isn’t enough to call this a good setup. Market: 1.4777 · 24h +67.88% · volume ~566.4M USDT · 8,828,061 trades.
User interest: 38/100. If interest translates into actual trading: Breaking above 1.61 with expanding volume would make the continuation scenario more credible.
If search interest rises but the market doesn’t confirm: Failing to hold the highs and falling back below the 1.1842 midpoint would make the cooldown scenario more likely. 🧭 Current bias: **LONG · STRONG · 87/100**.
1
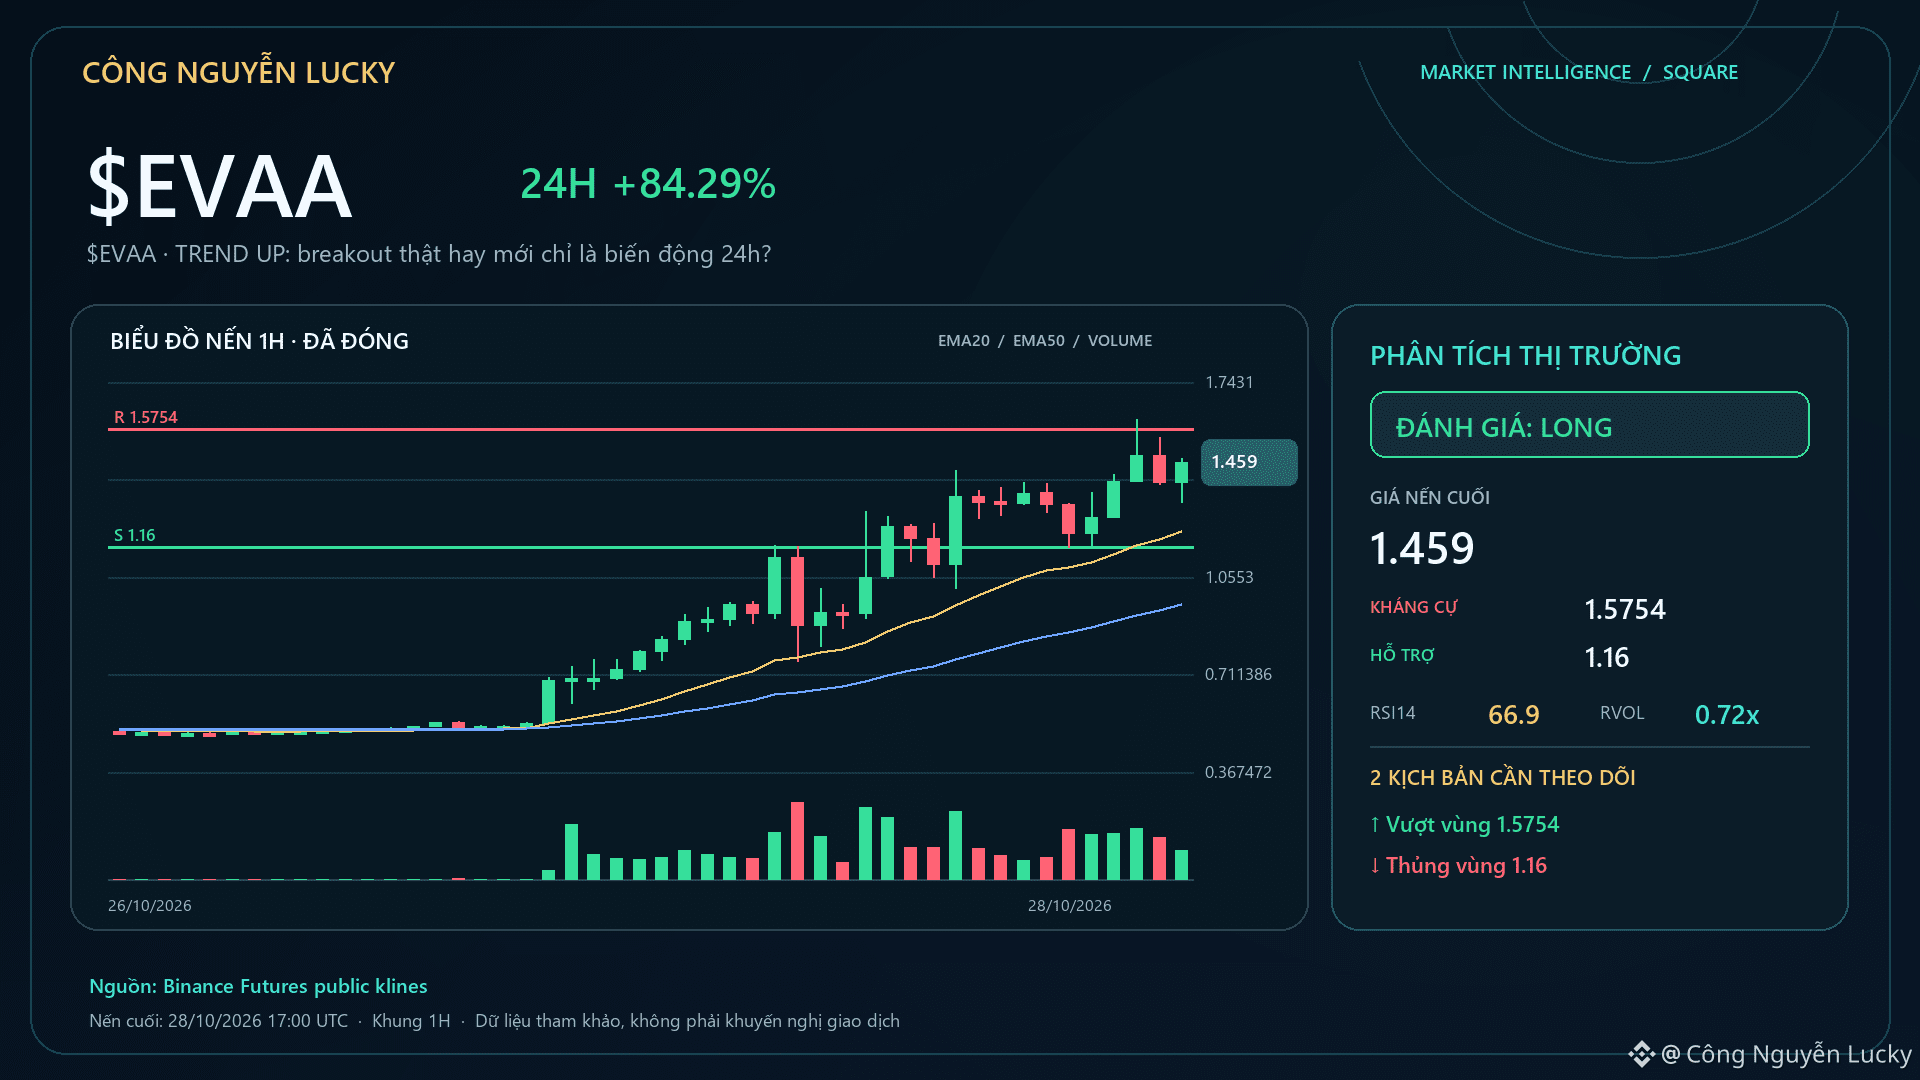
Article
$EVAA · TREND UP: real breakout or just 24h volatility?🧠 A costly lesson in trading: don’t try to prove you’re right when $EVAA price is moving against your view. A coin surging doesn’t mean you have to chase it, but it’s also no reason to call a top or bottom just because it seems to have “gone too far.” Current market snapshot: 1.4424 · 24h +72.12% · volume ~567.9M USDT · 8,871,060 trades. Takeaway: Follow the trend while the structure confirms it; change your thesis when the data changes, not when your ego wants to win.
$EVAA · TREND UP: real breakout or just 24h volatility?
🧠 A costly lesson in trading: don’t try to prove you’re right when $EVAA price is moving against your view. A coin surging doesn’t mean you have to chase it, but it’s also no reason to call a top or bottom just because it seems to have “gone too far.” Current market snapshot: 1.4424 · 24h +72.12% · volume ~567.9M USDT · 8,871,060 trades. Takeaway: Follow the trend while the structure confirms it; change your thesis when the data changes, not when your ego wants to win.
163
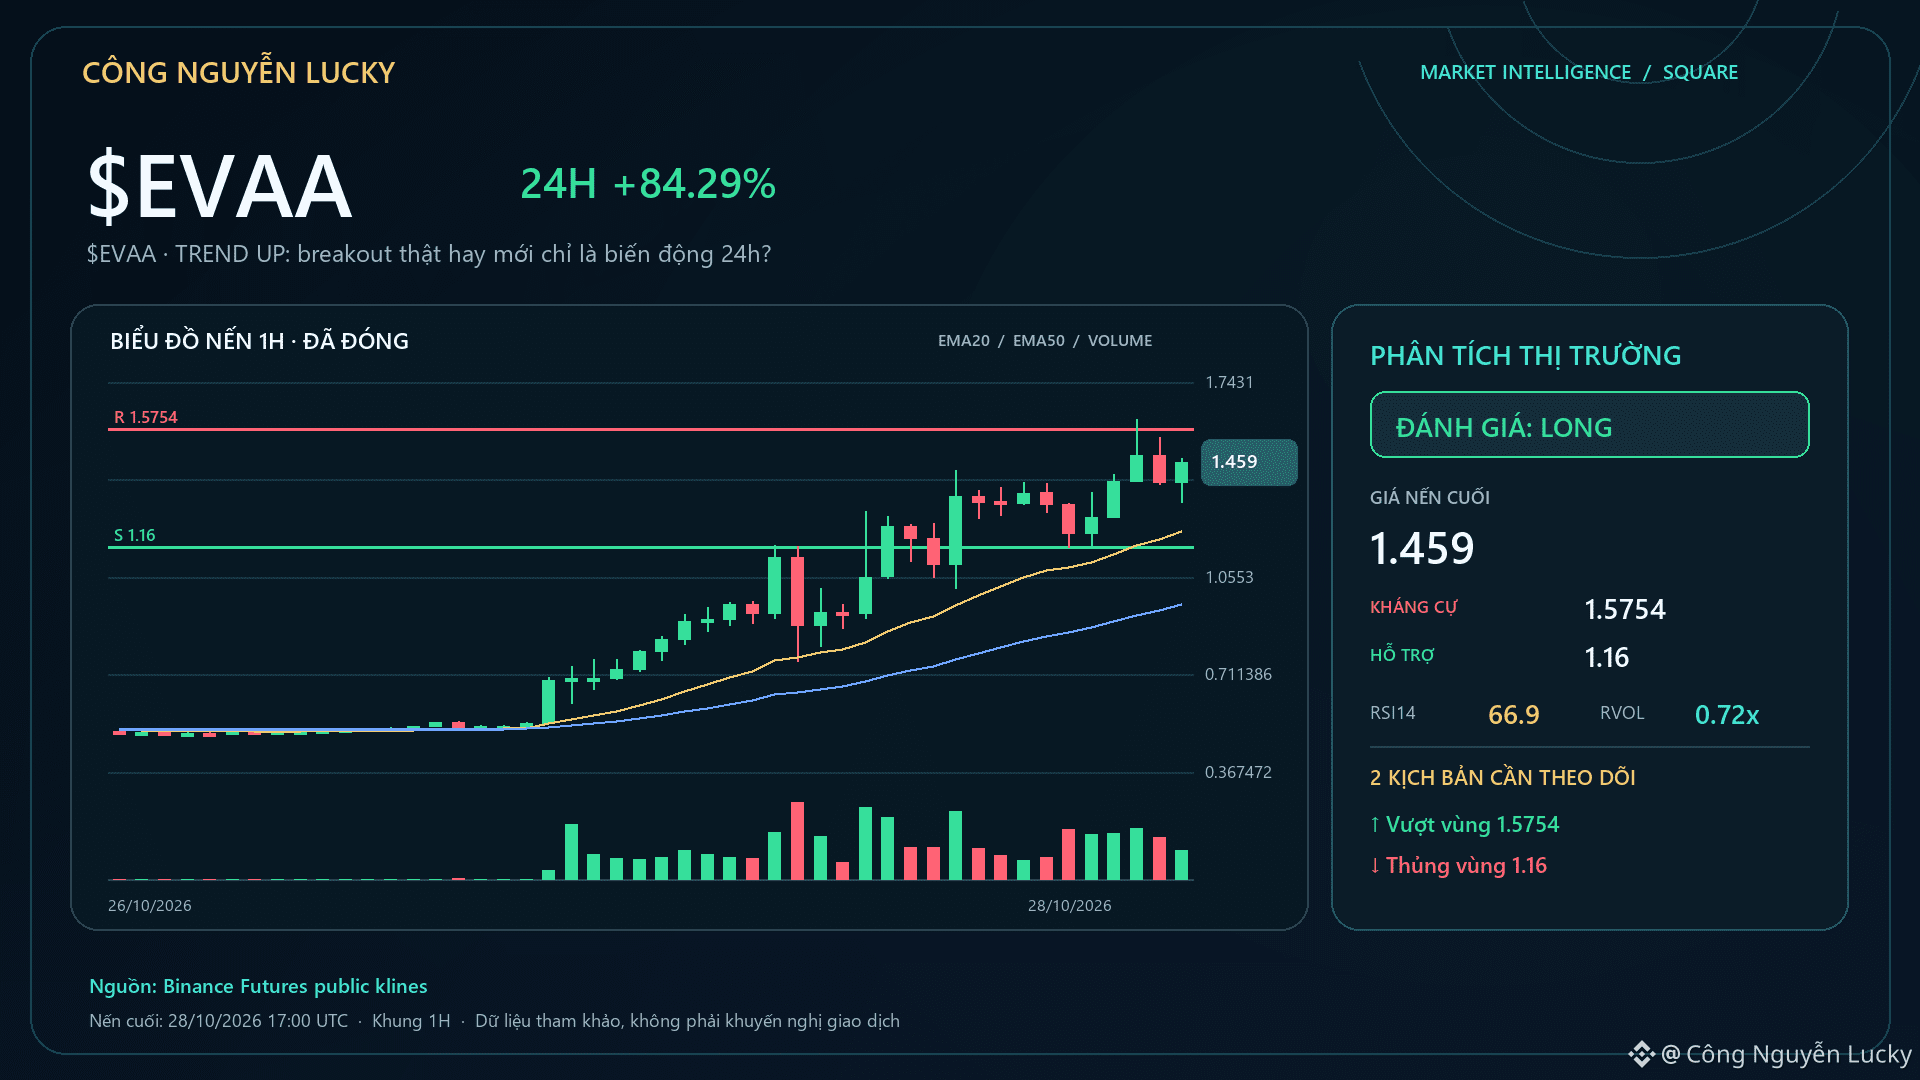
Article
$EVAA · TREND UP: genuine breakout or just 24-hour volatility?🔥 $EVAA is up +77.65% — but the percentage gain or loss alone isn’t enough to call this a good setup. 1.4358 · 24h +77.65% · volume ~566.7M USDT · 8,853,519 trades.
Market-focus participation score: 99/100.
Range position: 80/100. Positive signal: A move above 1.61 with rising volume would make the continuation scenario more credible.
Signal to watch: Failing to hold the highs and falling back below the midpoint at 1.1842 would make the cooling-off scenario more likely. 🧭 Current outlook: **LONG · STRONG · 87/100**.
$EVAA · TREND UP: genuine breakout or just 24-hour volatility?
🔥 $EVAA is up +77.65% — but the percentage gain or loss alone isn’t enough to call this a good setup. 1.4358 · 24h +77.65% · volume ~566.7M USDT · 8,853,519 trades.
Market-focus participation score: 99/100.
Range position: 80/100. Positive signal: A move above 1.61 with rising volume would make the continuation scenario more credible.
Signal to watch: Failing to hold the highs and falling back below the midpoint at 1.1842 would make the cooling-off scenario more likely. 🧭 Current outlook: **LONG · STRONG · 87/100**.
719
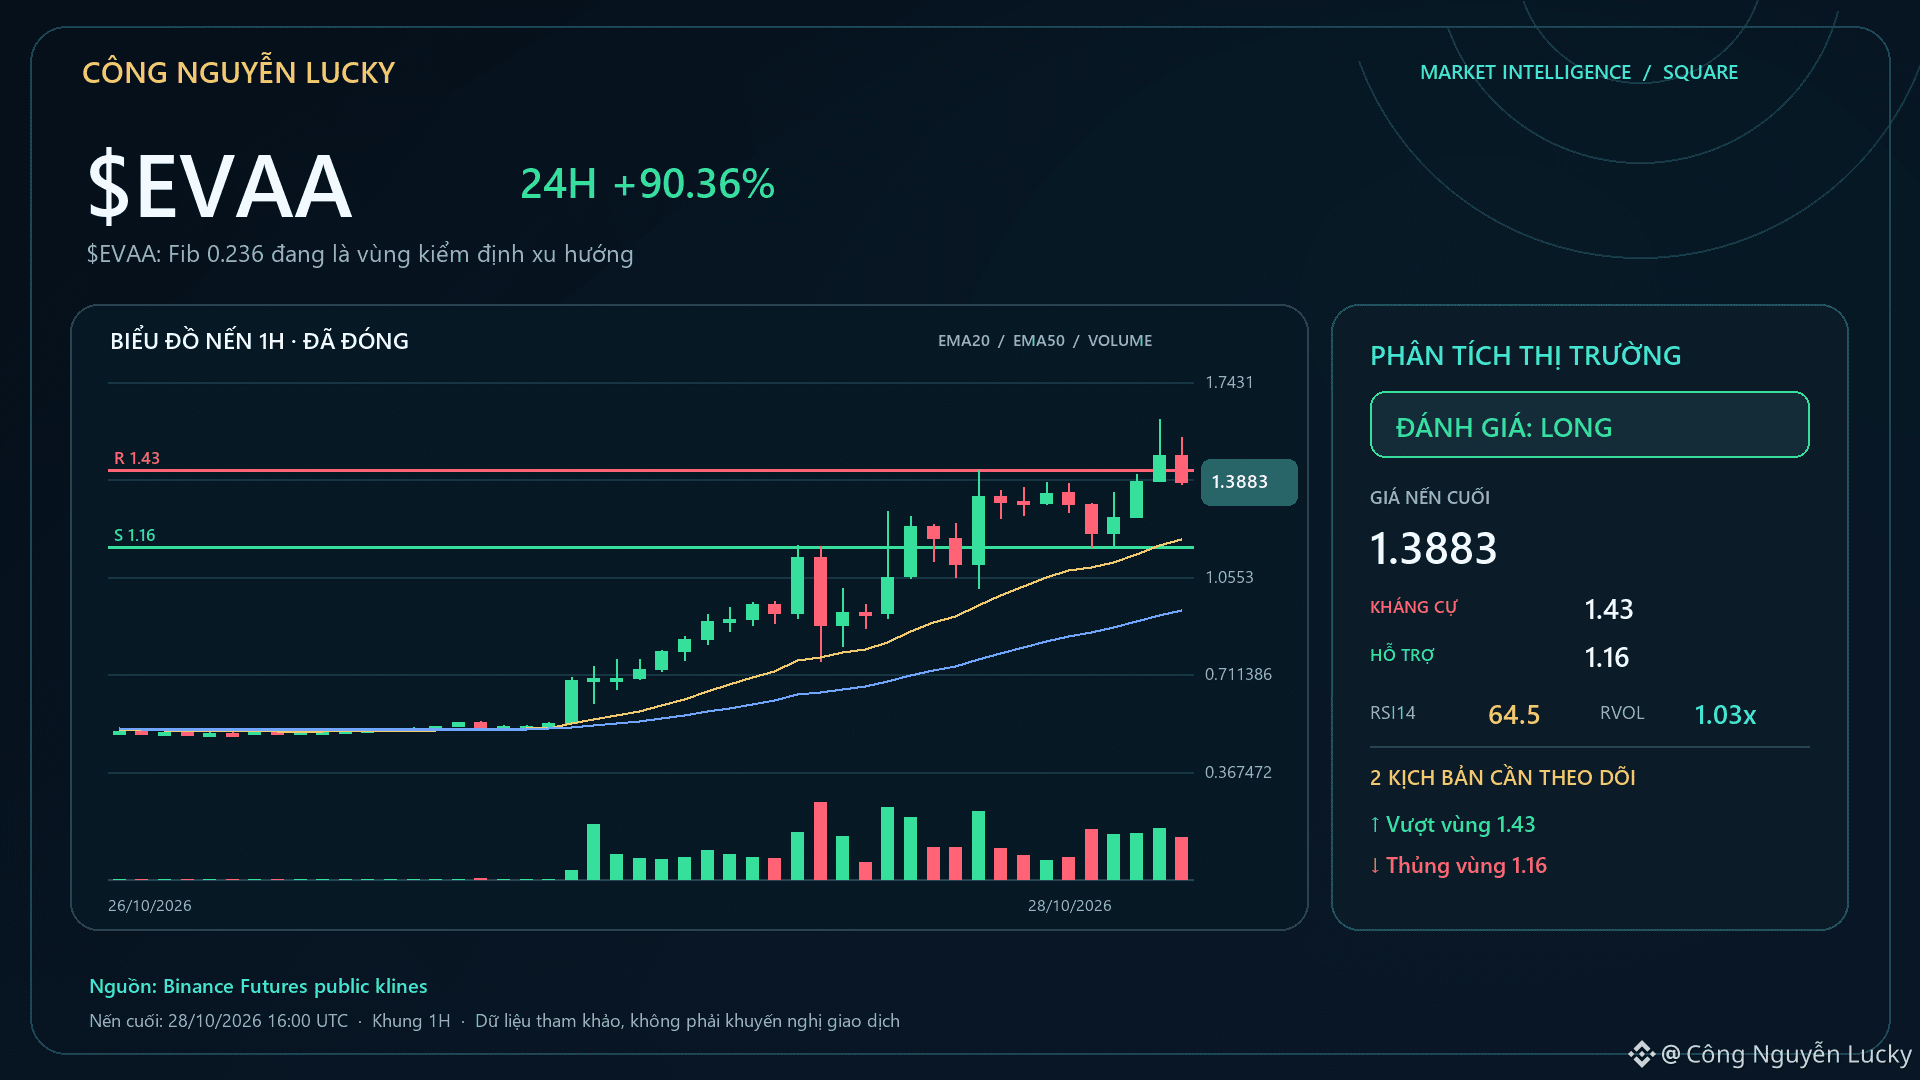
Article
$EVAA: Fib 0.236 is acting as a trend test zone🔥 $EVAA is up +83.20% — but the percentage gain/loss alone isn't enough to call this a good setup. Market: 1.4383 · 24h +83.20% · volume ~561.7M USDT · 8,805,492 trades.
Technical context: UPTREND · LONG bias 100/100.
Golden zone 0.50–0.618: 0.9187052–1.0507. Confirmation point: price reacts in the right direction at the Fib zone and holds the main structure/EMA.
Invalidation point: breaks 1.16 with momentum moving against the bias. The technical layers are being selected according to the regime:
$EVAA: Fib 0.236 is acting as a trend test zone
🔥 $EVAA is up +83.20% — but the percentage gain/loss alone isn't enough to call this a good setup. Market: 1.4383 · 24h +83.20% · volume ~561.7M USDT · 8,805,492 trades.
Technical context: UPTREND · LONG bias 100/100.
Golden zone 0.50–0.618: 0.9187052–1.0507. Confirmation point: price reacts in the right direction at the Fib zone and holds the main structure/EMA.
Invalidation point: breaks 1.16 with momentum moving against the bias. The technical layers are being selected according to the regime:
712

·
--
$BMT is making an interesting move.
It jumped 2.31% in 15 minutes, with volume reaching 2.37x and volatility Z hitting 3.14. The closing price broke above the highs of the last 20 five-minute candles. The aggressive trade delta was +4.7%, and the buy/sell ratio was 1.10—the buyers are genuinely absorbing supply.
The key is the structure: OI is rising alongside the price. Contract notional is up 1.60% over 15 minutes and 4.29% over 1 hour, which looks more like new leveraged longs entering than shorts getting squeezed. The OI anomaly percentile is 88.9%, ranking #12 across the pool, and it has persisted for several consecutive periods. Depth confirmation is also in: volume is above normal, price has touched the range boundary, and the OI anomaly is still holding.
However, 24-hour trading volume is only a little over 20M, so the pool isn't very deep. If volume doesn't follow through, this kind of breakout can retrace quickly. I'm watching to see whether the five-minute highs can flip into support. I'll only follow once price holds there; otherwise, it could just be a quick wick.
·
--
$IRYS This rally looks interesting. The price rose just 0.84% over 15m, but OI jumped +3.34% over 15m, with a notional change of 285K USDT; 1h OI is also up +2.61%. Price and open interest moving up together points to new leveraged longs entering—not a false move caused by shorts closing.
The taker flow imbalance is 19.5%, the buy/sell ratio is 1.48, and volume is 1.83x, showing a clear directional bias. The OI anomaly percentile is 91.9%, ranking #4 across the entire pool, while the notional change ranks #12. That puts it near the top of the market-wide anomaly rankings.
24h trading volume is 89.94M, so the pool has decent depth, and the depth data confirms that trading activity is above normal. Leveraged longs piled in at 13:19. From here, it could either accelerate—or turn into a trap for longs. Just keep an eye on OI to make sure it doesn't keep building in one direction.

·
--
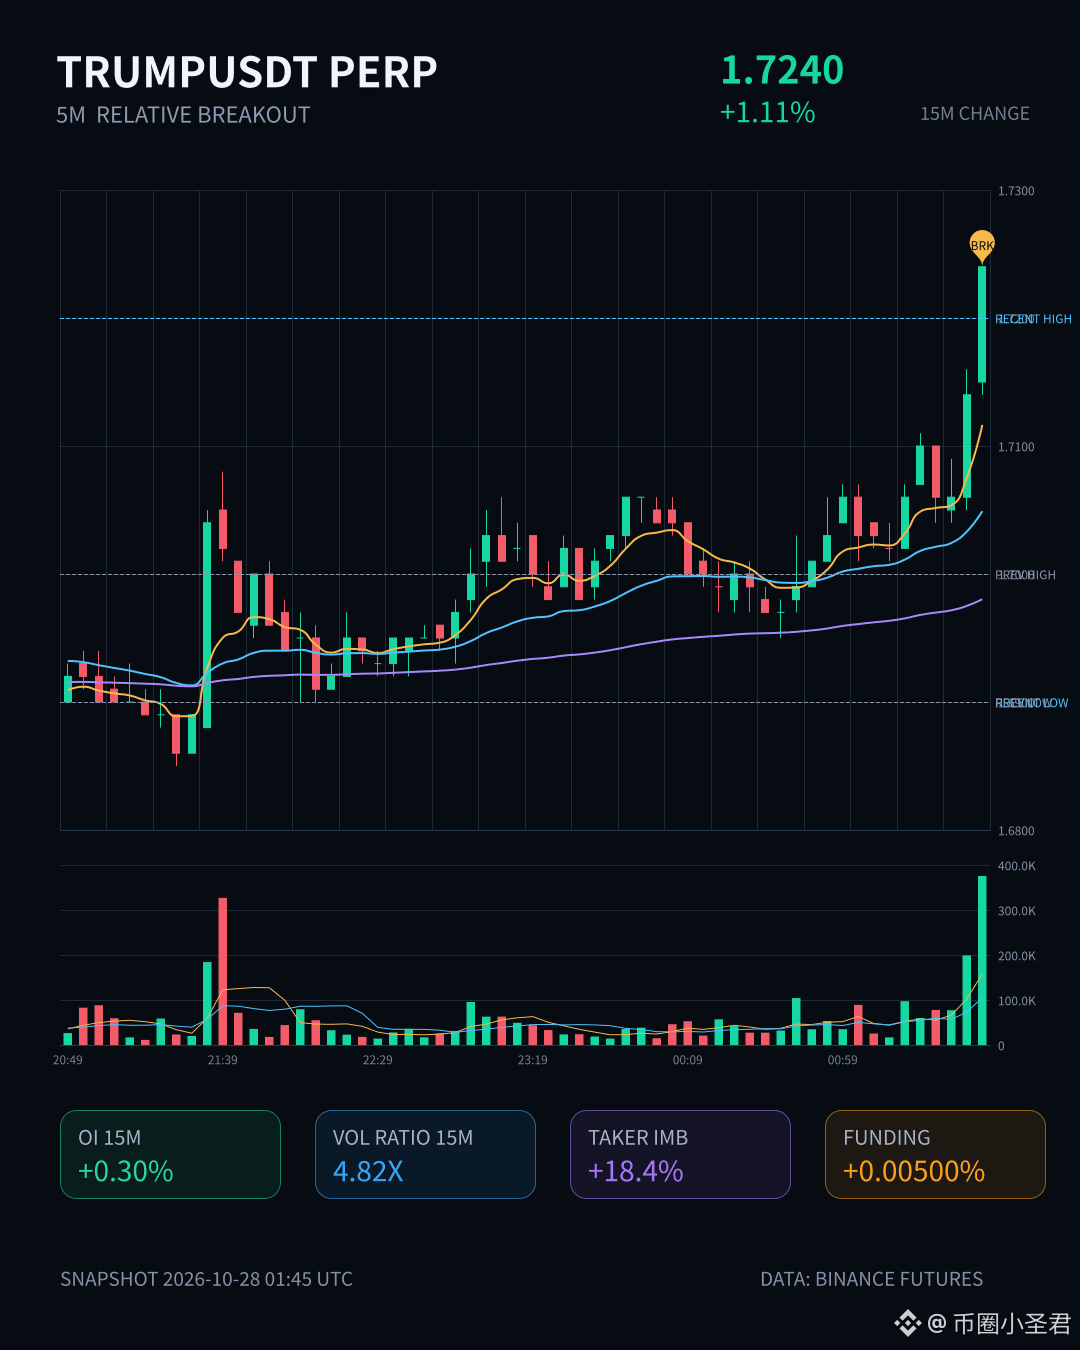
$TRUMP 15 rose 1.11% in 15 minutes, with volume surging to 4.82x and the aggressive buy/sell ratio at 1.45. Price has just moved above the highs of the last 20 five-minute candles.
The key is that OI is rising in tandem: +0.30% over 15m and +0.51% over 1h. Notional change is also near the top of the rankings—this looks less like simple short covering and more like new leveraged longs entering. Its anomaly percentile is 89.3%, ranking #12 across the entire pool, so the depth confirmation is there.
24-hour trading volume is just over 35M. At this scale, a notional change of 600K+ ranking in the top 21 across the pool suggests capital is indeed leaning this way. Whether this is a genuine breakout or just a quick spike depends on whether volume continues.
30

·
--
【Alpha New Listings Monitoring Report】2026-10-27 18:00
■ Sample: Alpha Top 30 (BSC 30 + Solana 30)
■ Newly listed this period: 16 (BSC 16 / SOL 0)
■ Filters: Top 3 by liquidity; excludes tokens listed within the past 24 hours
━━━━━━━━━━━━━━━
▸ $COLLECT [BSC]
Liquidity 2.359M
Alpha ranking #12 (New)
1h inflow list No
Smart money signal None
Overall score 1/6 · Low attention
▸ $AIOT [BSC]
Liquidity 2.068M
Alpha ranking #13 (New)
1h inflow list No
Smart money signal None
Overall score 1/6 · Low attention
▸ $CAP [BSC]
Liquidity 1.355M
Alpha ranking #7 (New)
1h inflow list No
Smart money signal None
Overall score 2/6 · Low attention
━━━━━━━━━━━━━━━
This report is automatically generated and does not constitute investment advice.
#$COLLECT #$AIOT #$CAP
1.1k
·
--
$US got slammed 3% in 15m, with volume rising to 2.71x. But 1h OI is still up 1.32%, while notional value fell 5%. Price down, open interest up, and aggressive selling is heavily skewed—the buy/sell ratio is 0.46. This looks more like new shorts entering with leverage than old longs closing out. The close has already broken below the lows of the last 20 5m candles, and volume confirms the move. The anomaly percentile is 91%, ranking #12 across the entire pool. Don’t rush to catch this dip in the short term; wait until short leverage is fully built up first.
$US got slammed 3% in 15m, with volume rising to 2.71x. But 1h OI is still up 1.32%, while notional value fell 5%. Price down, open interest up, and aggressive selling is heavily skewed—the buy/sell ratio is 0.46. This looks more like new shorts entering with leverage than old longs closing out. The close has already broken below the lows of the last 20 5m candles, and volume confirms the move. The anomaly percentile is 91%, ranking #12 across the entire pool. Don’t rush to catch this dip in the short term; wait until short leverage is fully built up first.
·
--
$ORDER Things are getting lively here. The 15m price is up 1.74%, while volume has surged to 11 times its usual level. OI is climbing in tandem—up 2.61% over 15m and 1.25% over 1h. The nominal change ranks #12 across the entire pool, at an anomaly percentile of 97.6%.
Price up + OI up: a classic sign of leveraged longs opening positions, not a move driven by shorts closing. The taker buy/sell ratio is 1.22, with the difference nearing 10%—buyers are definitely absorbing the offers.
It’s nearing historically extreme territory, and the move has persisted for several consecutive periods, with volume keeping pace. This setup could either accelerate or pull back. Don’t chase; keep a close eye on whether OI suddenly reverses.
2

·
--
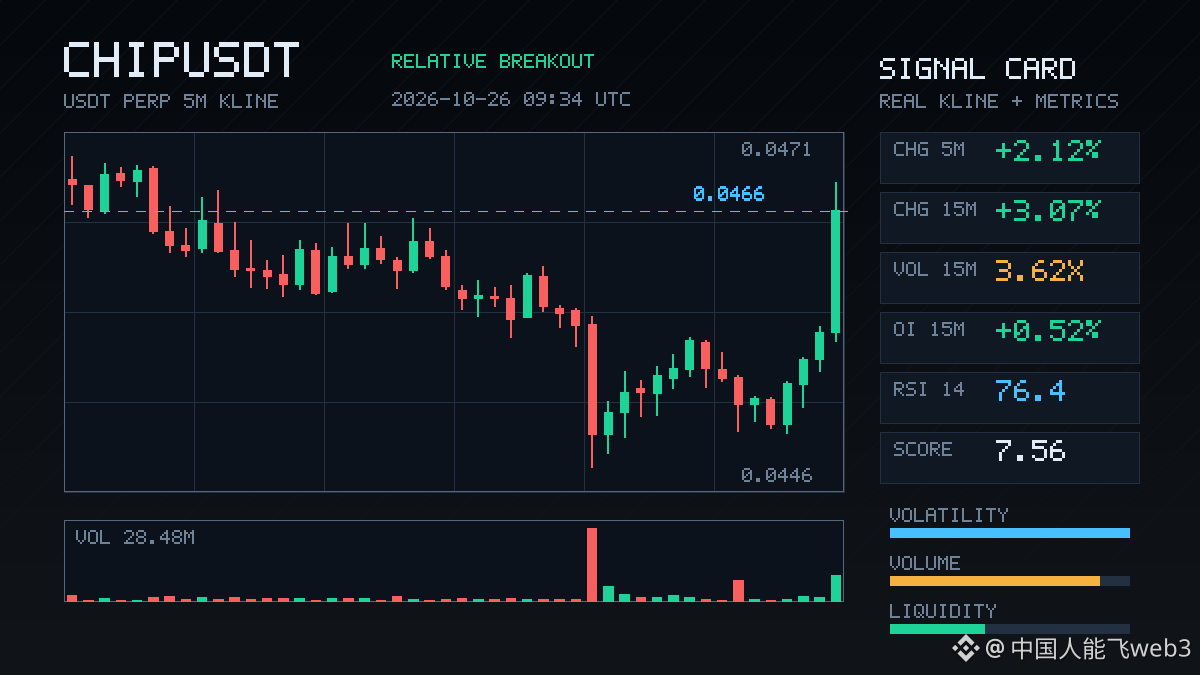
$CHIP made a clean move up: +3% in 15m, with volume at 3.6 times normal and the buy/sell ratio reaching 2.87. Aggressive buyers accounted for nearly half of the flow. OI was up 0.5% over half an hour and 0.68% over an hour, with price and open interest rising in tandem—a classic leveraged long entry, not the kind of artificial rise caused by short covering. Its anomaly percentile is 97.2%, ranking #12 across the entire pool and already brushing up against historical extremes. Funding rates have also climbed to recent highs. With just over 15 million in 24h trading volume, the market isn’t particularly deep. In this setup, be cautious about chasing the price: missing out stings, but buying in at the top could hurt even more.
$CHIP made a clean move up: +3% in 15m, with volume at 3.6 times normal and the buy/sell ratio reaching 2.87. Aggressive buyers accounted for nearly half of the flow. OI was up 0.5% over half an hour and 0.68% over an hour, with price and open interest rising in tandem—a classic leveraged long entry, not the kind of artificial rise caused by short covering. Its anomaly percentile is 97.2%, ranking #12 across the entire pool and already brushing up against historical extremes. Funding rates have also climbed to recent highs. With just over 15 million in 24h trading volume, the market isn’t particularly deep. In this setup, be cautious about chasing the price: missing out stings, but buying in at the top could hurt even more.
3
·
--
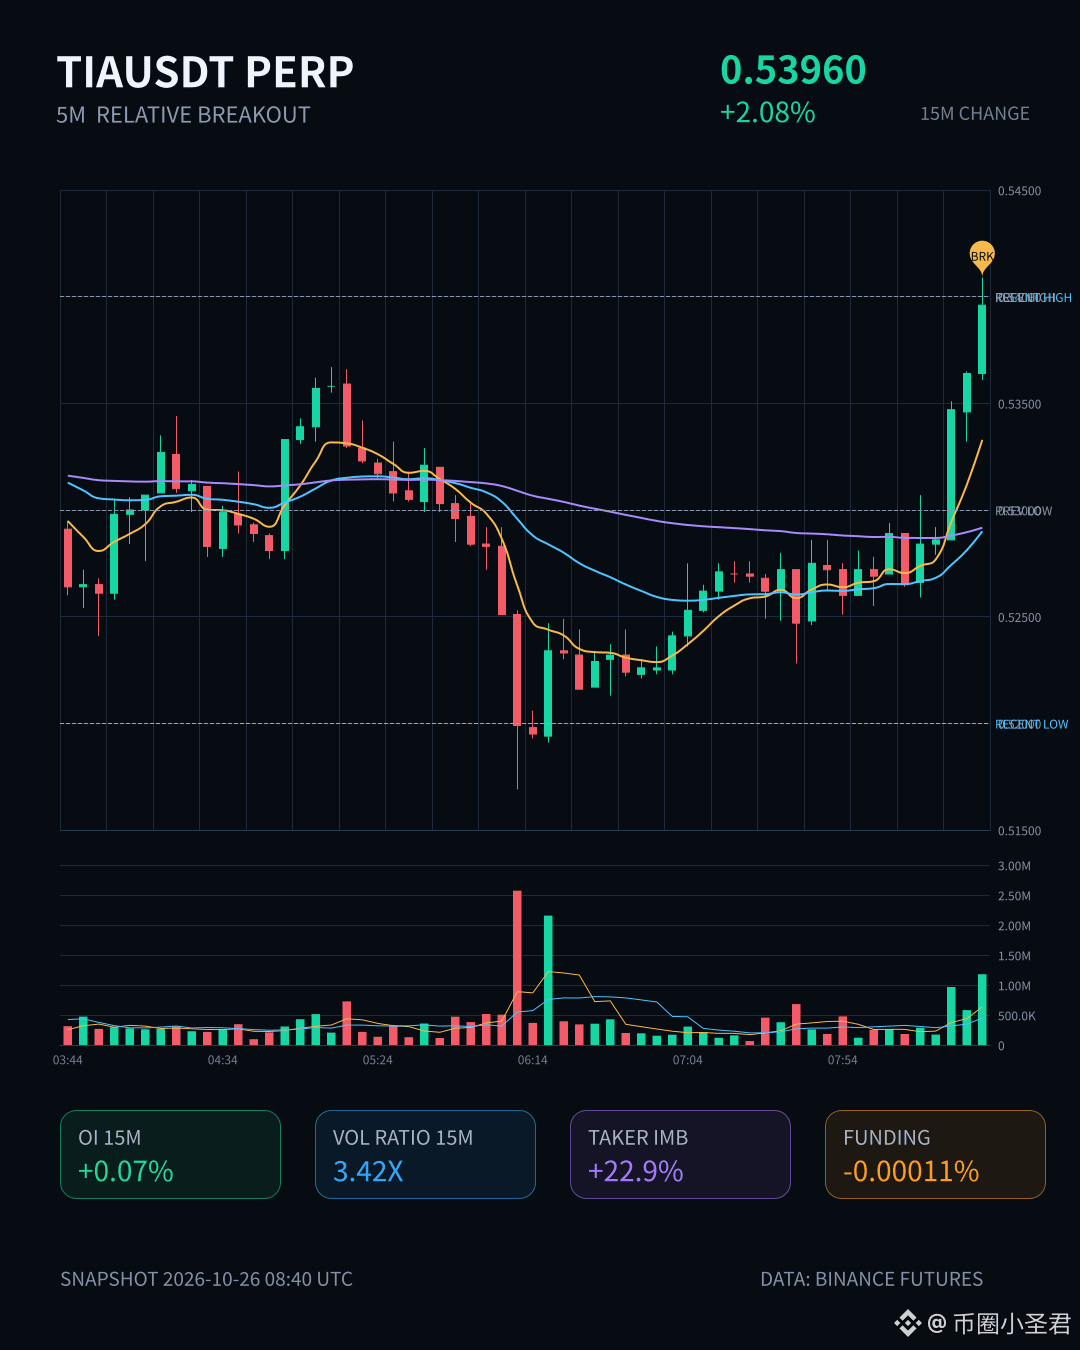
$TIA This rally looks pretty well-supported. 15m volume expanded to 3.4 times its usual level, with noticeably stronger aggressive buying; the buy/sell ratio is 1.59, and the price broke above the highs of the last 20 or so 5m candles.
The key is that OI is rising in tandem—net increases on both the 15m and 1h timeframes, with the combined notional increase approaching 1 million USDT. Its anomaly percentile has already hit 98.2%, ranking #12 across the entire pool. This isn’t just a spot-driven spike; it looks more like new leveraged longs are moving in.
Price is up, open interest is up, and volume confirms the move. Structurally, that’s much healthier than a low-volume wick. Still, with OI at such an extreme level, weigh the risk-reward before chasing higher, and don’t get carried away when sentiment is at its hottest.
3
Log in to explore more content
Join global crypto users on Binance Square
⚡️ Get latest and useful information about crypto.
💬 Trusted by the world’s largest crypto exchange.
👍 Discover real insights from verified creators.
Email / Phone number
Trending Topics
1
#BinanceSAFUFundTransferCompleted7499BTC
1,064 views
98 Discussing
2
#BinanceRecovery90% of stolen assets
27,675 views
88 Discussing
3
#YiHe:ProofOfReserves:10TokensAt100%Backing
68,319 views
316 Discussing
4
#BackedNotBroken:RichardTengSaysUsersBearNoLoss
4,111 views
173 Discussing
5
#CZSaysCompensationIsinPlaceUsersAreProtected
74,180 views
1,007 Discussing
6
#IntelHasItsWorstDaySince1974
20,039 views
451 Discussing
7
#TRMCambodianCasinosReceived$1.07BInCrypto
4,884 views
57 Discussing
8
#USDCCirculationFallsAbout800MInSevenDays
41,874 views
594 Discussing
9
#SuspectedNorthKoreaAttacksAccountForNearly89%OfCryptoHackLosses
11,003 views
81 Discussing
10
#OpenAICutsFundraisingTargetBy$10B
2,545 views
65 Discussing