
#halving
halving
5.5M views
2,321 Discussing
Hot
Latest

Picture this: an investor sitting on the sidelines during the 2016 and 2020 cycles, constantly waiting for the perfect bottom only to end up buying the exact top out of pure frustration. Most market participants get crushed not because they pick the wrong assets, but because they have zero concept of cyclical timing and panic when volatility hits.
Historical cycle data reveals an interesting pattern called the 500-day framework. In previous market regimes, accumulating $BTC roughly 500 days prior to the halving and exiting 500 days after delivered consistent cycle outperformance compared to chasing altcoins like $ETH or $SOL during late-stage euphoria. The logic is grounded in supply shock dynamics rather than short-term price noise.
With the next halving projected around 585 days away, that leaves a narrow window of roughly 85 days before entering that optimal historical accumulation zone. Comparing this setup to previous pre-halving consolidation phases shows that patience during these quiet chop periods usually separates long-term winners from exit liquidity.
Are you sticking to a strict cycle-based time horizon, or are you trying to pinpoint the exact local bottom?
#Bitcoin #CryptoTrading #Halving
Historical cycle data reveals an interesting pattern called the 500-day framework. In previous market regimes, accumulating $BTC roughly 500 days prior to the halving and exiting 500 days after delivered consistent cycle outperformance compared to chasing altcoins like $ETH or $SOL during late-stage euphoria. The logic is grounded in supply shock dynamics rather than short-term price noise.
With the next halving projected around 585 days away, that leaves a narrow window of roughly 85 days before entering that optimal historical accumulation zone. Comparing this setup to previous pre-halving consolidation phases shows that patience during these quiet chop periods usually separates long-term winners from exit liquidity.
Are you sticking to a strict cycle-based time horizon, or are you trying to pinpoint the exact local bottom?
#Bitcoin #CryptoTrading #Halving


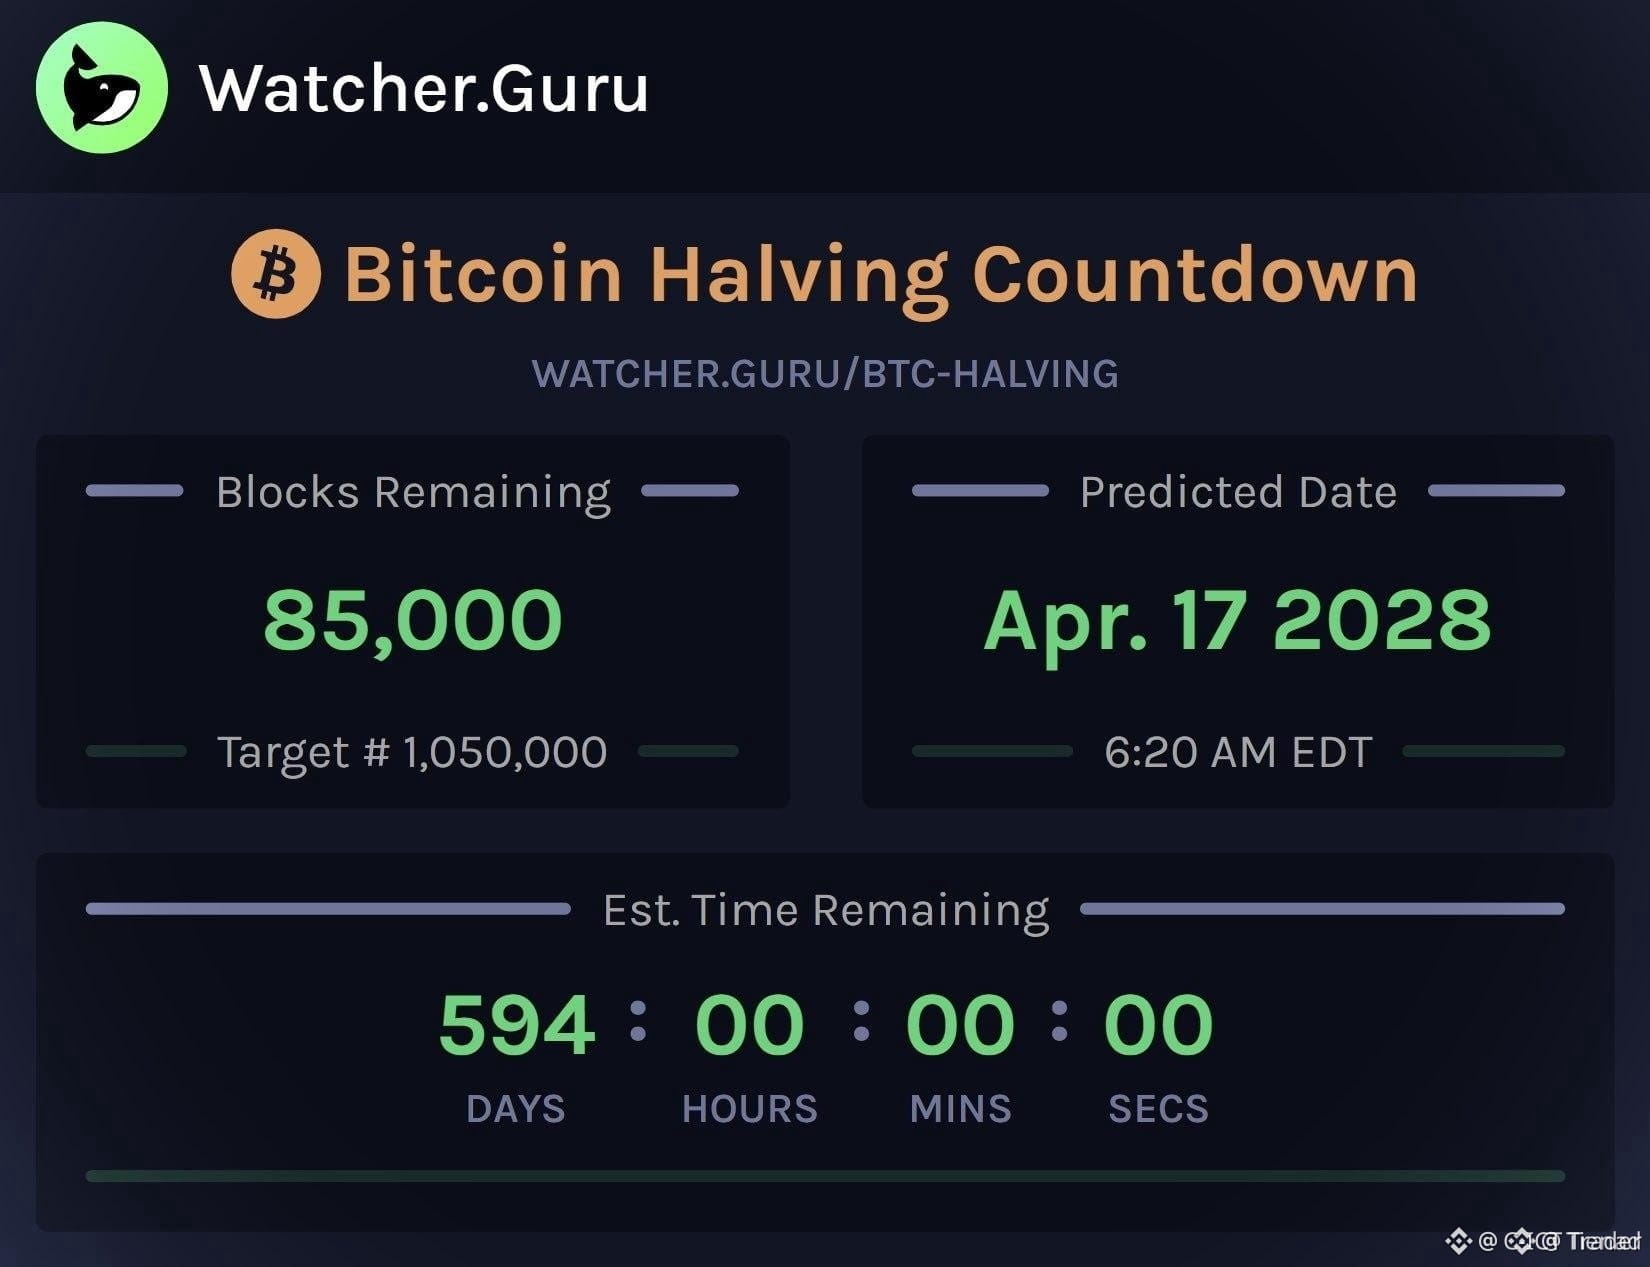
$BTC HALVING COUNTDOWN HITS 85,000 BLOCKS AS SUPPLY SQUEEZE TIGHTENS! ⚡ 📊
The supply clock is ticking fast. With $BTC sitting just 85,000 blocks out from its next structural reduction, the daily issuance curve is preparing for an aggressive shift. 📊 Smart capital is already calculating miner margin thresholds while block production holds firm at 10-minute averages.
While network hash rate fluctuations will generate inevitable short-term turbulence, the raw mathematical tightening of incoming supply remains relentless. 🦈 Order flow positioning indicates quiet absorption as institutional desks prepare for the inventory squeeze.
This setup is establishing a classic battleground between miner adjustments and long-term liquidity accumulation. 💬 Are you positioning ahead of the block reduction or awaiting a pre-halving sweep? 👇
⚠️ Not financial advice. Always manage your risk. 🛡️
🏷️ #BTC #Bitcoin #Halving #Crypto
⚡ 💎
The supply clock is ticking fast. With $BTC sitting just 85,000 blocks out from its next structural reduction, the daily issuance curve is preparing for an aggressive shift. 📊 Smart capital is already calculating miner margin thresholds while block production holds firm at 10-minute averages.
While network hash rate fluctuations will generate inevitable short-term turbulence, the raw mathematical tightening of incoming supply remains relentless. 🦈 Order flow positioning indicates quiet absorption as institutional desks prepare for the inventory squeeze.
This setup is establishing a classic battleground between miner adjustments and long-term liquidity accumulation. 💬 Are you positioning ahead of the block reduction or awaiting a pre-halving sweep? 👇
⚠️ Not financial advice. Always manage your risk. 🛡️
🏷️ #BTC #Bitcoin #Halving #Crypto
⚡ 💎
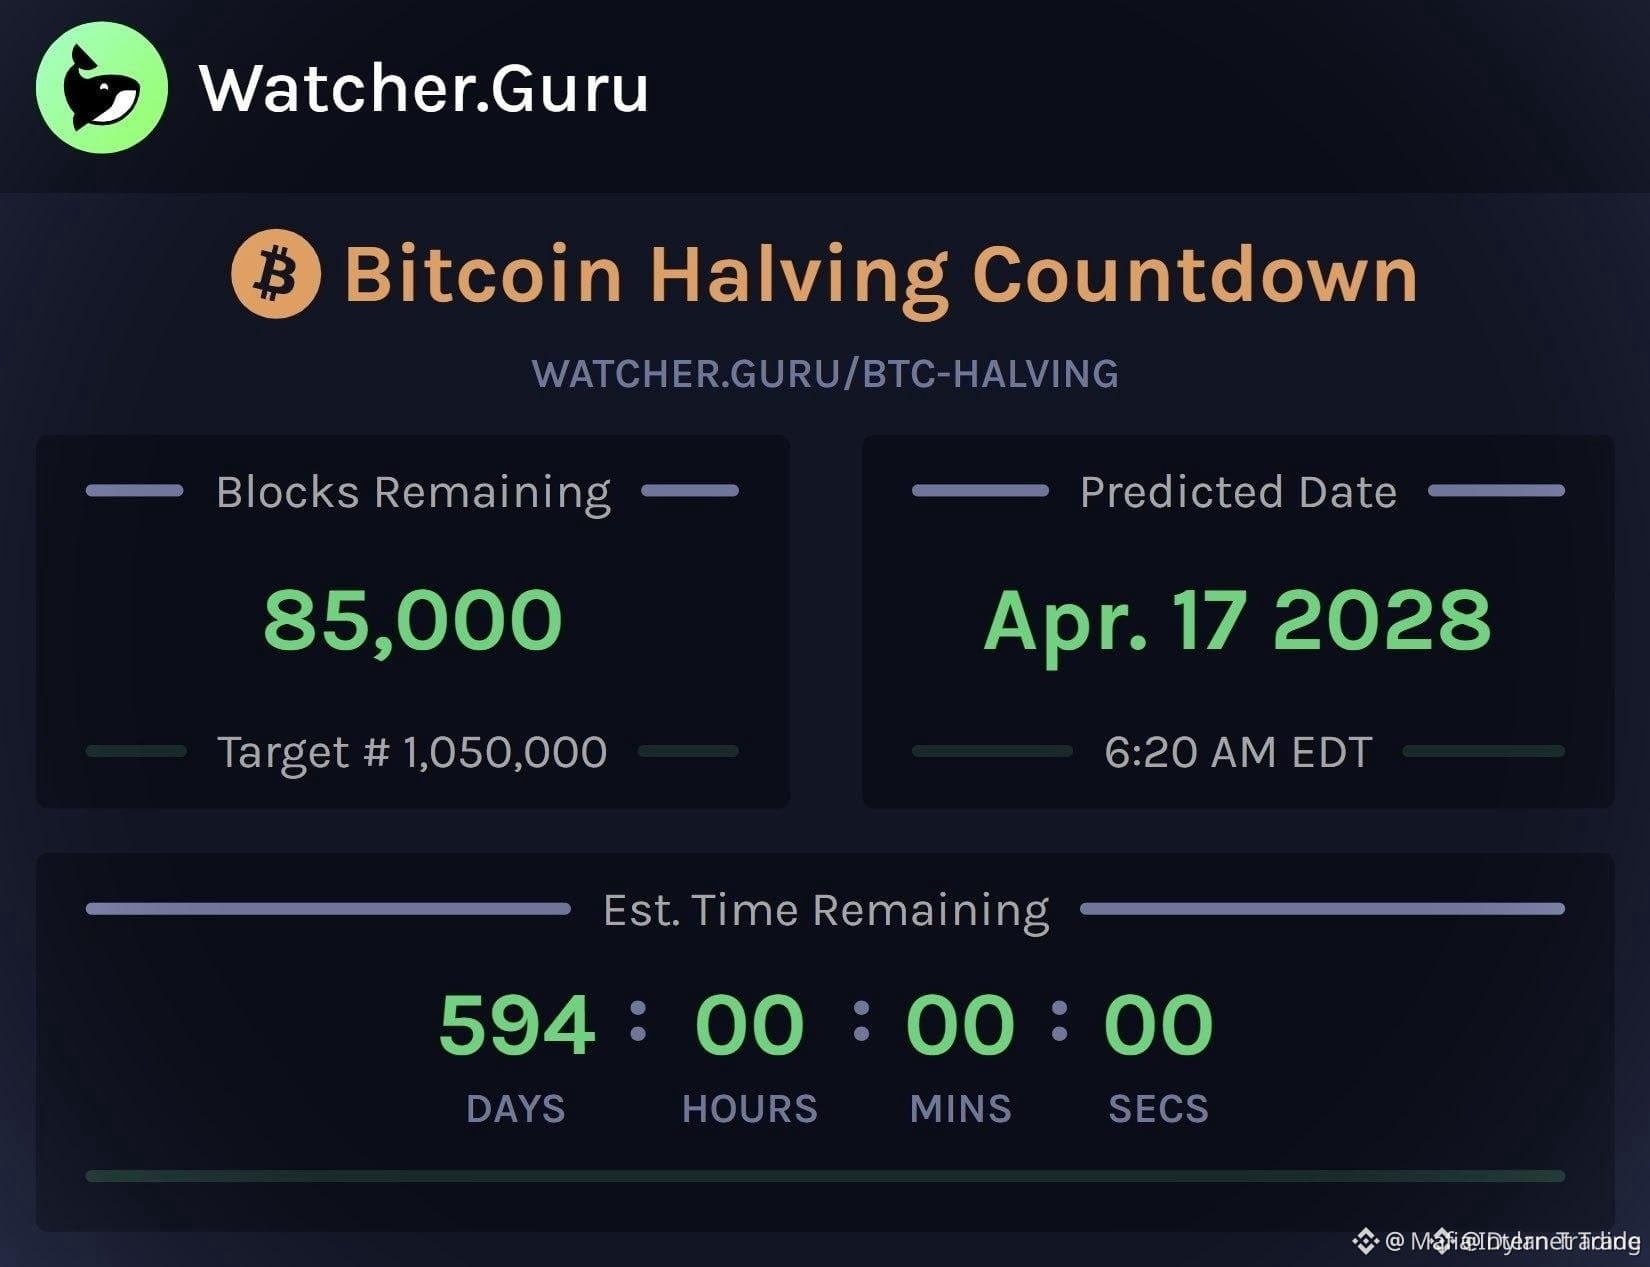

🚨 85,000 BLOCKS UNTIL THE NEXT $BTC HALVING AS SUPPLY SQUEEZE APPROACHES! ⚡
With roughly 85,000 blocks remaining until the next $BTC block reward cut, institutional eyes are already mapping out the macro liquidity cycle. 📊 As block issuance slows down over the next 1.5 years, order flow dynamics typically transition from miner distribution to structural accumulation ahead of tightening supply.
While retail debates whether anticipation leads to pre-halving distribution or immediate expansion, smart money focuses on high-timeframe order blocks and demand defense. 🔍 The countdown represents a structural regime shift where market depth and systemic scarcity dictate long-term direction.
🤔 Do you expect institutional positioning to front-run the supply cut, or will macro headwinds trigger one final liquidity sweep before the expansion begins? 👇
⚠️ Not financial advice. Always manage your risk. 🛡️
🏷️ #BTC #Bitcoin #Halving #MarketStructure
🎯 🦈
With roughly 85,000 blocks remaining until the next $BTC block reward cut, institutional eyes are already mapping out the macro liquidity cycle. 📊 As block issuance slows down over the next 1.5 years, order flow dynamics typically transition from miner distribution to structural accumulation ahead of tightening supply.
While retail debates whether anticipation leads to pre-halving distribution or immediate expansion, smart money focuses on high-timeframe order blocks and demand defense. 🔍 The countdown represents a structural regime shift where market depth and systemic scarcity dictate long-term direction.
🤔 Do you expect institutional positioning to front-run the supply cut, or will macro headwinds trigger one final liquidity sweep before the expansion begins? 👇
⚠️ Not financial advice. Always manage your risk. 🛡️
🏷️ #BTC #Bitcoin #Halving #MarketStructure
🎯 🦈

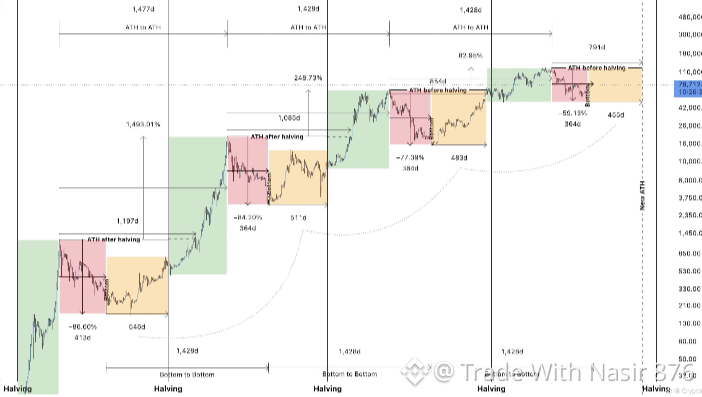
🚀 Bitcoin Market Cycles & Halving Analysis: Is History Repeating Itself? 📊
Looking closely at Bitcoin's historical chart, the market follows a strikingly consistent 4-year pattern. Here is what the data from previous Halving cycles reveals:
1️⃣ ATH to ATH Cycle (~1,400+ Days)
Every new All-Time High (ATH) peak takes approximately 1,428 to 1,477 days (~4 years) to form from the previous top.
2️⃣ Bear Market Bottoms (364 to 413 Days)
After hitting a peak, the market enters a correction phase (Red Zone):
2013–2015: -86.00% drop over 413 days
2017–2018: -84.20% drop over 364 days
2021–2022: -77.38% drop over 364 days
Historically, market bottoms tend to form around 364 days into the bear trend.
3️⃣ Accumulation & Recovery Phase (400–600+ Days)
Following the bottom, BTC enters an accumulation phase (Orange Zone) where price consolidates and builds momentum for the next macro expansion.
4️⃣ Halving & Parabolic Expansion
Vertically marked Halving events consistently mark the transition into the main structural expansion (Green Zone), leading to new historic highs.
💡 Key Takeaway:
Short-term volatility can be noisy, but macro cycles highlight strong structural consistency across 4-year periods. If historic post-halving patterns hold true, the macro outlook remains structurally bullish. 📈🔥
⚠️ Disclaimer: For educational purposes only. Not financial advice. Always Do Your Own Research (DYOR).
#CryptoAnalysis #TechnicalAnalysis #Halving #CryptoMarket #cryptotrading
$BTC
Looking closely at Bitcoin's historical chart, the market follows a strikingly consistent 4-year pattern. Here is what the data from previous Halving cycles reveals:
1️⃣ ATH to ATH Cycle (~1,400+ Days)
Every new All-Time High (ATH) peak takes approximately 1,428 to 1,477 days (~4 years) to form from the previous top.
2️⃣ Bear Market Bottoms (364 to 413 Days)
After hitting a peak, the market enters a correction phase (Red Zone):
2013–2015: -86.00% drop over 413 days
2017–2018: -84.20% drop over 364 days
2021–2022: -77.38% drop over 364 days
Historically, market bottoms tend to form around 364 days into the bear trend.
3️⃣ Accumulation & Recovery Phase (400–600+ Days)
Following the bottom, BTC enters an accumulation phase (Orange Zone) where price consolidates and builds momentum for the next macro expansion.
4️⃣ Halving & Parabolic Expansion
Vertically marked Halving events consistently mark the transition into the main structural expansion (Green Zone), leading to new historic highs.
💡 Key Takeaway:
Short-term volatility can be noisy, but macro cycles highlight strong structural consistency across 4-year periods. If historic post-halving patterns hold true, the macro outlook remains structurally bullish. 📈🔥
⚠️ Disclaimer: For educational purposes only. Not financial advice. Always Do Your Own Research (DYOR).
#CryptoAnalysis #TechnicalAnalysis #Halving #CryptoMarket #cryptotrading
$BTC


Every few years, Bitcoin's supply issuance changes—and the entire crypto market starts paying attention.
But here's the interesting part: the halving doesn't guarantee that prices will rise.
What it does change is the rate at which new supply enters the market. Then supply, demand, liquidity, and expectations do the rest.
Markets like $LTC have similar supply mechanisms worth understanding too.
#Halving #Litecoin
But here's the interesting part: the halving doesn't guarantee that prices will rise.
What it does change is the rate at which new supply enters the market. Then supply, demand, liquidity, and expectations do the rest.
Markets like $LTC have similar supply mechanisms worth understanding too.
#Halving #Litecoin

Is the crypto market chaotic or predictable? 📊👇
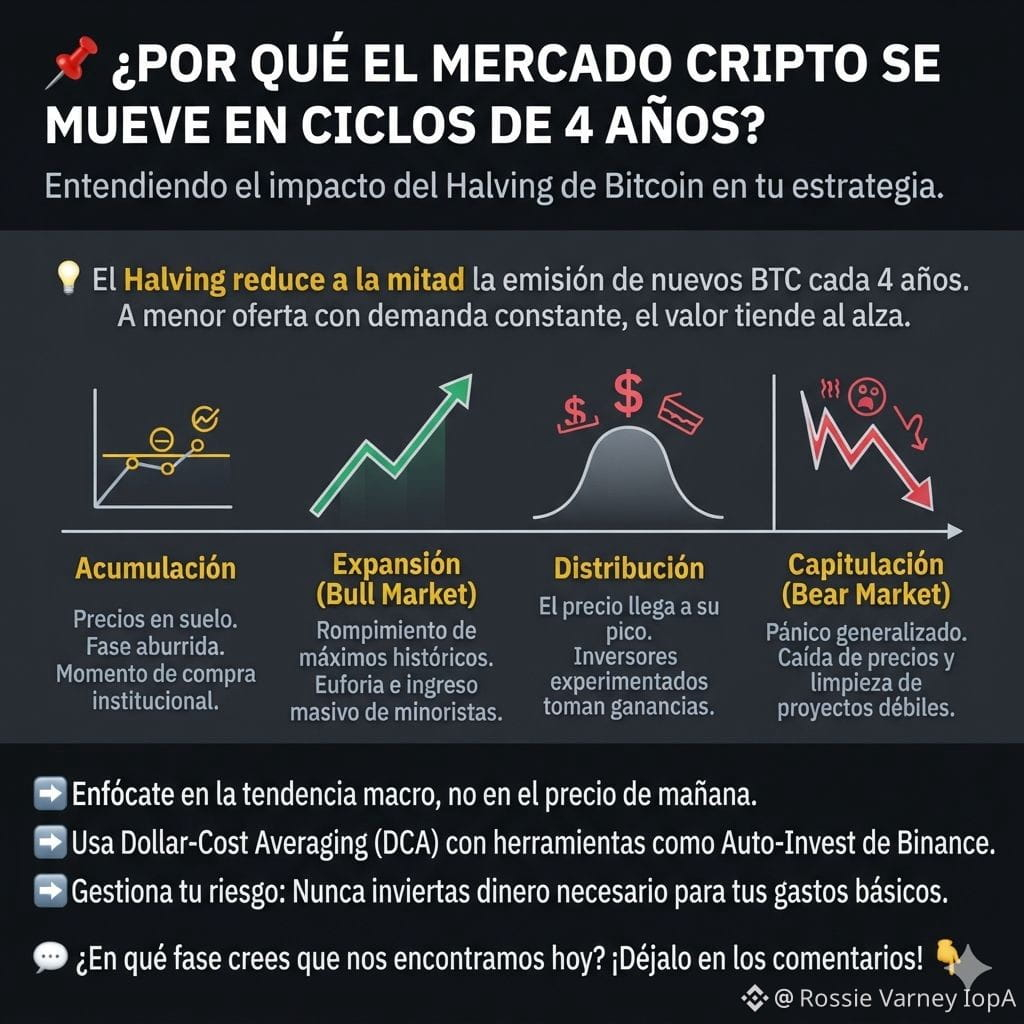
Many beginners enter cryptocurrencies thinking that prices go up and down without any sense. The reality is different: the market moves in macro 4-year cycles, guided by an impeccable mathematical event: Bitcoin’s Halving.
If you understand which phase we’re in, you stop trading out of emotion and start trading with strategy. 🧠
Here I summarize the 4 phases you must master (see the details on the flyer 🖼️):
1️⃣ Accumulation: Low prices. The market consolidates in silence.
2️⃣ Expansion: Breaks above previous highs, euphoria, and mass adoption.
3️⃣ Distribution: The price reaches its peak. Strong hands take profits.
4️⃣ Capitulation: Panic, severe correction, and a market cleanup.
💡 The Golden Advice: Don’t try to guess tomorrow’s price. Automate your purchases with Binance Auto-Invest using the DCA (Dollar-Cost Averaging) strategy and reduce the impact of volatility. 📈
💬 I’m opening the debate in the community! What phase of the cycle do you think we’re exactly in today? I’ll read your comments. 👇
* Disclaimer: This is not financial advice; it’s just an opinion 👍. Always do your own research (DYOR)*
#bitcoin #Halving #CryptoInvesting #CryptoEducation #learnAndEarn
Many beginners enter cryptocurrencies thinking that prices go up and down without any sense. The reality is different: the market moves in macro 4-year cycles, guided by an impeccable mathematical event: Bitcoin’s Halving.
If you understand which phase we’re in, you stop trading out of emotion and start trading with strategy. 🧠
Here I summarize the 4 phases you must master (see the details on the flyer 🖼️):
1️⃣ Accumulation: Low prices. The market consolidates in silence.
2️⃣ Expansion: Breaks above previous highs, euphoria, and mass adoption.
3️⃣ Distribution: The price reaches its peak. Strong hands take profits.
4️⃣ Capitulation: Panic, severe correction, and a market cleanup.
💡 The Golden Advice: Don’t try to guess tomorrow’s price. Automate your purchases with Binance Auto-Invest using the DCA (Dollar-Cost Averaging) strategy and reduce the impact of volatility. 📈
💬 I’m opening the debate in the community! What phase of the cycle do you think we’re exactly in today? I’ll read your comments. 👇
* Disclaimer: This is not financial advice; it’s just an opinion 👍. Always do your own research (DYOR)*
#bitcoin #Halving #CryptoInvesting #CryptoEducation #learnAndEarn



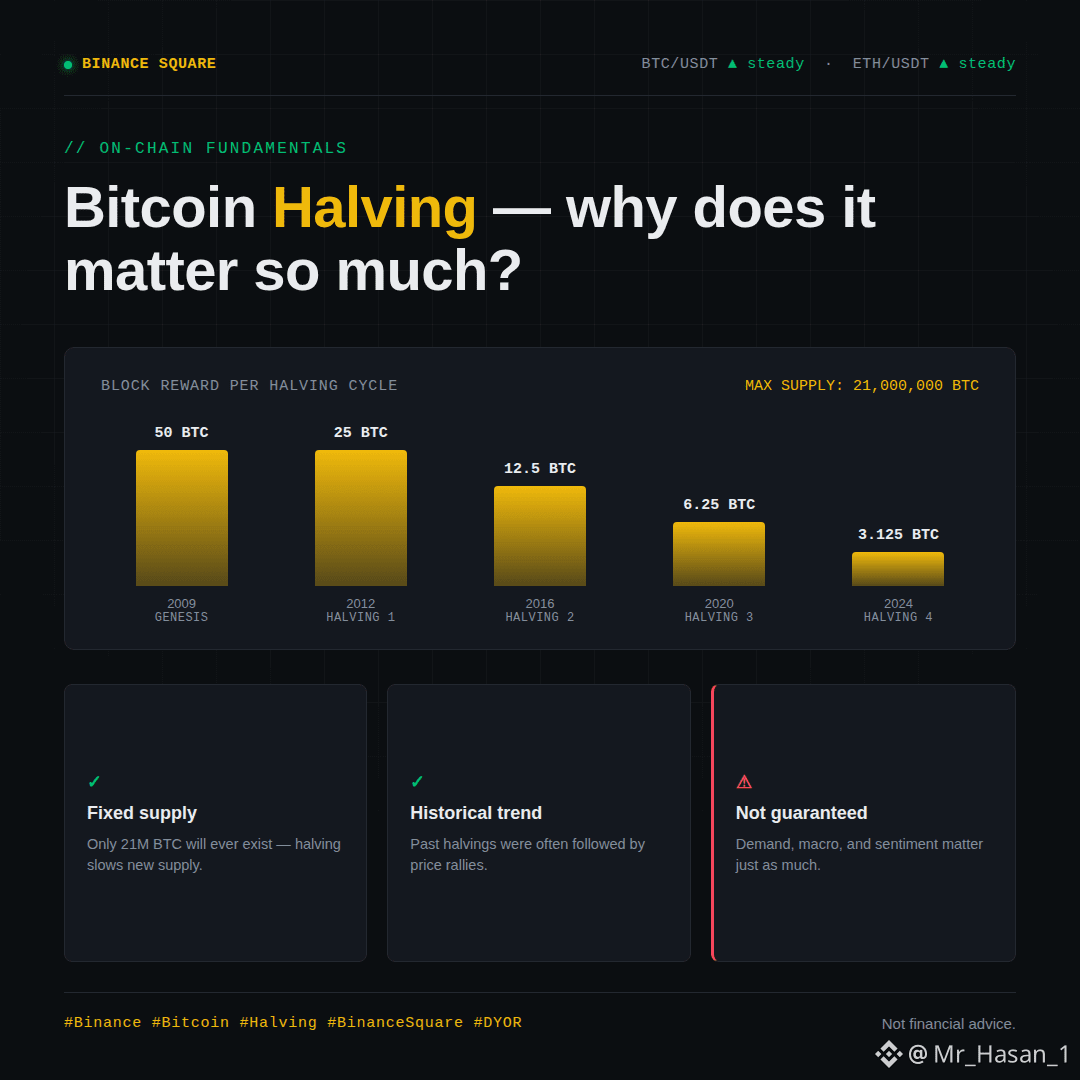
⏳ Bitcoin Halving: Why Does It Matter So Much?
Hearing the word "halving" a lot in crypto? Let's break down what it actually means and why it matters.
🔹 What is halving?
Roughly every 4 years (every 210,000 blocks), Bitcoin's mining reward gets cut in half. The amount of BTC miners earn for verifying new blocks drops.
🔹 Why does it happen?
✅ Bitcoin's max supply is fixed — only 21 million coins will ever exist
✅ Halving slows down the rate new coins are created, reducing supply growth
✅ This is what makes Bitcoin a "deflationary" asset — built-in scarcity, like gold
🔹 What's the market impact?
📊 Historically, prices have tended to rise after halvings due to reduced supply
📊 But it's not guaranteed — demand, macro conditions, and market sentiment matter just as much
📊 Much of the impact may already be "priced in" by the market beforehand
⚠️ Remember: Past performance doesn't guarantee future results. Don't invest on hype alone — always do your own research.
Are you bullish or skeptical on Bitcoin halving? Let us know in the comments 👇
#Binance #Bitcoin #Halving #BinanceSquare #DYOR
Hearing the word "halving" a lot in crypto? Let's break down what it actually means and why it matters.
🔹 What is halving?
Roughly every 4 years (every 210,000 blocks), Bitcoin's mining reward gets cut in half. The amount of BTC miners earn for verifying new blocks drops.
🔹 Why does it happen?
✅ Bitcoin's max supply is fixed — only 21 million coins will ever exist
✅ Halving slows down the rate new coins are created, reducing supply growth
✅ This is what makes Bitcoin a "deflationary" asset — built-in scarcity, like gold
🔹 What's the market impact?
📊 Historically, prices have tended to rise after halvings due to reduced supply
📊 But it's not guaranteed — demand, macro conditions, and market sentiment matter just as much
📊 Much of the impact may already be "priced in" by the market beforehand
⚠️ Remember: Past performance doesn't guarantee future results. Don't invest on hype alone — always do your own research.
Are you bullish or skeptical on Bitcoin halving? Let us know in the comments 👇
#Binance #Bitcoin #Halving #BinanceSquare #DYOR

The Post-Halving Price Discovery Window Is Open — And Most Investors Miss It
Every Bitcoin halving cuts the daily issuance in half. The market knows this. What the market consistently underestimates is the timing: the supply shock takes 12–18 months to fully translate into price action as exchange inventories thin out and miners adjust to lower revenue.
The pattern is clear across cycles: early post-halving months are often sideways or muted, frustrating investors who expect an immediate pump. Then, quietly, the cumulative effect of 50% less daily sell pressure compounds. Miners sell less. Long-term holders absorb available float. Liquidity thins.
By the time retail notices, the move is already underway.
This cycle is no different in structure — but it is different in scale. Institutional ETF demand has added a second demand layer on top of the halving supply compression. Spot ETFs absorb daily BTC at a rate that dwarfs new issuance. When miner sell pressure drops simultaneously, the supply-demand math becomes extreme.
$BTC is the clearest expression of this dynamic. $ETH benefits indirectly through risk-on rotation. $SOL tends to see amplified moves once BTC price discovery is well established.
Where are we in the window? Historically, months 9–18 post-halving are when the sharpest moves occur. The clock is running.
Patience is a position.
#Bitcoin #Halving #CryptoMarkets #BullCycle #Blockchain
Every Bitcoin halving cuts the daily issuance in half. The market knows this. What the market consistently underestimates is the timing: the supply shock takes 12–18 months to fully translate into price action as exchange inventories thin out and miners adjust to lower revenue.
The pattern is clear across cycles: early post-halving months are often sideways or muted, frustrating investors who expect an immediate pump. Then, quietly, the cumulative effect of 50% less daily sell pressure compounds. Miners sell less. Long-term holders absorb available float. Liquidity thins.
By the time retail notices, the move is already underway.
This cycle is no different in structure — but it is different in scale. Institutional ETF demand has added a second demand layer on top of the halving supply compression. Spot ETFs absorb daily BTC at a rate that dwarfs new issuance. When miner sell pressure drops simultaneously, the supply-demand math becomes extreme.
$BTC is the clearest expression of this dynamic. $ETH benefits indirectly through risk-on rotation. $SOL tends to see amplified moves once BTC price discovery is well established.
Where are we in the window? Historically, months 9–18 post-halving are when the sharpest moves occur. The clock is running.
Patience is a position.
#Bitcoin #Halving #CryptoMarkets #BullCycle #Blockchain

FAITH IN CYCLES AND HALVING: WHY HISTORY WON'T REPEAT ITSELF LIKE YOU EXPECT 📊🛑
"Every 4 years Bitcoin pumps after halving, it's obvious!" — the main mantra of long-term retail investors. Our firm reminds you: once a pattern becomes obvious to 100% of market participants, it stops working.
Why old rules are breaking:
1. INSTITUTIONALS AND ETFs: The market is no longer controlled by miners and retail buyers from their basements. Big Wall Street funds have entered the game. They have their own rules for liquidity distribution and different time horizons.
2. SHIFTING CYCLES: Big capital knows your expectations. They can easily orchestrate a prolonged bear market right when you’re expecting a "to the moon" moment according to your calendar.
3. LIQUIDITY VS ILLUSIONS: Prices move towards where the most stops and inefficiencies are, not where the calendar says they should.
I’m waiting for the witnesses of the "eternal four-year cycle" in the comments. Bring your analysis, and let’s break it down with the latest volume data. 👇
$BTC #Halving #smartmoney #Binance #BinanceSquare
"Every 4 years Bitcoin pumps after halving, it's obvious!" — the main mantra of long-term retail investors. Our firm reminds you: once a pattern becomes obvious to 100% of market participants, it stops working.
Why old rules are breaking:
1. INSTITUTIONALS AND ETFs: The market is no longer controlled by miners and retail buyers from their basements. Big Wall Street funds have entered the game. They have their own rules for liquidity distribution and different time horizons.
2. SHIFTING CYCLES: Big capital knows your expectations. They can easily orchestrate a prolonged bear market right when you’re expecting a "to the moon" moment according to your calendar.
3. LIQUIDITY VS ILLUSIONS: Prices move towards where the most stops and inefficiencies are, not where the calendar says they should.
I’m waiting for the witnesses of the "eternal four-year cycle" in the comments. Bring your analysis, and let’s break it down with the latest volume data. 👇
$BTC #Halving #smartmoney #Binance #BinanceSquare

📊 Recent analysis highlights that the Bitcoin halving countdown is entering the final quarter, sparking discussion about a potential bottoming phase.
🧠 The halving reduces block rewards by 50%, historically influencing supply dynamics and miner economics.
🔍 On‑chain metrics show a gradual decline in hash rate growth and a modest rise in the difficulty adjustment rate since the last halving.
💡 Market participants note that the reduced issuance could tighten scarcity, while demand trends remain a key variable.
⚡ The upcoming halving event is scheduled for early 2024, making the next few months a focal point for network activity monitoring.
📈 As always, DYOR before forming any conclusions about $BTC ’s future trajectory.
🤔 How do you think the supply shift will interact with macro‑economic factors? #CryptoNews #Bitcoin #Halving #Blockchain #GAMERXERO
🧠 The halving reduces block rewards by 50%, historically influencing supply dynamics and miner economics.
🔍 On‑chain metrics show a gradual decline in hash rate growth and a modest rise in the difficulty adjustment rate since the last halving.
💡 Market participants note that the reduced issuance could tighten scarcity, while demand trends remain a key variable.
⚡ The upcoming halving event is scheduled for early 2024, making the next few months a focal point for network activity monitoring.
📈 As always, DYOR before forming any conclusions about $BTC ’s future trajectory.
🤔 How do you think the supply shift will interact with macro‑economic factors? #CryptoNews #Bitcoin #Halving #Blockchain #GAMERXERO

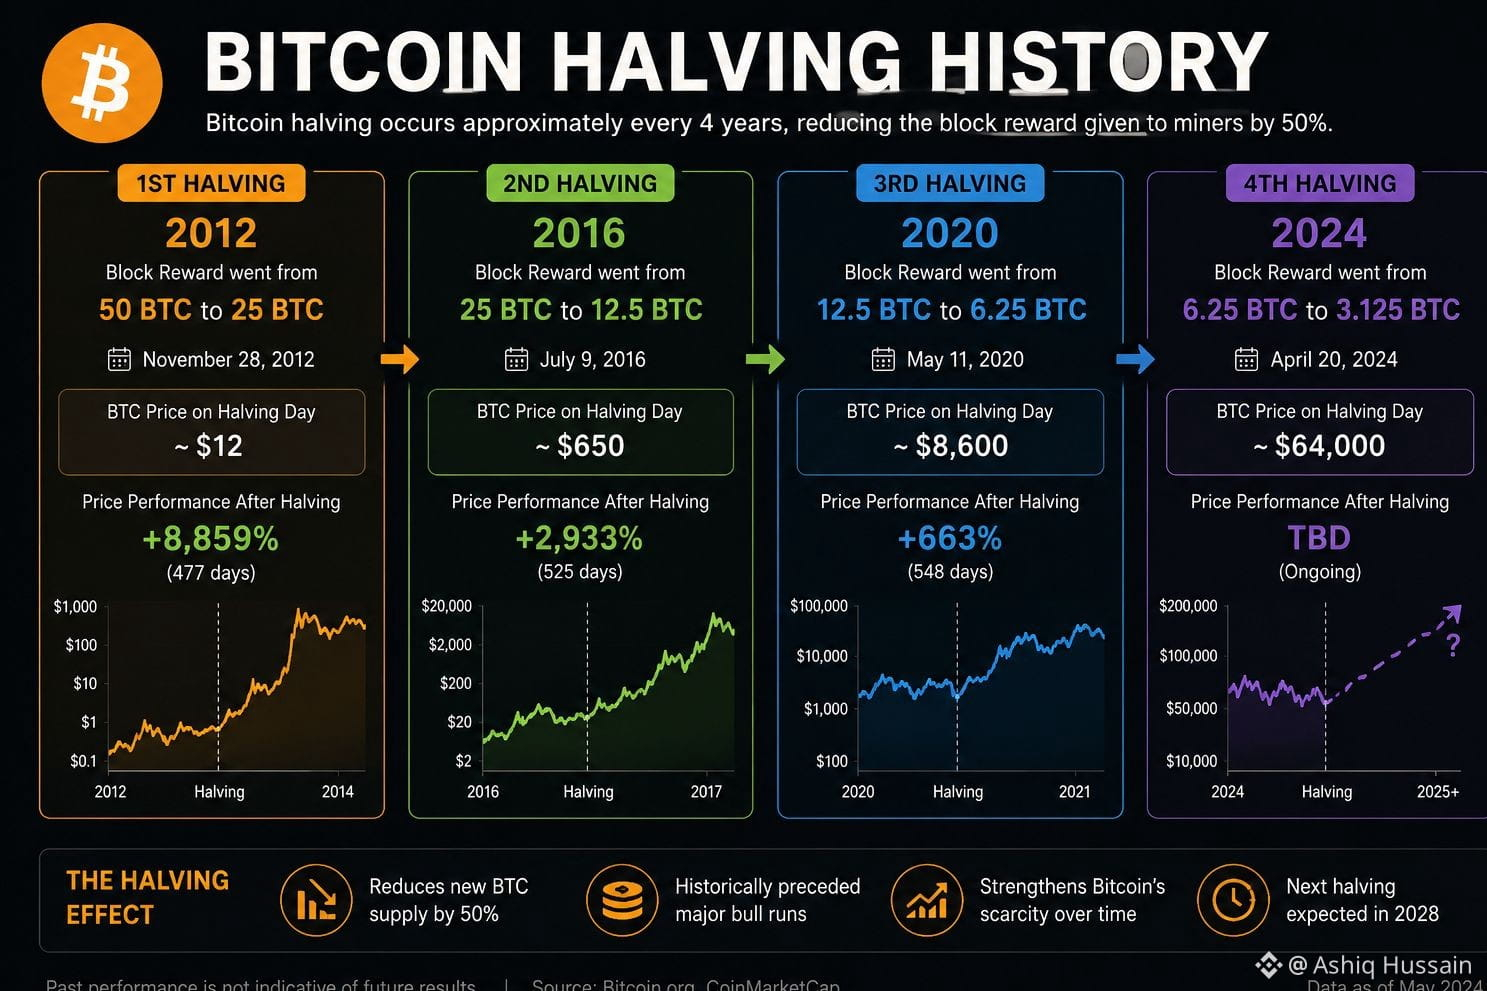
$BTC 🚨 BITCOIN HALVING HISTORY 🚨
Every 4 years, Bitcoin changes the game.
The halving cuts mining rewards by 50%, reducing new BTC supply and increasing scarcity. 📉⚡
📌 2012 → 50 BTC ➜ 25 BTC
📌 2016 → 25 BTC ➜ 12.5 BTC
📌 2020 → 12.5 BTC ➜ 6.25 BTC
📌 2024 → 6.25 BTC ➜ 3.125 BTC
History shows one thing clearly:
After every halving, Bitcoin entered massive bullish cycles. 📈🔥
From a few dollars to all-time highs, Bitcoin continues proving why scarcity matters.
Now the market watches closely to see what happens after the 2024 halving. 👀
Will history repeat again? 🚀$BTC
#Bitcoin #BTC #Halving #Crypto #BullRun #BitcoinHalving #CryptoMarket #Blockchain #BTC2026
Every 4 years, Bitcoin changes the game.
The halving cuts mining rewards by 50%, reducing new BTC supply and increasing scarcity. 📉⚡
📌 2012 → 50 BTC ➜ 25 BTC
📌 2016 → 25 BTC ➜ 12.5 BTC
📌 2020 → 12.5 BTC ➜ 6.25 BTC
📌 2024 → 6.25 BTC ➜ 3.125 BTC
History shows one thing clearly:
After every halving, Bitcoin entered massive bullish cycles. 📈🔥
From a few dollars to all-time highs, Bitcoin continues proving why scarcity matters.
Now the market watches closely to see what happens after the 2024 halving. 👀
Will history repeat again? 🚀$BTC
#Bitcoin #BTC #Halving #Crypto #BullRun #BitcoinHalving #CryptoMarket #Blockchain #BTC2026

⛏️ Bitcoin Halving Explained: How the Block Reward Cut Shapes $BTC Supply
On July 20, 2026, Bitcoin miners continue to secure the network as the halving mechanism reduces block rewards every 210,000 blocks. This deflationary event cuts the mining subsidy in half, constraining the supply of $BTC over time. The latest halving lowered rewards to 3.125 $BTC per block, reinforcing the digital scarcity at the core of Bitcoin's design.
As of July 20, 2026, Bitcoin dominance sits at 56.51%, highlighting the asset's market leadership. Each halving reinforces $BTC as a deflationary store of value with a fixed supply of 21 million coins.
📌 Key Takeaway:
Bitcoin halvings are pre-programmed supply shocks that historically precede significant price appreciation for the asset.
#Bitcoin #Halving #Mining #CryptoEducation
#BinanceAlphaAlert
On July 20, 2026, Bitcoin miners continue to secure the network as the halving mechanism reduces block rewards every 210,000 blocks. This deflationary event cuts the mining subsidy in half, constraining the supply of $BTC over time. The latest halving lowered rewards to 3.125 $BTC per block, reinforcing the digital scarcity at the core of Bitcoin's design.
As of July 20, 2026, Bitcoin dominance sits at 56.51%, highlighting the asset's market leadership. Each halving reinforces $BTC as a deflationary store of value with a fixed supply of 21 million coins.
📌 Key Takeaway:
Bitcoin halvings are pre-programmed supply shocks that historically precede significant price appreciation for the asset.
#Bitcoin #Halving #Mining #CryptoEducation
#BinanceAlphaAlert

Fidelity: Bitcoin stays secure after halvings.
Asset manager Fidelity directly challenges research claiming Bitcoin becomes less secure following block reward reductions. Their analysis shows mining difficulty adjusts efficiently and institutional miners bring operational scale that compensates for reduced subsidies. Hash rate data from Q2 2026 confirms sustained network strength despite April halving cutting rewards to 3.125 BTC per block.
The counter-report highlights that validator concentration shifts toward professional operations rather than distributing across smaller nodes. Energy efficiency improvements and transaction fee dynamics provide additional security layers. Critics previously argued miners would exit after reward drops, creating consensus vulnerabilities.
Fidelity's data demonstrates consistent hash rate through multiple halving cycles, suggesting adaptive security rather than declining protection. The asset manager concludes that Bitcoin's security model strengthens through market-driven optimization.
Will miners continue securing the network as rewards dwindle? 👇
#Bitcoin #Halving #Fidelity
Asset manager Fidelity directly challenges research claiming Bitcoin becomes less secure following block reward reductions. Their analysis shows mining difficulty adjusts efficiently and institutional miners bring operational scale that compensates for reduced subsidies. Hash rate data from Q2 2026 confirms sustained network strength despite April halving cutting rewards to 3.125 BTC per block.
The counter-report highlights that validator concentration shifts toward professional operations rather than distributing across smaller nodes. Energy efficiency improvements and transaction fee dynamics provide additional security layers. Critics previously argued miners would exit after reward drops, creating consensus vulnerabilities.
Fidelity's data demonstrates consistent hash rate through multiple halving cycles, suggesting adaptive security rather than declining protection. The asset manager concludes that Bitcoin's security model strengthens through market-driven optimization.
Will miners continue securing the network as rewards dwindle? 👇
#Bitcoin #Halving #Fidelity



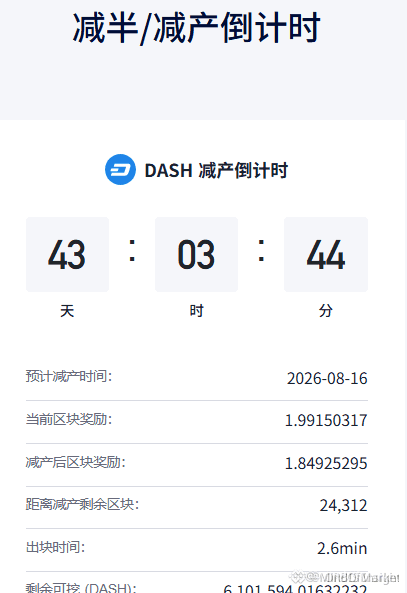
$DASH HALVING INCOMING — STRUCTURE POINTS TO 160 TARGET 🎯
Target: 160 🚀
The $DASH halving is now the dominant narrative, and market structure suggests smart money is accumulating ahead of the event. On the 4H chart, we see a clean accumulation range forming with higher lows and decreasing volume on dips — a classic pre-breakout pattern.
With the event acting as a known catalyst, the path of least resistance is up toward the 160 resistance zone. The R:R here depends on your entry, but the setup is textbook for a trend continuation. Are you buying the dip or waiting for confirmation?
Not financial advice. Always manage your risk.
#DASH #Halving #LongSetup #Crypto
🎯
Target: 160 🚀
The $DASH halving is now the dominant narrative, and market structure suggests smart money is accumulating ahead of the event. On the 4H chart, we see a clean accumulation range forming with higher lows and decreasing volume on dips — a classic pre-breakout pattern.
With the event acting as a known catalyst, the path of least resistance is up toward the 160 resistance zone. The R:R here depends on your entry, but the setup is textbook for a trend continuation. Are you buying the dip or waiting for confirmation?
Not financial advice. Always manage your risk.
#DASH #Halving #LongSetup #Crypto
🎯

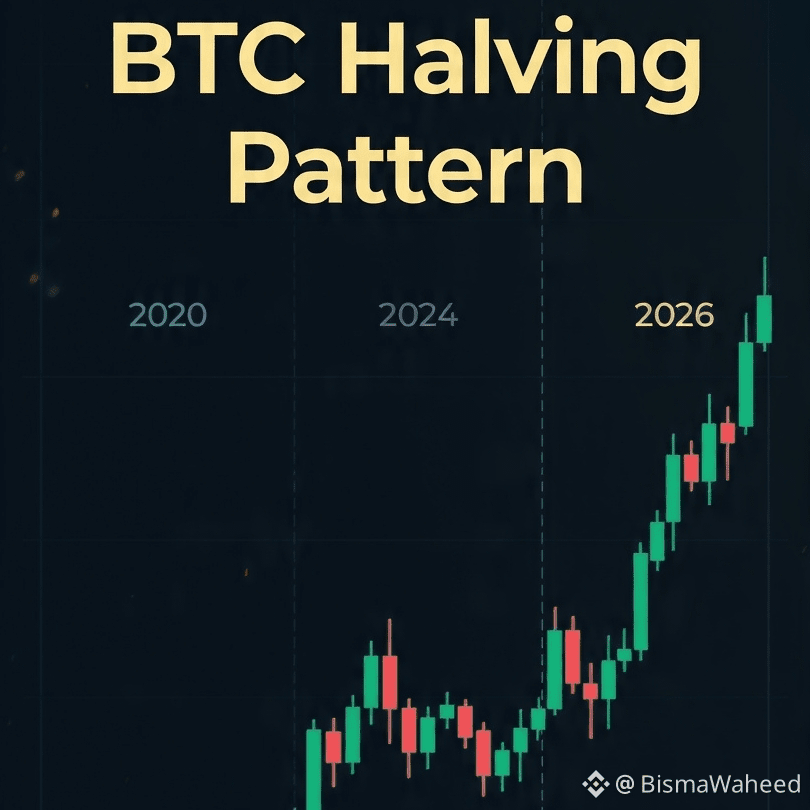
What always happens 14 months after a BTC Halving? 📈
2013 → ATH
2017 → ATH
2021 → ATH
Halving happened in 2024.
Now it's 2026.
Will history repeat or will this cycle be different?
Not financial advice.
Just data and history.
What's your take? Comment below 👇
#bitcoin #btc #binance #crypto #pakistan #halving
2013 → ATH
2017 → ATH
2021 → ATH
Halving happened in 2024.
Now it's 2026.
Will history repeat or will this cycle be different?
Not financial advice.
Just data and history.
What's your take? Comment below 👇
#bitcoin #btc #binance #crypto #pakistan #halving
The Halving Cycle Is Not Just Hype — It Is Hard Math
Every four years, Bitcoin cuts its new supply issuance in half. This is not a narrative. It is code. And when you stack that against steadily growing institutional demand, the supply-side math becomes stark.
Post the April 2024 halving, daily BTC issuance dropped to roughly 450 coins per day. At current prices, that is under $50M of new supply hitting the market daily. Meanwhile, spot ETF inflows alone have absorbed multiples of that on strong demand days. You cannot print your way out of that equation.
But the deeper conviction case is not just about scarcity — it is about the compounding credibility of each cycle. Every halving that passes without protocol failure, regulatory extinction, or adoption collapse strengthens the thesis. Four cycles in, Bitcoin has not blinked. That track record compounds just like the scarcity does.
$ETH tells a complementary story post-Merge: staking withdrawals and EIP-1559 burns mean net supply can turn deflationary during high-activity periods. Long-term conviction in crypto is not blind faith — it is understanding the supply schedule, watching the on-chain absorption, and trusting the math over the noise.
The most powerful edge in this market is patience backed by fundamentals.
#Bitcoin #Halving #CryptoInvesting #LongTermConviction #BullMarket $BTC $ETH $BNB
Every four years, Bitcoin cuts its new supply issuance in half. This is not a narrative. It is code. And when you stack that against steadily growing institutional demand, the supply-side math becomes stark.
Post the April 2024 halving, daily BTC issuance dropped to roughly 450 coins per day. At current prices, that is under $50M of new supply hitting the market daily. Meanwhile, spot ETF inflows alone have absorbed multiples of that on strong demand days. You cannot print your way out of that equation.
But the deeper conviction case is not just about scarcity — it is about the compounding credibility of each cycle. Every halving that passes without protocol failure, regulatory extinction, or adoption collapse strengthens the thesis. Four cycles in, Bitcoin has not blinked. That track record compounds just like the scarcity does.
$ETH tells a complementary story post-Merge: staking withdrawals and EIP-1559 burns mean net supply can turn deflationary during high-activity periods. Long-term conviction in crypto is not blind faith — it is understanding the supply schedule, watching the on-chain absorption, and trusting the math over the noise.
The most powerful edge in this market is patience backed by fundamentals.
#Bitcoin #Halving #CryptoInvesting #LongTermConviction #BullMarket $BTC $ETH $BNB
Log in to explore more content