

#cryptometrics
cryptometrics
45,895 views
141 Discussing
Hot
Latest

·
--
See translation
📊 [MARKET SENTIMENT DIGEST] — Fact Sheet ⚡
No hype, no opinions — just raw market metrics and key industry commentary. 💡
1️⃣ Crypto Fear & Greed Index
Current Score: 41 / 100 (Fear)
Status: Sitting firmly in Fear territory following recent price pullbacks and market-wide spot consolidation.
2️⃣ Derivatives & Funding Rates
BTC Perpetual 8h Funding Rate: +0.0052% (OI-Weighted)
Market Condition: Funding rates remain slightly positive but subdued, reflecting calm leverage conditions without aggressive long positioning.
3️⃣ Institutional ETF Net Daily Inflows
US Spot BTC ETFs: -$27.6 Million (Net Outflow)
Trend: Institutional flows flipped slightly negative in the most recent session, mirroring short-term spot caution.
4️⃣ 24-Hour Liquidation Heatmap
Total Wiped Volume: ~$1.57 billion
Ratio: 82% Longs ($92.1M) / 18% Shorts ($56.4M)
Market Impact: Long positions took the brunt of recent intraday dips as leverage continues to be flushed out.
5️⃣ Social Sentiment & Leader Spotlight
Leader Spotlight: Michael Saylor
Key Commentary: "Bitcoin is digital property; capital preservation precedes speculation."
Impact: Long-term treasury holders remain focused on macro accumulation while short-term retail leverage resets.
6️⃣ Bitcoin Dominance (BTC.D)
Current Level: ~60.4%
Capital Flow: BTC dominance stays at multi-year highs, locking up liquidity and keeping altcoin action muted.
7️⃣ Stablecoin Dominance (USDT.D + USDC.D)
Current Level: ~10.8% (Total Market Cap ~$301B)
Dry Powder Indicator: Stablecoin reserves remain high on the sidelines as traders hold cash waiting for a clear breakout confirmation.
💬 How are you interpreting these numbers today? Are you holding cash or deploying capital? Drop your thoughts below! 👇
#MarketSentimentToday $BTC #BinanceSquare #CryptoMetrics
(Data source: Public market indicators. Provided for informational purposes only. Not financial advice.)
78
·
--
See translation
📊 [MARKET SENTIMENT DIGEST] — Fact Sheet ⚡
No hype, no opinions — just raw market metrics and key industry commentary. 💡
1️⃣ Crypto Fear & Greed Index
Current Score: 45 / 100 (Neutral)
Status: Sitting firmly in neutral/cautious territory as the market holds position around the $80K–$83K BTC structural consolidation zone.
2️⃣ Derivatives & Funding Rates
BTC Perpetual 8h Funding Rate: +0.0085% (OI-Weighted)
Market Condition: Funding rates remain balanced with a minimal long bias, reflecting quiet position building rather than aggressive retail leverage.
3️⃣ Institutional ETF Net Daily Inflows
US Spot BTC ETFs: +$102.7 Million (Net Inflow)
Trend: Net positive capital flows persist across spot products, confirming sustained institutional bid during local range consolidation.
4️⃣ 24-Hour Liquidation Heatmap
Total Wiped Volume: ~$142.8 Million
Ratio: 61% Longs ($87.1M) / 39% Shorts ($55.7M)
Market Impact: Subdued volatility flushed out tight overleveraged positions on intraday dips, leaving order books clean ahead of weekend liquidity shifts.
5️⃣ Social Sentiment & Leader Spotlight
Leader Spotlight: Larry Fink
Key Commentary: "Bitcoin is an asset class that provides an alternative store of value against systemic currency debasement."
Impact: Institutional focus remains locked on macro capital preservation and long-term treasury allocation over short-term speculative rotations.
6️⃣ Bitcoin Dominance (BTC.D)
Current Level: ~59.8%
Capital Flow: BTC.D holds near multi-year highs, indicating capital concentration in Bitcoin remains steady while altcoins await a macro liquidity signal.
💬 How are you interpreting these numbers today? Are you holding cash or deploying capital? Drop your thoughts below! 👇
#MarketSentimentToday #CryptoData #BinanceSquare #CryptoMetrics $BTC
(Data source: Public market indicators. Provided for informational purposes only. Not financial advice.
55

·
--
See translation
On-chain metrics show what whales and miners are doing with their coins. Exchange inflows mean more supply sitting at exchanges, while outflows suggest accumulation. Active addresses count unique transactions. When this number rises while supply stays steady, demand is strengthening. For example, $BTC had 1.2 million daily active addresses in January while circulating supply remained stable at 19.6 million. The NVT ratio compares market cap to daily transaction volume. High NVT means is rising faster than activity, often signaling overvaluation. $ETH once had an NVT of 120 during rally phases versus 30 during normal periods. These signals help identify smart money moves. Inflows to exchanges often precede distributions, while sustained outflows indicate confidence. OnChainAnalysis #CryptoMetrics #BlockchainData
On-chain metrics show what whales and miners are doing with their coins. Exchange inflows mean more supply sitting at exchanges, while outflows suggest accumulation. Active addresses count unique transactions. When this number rises while supply stays steady, demand is strengthening. For example, $BTC had 1.2 million daily active addresses in January while circulating supply remained stable at 19.6 million. The NVT ratio compares market cap to daily transaction volume. High NVT means is rising faster than activity, often signaling overvaluation. $ETH once had an NVT of 120 during rally phases versus 30 during normal periods. These signals help identify smart money moves. Inflows to exchanges often precede distributions, while sustained outflows indicate confidence. OnChainAnalysis #CryptoMetrics #BlockchainData
17
·
--
See translation
📊 [MARKET SENTIMENT DIGEST] — Fact Sheet ⚡
No hype, no opinions — just raw market metrics and key industry commentary. 💡
1️⃣ Crypto Fear & Greed Index
Current Score: 47 / 100 (Neutral)
Status: Sitting directly in neutral territory, indicating market indecision after recent price consolidation around $80K BTC.
2️⃣ Derivatives & Funding Rates
BTC Perpetual 8h Funding Rate: +0.0088% (OI-Weighted)
Market Condition: Longs are paying shorts moderately; funding remains balanced without extreme leverage bias on either side.
3️⃣ Institutional ETF Net Daily Inflows
US Spot BTC ETFs: +$110.3 Million (Net Inflow)
Trend: Wall Street institutions continue net capital accumulation despite sideways spot price movement.
4️⃣ 24-Hour Liquidation Heatmap
Total Wiped Volume: ~$159.3 Million
Ratio: 66% Longs ($105.8M) / 34% Shorts ($53.5M)
Market Impact: Overleveraged retail longs were flushed during intraday pullbacks.
5️⃣ Social Sentiment & Leader Spotlight
Leader Spotlight: Michael Saylor
Key Commentary: "Bitcoin is digital property; capital preservation precedes speculation."
Impact: Institutional narratives remain focused on long-term BTC treasury holdings rather than short-term altcoin leverage.
6️⃣ Bitcoin Dominance (BTC.D)
Current Level: ~60.1%
Capital Flow: Capital concentration in Bitcoin remains at multi-year highs, keeping liquidity tight for altcoins.
7️⃣ Stablecoin Dominance (USDT.D + USDC.D)
Current Level: ~10.9% (Total Stablecoin Market Cap ~$299B)
Dry Powder Indicator: High stablecoin ratios show traders are holding significant cash reserves on the sidelines waiting for clear breakout signals.
💬 How are you interpreting these numbers today? Are you holding cash or deploying capital? Drop your thoughts below! 👇
#MarketSentiment #BTC #CryptoMetrics
(Data source: Public market indicators. Provided for informational purposes only. Not financial advice.)
107

See translation
Derivatives & Sentiment: The Funding Rate Ghost Town
An essential metric for professional traders right now: the funding basis remains completely negligible across major perpetual markets. We have not seen consistent premium or material funding rate arbitrage opportunities for months. This indicates that this entire choppy price action is driven predominantly by spot distribution and spot absorption rather than highly leveraged speculative cascades. Trade spot or keep futures leverage low.
#CryptoMetrics #FundingRates #CryptoDerivatives #TradingStrategyGuide #BİNANCE
1
22

See translation
📚 What Is Total Value Locked?: TVL explained — the key metric for measuring DeFi adoption
On July 19, 2026, Total Value Locked (TVL) measures the total assets deposited in a DeFi protocol's smart contracts. It's the cryptocurrency equivalent of 'assets under management' for traditional finance, indicating how much trust and capital a protocol commands.
While exact TVL figures vary across tracking platforms, protocols on Ethereum $ETH consistently hold the most value, followed by Solana $SOL and other L1s. Rising TVL typically correlates with token price appreciation, making it a key leading indicator.
📌 Key Takeaway:
TVL is the single best metric for measuring DeFi protocol health. When TVL grows, it means users trust the protocol enough to deposit real assets — the ultimate vote of confidence in any decentralized application.
#TVL #DeFi #CryptoMetrics
#BinanceAlphaAlert
37

On-Chain Analysis: Understanding Exchange Wallet Flows
Title: Wallet Flows: What Do Exchanges’ Inflows and Outflows Mean? 📊📉
Content:
Observing the movement of tokens to and from trading platform wallets provides major clues about the state of the market.
📌 Reading the Data:
Net Inflows (Exchange Inflows): Large volumes sent to the platforms indicate a potential intent to sell or take profit.
Net Outflows (Exchange Outflows): Withdrawing assets to private wallets reflects an intention to accumulate and hold for the long term.
Tracking these metrics helps you step back and assess the psychology of large wallets.
#OnChain #BlockchainData #CryptoMetrics #MarketAnalysis #Binance @Square-Creator-ce2378404
On-Chain Analysis: Understanding Exchange Wallet Flows
Title: Wallet Flows: What Do Exchanges’ Inflows and Outflows Mean? 📊📉
Content:
Observing the movement of tokens to and from trading platform wallets provides major clues about the state of the market.
📌 Reading the Data:
Net Inflows (Exchange Inflows): Large volumes sent to the platforms indicate a potential intent to sell or take profit.
Net Outflows (Exchange Outflows): Withdrawing assets to private wallets reflects an intention to accumulate and hold for the long term.
Tracking these metrics helps you step back and assess the psychology of large wallets.
#OnChain #BlockchainData #CryptoMetrics #MarketAnalysis #Binance @BNB
19
See translation
💰 Market Cap and Dominance: Two Key Metrics for Understanding Crypto Markets: How investors use capitalization and market share to gauge trends
On July 29, 2026, market capitalization — calculated as price multiplied by circulating supply — is the most common metric for comparing the relative size of digital assets. $BTC, with a market cap of $1.28T, is the largest by a wide margin.
Dominance measures one asset's market cap as a percentage of the total crypto market. With $BTC at 56.50% and $ETH at 10.12%, these two assets account for over two-thirds of the entire $2.27T market.
Falling Bitcoin dominance historically signals an altcoin season — capital rotating into smaller assets — while rising dominance suggests risk-off preference for the most established digital asset. Both metrics help investors read market psychology.
📌 Key Takeaway:
Market cap shows relative size of digital assets, while dominance reveals capital flow patterns between Bitcoin, Ethereum, and altcoins. Together, these metrics provide a macro lens for understanding market cycles and investor sentiment.
#MarketCap #CryptoMetrics
#BinanceAlphaAlert
💰 Market Cap and Dominance: Two Key Metrics for Understanding Crypto Markets: How investors use capitalization and market share to gauge trends
On July 29, 2026, market capitalization — calculated as price multiplied by circulating supply — is the most common metric for comparing the relative size of digital assets. $BTC , with a market cap of $1.28T, is the largest by a wide margin.
Dominance measures one asset's market cap as a percentage of the total crypto market. With $BTC at 56.50% and $ETH at 10.12%, these two assets account for over two-thirds of the entire $2.27T market.
Falling Bitcoin dominance historically signals an altcoin season — capital rotating into smaller assets — while rising dominance suggests risk-off preference for the most established digital asset. Both metrics help investors read market psychology.
📌 Key Takeaway:
Market cap shows relative size of digital assets, while dominance reveals capital flow patterns between Bitcoin, Ethereum, and altcoins. Together, these metrics provide a macro lens for understanding market cycles and investor sentiment.
#MarketCap #CryptoMetrics
#BinanceAlphaAlert
29


See translation
Short-Term Holder Realized Price: BTC is currently trading close to the Short-Term Holder Realized Price. This metric represents the average buy-in for recent buyers and often acts as a fierce battleground between bulls and bears. #CryptoMetrics #BTC
Short-Term Holder Realized Price: BTC is currently trading close to the Short-Term Holder Realized Price. This metric represents the average buy-in for recent buyers and often acts as a fierce battleground between bulls and bears. #CryptoMetrics #BTC
68

·
--
See translation
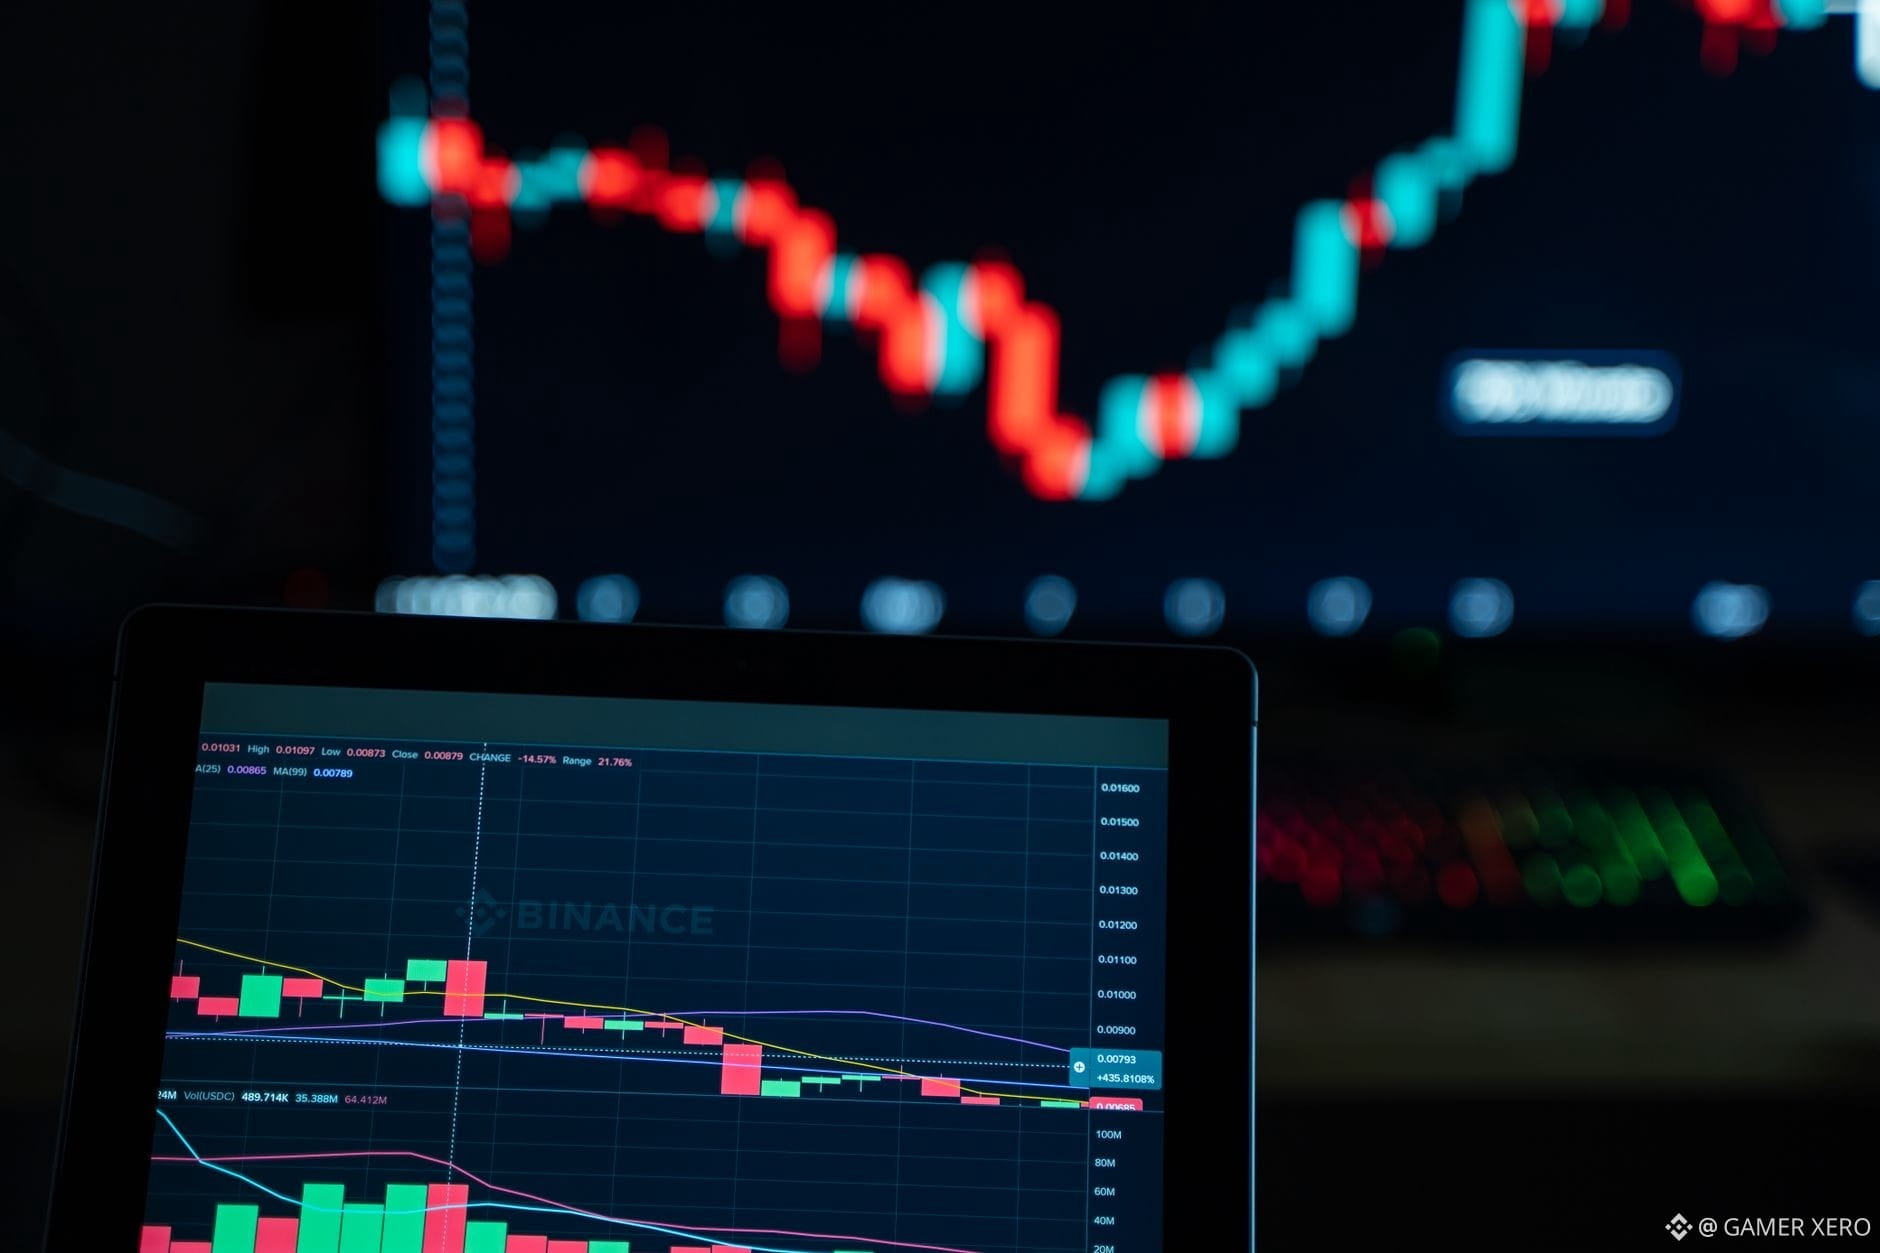
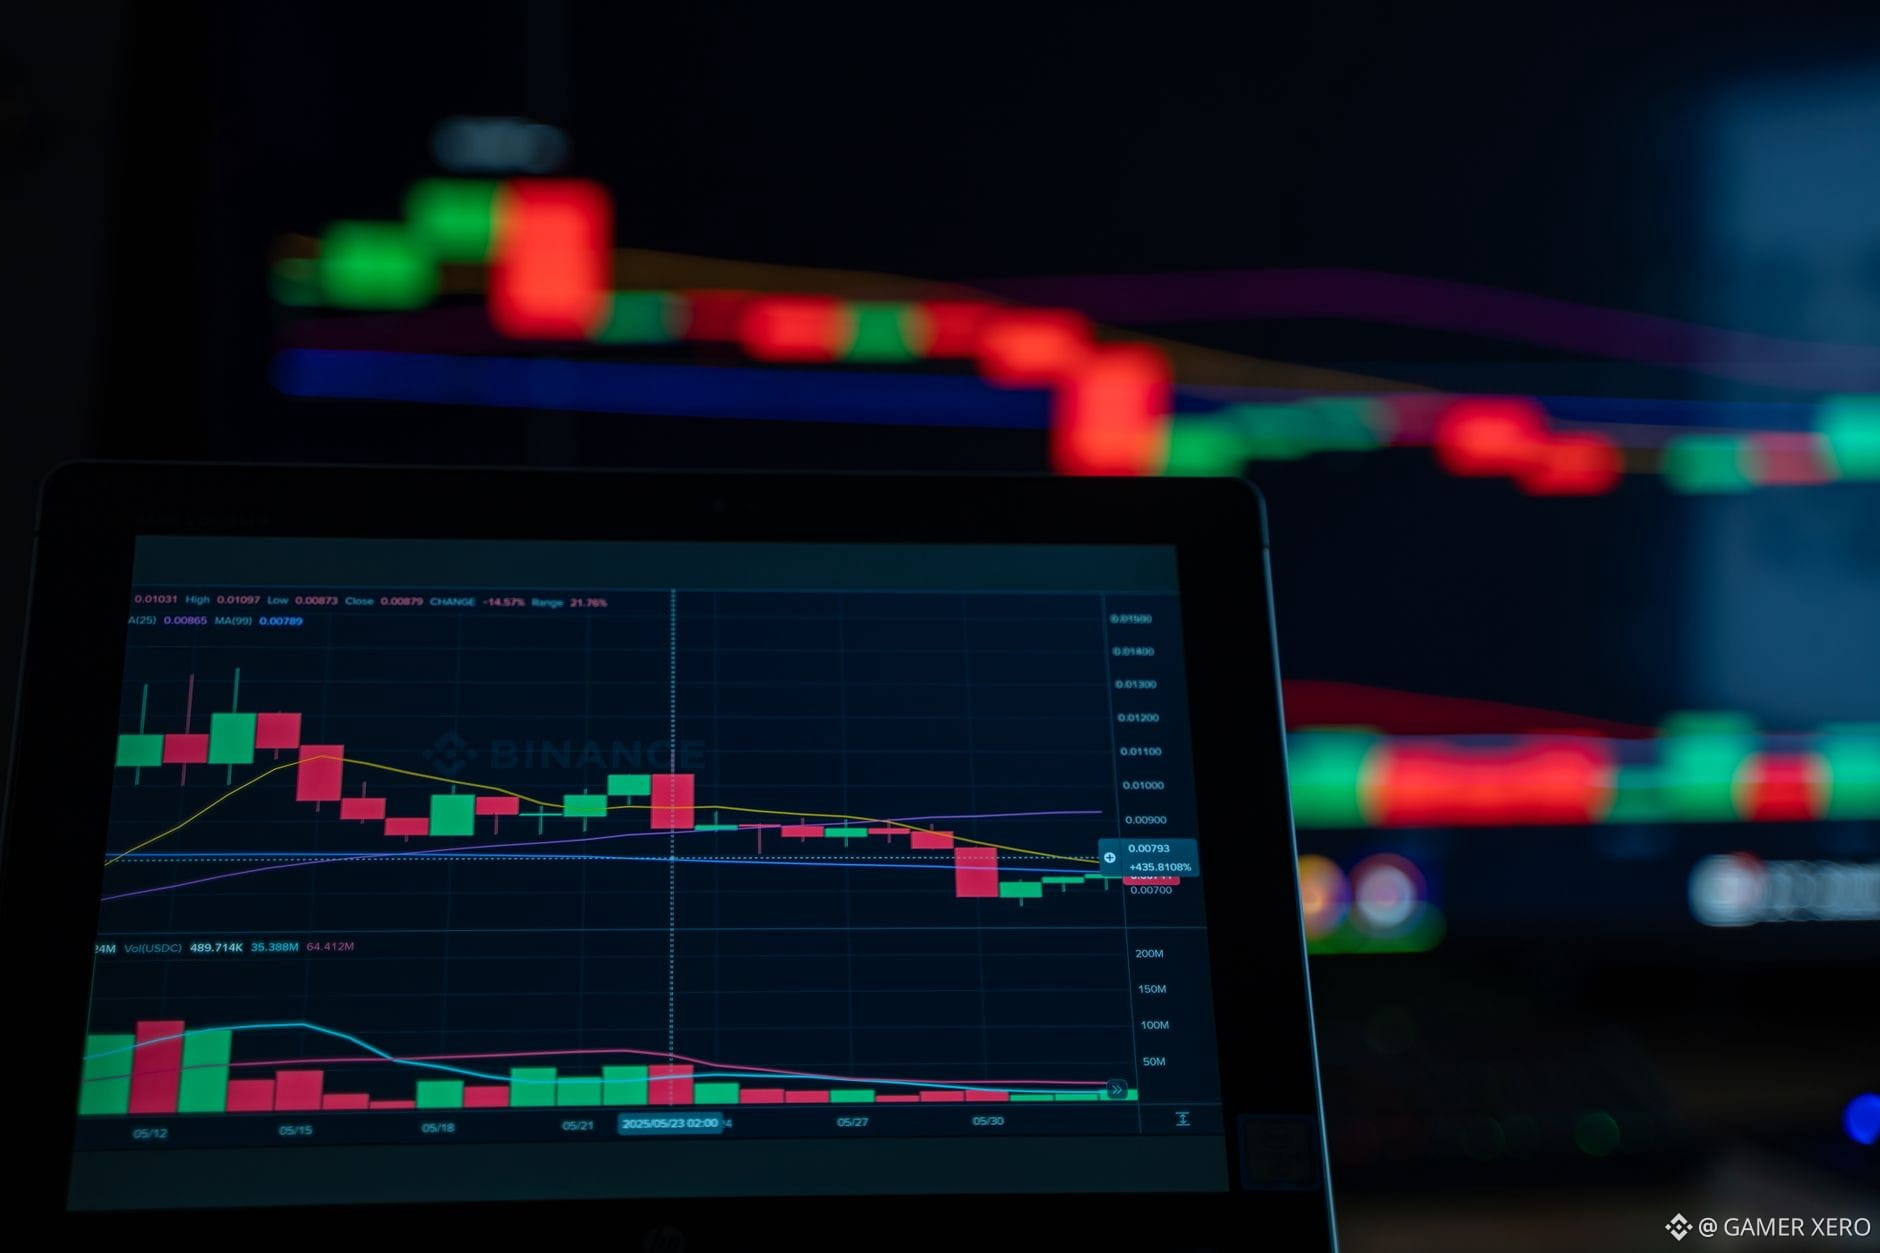
Watching the on‑chain “active addresses” metric can give you a quick sense of real‑world participation without staring at price charts. An active address is any wallet that sends or receives a transaction in a 24‑hour window, so spikes often line up with events that move people, not just price.
Take $BTC this morning: the network reported a modest rise in active addresses, echoing the 0.23 % price uptick around $64,032. While the move is small, the address count jumped by roughly 3 % versus the previous day, hinting that more users are transacting—perhaps reacting to news or adjusting positions.
Contrast that with $ETH, where the price held steady at $1,869.54, yet active addresses dipped slightly. A lower on‑chain participation rate can signal reduced demand for gas‑driven activity, even if the token price appears flat.
What on‑chain metric do you find most reliable for confirming a price move’s strength?
#CryptoMetrics #OnChainData #TraderTools #GAMERXERO
Watching the on‑chain “active addresses” metric can give you a quick sense of real‑world participation without staring at price charts. An active address is any wallet that sends or receives a transaction in a 24‑hour window, so spikes often line up with events that move people, not just price.
Take $BTC this morning: the network reported a modest rise in active addresses, echoing the 0.23 % price uptick around $64,032. While the move is small, the address count jumped by roughly 3 % versus the previous day, hinting that more users are transacting—perhaps reacting to news or adjusting positions.
Contrast that with $ETH , where the price held steady at $1,869.54, yet active addresses dipped slightly. A lower on‑chain participation rate can signal reduced demand for gas‑driven activity, even if the token price appears flat.
What on‑chain metric do you find most reliable for confirming a price move’s strength?
#CryptoMetrics #OnChainData #TraderTools #GAMERXERO
35
See translation
📊 Crypto Metrics: Market Cap vs. Price vs. Volume
On June 30, 2026, the total crypto market cap is $2.14 trillion. But what does this include? Market cap = price × circulating supply. It represents the total value of all coins in circulation. Unlike a single stock, crypto's total market cap measures the entire ecosystem's worth.
Total market cap is more useful than individual coin prices for understanding macro trends. When total cap rises, money is flowing into crypto. The current $2.14T cap is still far below the $3T all-time high, suggesting room for growth.
📌 Key Takeaway:
Total crypto market cap is the best macro indicator — it tells you whether money is flowing into or out of the entire ecosystem, regardless of individual coin performance.
#MarketCap #CryptoMetrics #Education
#BinanceAlphaAlert
21

Hello everyone, recently on-chain data has revealed some interesting market signals.📊
By observing the hash rate of $BTC , we can see that miners’ confidence remains solid, which provides a strong foundation for the price. At the same time, the number of active addresses remains stable, indicating that network usage has not cooled down. For $ETH, the frequency of smart contract interactions has increased somewhat, and ecosystem activity is gradually recovering.🔥
Notably, some major coins have seen a slight outflow from exchange reserves, which is often regarded as a signal for long-term holding. The on-chain transfer volume of $SOL also shows a certain upward trend, and community engagement is worth paying attention to. Although technical indicators show RSI in a neutral range, overall market sentiment leans mildly bullish.🤔
Invest with caution. On-chain data is only for reference and should never be followed blindly. It’s recommended to make a comprehensive judgment in combination with the macro environment.🛡️
#OnChain #BlockchainData #CryptoMetrics
Hello everyone, recently on-chain data has revealed some interesting market signals.📊
By observing the hash rate of $BTC , we can see that miners’ confidence remains solid, which provides a strong foundation for the price. At the same time, the number of active addresses remains stable, indicating that network usage has not cooled down. For $ETH , the frequency of smart contract interactions has increased somewhat, and ecosystem activity is gradually recovering.🔥
Notably, some major coins have seen a slight outflow from exchange reserves, which is often regarded as a signal for long-term holding. The on-chain transfer volume of $SOL also shows a certain upward trend, and community engagement is worth paying attention to. Although technical indicators show RSI in a neutral range, overall market sentiment leans mildly bullish.🤔
Invest with caution. On-chain data is only for reference and should never be followed blindly. It’s recommended to make a comprehensive judgment in combination with the macro environment.🛡️
#OnChain #BlockchainData #CryptoMetrics
305

·
--
Bullish
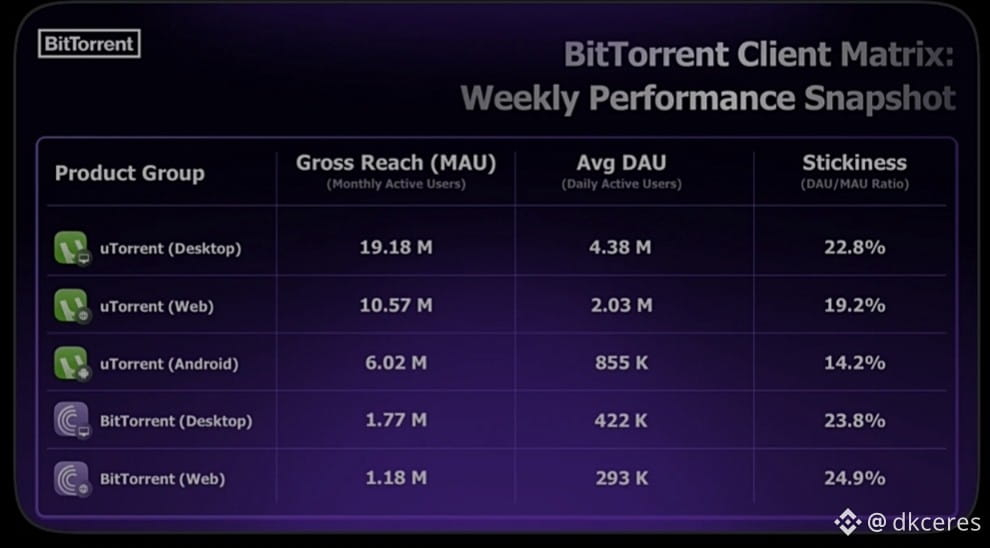
Weekly BitTorrent Radiography: Massive Use and Strong Retention 📊
The BitTorrent ecosystem continues to show widespread adoption worldwide. Its latest weekly performance report (Client Matrix) gives us very interesting metrics about the usage of its different platforms:
Impressive raw reach: uTorrent for Desktop leads with 19.18 million monthly active users (MAU), followed closely by uTorrent Web with 10.57 million and uTorrent Android with 6.02 million.
Consistent daily activity: When it comes to daily active users (DAU), the desktop version tops the list with 4.38 million people connected every day.
Notable loyalty: BitTorrent Web maintains a stickiness index (DAU/MAU retention) of 24.9%, reflecting a very loyal and steady community across its web tools.
These figures reaffirm the strength of the network’s user base. Do you use any of these versions for your downloads or daily browsing? Let us know in the comments! 👇
#BitTorrent #BTT #CryptoMetrics #Web3 #BinanceSquare
2
232

·
--
See translation
Stop asking "when is altcoin season?" Start watching these 3 things instead. 👇
If you only watched three things to judge altseason, they would be: Bitcoin dominance, ETH/BTC ratio, and a broad altcoin index like TOTAL3.
Right now:
→ BTC dominance: ~60% — needs to DROP ⬇️
→ ETH/BTC: weak — needs to STRENGTHEN ⬆️
→ TOTAL3: below key levels — needs to RECLAIM ⬆️
Until those pieces begin to align, it's usually just isolated rotation, not a full market-wide shift.
None of the three are confirmed yet.
But ALL three are closer than they were 3 months ago. 📈
Are you watching these metrics? Drop below 👇
#altcoinseason #CryptoMetrics
$ZRO $UNI $ZEC
61

See translation
🌐 GLOBAL TRENDING INTEL: THE SENTIMENT DIVERGENCE
The retail crowd is waking up. After a sharp liquidation phase wiped out late-stage leverage, global search volume and retail tracking metrics are flashing a major trend reversal. But while the masses are trying to time their re-entry, the real story is written in the institutional order books.
============================================================
[ SENTIMENT INFRASTRUCTURE TERMINAL // BY: Ruwaiz_Crypto]
============================================================
SEARCH VOLUME (RETAIL INTEREST) [████████████░░░░] +32% SURGE
INSTITUTIONAL ACCUMULATION FLOOR [████████████████] MAXIMUM
SYSTEM VOLATILITY PRE-SHOCK [████░░░░░░░░░░░░] RE-CHARGING
------------------------------------------------------------
MARKET TARGETS: RE-TESTING CRITICAL RECOVERY LAUNCHPADS
============================================================
📊 Dissecting the Macro Reality: The Lagging Crowd
Retail sentiment is historically a lagging emotional indicator. The masses rarely buy the absolute bottom; they wait for stability, panic search the keywords, and then FOMO directly into the local overhead resistance. Smart money takes the exact opposite approach:
The Search Rebound: The massive influx of search traffic tells us the sideline capital is getting highly uncomfortable watching the stabilization. They exited during the volatility and are now aggressively preparing to chase the next vertical leg.
The Absorption Floor: Institutional desks have spent the last week absorbing the liquidations quietly. This horizontal distribution isn't weakness—it's a calculated transfer of ownership from weak retail hands to permanent sovereign balance sheets.
#BinanceSquare #CryptoMetrics #MarketAnalysis #MacroVelocity
3
84

See translation
For a holistic view, I always combine multiple metrics. Take the general intel: 🔥 Deep Market Intel
💎 Order Book: Heavy Buy Walls (1.83x)
💎 1H Open Interest: Declining (-)
💎 Whales L/S: 69.3% Long
💎 Taker Flow: 1.64x 📊
When OI is declining but Whales are still long and Taker Flow is strong, it indicates potential consolidation before a move. Apply this to $COS and $EUL analysis.
#DataAnalysis #CryptoMetrics
237
See translation
📊 DeFi Metric: Understanding TVL as an Ecosystem Health Indicator
On June 30, 2026, protocols like Hyperliquid demonstrate how TVL (Total Value Locked) measures ecosystem health. TVL is the total value of assets deposited in a DeFi protocol. Higher TVL means more user trust and liquidity. Solana $SOL's growing TVL reflects its DeFi ecosystem expansion.
TVL is a leading indicator for token prices — rising TVL often precedes price increases as more capital enters the ecosystem. When TVL declines, it can signal users are leaving. Track TVL alongside price for a complete picture of protocol health.
📌 Key Takeaway:
TVL measures the capital users trust a protocol with — it's a more honest health indicator than price alone for evaluating DeFi ecosystems.
#TVL #DeFi #CryptoMetrics
#BinanceAlphaAlert
📊 DeFi Metric: Understanding TVL as an Ecosystem Health Indicator
On June 30, 2026, protocols like Hyperliquid demonstrate how TVL (Total Value Locked) measures ecosystem health. TVL is the total value of assets deposited in a DeFi protocol. Higher TVL means more user trust and liquidity. Solana $SOL 's growing TVL reflects its DeFi ecosystem expansion.
TVL is a leading indicator for token prices — rising TVL often precedes price increases as more capital enters the ecosystem. When TVL declines, it can signal users are leaving. Track TVL alongside price for a complete picture of protocol health.
📌 Key Takeaway:
TVL measures the capital users trust a protocol with — it's a more honest health indicator than price alone for evaluating DeFi ecosystems.
#TVL #DeFi #CryptoMetrics
#BinanceAlphaAlert
129

See translation
$SHELL | A Full Breakdown of Today's Money Flow by Order Size
Binance's 24-hour flow data splits SHELL's volume into three buckets. Large orders: 88,930.80 bought, 632,746.80 sold, net -543,816.00. Medium orders: 3.32M bought, 2.61M sold, net +711,008.00. Small orders: 15.05M bought, 10.51M sold, net +4.54M.
Add the three together and the full day nets out to +4.71M SHELL, on 18.46M bought against 13.75M sold.
#SHELL #OrderFlow #CryptoMetrics
1
53

DRAWN MAGNITUDE: WHY THE TVL METRIC NO LONGER GUARANTEES PROJECT SUCCESS 📊🎪
"Look, this new blockchain's TVL (Total Value Locked) jumped to $1 billion in a week! The project is top-notch, investors are throwing their cash at it, gotta grab that token!". Another trap for those who fall for surface-level stats.
• How TVL is manipulated: Developers and their buddy venture funds use a method called 'carousel'. They take $10 million, toss it into the first protocol of their blockchain, get wrapped tokens as collateral, then toss those tokens into the second protocol, then the third, and so on, cycling through 10 times.
• Result: There are only $10 million in real funds in the system, but the TVL stats show $100 million. It’s pure illusion of popularity, created to attract retail investors before a dump.
👇 Open the widget for any DeFi coin. Learn to dig deeper into those shiny metrics!
#TVL #DeFi #CryptoMetrics #CryptoFREEMEN
1
579

·
--
See translation
$QNT could add $20 to your gains today, up 10.7%.
Quant surged over ten percent, driven by solid buying despite modest volume at $14M, just 0.8 × its weekly average. The 7‑day advance outpaced Bitcoin, which slipped 4 %.
Funding is slightly positive at +0.005%, meaning longs are paying shorts, and open interest slipped 1 % to $23M, hinting cautious sentiment. With 1.2 longs per short, bullish bias remains modest.
💬 Bullish or bearish? one word.
#QuantRally #CryptoMetrics
39
Log in to explore more content
Join global crypto users on Binance Square
⚡️ Get latest and useful information about crypto.
💬 Trusted by the world’s largest crypto exchange.
👍 Discover real insights from verified creators.
Email / Phone number
Trending Topics
1
#BinanceProcesses$4.65BWithdrawals
15,062 views
88 Discussing
2
#WithdrawalsBack: 15 networks live
6,444 views
114 Discussing
3
#BinanceUpdatesProofofReservesAddresses
105,885 views
1,424 Discussing
4
#BinanceToResumePhaseOneOfWithdrawals
145,075 views
1,528 Discussing
5
#BinanceHadAlreadyCovered$6BofHackLoss
9,750 views
132 Discussing
6
#FBIConfirmsNorthKoreaIsResponsibleForBinanceCryptoHack
47,979 views
146 Discussing
7
#CZDismissesClaimsBinanceHackWasPredicted
72,975 views
700 Discussing
8
#B14gReportsUnauthorizedTransferOfAbout97MCORE
25,498 views
344 Discussing
9
#USSpotETHETFsPost23StraightDaysOfNetOutflows
28,705 views
325 Discussing
10
#IntelHasItsWorstDaySince1974
121,306 views
939 Discussing