
#17
17
19,881 views
155 Discussing
Hot
Latest

·
--
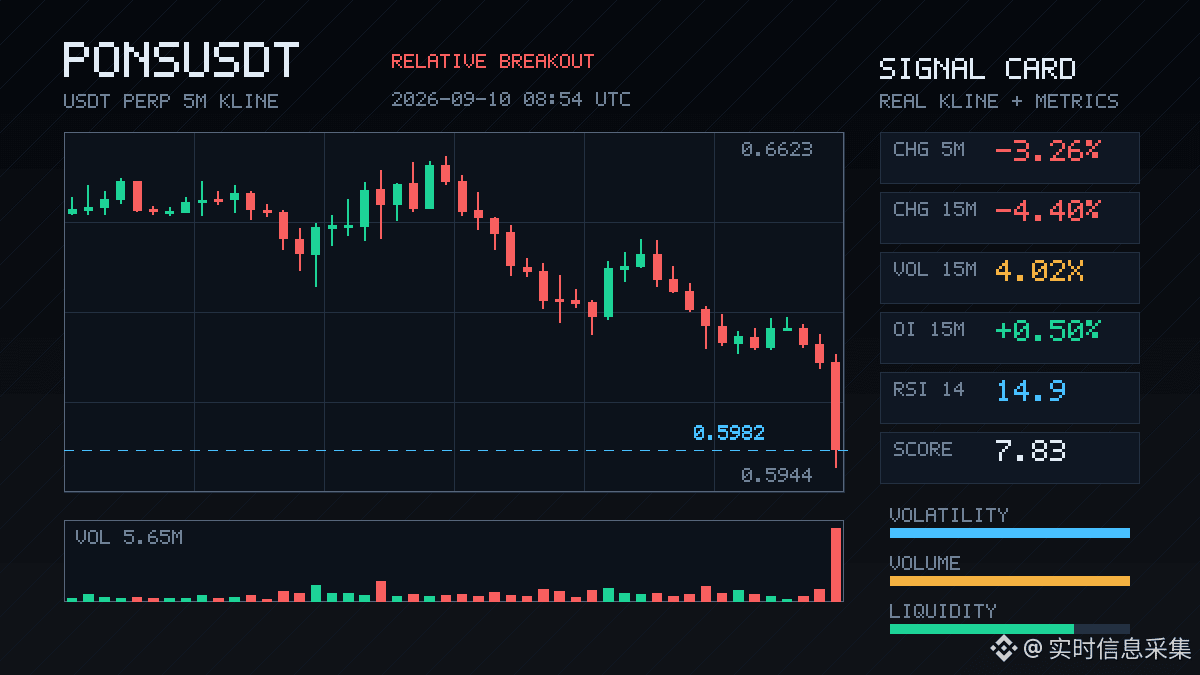
This 15m move of $PONS crushed through pretty decisively, down -4.4%. Volume even jumped to about 4x, with volatility at 4.01—this is the kind of trend that usually doesn’t move much, but once it does, it just drives straight down.
What’s interesting is the OI: on 15m it’s +0.5%, and on 1h it’s +1.68%. Price is falling but open interest is rising—classic signs of newly added leveraged short positions, not just old longs getting liquidated and closing. Active trades are weak at -32.2%, and the buy/sell ratio is 0.51; sellers are clearly in control. The close breaks below the lower bound of the past ~20 5m candles—short-term structure has flipped bearish.
Looking at nominal changes: the whole pool has orders filling up to #17. The abnormal percentile of 33.7% isn’t extreme, but the confirmation on depth is solid—trading volume is higher than usual, it hits the edges of the range with directional bias, and several conditions line up. 24h turnover is 198M. The pool isn’t small, and with this amount smashing the range, it’s not something retail can play.
My take: this move looks more like shorts actively opening positions to push the breakdown, not passive long-liquidation. Next we either see continued volume as it probes lower, or shorts add further to a certain extent then cover into a rebound—but right now there are no signs of a bottom. Don’t rush to catch it. After the first K that breaks the range’s lower bound, chasing shorts or catching a bottom is just gambling—wait for confirmation.
This 15m move of $PONS crushed through pretty decisively, down -4.4%. Volume even jumped to about 4x, with volatility at 4.01—this is the kind of trend that usually doesn’t move much, but once it does, it just drives straight down.
What’s interesting is the OI: on 15m it’s +0.5%, and on 1h it’s +1.68%. Price is falling but open interest is rising—classic signs of newly added leveraged short positions, not just old longs getting liquidated and closing. Active trades are weak at -32.2%, and the buy/sell ratio is 0.51; sellers are clearly in control. The close breaks below the lower bound of the past ~20 5m candles—short-term structure has flipped bearish.
Looking at nominal changes: the whole pool has orders filling up to #17. The abnormal percentile of 33.7% isn’t extreme, but the confirmation on depth is solid—trading volume is higher than usual, it hits the edges of the range with directional bias, and several conditions line up. 24h turnover is 198M. The pool isn’t small, and with this amount smashing the range, it’s not something retail can play.
My take: this move looks more like shorts actively opening positions to push the breakdown, not passive long-liquidation. Next we either see continued volume as it probes lower, or shorts add further to a certain extent then cover into a rebound—but right now there are no signs of a bottom. Don’t rush to catch it. After the first K that breaks the range’s lower bound, chasing shorts or catching a bottom is just gambling—wait for confirmation.
What’s interesting is the OI: on 15m it’s +0.5%, and on 1h it’s +1.68%. Price is falling but open interest is rising—classic signs of newly added leveraged short positions, not just old longs getting liquidated and closing. Active trades are weak at -32.2%, and the buy/sell ratio is 0.51; sellers are clearly in control. The close breaks below the lower bound of the past ~20 5m candles—short-term structure has flipped bearish.
Looking at nominal changes: the whole pool has orders filling up to #17. The abnormal percentile of 33.7% isn’t extreme, but the confirmation on depth is solid—trading volume is higher than usual, it hits the edges of the range with directional bias, and several conditions line up. 24h turnover is 198M. The pool isn’t small, and with this amount smashing the range, it’s not something retail can play.
My take: this move looks more like shorts actively opening positions to push the breakdown, not passive long-liquidation. Next we either see continued volume as it probes lower, or shorts add further to a certain extent then cover into a rebound—but right now there are no signs of a bottom. Don’t rush to catch it. After the first K that breaks the range’s lower bound, chasing shorts or catching a bottom is just gambling—wait for confirmation.
356

·
--
$BULLA This 15m move has something to it. A 4.34% surge paired with more than 4x volume—straight up breaking through the upper edge of nearly 20 5m candles.
What’s even more interesting is the OI: in the 15m window, +1.12%, and in the 1h window, +2.52%—the notional increased by 1.17M. This isn’t short-covering; it’s new leveraged long positions entering the market. The abnormal percentile is 81.7%, and the overall notional change ranks #17 in the whole pool. Depth has been confirmed.
The only thing that makes me hesitate is that the actively executed trades are -0.1%, and the buy/sell ratio is exactly 1.00. The push did lift the price, but the active buy orders didn’t really follow through—it feels a bit like a passive push.
First, see if it can hold above the top of this range. If it can’t, then it’s a false breakout.
$BULLA This 15m move has something to it. A 4.34% surge paired with more than 4x volume—straight up breaking through the upper edge of nearly 20 5m candles.
What’s even more interesting is the OI: in the 15m window, +1.12%, and in the 1h window, +2.52%—the notional increased by 1.17M. This isn’t short-covering; it’s new leveraged long positions entering the market. The abnormal percentile is 81.7%, and the overall notional change ranks #17 in the whole pool. Depth has been confirmed.
The only thing that makes me hesitate is that the actively executed trades are -0.1%, and the buy/sell ratio is exactly 1.00. The push did lift the price, but the active buy orders didn’t really follow through—it feels a bit like a passive push.
First, see if it can hold above the top of this range. If it can’t, then it’s a false breakout.
What’s even more interesting is the OI: in the 15m window, +1.12%, and in the 1h window, +2.52%—the notional increased by 1.17M. This isn’t short-covering; it’s new leveraged long positions entering the market. The abnormal percentile is 81.7%, and the overall notional change ranks #17 in the whole pool. Depth has been confirmed.
The only thing that makes me hesitate is that the actively executed trades are -0.1%, and the buy/sell ratio is exactly 1.00. The push did lift the price, but the active buy orders didn’t really follow through—it feels a bit like a passive push.
First, see if it can hold above the top of this range. If it can’t, then it’s a false breakout.
21

·
--
$KAT In these 15 minutes, the drop was pretty sharp. It fell straight by 3.58%, and the volume also swelled to 1.69x, with volatility (Z) at 1.75—this isn’t the kind of quiet, low-key grinding down.
What’s interesting is OI: the 15m contracts are up +2.75%, nominal change is +153K, but on the 1h dimension it’s actually -0.97%, -150K. That suggests short-term adds to positions, but the hourly timeframe doesn’t follow. This kind of structure, paired with the price decline, looks more like new leveraged shorts entering rather than old long holders closing.
Funding rate is -0.0273%, with the near-end percentile at 97%—this reading feels a bit extreme. With shorts crowded this much, the passive-to-active match is -2.0% and the buy/sell ratio is 0.96. There is selling pressure, but it’s not completely one-sided.
In the last 24h, turnover is 142.20M. The depth is sufficient. The abnormal pool percentile is 83.7%, rank #17, nominal change rank #36—somewhat high in abnormality but not the most eye-catching position.
My take: the short sentiment is being pushed too hard in the short term. At the 97% funding-rate percentile, chasing shorts further down isn’t great value; you should watch for a short squeeze. Of course, the premise is that price can first stabilize and stop falling. $KAT
$KAT In these 15 minutes, the drop was pretty sharp. It fell straight by 3.58%, and the volume also swelled to 1.69x, with volatility (Z) at 1.75—this isn’t the kind of quiet, low-key grinding down.
What’s interesting is OI: the 15m contracts are up +2.75%, nominal change is +153K, but on the 1h dimension it’s actually -0.97%, -150K. That suggests short-term adds to positions, but the hourly timeframe doesn’t follow. This kind of structure, paired with the price decline, looks more like new leveraged shorts entering rather than old long holders closing.
Funding rate is -0.0273%, with the near-end percentile at 97%—this reading feels a bit extreme. With shorts crowded this much, the passive-to-active match is -2.0% and the buy/sell ratio is 0.96. There is selling pressure, but it’s not completely one-sided.
In the last 24h, turnover is 142.20M. The depth is sufficient. The abnormal pool percentile is 83.7%, rank #17, nominal change rank #36—somewhat high in abnormality but not the most eye-catching position.
My take: the short sentiment is being pushed too hard in the short term. At the 97% funding-rate percentile, chasing shorts further down isn’t great value; you should watch for a short squeeze. Of course, the premise is that price can first stabilize and stop falling. $KAT
What’s interesting is OI: the 15m contracts are up +2.75%, nominal change is +153K, but on the 1h dimension it’s actually -0.97%, -150K. That suggests short-term adds to positions, but the hourly timeframe doesn’t follow. This kind of structure, paired with the price decline, looks more like new leveraged shorts entering rather than old long holders closing.
Funding rate is -0.0273%, with the near-end percentile at 97%—this reading feels a bit extreme. With shorts crowded this much, the passive-to-active match is -2.0% and the buy/sell ratio is 0.96. There is selling pressure, but it’s not completely one-sided.
In the last 24h, turnover is 142.20M. The depth is sufficient. The abnormal pool percentile is 83.7%, rank #17, nominal change rank #36—somewhat high in abnormality but not the most eye-catching position.
My take: the short sentiment is being pushed too hard in the short term. At the 97% funding-rate percentile, chasing shorts further down isn’t great value; you should watch for a short squeeze. Of course, the premise is that price can first stabilize and stop falling. $KAT
126

$XMR -4.2% over 24h: breakdown📉 Breakdown of the drop over 24h
Overall: the picture across timeframes is mixed — no single trend is visible; volume is low — the move may be unstable.
Worst momentum: $XMR -4.2% in 24h
Price: $502.45 (range $493.99–$525.33)
Momentum by timeframe: 1h -0.6%, 24h -4.2%, 7d -1.4%, 30d +20.9%
Position within the 24h range: 27% (in the middle of the daily range)
$XMR -4.2% over 24h: breakdown
📉 Breakdown of the drop over 24h
Overall: the picture across timeframes is mixed — no single trend is visible; volume is low — the move may be unstable.
Worst momentum: $XMR -4.2% in 24h
Price: $502.45 (range $493.99–$525.33)
Momentum by timeframe: 1h -0.6%, 24h -4.2%, 7d -1.4%, 30d +20.9%
Position within the 24h range: 27% (in the middle of the daily range)
Overall: the picture across timeframes is mixed — no single trend is visible; volume is low — the move may be unstable.
Worst momentum: $XMR -4.2% in 24h
Price: $502.45 (range $493.99–$525.33)
Momentum by timeframe: 1h -0.6%, 24h -4.2%, 7d -1.4%, 30d +20.9%
Position within the 24h range: 27% (in the middle of the daily range)
107


·
--
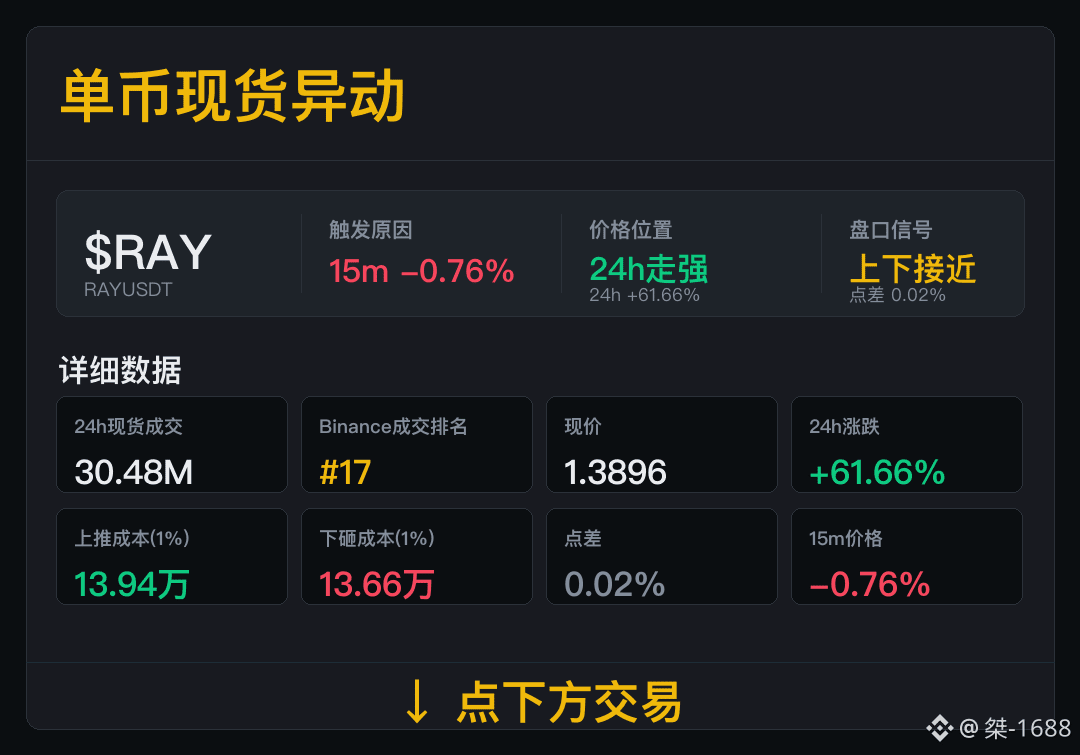
$RAY 15m anomaly has been triggered, and next we should watch spot participation.
Spot volume is 30.48M, with Binance ranking #17 in trading volume. Spot trading volume is the main clue for now, and we will continue tracking participation.
Current 24h change is +61.66%; spread is 0.02%, buy-up cost is 139.4K, and sell-down cost is 136.6K. Order book data shows the current trading difficulty, and the subsequent trend still needs to be confirmed by volume.
If trading remains active and the spread does not widen, the anomaly may continue.
$RAY 15m anomaly has been triggered, and next we should watch spot participation.
Spot volume is 30.48M, with Binance ranking #17 in trading volume. Spot trading volume is the main clue for now, and we will continue tracking participation.
Current 24h change is +61.66%; spread is 0.02%, buy-up cost is 139.4K, and sell-down cost is 136.6K. Order book data shows the current trading difficulty, and the subsequent trend still needs to be confirmed by volume.
If trading remains active and the spread does not widen, the anomaly may continue.
Spot volume is 30.48M, with Binance ranking #17 in trading volume. Spot trading volume is the main clue for now, and we will continue tracking participation.
Current 24h change is +61.66%; spread is 0.02%, buy-up cost is 139.4K, and sell-down cost is 136.6K. Order book data shows the current trading difficulty, and the subsequent trend still needs to be confirmed by volume.
If trading remains active and the spread does not widen, the anomaly may continue.
382
·
--
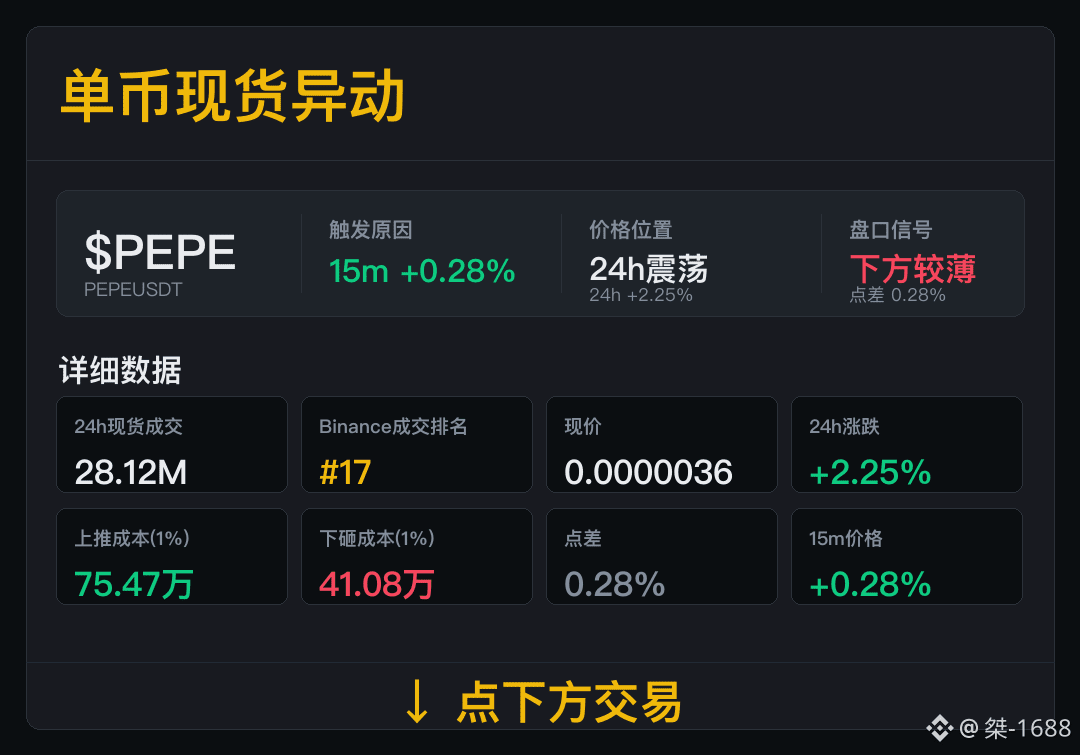
$PEPE has just moved out of a range in price, and spot volume needs further confirmation.
Spot turnover was 28.12M, with Binance ranking #17 in trading volume. As trading volume moves into the front ranks, the next leg of volume still needs further confirmation.
The current 24h change is +2.25%; spread is 0.28%, with push-up cost at 754.7K and dump cost at 410.8K. If subsequent trading does not show a clear weakening, short-term abnormal moves may continue.
The next round should focus on checking trading volume and spread. Continue tracking only after both remain stable at the same time.
$PEPE has just moved out of a range in price, and spot volume needs further confirmation.
Spot turnover was 28.12M, with Binance ranking #17 in trading volume. As trading volume moves into the front ranks, the next leg of volume still needs further confirmation.
The current 24h change is +2.25%; spread is 0.28%, with push-up cost at 754.7K and dump cost at 410.8K. If subsequent trading does not show a clear weakening, short-term abnormal moves may continue.
The next round should focus on checking trading volume and spread. Continue tracking only after both remain stable at the same time.
Spot turnover was 28.12M, with Binance ranking #17 in trading volume. As trading volume moves into the front ranks, the next leg of volume still needs further confirmation.
The current 24h change is +2.25%; spread is 0.28%, with push-up cost at 754.7K and dump cost at 410.8K. If subsequent trading does not show a clear weakening, short-term abnormal moves may continue.
The next round should focus on checking trading volume and spread. Continue tracking only after both remain stable at the same time.
1
397
·
--
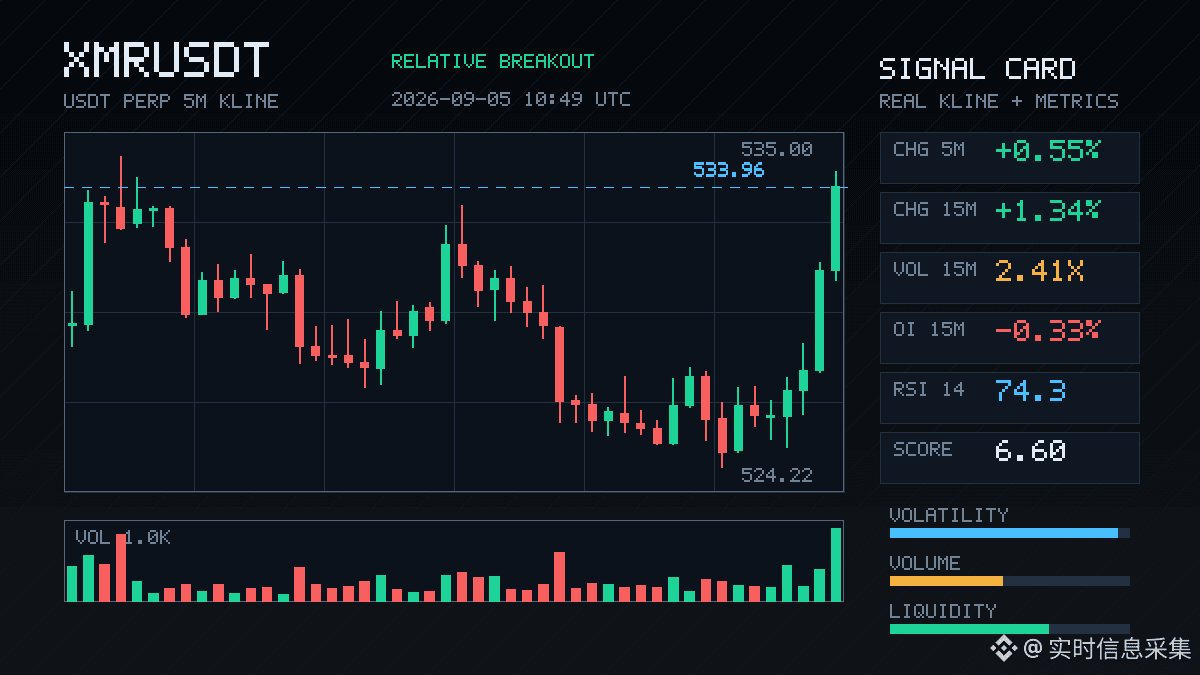
$XMR surged 1.34% in the past 15 minutes, with volume jumping to 2.41x and price breaking above the upper bound of the past 20 K-line range. Interestingly, open interest did not rise along with it but instead fell; OI was down 0.33% in 15 minutes — a classic short-covering move, not a real breakout driven by new long entries.
Aggressive trading imbalance was 25.7%, and the buy/sell ratio was 1.69, with buyers clearly in control. XMR ranked #22 in the abnormal pool today, #17 in nominal change, and its depth data was among the top in the market. At the very least, this is a case of both price and volume rising, but the current structure fits a short squeeze pulse more closely. A short-term follow can work, but be careful that momentum may fade after shorts finish covering at higher levels.
$XMR surged 1.34% in the past 15 minutes, with volume jumping to 2.41x and price breaking above the upper bound of the past 20 K-line range. Interestingly, open interest did not rise along with it but instead fell; OI was down 0.33% in 15 minutes — a classic short-covering move, not a real breakout driven by new long entries.
Aggressive trading imbalance was 25.7%, and the buy/sell ratio was 1.69, with buyers clearly in control. XMR ranked #22 in the abnormal pool today, #17 in nominal change, and its depth data was among the top in the market. At the very least, this is a case of both price and volume rising, but the current structure fits a short squeeze pulse more closely. A short-term follow can work, but be careful that momentum may fade after shorts finish covering at higher levels.
Aggressive trading imbalance was 25.7%, and the buy/sell ratio was 1.69, with buyers clearly in control. XMR ranked #22 in the abnormal pool today, #17 in nominal change, and its depth data was among the top in the market. At the very least, this is a case of both price and volume rising, but the current structure fits a short squeeze pulse more closely. A short-term follow can work, but be careful that momentum may fade after shorts finish covering at higher levels.
18

·
--
Bullish
See translation
60-SECOND ALPHA #17 | $MARSCOIN
$MARSCOIN just got a new Binance Futures market, and the reaction has been anything but quiet. The contract launched with up to 20x leverage, bringing fresh liquidity and plenty of speculation into the token.
But here’s the lesson: a new futures listing can create huge attention and volume, but it can also amplify both pumps and dumps. A listing is a catalyst, not a guarantee that price will keep going up.
Alpha: When a new contract launches, watch volatility and liquidity before following the hype.
{future}(MARSCOINUSDT)
60-SECOND ALPHA #17 | $MARSCOIN
$MARSCOIN just got a new Binance Futures market, and the reaction has been anything but quiet. The contract launched with up to 20x leverage, bringing fresh liquidity and plenty of speculation into the token.
But here’s the lesson: a new futures listing can create huge attention and volume, but it can also amplify both pumps and dumps. A listing is a catalyst, not a guarantee that price will keep going up.
Alpha: When a new contract launches, watch volatility and liquidity before following the hype.
$MARSCOIN just got a new Binance Futures market, and the reaction has been anything but quiet. The contract launched with up to 20x leverage, bringing fresh liquidity and plenty of speculation into the token.
But here’s the lesson: a new futures listing can create huge attention and volume, but it can also amplify both pumps and dumps. A listing is a catalyst, not a guarantee that price will keep going up.
Alpha: When a new contract launches, watch volatility and liquidity before following the hype.
83

·
--
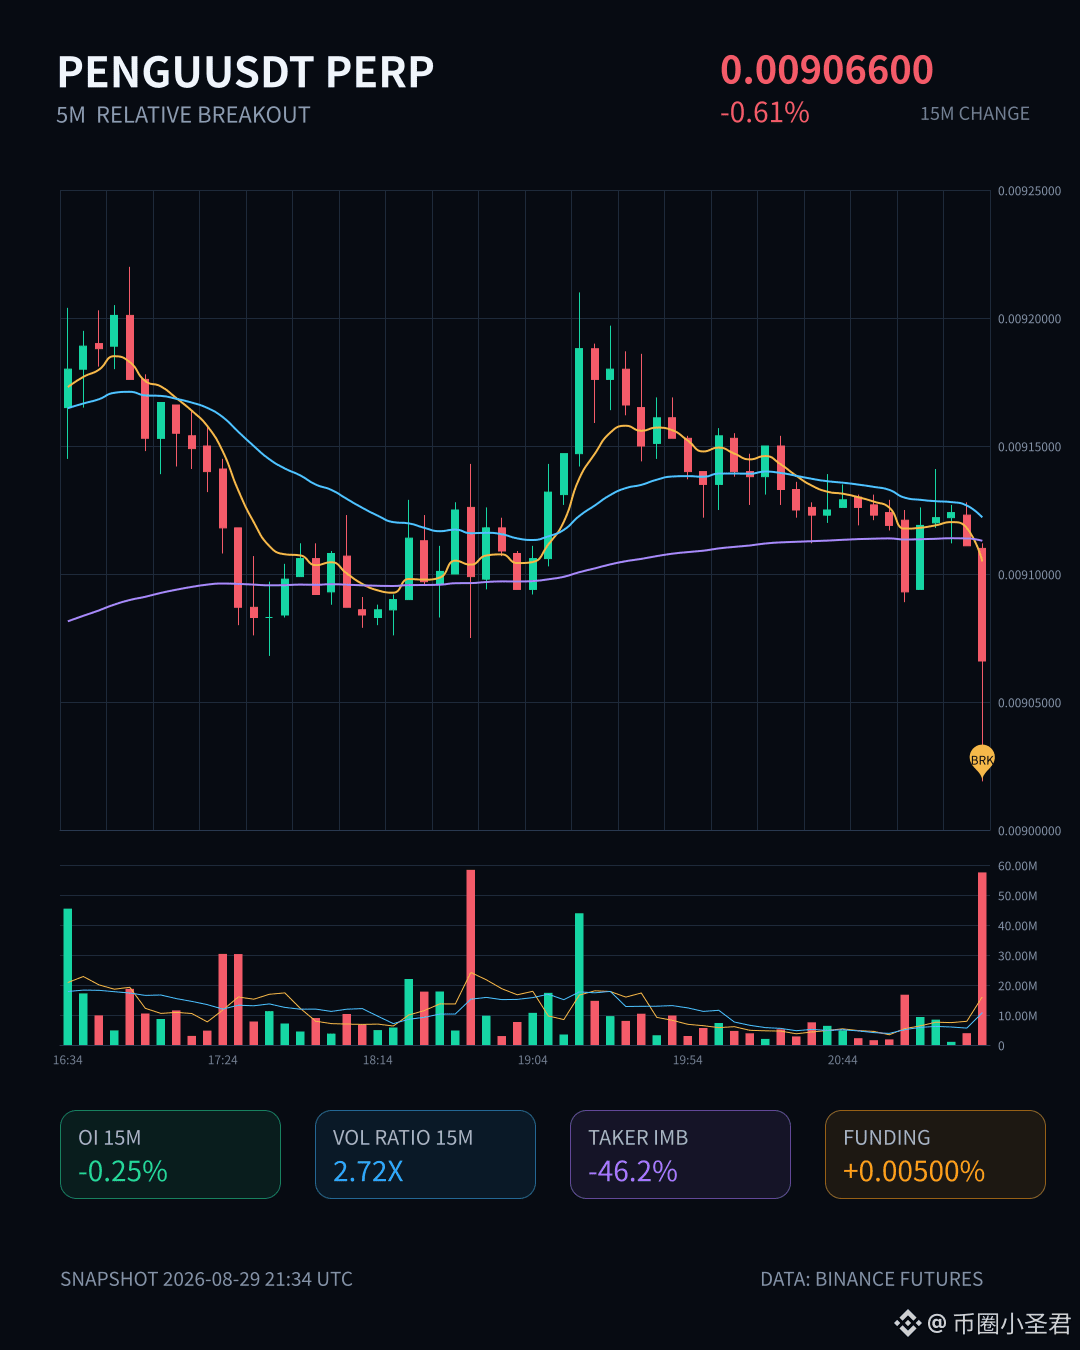
$PENGU This drop is kind of interesting.
On the 15-minute timeframe, it fell 0.61% while volume surged to 2.72x, but open interest didn’t move much—contracts on the 15-minute period only dropped 0.25%, with nominal change of -246K. This isn’t a traditional long-and-short double liquidation or something; it’s more like longs are exiting on their own—stop-losses getting triggered and positions being cut.
What’s especially interesting is that the closing price directly broke below the lower bound of the range of the past 20 five-minute candlesticks, plus the aggressive trade difference is -46.2% and the buy/sell ratio is 0.37—bears are pressing down very firmly.
I checked the whole-pool data: the abnormality level ranks at #12, nominal change at #17, and the funding rate is still in the higher percentile recently. At this point, emotionally it feels like a cooldown after being overheated.
The short-term trend looks a bit weak. Let’s first see if it can hold/support itself—don’t rush to buy the dip.
$PENGU This drop is kind of interesting.
On the 15-minute timeframe, it fell 0.61% while volume surged to 2.72x, but open interest didn’t move much—contracts on the 15-minute period only dropped 0.25%, with nominal change of -246K. This isn’t a traditional long-and-short double liquidation or something; it’s more like longs are exiting on their own—stop-losses getting triggered and positions being cut.
What’s especially interesting is that the closing price directly broke below the lower bound of the range of the past 20 five-minute candlesticks, plus the aggressive trade difference is -46.2% and the buy/sell ratio is 0.37—bears are pressing down very firmly.
I checked the whole-pool data: the abnormality level ranks at #12, nominal change at #17, and the funding rate is still in the higher percentile recently. At this point, emotionally it feels like a cooldown after being overheated.
The short-term trend looks a bit weak. Let’s first see if it can hold/support itself—don’t rush to buy the dip.
On the 15-minute timeframe, it fell 0.61% while volume surged to 2.72x, but open interest didn’t move much—contracts on the 15-minute period only dropped 0.25%, with nominal change of -246K. This isn’t a traditional long-and-short double liquidation or something; it’s more like longs are exiting on their own—stop-losses getting triggered and positions being cut.
What’s especially interesting is that the closing price directly broke below the lower bound of the range of the past 20 five-minute candlesticks, plus the aggressive trade difference is -46.2% and the buy/sell ratio is 0.37—bears are pressing down very firmly.
I checked the whole-pool data: the abnormality level ranks at #12, nominal change at #17, and the funding rate is still in the higher percentile recently. At this point, emotionally it feels like a cooldown after being overheated.
The short-term trend looks a bit weak. Let’s first see if it can hold/support itself—don’t rush to buy the dip.
35

·
--
I originally planned to shower early and go to sleep, but I ended up leaning on the couch and scrolling through the two leaderboard rankings. Then my hand hovered over $META .
This stock is one I’m a bit bullish on—not one of those where you just glance at the percent gain and immediately get all fired up. The more I look, the more it feels like people are repeatedly accumulating at this level.
In the past 24 hours it’s only up +1.05%, with the current price at $578.7—nothing too explosive.
But during the day it swung between $589.22 and $571.23. The movement in between wasn’t small. Still, it managed to hold in the upper-to-mid range at the end. I’ll treat that as decent consolidation—not something it pops and then quickly falls apart.
There’s another point that really suits my taste.
Trading volume is already at $43.55M USDT. It ranks #17 on the US stock perpetuals leaderboard by growth, and it’s also #22 on the volume leaderboard. Yet the funding rate is still +0.0000%. What does that feel like? It’s like everyone’s watching it, but the emotional heat hasn’t risen to a boil. The car isn’t packed to the point where you’re cramped.
In my trading, I’m most afraid of stocks where everyone is shouting the same direction at the top of their lungs. Getting in is easy, but getting out is hard.
Right now, $META feels like it has the heat, but the crowd level hasn’t reached the point where it makes me uneasy.
Now, talking about the company side.
From what I understand, $META is still broadly aligned with the direction of global high-traffic platforms and the advertising ecosystem. The biggest advantage of a company like this isn’t the kind of hotspot that lasts just a couple of days—it’s that it naturally has the ability to continuously monetize user attention. As long as this foundation doesn’t break, when a new story comes out, the market is willing to give it attention first.
In the US stock market, the “big platform + AI imagination” theme is still being priced at a premium.
It’s not that you should mindlessly rush in just because “AI” is mentioned. It’s that these companies themselves have traffic, scenarios, and cash-generating machines. When real new features land, they’re more likely to capture valuation sentiment than companies that just talk concepts. That’s also why I’m willing to put it on my ongoing watchlist.
Of course, this stock also has some awkward spots.
It’s no longer the kind of cheap, unnoticed corner stock. Once the market mood turns and the big index sentiment swings back, or when the market starts complaining that big caps are too expensive, $META could get pressed down along the way. Also, there are 46,276 shares of positions sitting there—meaning people watching it aren’t few. It’s normal for the short-term price action to whip back and forth.
If it were me, I’d rather accept a slower grind upward than a chart that suddenly accelerates.
If it rips higher quickly, it actually makes me uncomfortable. If it steadies and moves, I’ll have more patience. If I lose money, don’t cue me; if I make money, please treat me to a cup of coffee.
$META #USStocks
I originally planned to shower early and go to sleep, but I ended up leaning on the couch and scrolling through the two leaderboard rankings. Then my hand hovered over $META .
This stock is one I’m a bit bullish on—not one of those where you just glance at the percent gain and immediately get all fired up. The more I look, the more it feels like people are repeatedly accumulating at this level.
In the past 24 hours it’s only up +1.05%, with the current price at $578.7—nothing too explosive.
But during the day it swung between $589.22 and $571.23. The movement in between wasn’t small. Still, it managed to hold in the upper-to-mid range at the end. I’ll treat that as decent consolidation—not something it pops and then quickly falls apart.
There’s another point that really suits my taste.
Trading volume is already at $43.55M USDT. It ranks #17 on the US stock perpetuals leaderboard by growth, and it’s also #22 on the volume leaderboard. Yet the funding rate is still +0.0000%. What does that feel like? It’s like everyone’s watching it, but the emotional heat hasn’t risen to a boil. The car isn’t packed to the point where you’re cramped.
In my trading, I’m most afraid of stocks where everyone is shouting the same direction at the top of their lungs. Getting in is easy, but getting out is hard.
Right now, $META feels like it has the heat, but the crowd level hasn’t reached the point where it makes me uneasy.
Now, talking about the company side.
From what I understand, $META is still broadly aligned with the direction of global high-traffic platforms and the advertising ecosystem. The biggest advantage of a company like this isn’t the kind of hotspot that lasts just a couple of days—it’s that it naturally has the ability to continuously monetize user attention. As long as this foundation doesn’t break, when a new story comes out, the market is willing to give it attention first.
In the US stock market, the “big platform + AI imagination” theme is still being priced at a premium.
It’s not that you should mindlessly rush in just because “AI” is mentioned. It’s that these companies themselves have traffic, scenarios, and cash-generating machines. When real new features land, they’re more likely to capture valuation sentiment than companies that just talk concepts. That’s also why I’m willing to put it on my ongoing watchlist.
Of course, this stock also has some awkward spots.
It’s no longer the kind of cheap, unnoticed corner stock. Once the market mood turns and the big index sentiment swings back, or when the market starts complaining that big caps are too expensive, $META could get pressed down along the way. Also, there are 46,276 shares of positions sitting there—meaning people watching it aren’t few. It’s normal for the short-term price action to whip back and forth.
If it were me, I’d rather accept a slower grind upward than a chart that suddenly accelerates.
If it rips higher quickly, it actually makes me uncomfortable. If it steadies and moves, I’ll have more patience. If I lose money, don’t cue me; if I make money, please treat me to a cup of coffee.
$META #USStocks
This stock is one I’m a bit bullish on—not one of those where you just glance at the percent gain and immediately get all fired up. The more I look, the more it feels like people are repeatedly accumulating at this level.
In the past 24 hours it’s only up +1.05%, with the current price at $578.7—nothing too explosive.
But during the day it swung between $589.22 and $571.23. The movement in between wasn’t small. Still, it managed to hold in the upper-to-mid range at the end. I’ll treat that as decent consolidation—not something it pops and then quickly falls apart.
There’s another point that really suits my taste.
Trading volume is already at $43.55M USDT. It ranks #17 on the US stock perpetuals leaderboard by growth, and it’s also #22 on the volume leaderboard. Yet the funding rate is still +0.0000%. What does that feel like? It’s like everyone’s watching it, but the emotional heat hasn’t risen to a boil. The car isn’t packed to the point where you’re cramped.
In my trading, I’m most afraid of stocks where everyone is shouting the same direction at the top of their lungs. Getting in is easy, but getting out is hard.
Right now, $META feels like it has the heat, but the crowd level hasn’t reached the point where it makes me uneasy.
Now, talking about the company side.
From what I understand, $META is still broadly aligned with the direction of global high-traffic platforms and the advertising ecosystem. The biggest advantage of a company like this isn’t the kind of hotspot that lasts just a couple of days—it’s that it naturally has the ability to continuously monetize user attention. As long as this foundation doesn’t break, when a new story comes out, the market is willing to give it attention first.
In the US stock market, the “big platform + AI imagination” theme is still being priced at a premium.
It’s not that you should mindlessly rush in just because “AI” is mentioned. It’s that these companies themselves have traffic, scenarios, and cash-generating machines. When real new features land, they’re more likely to capture valuation sentiment than companies that just talk concepts. That’s also why I’m willing to put it on my ongoing watchlist.
Of course, this stock also has some awkward spots.
It’s no longer the kind of cheap, unnoticed corner stock. Once the market mood turns and the big index sentiment swings back, or when the market starts complaining that big caps are too expensive, $META could get pressed down along the way. Also, there are 46,276 shares of positions sitting there—meaning people watching it aren’t few. It’s normal for the short-term price action to whip back and forth.
If it were me, I’d rather accept a slower grind upward than a chart that suddenly accelerates.
If it rips higher quickly, it actually makes me uncomfortable. If it steadies and moves, I’ll have more patience. If I lose money, don’t cue me; if I make money, please treat me to a cup of coffee.
$META #USStocks
6
·
--
$GOOGL The thing that piqued my interest isn’t that it’s up +1.28%—it’s that the funding rate is still +0.0000%.
That feels really off.
The price is $346.56. In the last 24 hours, it touched a high of $349.16 and a low of $340.52. Trading volume is already $72.60M USDT, and open interest is still sitting at 186,476 contracts.
On paper, with this showing up at #14 on the US stock perpetuals gainers list and #17 on the volume list, long sentiment should be a bit hotter.
But here the rate hasn’t been lifted, which suggests the “chasing” fire hasn’t turned into a one-sided blaze.
People like me—who’ve been burned trading contracts—actually tend to take a closer look at setups like this.
If a stock is too hot, I generally don’t like touching it. When everyone crowds into the same direction, it’s easiest to get whipped back and forth.
With $GOOGL in particular, the situation feels more like someone is trading seriously, but the sentiment hasn’t spun out of control.
Also, the company itself: even if you don’t go digging into financial reports, common sense tells you it isn’t the kind of stock that relies on a single story to justify its valuation.
From what I understand, it’s positioned around a few big areas: internet entry points, advertising, cloud, and AI.
The main reason I’m more willing to be bullish on it is that it has both an internet traffic/inflow entry and the ability to turn new technology into a business.
A lot of companies talk about AI. But the real opportunity is whether they can actually plug AI into their existing products and gradually monetize it—which, in practice, often isn’t as common as people think.
$GOOGL is the kind of name you usually find annoying, but once the market starts repricing big platforms, it’s a label that’s hard to get around.
There’s another detail I’ll be watching closely.
In the perpetuals market, there’s volume and open interest, but the funding rate is flat—this indicates the “heat” isn’t from a stampede chasing it.
If later the basis stays stable and the funding rate doesn’t suddenly spike too high, personally I’d be more willing to stand on the bullish side.
I’m not pretending it’s risk-free—this trade also has variables.
Big-platform companies are most afraid of two things: first, the market thinks they’re moving too slowly; second, the new narrative doesn’t land as fast as expected.
As long as the external style rotates back to high-volatility small caps, a big heavyweight like $GOOGL can easily start to look less exciting.
But if you ask me which “old name” in Binance’s TradFi space I’m willing to keep watching—and even to take another look when it dips—among the US stocks, I’d put $GOOGL first.
That’s my take. Your money is your call. $GOOGL #USStocks
$GOOGL The thing that piqued my interest isn’t that it’s up +1.28%—it’s that the funding rate is still +0.0000%.
That feels really off.
The price is $346.56. In the last 24 hours, it touched a high of $349.16 and a low of $340.52. Trading volume is already $72.60M USDT, and open interest is still sitting at 186,476 contracts.
On paper, with this showing up at #14 on the US stock perpetuals gainers list and #17 on the volume list, long sentiment should be a bit hotter.
But here the rate hasn’t been lifted, which suggests the “chasing” fire hasn’t turned into a one-sided blaze.
People like me—who’ve been burned trading contracts—actually tend to take a closer look at setups like this.
If a stock is too hot, I generally don’t like touching it. When everyone crowds into the same direction, it’s easiest to get whipped back and forth.
With $GOOGL in particular, the situation feels more like someone is trading seriously, but the sentiment hasn’t spun out of control.
Also, the company itself: even if you don’t go digging into financial reports, common sense tells you it isn’t the kind of stock that relies on a single story to justify its valuation.
From what I understand, it’s positioned around a few big areas: internet entry points, advertising, cloud, and AI.
The main reason I’m more willing to be bullish on it is that it has both an internet traffic/inflow entry and the ability to turn new technology into a business.
A lot of companies talk about AI. But the real opportunity is whether they can actually plug AI into their existing products and gradually monetize it—which, in practice, often isn’t as common as people think.
$GOOGL is the kind of name you usually find annoying, but once the market starts repricing big platforms, it’s a label that’s hard to get around.
There’s another detail I’ll be watching closely.
In the perpetuals market, there’s volume and open interest, but the funding rate is flat—this indicates the “heat” isn’t from a stampede chasing it.
If later the basis stays stable and the funding rate doesn’t suddenly spike too high, personally I’d be more willing to stand on the bullish side.
I’m not pretending it’s risk-free—this trade also has variables.
Big-platform companies are most afraid of two things: first, the market thinks they’re moving too slowly; second, the new narrative doesn’t land as fast as expected.
As long as the external style rotates back to high-volatility small caps, a big heavyweight like $GOOGL can easily start to look less exciting.
But if you ask me which “old name” in Binance’s TradFi space I’m willing to keep watching—and even to take another look when it dips—among the US stocks, I’d put $GOOGL first.
That’s my take. Your money is your call. $GOOGL #USStocks
That feels really off.
The price is $346.56. In the last 24 hours, it touched a high of $349.16 and a low of $340.52. Trading volume is already $72.60M USDT, and open interest is still sitting at 186,476 contracts.
On paper, with this showing up at #14 on the US stock perpetuals gainers list and #17 on the volume list, long sentiment should be a bit hotter.
But here the rate hasn’t been lifted, which suggests the “chasing” fire hasn’t turned into a one-sided blaze.
People like me—who’ve been burned trading contracts—actually tend to take a closer look at setups like this.
If a stock is too hot, I generally don’t like touching it. When everyone crowds into the same direction, it’s easiest to get whipped back and forth.
With $GOOGL in particular, the situation feels more like someone is trading seriously, but the sentiment hasn’t spun out of control.
Also, the company itself: even if you don’t go digging into financial reports, common sense tells you it isn’t the kind of stock that relies on a single story to justify its valuation.
From what I understand, it’s positioned around a few big areas: internet entry points, advertising, cloud, and AI.
The main reason I’m more willing to be bullish on it is that it has both an internet traffic/inflow entry and the ability to turn new technology into a business.
A lot of companies talk about AI. But the real opportunity is whether they can actually plug AI into their existing products and gradually monetize it—which, in practice, often isn’t as common as people think.
$GOOGL is the kind of name you usually find annoying, but once the market starts repricing big platforms, it’s a label that’s hard to get around.
There’s another detail I’ll be watching closely.
In the perpetuals market, there’s volume and open interest, but the funding rate is flat—this indicates the “heat” isn’t from a stampede chasing it.
If later the basis stays stable and the funding rate doesn’t suddenly spike too high, personally I’d be more willing to stand on the bullish side.
I’m not pretending it’s risk-free—this trade also has variables.
Big-platform companies are most afraid of two things: first, the market thinks they’re moving too slowly; second, the new narrative doesn’t land as fast as expected.
As long as the external style rotates back to high-volatility small caps, a big heavyweight like $GOOGL can easily start to look less exciting.
But if you ask me which “old name” in Binance’s TradFi space I’m willing to keep watching—and even to take another look when it dips—among the US stocks, I’d put $GOOGL first.
That’s my take. Your money is your call. $GOOGL #USStocks
14

·
--
My assessment of $TSLA is pretty straightforward: it’s not just a “car” theme. In many cases, the market uses it as a barometer for growth sentiment.
Honestly, once this kind of stock comes back into the most actively traded circle, the attention itself becomes a catalyst.
Today, on Binance’s US stocks perpetuals, it ranks #11 by percentage gain and #17 by trading value. I’ll take that as a fairly solid signal.
It’s not the kind of sluggish rise with nobody watching—it’s more like the capital is willing to keep coming back and forth.
When I saw it on my phone on the subway on the way home, I almost missed my stop. My first reaction wasn’t, “Up 2.79%—that’s strong.” Instead, it was that throughout the day it climbed from $345.56 all the way to $357.42, with the price basically holding near the highs into the close. That kind of chart behavior really says something about sentiment.
I’m bullish, and here’s another reason: there are so many expectations baked into it.
From my understanding, the market doesn’t look at it as just a single sales number or a single line of business. It’s also asking whether it can keep staying at the forefront of the narratives around new energy, smart technologies, and manufacturing efficiency.
That’s both the most troublesome and the most fascinating part of companies like this—you can’t easily box them in with a single static label.
As long as the broader market is willing to give growth stocks valuation room, it often becomes a name that’s traded repeatedly.
Looking at the finer details on the board, I also don’t think it’s overheated to the point that makes me uncomfortable.
The funding rate is only +0.0068%, which suggests bullish sentiment is there, but it hasn’t reached the level where, at a glance, you’d want to hide.
There is some momentum, but it’s not outrageous. That kind of state often allows the trend to continue for a bit longer.
Of course, the downside is also pretty clear: when expectations are packed to the brim, any slight failure to meet them can easily amplify price volatility.
And with highly watched names like this, if things go smoothly they move very smoothly—but if they go the wrong way, it can be really exhausting.
Last night, my trader friend—my girlfriend who trades—also told me that what scares investors in this category of stocks most isn’t simply being wrong about the direction. It’s that even when you’re right about the big trend, you can still get shaken out in the middle.
So my stance is generally bullish, but I don’t want to chase the emotion when things get overly excited.
If I’m going to look, I’d rather treat it as a strong-asset to observe. As long as the market is still willing to price in the growth-story premium, $TSLA probably won’t easily fall behind.
These are just my own thoughts, not advice. $TSLA #US stocks
My assessment of $TSLA is pretty straightforward: it’s not just a “car” theme. In many cases, the market uses it as a barometer for growth sentiment.
Honestly, once this kind of stock comes back into the most actively traded circle, the attention itself becomes a catalyst.
Today, on Binance’s US stocks perpetuals, it ranks #11 by percentage gain and #17 by trading value. I’ll take that as a fairly solid signal.
It’s not the kind of sluggish rise with nobody watching—it’s more like the capital is willing to keep coming back and forth.
When I saw it on my phone on the subway on the way home, I almost missed my stop. My first reaction wasn’t, “Up 2.79%—that’s strong.” Instead, it was that throughout the day it climbed from $345.56 all the way to $357.42, with the price basically holding near the highs into the close. That kind of chart behavior really says something about sentiment.
I’m bullish, and here’s another reason: there are so many expectations baked into it.
From my understanding, the market doesn’t look at it as just a single sales number or a single line of business. It’s also asking whether it can keep staying at the forefront of the narratives around new energy, smart technologies, and manufacturing efficiency.
That’s both the most troublesome and the most fascinating part of companies like this—you can’t easily box them in with a single static label.
As long as the broader market is willing to give growth stocks valuation room, it often becomes a name that’s traded repeatedly.
Looking at the finer details on the board, I also don’t think it’s overheated to the point that makes me uncomfortable.
The funding rate is only +0.0068%, which suggests bullish sentiment is there, but it hasn’t reached the level where, at a glance, you’d want to hide.
There is some momentum, but it’s not outrageous. That kind of state often allows the trend to continue for a bit longer.
Of course, the downside is also pretty clear: when expectations are packed to the brim, any slight failure to meet them can easily amplify price volatility.
And with highly watched names like this, if things go smoothly they move very smoothly—but if they go the wrong way, it can be really exhausting.
Last night, my trader friend—my girlfriend who trades—also told me that what scares investors in this category of stocks most isn’t simply being wrong about the direction. It’s that even when you’re right about the big trend, you can still get shaken out in the middle.
So my stance is generally bullish, but I don’t want to chase the emotion when things get overly excited.
If I’m going to look, I’d rather treat it as a strong-asset to observe. As long as the market is still willing to price in the growth-story premium, $TSLA probably won’t easily fall behind.
These are just my own thoughts, not advice. $TSLA #US stocks
Honestly, once this kind of stock comes back into the most actively traded circle, the attention itself becomes a catalyst.
Today, on Binance’s US stocks perpetuals, it ranks #11 by percentage gain and #17 by trading value. I’ll take that as a fairly solid signal.
It’s not the kind of sluggish rise with nobody watching—it’s more like the capital is willing to keep coming back and forth.
When I saw it on my phone on the subway on the way home, I almost missed my stop. My first reaction wasn’t, “Up 2.79%—that’s strong.” Instead, it was that throughout the day it climbed from $345.56 all the way to $357.42, with the price basically holding near the highs into the close. That kind of chart behavior really says something about sentiment.
I’m bullish, and here’s another reason: there are so many expectations baked into it.
From my understanding, the market doesn’t look at it as just a single sales number or a single line of business. It’s also asking whether it can keep staying at the forefront of the narratives around new energy, smart technologies, and manufacturing efficiency.
That’s both the most troublesome and the most fascinating part of companies like this—you can’t easily box them in with a single static label.
As long as the broader market is willing to give growth stocks valuation room, it often becomes a name that’s traded repeatedly.
Looking at the finer details on the board, I also don’t think it’s overheated to the point that makes me uncomfortable.
The funding rate is only +0.0068%, which suggests bullish sentiment is there, but it hasn’t reached the level where, at a glance, you’d want to hide.
There is some momentum, but it’s not outrageous. That kind of state often allows the trend to continue for a bit longer.
Of course, the downside is also pretty clear: when expectations are packed to the brim, any slight failure to meet them can easily amplify price volatility.
And with highly watched names like this, if things go smoothly they move very smoothly—but if they go the wrong way, it can be really exhausting.
Last night, my trader friend—my girlfriend who trades—also told me that what scares investors in this category of stocks most isn’t simply being wrong about the direction. It’s that even when you’re right about the big trend, you can still get shaken out in the middle.
So my stance is generally bullish, but I don’t want to chase the emotion when things get overly excited.
If I’m going to look, I’d rather treat it as a strong-asset to observe. As long as the market is still willing to price in the growth-story premium, $TSLA probably won’t easily fall behind.
These are just my own thoughts, not advice. $TSLA #US stocks
43

·
--
91 Volatility AnalysisKeep an eye on the VELVET alert—down 67% in 24h, falling from $0.91 to $0.1756. This kind of move would definitely set off a frenzy in the group. First the conclusion: this is not the time to buy the dip, but there may be some meat in a short-term rebound—how you play it is the key.
Start with volume and price. On the 5m chart it’s up +9.4%, but on the 1h chart it’s still -5.8%. Volume has expanded to 6.1x, while OI is up +15.8%. This combination is interesting—short-term funds are stepping in to bet on a rebound, but mid-term sell pressure hasn’t been digested yet. Increased positions suggest both sides are adding to their bets, meaning the disagreement is massive.
Look at the position—prices are already down 80%. This level really does seem prone to a technical rebound. But on the social sentiment side, retail longs are 2.4 times bigger than shorts; on X, KOLs basically have no presence. BSQ heat has dropped to #17—retail is bargain-hunting while smart money is waiting. This is definitely not a good signal. In the discussion, some people call for going long at $0.285–0.325, targeting $0.55, while others call for shorting at $0.174–0.21, targeting $0.10. Long and short views are completely opposite, which means the market hasn’t formed a consensus.
91 Volatility Analysis
Keep an eye on the VELVET alert—down 67% in 24h, falling from $0.91 to $0.1756. This kind of move would definitely set off a frenzy in the group. First the conclusion: this is not the time to buy the dip, but there may be some meat in a short-term rebound—how you play it is the key.
Start with volume and price. On the 5m chart it’s up +9.4%, but on the 1h chart it’s still -5.8%. Volume has expanded to 6.1x, while OI is up +15.8%. This combination is interesting—short-term funds are stepping in to bet on a rebound, but mid-term sell pressure hasn’t been digested yet. Increased positions suggest both sides are adding to their bets, meaning the disagreement is massive.
Look at the position—prices are already down 80%. This level really does seem prone to a technical rebound. But on the social sentiment side, retail longs are 2.4 times bigger than shorts; on X, KOLs basically have no presence. BSQ heat has dropped to #17—retail is bargain-hunting while smart money is waiting. This is definitely not a good signal. In the discussion, some people call for going long at $0.285–0.325, targeting $0.55, while others call for shorting at $0.174–0.21, targeting $0.10. Long and short views are completely opposite, which means the market hasn’t formed a consensus.
Start with volume and price. On the 5m chart it’s up +9.4%, but on the 1h chart it’s still -5.8%. Volume has expanded to 6.1x, while OI is up +15.8%. This combination is interesting—short-term funds are stepping in to bet on a rebound, but mid-term sell pressure hasn’t been digested yet. Increased positions suggest both sides are adding to their bets, meaning the disagreement is massive.
Look at the position—prices are already down 80%. This level really does seem prone to a technical rebound. But on the social sentiment side, retail longs are 2.4 times bigger than shorts; on X, KOLs basically have no presence. BSQ heat has dropped to #17—retail is bargain-hunting while smart money is waiting. This is definitely not a good signal. In the discussion, some people call for going long at $0.285–0.325, targeting $0.55, while others call for shorting at $0.174–0.21, targeting $0.10. Long and short views are completely opposite, which means the market hasn’t formed a consensus.
1
385
·
--
Two minutes before the subway reached its stop, I leaned against the door and flicked my eyes at Binance’s TradFi rankings. My hand hovered over $COIN.
I’m biased toward looking at it a bit more, and not just because it’s up today.
$COIN is currently trading at $187.69. Over the past 24 hours, it went from $178.54 up to a high of $192.59, closing up +4.66%. The way it moved has a certain flavor to it: it wasn’t one of those lines where it spikes and then nobody’s there to take the other side. At least the capital is willing to keep folding in and out of it repeatedly.
What’s even more interesting is the contracts side.
In the last 24 hours, trading volume was $88.74M, open interest is 72,734 contracts, and the funding rate is still -0.0907%. The price is rising, but the funding rate remains negative—meaning the people who are willing to keep pressing it down haven’t fully given up yet. In a situation like this, I usually don’t jump to the idea of weakness first. Instead, I tend to think there’s still more room for people to come back and cover later.
When I look at $COIN, there’s a very straightforward logic.
As long as the crypto market is still moving toward mainstream capital, platforms like trading, custody, and regulated entry points are hard to bypass. Once the coin price becomes active and the sentiment catches fire, these kinds of companies naturally sit right next to the flow of volume and fees. You might not buy their stock every day, but when the market heats up, a lot of money will think of them first.
There’s another point I care about.
It can rank #4 on Binance’s U.S. stock perpetual growth leaderboard, and it’s also entered the volume leaderboard at #17. That suggests it’s not a niche ticket just quietly crawling upward on its own. Someone is watching it, and someone is willing to open positions. The attention itself makes it easier for volatility to stay elevated. If you’ve been trading for a few years, you know: many stocks don’t suddenly change because the fundamentals have shifted. Instead, they get repriced first by more capital.
Of course, $COIN isn’t something you slam into with your eyes closed.
It’s deeply tied to crypto market sentiment. If $BTC suddenly turns around, this one probably won’t be able to hard-carry independently. Also, today it has already pulled up a lot from the lows. I personally wouldn’t chase it hard at the hottest moment of sentiment.
But if you ask me whether this position is worth keeping on the watchlist, my answer is yes.
If it were me, I’d lean toward waiting for it to pull back before looking for an opportunity— I wouldn’t easily stand on the short side. $COIN
#U.S. stocks
I might be wrong, and this is just my judgment.
Two minutes before the subway reached its stop, I leaned against the door and flicked my eyes at Binance’s TradFi rankings. My hand hovered over $COIN .
I’m biased toward looking at it a bit more, and not just because it’s up today.
$COIN is currently trading at $187.69. Over the past 24 hours, it went from $178.54 up to a high of $192.59, closing up +4.66%. The way it moved has a certain flavor to it: it wasn’t one of those lines where it spikes and then nobody’s there to take the other side. At least the capital is willing to keep folding in and out of it repeatedly.
What’s even more interesting is the contracts side.
In the last 24 hours, trading volume was $88.74M, open interest is 72,734 contracts, and the funding rate is still -0.0907%. The price is rising, but the funding rate remains negative—meaning the people who are willing to keep pressing it down haven’t fully given up yet. In a situation like this, I usually don’t jump to the idea of weakness first. Instead, I tend to think there’s still more room for people to come back and cover later.
When I look at $COIN , there’s a very straightforward logic.
As long as the crypto market is still moving toward mainstream capital, platforms like trading, custody, and regulated entry points are hard to bypass. Once the coin price becomes active and the sentiment catches fire, these kinds of companies naturally sit right next to the flow of volume and fees. You might not buy their stock every day, but when the market heats up, a lot of money will think of them first.
There’s another point I care about.
It can rank #4 on Binance’s U.S. stock perpetual growth leaderboard, and it’s also entered the volume leaderboard at #17. That suggests it’s not a niche ticket just quietly crawling upward on its own. Someone is watching it, and someone is willing to open positions. The attention itself makes it easier for volatility to stay elevated. If you’ve been trading for a few years, you know: many stocks don’t suddenly change because the fundamentals have shifted. Instead, they get repriced first by more capital.
Of course, $COIN isn’t something you slam into with your eyes closed.
It’s deeply tied to crypto market sentiment. If $BTC suddenly turns around, this one probably won’t be able to hard-carry independently. Also, today it has already pulled up a lot from the lows. I personally wouldn’t chase it hard at the hottest moment of sentiment.
But if you ask me whether this position is worth keeping on the watchlist, my answer is yes.
If it were me, I’d lean toward waiting for it to pull back before looking for an opportunity— I wouldn’t easily stand on the short side. $COIN
#U.S. stocks
I might be wrong, and this is just my judgment.
I’m biased toward looking at it a bit more, and not just because it’s up today.
$COIN is currently trading at $187.69. Over the past 24 hours, it went from $178.54 up to a high of $192.59, closing up +4.66%. The way it moved has a certain flavor to it: it wasn’t one of those lines where it spikes and then nobody’s there to take the other side. At least the capital is willing to keep folding in and out of it repeatedly.
What’s even more interesting is the contracts side.
In the last 24 hours, trading volume was $88.74M, open interest is 72,734 contracts, and the funding rate is still -0.0907%. The price is rising, but the funding rate remains negative—meaning the people who are willing to keep pressing it down haven’t fully given up yet. In a situation like this, I usually don’t jump to the idea of weakness first. Instead, I tend to think there’s still more room for people to come back and cover later.
When I look at $COIN , there’s a very straightforward logic.
As long as the crypto market is still moving toward mainstream capital, platforms like trading, custody, and regulated entry points are hard to bypass. Once the coin price becomes active and the sentiment catches fire, these kinds of companies naturally sit right next to the flow of volume and fees. You might not buy their stock every day, but when the market heats up, a lot of money will think of them first.
There’s another point I care about.
It can rank #4 on Binance’s U.S. stock perpetual growth leaderboard, and it’s also entered the volume leaderboard at #17. That suggests it’s not a niche ticket just quietly crawling upward on its own. Someone is watching it, and someone is willing to open positions. The attention itself makes it easier for volatility to stay elevated. If you’ve been trading for a few years, you know: many stocks don’t suddenly change because the fundamentals have shifted. Instead, they get repriced first by more capital.
Of course, $COIN isn’t something you slam into with your eyes closed.
It’s deeply tied to crypto market sentiment. If $BTC suddenly turns around, this one probably won’t be able to hard-carry independently. Also, today it has already pulled up a lot from the lows. I personally wouldn’t chase it hard at the hottest moment of sentiment.
But if you ask me whether this position is worth keeping on the watchlist, my answer is yes.
If it were me, I’d lean toward waiting for it to pull back before looking for an opportunity— I wouldn’t easily stand on the short side. $COIN
#U.S. stocks
I might be wrong, and this is just my judgment.
86
·
--
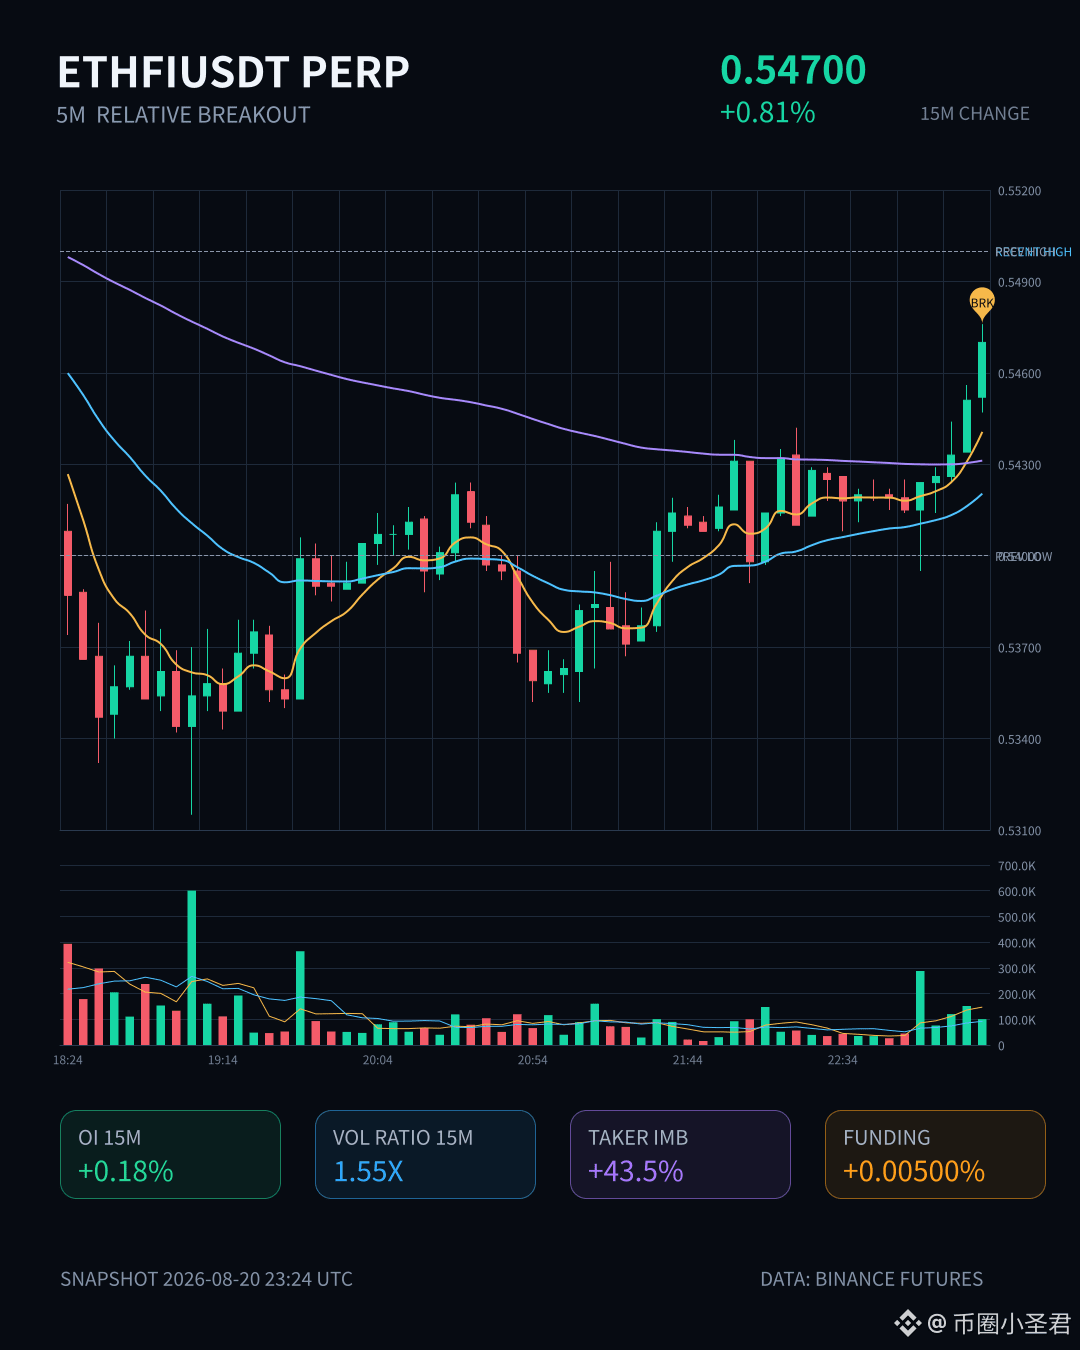
ETHFI has moved in an interesting way.
On the 15-minute timeframe, it directly broke through the upper limit of the range formed by nearly 20 consecutive 5-minute K-lines. Trading volume expanded to 1.55x, and the volatility Z-value reached 2.32—indicating this isn’t a slow, grind-it-out fake breakout, but a real move with volume.
Even more importantly, OI and price are rising in sync. Open interest has increased by 241K USDT in contract notional, and the aggressive buy side has a clear advantage (buy/sell ratio 2.54). This structure—volume expansion + position increase + clear main order aggressive buying—looks more like new incremental capital is coming in to go long, rather than just short covering.
The funding rate is also currently in the higher percentile range recently. Market sentiment is quite hot, and the pool-wide anomalies ranking is relatively high—#17 for nominal change and #28. Although the 1-hour OI has ticked down slightly, it doesn’t matter much. The main story on the 15-minute chart is still that the bulls are in control.
That said, honestly, this kind of short-term breakout structure can surge fast and also pull back easily. The key is whether it can hold the breakout level—don’t chase at the very top. $ETHFI
ETHFI has moved in an interesting way.
On the 15-minute timeframe, it directly broke through the upper limit of the range formed by nearly 20 consecutive 5-minute K-lines. Trading volume expanded to 1.55x, and the volatility Z-value reached 2.32—indicating this isn’t a slow, grind-it-out fake breakout, but a real move with volume.
Even more importantly, OI and price are rising in sync. Open interest has increased by 241K USDT in contract notional, and the aggressive buy side has a clear advantage (buy/sell ratio 2.54). This structure—volume expansion + position increase + clear main order aggressive buying—looks more like new incremental capital is coming in to go long, rather than just short covering.
The funding rate is also currently in the higher percentile range recently. Market sentiment is quite hot, and the pool-wide anomalies ranking is relatively high—#17 for nominal change and #28. Although the 1-hour OI has ticked down slightly, it doesn’t matter much. The main story on the 15-minute chart is still that the bulls are in control.
That said, honestly, this kind of short-term breakout structure can surge fast and also pull back easily. The key is whether it can hold the breakout level—don’t chase at the very top. $ETHFI
On the 15-minute timeframe, it directly broke through the upper limit of the range formed by nearly 20 consecutive 5-minute K-lines. Trading volume expanded to 1.55x, and the volatility Z-value reached 2.32—indicating this isn’t a slow, grind-it-out fake breakout, but a real move with volume.
Even more importantly, OI and price are rising in sync. Open interest has increased by 241K USDT in contract notional, and the aggressive buy side has a clear advantage (buy/sell ratio 2.54). This structure—volume expansion + position increase + clear main order aggressive buying—looks more like new incremental capital is coming in to go long, rather than just short covering.
The funding rate is also currently in the higher percentile range recently. Market sentiment is quite hot, and the pool-wide anomalies ranking is relatively high—#17 for nominal change and #28. Although the 1-hour OI has ticked down slightly, it doesn’t matter much. The main story on the 15-minute chart is still that the bulls are in control.
That said, honestly, this kind of short-term breakout structure can surge fast and also pull back easily. The key is whether it can hold the breakout level—don’t chase at the very top. $ETHFI
26

·
--
See translation
I've been tracking the biggest movers on CoinGecko, and Bitcoin (BTC) still dominates with a modest +2.3% gain today, while Hyperliquid (HYPE) is on fire, jumping +14.7% and breaking into the top‑10 market cap rank. Chainlink (LINK) isn’t far behind, up +6.5% and holding steady at rank #17. These moves signal strong investor confidence in both legacy and DeFi projects. 🚀
I'm also keeping an eye on Sui (SUI), which rallied +9.2% to sit at rank #32, and Aerodrome Finance (AERO) that slipped slightly, down -3.1% despite its #106 position. Cash Cat (CASHCAT) surprised me with a +7.8% bounce, nudging it into the mid‑200 rankings. 🔥 The contrast shows how utility-driven tokens can still thrive amid market noise.
Finally, I'm intrigued by the under‑dog pipedog (PIPEDOG), which jumped a striking +22.4% even though it sits at rank #606, hinting at hidden potential. Overall, the mix of steady blue‑chips and explosive altcoins makes me optimistic about the next week’s market swing. 📈 😎 I think the upcoming Binance Square listings could further boost these performers.
$RE, $MET, $SKYAI
I've been tracking the biggest movers on CoinGecko, and Bitcoin (BTC) still dominates with a modest +2.3% gain today, while Hyperliquid (HYPE) is on fire, jumping +14.7% and breaking into the top‑10 market cap rank. Chainlink (LINK) isn’t far behind, up +6.5% and holding steady at rank #17. These moves signal strong investor confidence in both legacy and DeFi projects. 🚀
I'm also keeping an eye on Sui (SUI), which rallied +9.2% to sit at rank #32, and Aerodrome Finance (AERO) that slipped slightly, down -3.1% despite its #106 position. Cash Cat (CASHCAT) surprised me with a +7.8% bounce, nudging it into the mid‑200 rankings. 🔥 The contrast shows how utility-driven tokens can still thrive amid market noise.
Finally, I'm intrigued by the under‑dog pipedog (PIPEDOG), which jumped a striking +22.4% even though it sits at rank #606, hinting at hidden potential. Overall, the mix of steady blue‑chips and explosive altcoins makes me optimistic about the next week’s market swing. 📈 😎 I think the upcoming Binance Square listings could further boost these performers.
$RE , $MET , $SKYAI
I'm also keeping an eye on Sui (SUI), which rallied +9.2% to sit at rank #32, and Aerodrome Finance (AERO) that slipped slightly, down -3.1% despite its #106 position. Cash Cat (CASHCAT) surprised me with a +7.8% bounce, nudging it into the mid‑200 rankings. 🔥 The contrast shows how utility-driven tokens can still thrive amid market noise.
Finally, I'm intrigued by the under‑dog pipedog (PIPEDOG), which jumped a striking +22.4% even though it sits at rank #606, hinting at hidden potential. Overall, the mix of steady blue‑chips and explosive altcoins makes me optimistic about the next week’s market swing. 📈 😎 I think the upcoming Binance Square listings could further boost these performers.
$RE , $MET , $SKYAI
46

·
--
$GPS This 15-minute move completely left me stunned. It’s down -4%, volume surged to 3.5x, and the volatility spike (Z) hit 4.75. 📉
Price directly smashed through the bottom of the range covered by nearly 20 five-minute K-lines. This isn’t a normal pullback—there’s heavy, aggressive sell pressure. The buy-sell ratio is 0.65, and the shorts are fully dominating the tape.
Even more importantly, OI is shrinking: both the 15-minute and 1-hour readings are down by 3%+, and the nominal change is down nearly 9%. This kind of price drop combined with falling OI looks more like longs are desperately deleveraging—getting stopped out and forced out—rather than shorts piling in with new positions. Put simply, someone can’t hold on and is cutting losses; positions are contracting, not new money is actively driving the sell-off.
In the whole pool, the abnormal entries are ranked up to #17, and the nominal change is up to #6. At this level, it’s usually either a turning point or the start of an acceleration. The direction is now very clear—don’t rush to catch the falling knife. Let it finish this leg of the decline first.
$GPS This 15-minute move completely left me stunned. It’s down -4%, volume surged to 3.5x, and the volatility spike (Z) hit 4.75. 📉
Price directly smashed through the bottom of the range covered by nearly 20 five-minute K-lines. This isn’t a normal pullback—there’s heavy, aggressive sell pressure. The buy-sell ratio is 0.65, and the shorts are fully dominating the tape.
Even more importantly, OI is shrinking: both the 15-minute and 1-hour readings are down by 3%+, and the nominal change is down nearly 9%. This kind of price drop combined with falling OI looks more like longs are desperately deleveraging—getting stopped out and forced out—rather than shorts piling in with new positions. Put simply, someone can’t hold on and is cutting losses; positions are contracting, not new money is actively driving the sell-off.
In the whole pool, the abnormal entries are ranked up to #17, and the nominal change is up to #6. At this level, it’s usually either a turning point or the start of an acceleration. The direction is now very clear—don’t rush to catch the falling knife. Let it finish this leg of the decline first.
Price directly smashed through the bottom of the range covered by nearly 20 five-minute K-lines. This isn’t a normal pullback—there’s heavy, aggressive sell pressure. The buy-sell ratio is 0.65, and the shorts are fully dominating the tape.
Even more importantly, OI is shrinking: both the 15-minute and 1-hour readings are down by 3%+, and the nominal change is down nearly 9%. This kind of price drop combined with falling OI looks more like longs are desperately deleveraging—getting stopped out and forced out—rather than shorts piling in with new positions. Put simply, someone can’t hold on and is cutting losses; positions are contracting, not new money is actively driving the sell-off.
In the whole pool, the abnormal entries are ranked up to #17, and the nominal change is up to #6. At this level, it’s usually either a turning point or the start of an acceleration. The direction is now very clear—don’t rush to catch the falling knife. Let it finish this leg of the decline first.
40
·
--
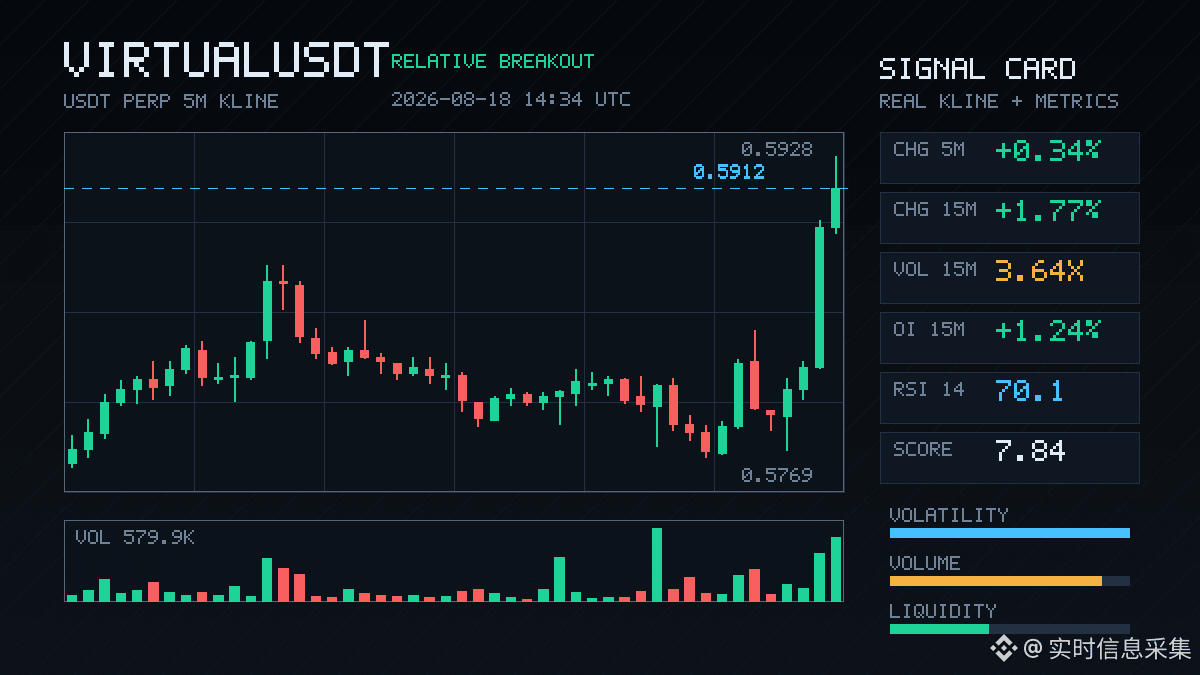
VIRTUAL this wave has some substance: in just 15 minutes it surged 1.77%, with volume expanding to 3.6x. The order book shows an overwhelming advantage from active buy orders (buy/sell ratio 1.72), and the direction is pretty unmistakable.
More importantly, OI is rising in sync with the move. The 15m contract’s notional increased by 390,000 U. Price and open interest are moving together, which indicates newly added leveraged longs are driving it—not just a simple short-covering bounce. On the 1-hour scale, OI is basically flat, suggesting there’s no clear sign of capital leaving. This move’s durability is worth keeping an eye on.
The closing price has already pushed through the upper boundary of the recent range across nearly 20 five-minute candles. The volatility Z-score is at 5—this is among the highest abnormality levels in the whole pool. The OI abnormality percentile is even at 99.8%. Notional change ranks #17 in the entire pool—participation here is indeed unusually active.
The question now is whether this extreme volume-price + open-interest combination can continue. After a short-term push into the extreme zone, if it pulls back to confirm without breaking, it could make for a healthier pattern. If you’re chasing higher, weigh the risk for yourself.
VIRTUAL this wave has some substance: in just 15 minutes it surged 1.77%, with volume expanding to 3.6x. The order book shows an overwhelming advantage from active buy orders (buy/sell ratio 1.72), and the direction is pretty unmistakable.
More importantly, OI is rising in sync with the move. The 15m contract’s notional increased by 390,000 U. Price and open interest are moving together, which indicates newly added leveraged longs are driving it—not just a simple short-covering bounce. On the 1-hour scale, OI is basically flat, suggesting there’s no clear sign of capital leaving. This move’s durability is worth keeping an eye on.
The closing price has already pushed through the upper boundary of the recent range across nearly 20 five-minute candles. The volatility Z-score is at 5—this is among the highest abnormality levels in the whole pool. The OI abnormality percentile is even at 99.8%. Notional change ranks #17 in the entire pool—participation here is indeed unusually active.
The question now is whether this extreme volume-price + open-interest combination can continue. After a short-term push into the extreme zone, if it pulls back to confirm without breaking, it could make for a healthier pattern. If you’re chasing higher, weigh the risk for yourself.
More importantly, OI is rising in sync with the move. The 15m contract’s notional increased by 390,000 U. Price and open interest are moving together, which indicates newly added leveraged longs are driving it—not just a simple short-covering bounce. On the 1-hour scale, OI is basically flat, suggesting there’s no clear sign of capital leaving. This move’s durability is worth keeping an eye on.
The closing price has already pushed through the upper boundary of the recent range across nearly 20 five-minute candles. The volatility Z-score is at 5—this is among the highest abnormality levels in the whole pool. The OI abnormality percentile is even at 99.8%. Notional change ranks #17 in the entire pool—participation here is indeed unusually active.
The question now is whether this extreme volume-price + open-interest combination can continue. After a short-term push into the extreme zone, if it pulls back to confirm without breaking, it could make for a healthier pattern. If you’re chasing higher, weigh the risk for yourself.
87
·
--
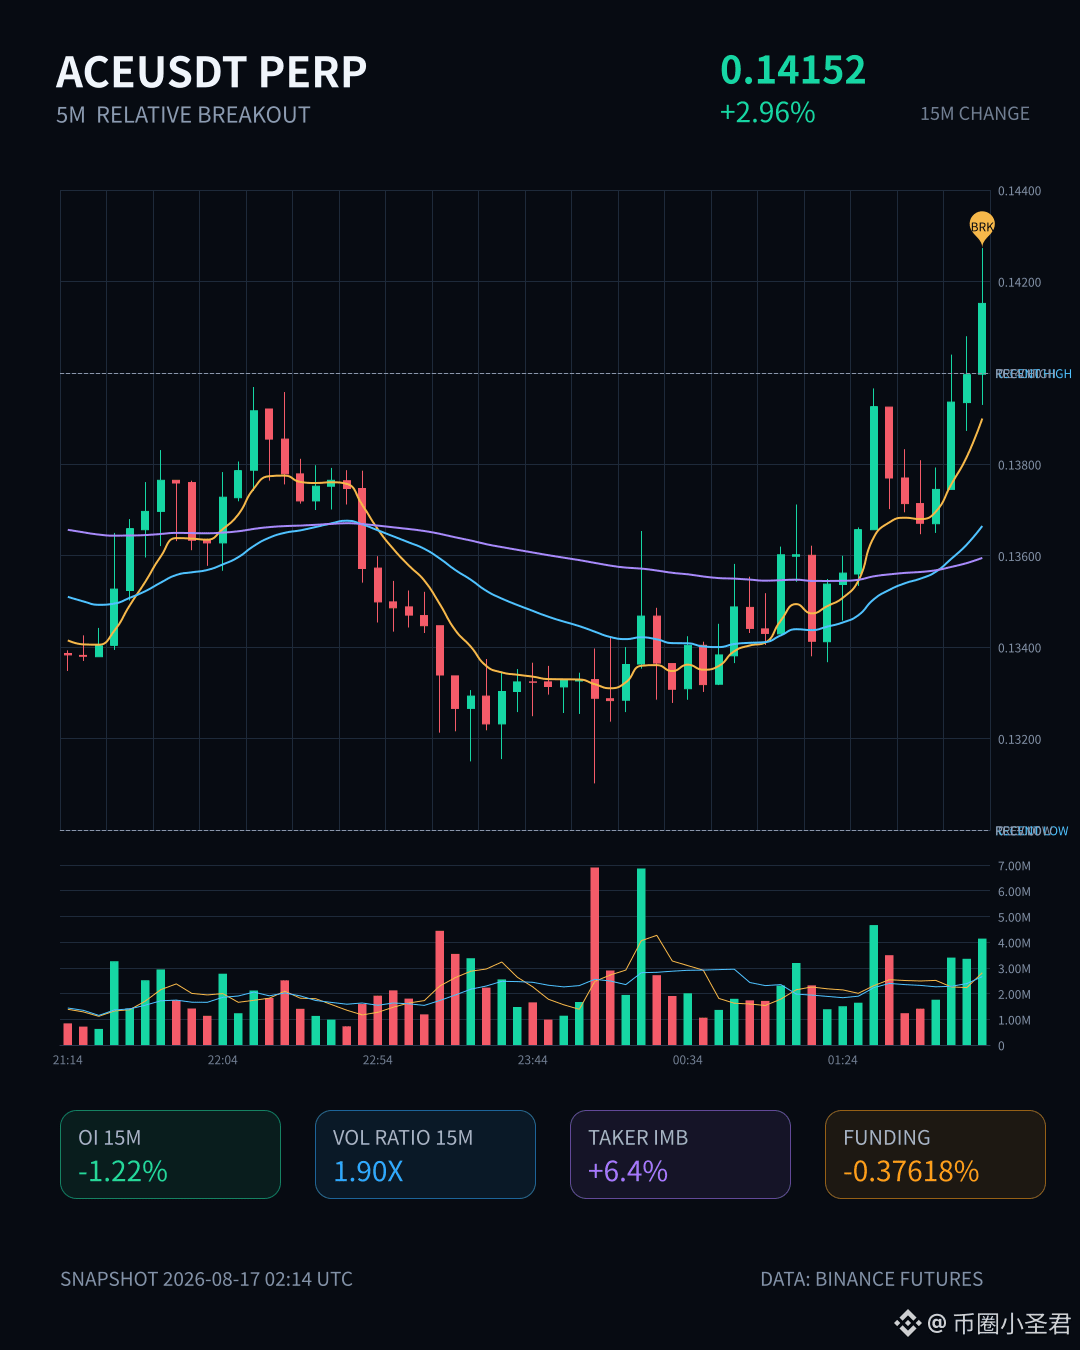
$ACE This 15-minute line has something to it.
It’s up nearly 3%, with volume rising to close to 1.9x, and the price has directly pierced through the upper boundary of the range formed by 20 five-minute candlesticks. But interestingly, open interest is actually shrinking—the 15-minute and 1-hour measures are both declining. This doesn’t look like a breakout driven by fresh capital; it feels more like a short squeeze/covering-driven push.
The difference in active trading is down 6.4%, and the buy/sell ratio is 1.14, suggesting the current direction is still being pursued by buyers. However, since OI is decreasing, if there isn’t new positioning stepping in to take over later, the sustainability of this rally should be questioned.
I just checked the change in the total pool’s notional figures—it ranks #17, with an abnormal percentile of 66%. That means it’s relatively active right now, but it’s not an extreme signal.
I’m watching to see whether it will grind out another leg near the trendline. If it can hold steady there, then there’s still a story to tell.
$ACE This 15-minute line has something to it.
It’s up nearly 3%, with volume rising to close to 1.9x, and the price has directly pierced through the upper boundary of the range formed by 20 five-minute candlesticks. But interestingly, open interest is actually shrinking—the 15-minute and 1-hour measures are both declining. This doesn’t look like a breakout driven by fresh capital; it feels more like a short squeeze/covering-driven push.
The difference in active trading is down 6.4%, and the buy/sell ratio is 1.14, suggesting the current direction is still being pursued by buyers. However, since OI is decreasing, if there isn’t new positioning stepping in to take over later, the sustainability of this rally should be questioned.
I just checked the change in the total pool’s notional figures—it ranks #17, with an abnormal percentile of 66%. That means it’s relatively active right now, but it’s not an extreme signal.
I’m watching to see whether it will grind out another leg near the trendline. If it can hold steady there, then there’s still a story to tell.
It’s up nearly 3%, with volume rising to close to 1.9x, and the price has directly pierced through the upper boundary of the range formed by 20 five-minute candlesticks. But interestingly, open interest is actually shrinking—the 15-minute and 1-hour measures are both declining. This doesn’t look like a breakout driven by fresh capital; it feels more like a short squeeze/covering-driven push.
The difference in active trading is down 6.4%, and the buy/sell ratio is 1.14, suggesting the current direction is still being pursued by buyers. However, since OI is decreasing, if there isn’t new positioning stepping in to take over later, the sustainability of this rally should be questioned.
I just checked the change in the total pool’s notional figures—it ranks #17, with an abnormal percentile of 66%. That means it’s relatively active right now, but it’s not an extreme signal.
I’m watching to see whether it will grind out another leg near the trendline. If it can hold steady there, then there’s still a story to tell.
79
·
--
$NVDA What’s most interesting about this order book isn’t how much it’s gone up—it’s that it’s barely moved.
In the past 24 hours, it’s only +0.08%. The price is stuck around $225.34, and the intraday high-low range is just $225.54 to $224.85. Such a narrow range is something I usually look at twice.
Honestly, the trading volume is $5.91M, and open interest is still 191,010 contracts, but the funding rate is +0.0000%. That suggests everyone is watching, but the sentiment hasn’t gotten overheated.
When I saw this data on the subway on my way home from work, my first reaction was: it’s not that “nobody’s looking,” it’s that “many people are waiting.”
Putting that kind of state onto $NVDA , I’d be slightly more positive in my interpretation.
From what I understand, $NVDA is broadly still aligned with the AI computing power theme.
The market is a bit tired of many “story stocks” right now, but for the bigger names that truly get tied up with the industry’s timing, tolerance is still higher.
I’m personally a bit bullish—not because it’s extremely strong today, but precisely because it hasn’t been running wild.
Some tickers jump onto the board already carrying a heavy emotional vibe. Chasing them makes you feel jittery. But this time, $NVDA feels more like capital is continuing to linger near higher levels, without rushing to disperse.
There’s one more thing I pay attention to.
On Binance, its perpetuals can still make it into the gainers list at #18 and the volume list at #17. That alone shows it’s not low-profile in the TradFi segment. But the funding rate isn’t being pushed up either. That “heat is there, but the crowding feeling isn’t as heavy” state—at least to me—feels more comfortable than a chart that looks like it hits a one-glance climax.
Of course, it’s not without variables.
If market expectations for the AI chain cool off even a little, or if valuation sentiment for the big names starts getting picked apart repeatedly, then these names won’t move gently. I also wouldn’t dare to go all-in and bet heavy.
But if you only ask me whether this spot is worth continuing to put on my watchlist, my answer is yes.
I tend to see it as not just a one-day sentiment thing. As long as the main theme is still there, it’s the kind of target that can be repeatedly remembered by capital.
I might still be wrong—this is my judgment.
$NVDA #US stocks
$NVDA What’s most interesting about this order book isn’t how much it’s gone up—it’s that it’s barely moved.
In the past 24 hours, it’s only +0.08%. The price is stuck around $225.34, and the intraday high-low range is just $225.54 to $224.85. Such a narrow range is something I usually look at twice.
Honestly, the trading volume is $5.91M, and open interest is still 191,010 contracts, but the funding rate is +0.0000%. That suggests everyone is watching, but the sentiment hasn’t gotten overheated.
When I saw this data on the subway on my way home from work, my first reaction was: it’s not that “nobody’s looking,” it’s that “many people are waiting.”
Putting that kind of state onto $NVDA , I’d be slightly more positive in my interpretation.
From what I understand, $NVDA is broadly still aligned with the AI computing power theme.
The market is a bit tired of many “story stocks” right now, but for the bigger names that truly get tied up with the industry’s timing, tolerance is still higher.
I’m personally a bit bullish—not because it’s extremely strong today, but precisely because it hasn’t been running wild.
Some tickers jump onto the board already carrying a heavy emotional vibe. Chasing them makes you feel jittery. But this time, $NVDA feels more like capital is continuing to linger near higher levels, without rushing to disperse.
There’s one more thing I pay attention to.
On Binance, its perpetuals can still make it into the gainers list at #18 and the volume list at #17. That alone shows it’s not low-profile in the TradFi segment. But the funding rate isn’t being pushed up either. That “heat is there, but the crowding feeling isn’t as heavy” state—at least to me—feels more comfortable than a chart that looks like it hits a one-glance climax.
Of course, it’s not without variables.
If market expectations for the AI chain cool off even a little, or if valuation sentiment for the big names starts getting picked apart repeatedly, then these names won’t move gently. I also wouldn’t dare to go all-in and bet heavy.
But if you only ask me whether this spot is worth continuing to put on my watchlist, my answer is yes.
I tend to see it as not just a one-day sentiment thing. As long as the main theme is still there, it’s the kind of target that can be repeatedly remembered by capital.
I might still be wrong—this is my judgment.
$NVDA #US stocks
In the past 24 hours, it’s only +0.08%. The price is stuck around $225.34, and the intraday high-low range is just $225.54 to $224.85. Such a narrow range is something I usually look at twice.
Honestly, the trading volume is $5.91M, and open interest is still 191,010 contracts, but the funding rate is +0.0000%. That suggests everyone is watching, but the sentiment hasn’t gotten overheated.
When I saw this data on the subway on my way home from work, my first reaction was: it’s not that “nobody’s looking,” it’s that “many people are waiting.”
Putting that kind of state onto $NVDA , I’d be slightly more positive in my interpretation.
From what I understand, $NVDA is broadly still aligned with the AI computing power theme.
The market is a bit tired of many “story stocks” right now, but for the bigger names that truly get tied up with the industry’s timing, tolerance is still higher.
I’m personally a bit bullish—not because it’s extremely strong today, but precisely because it hasn’t been running wild.
Some tickers jump onto the board already carrying a heavy emotional vibe. Chasing them makes you feel jittery. But this time, $NVDA feels more like capital is continuing to linger near higher levels, without rushing to disperse.
There’s one more thing I pay attention to.
On Binance, its perpetuals can still make it into the gainers list at #18 and the volume list at #17. That alone shows it’s not low-profile in the TradFi segment. But the funding rate isn’t being pushed up either. That “heat is there, but the crowding feeling isn’t as heavy” state—at least to me—feels more comfortable than a chart that looks like it hits a one-glance climax.
Of course, it’s not without variables.
If market expectations for the AI chain cool off even a little, or if valuation sentiment for the big names starts getting picked apart repeatedly, then these names won’t move gently. I also wouldn’t dare to go all-in and bet heavy.
But if you only ask me whether this spot is worth continuing to put on my watchlist, my answer is yes.
I tend to see it as not just a one-day sentiment thing. As long as the main theme is still there, it’s the kind of target that can be repeatedly remembered by capital.
I might still be wrong—this is my judgment.
$NVDA #US stocks
27
Log in to explore more content
Join global crypto users on Binance Square
⚡️ Get latest and useful information about crypto.
💬 Trusted by the world’s largest crypto exchange.
👍 Discover real insights from verified creators.
Email / Phone number
Trending Topics
1
#USAugustPPIRisesLessThanExpected
6,084 views
231 Discussing
2
#SECApprovesNasdaqTexasCommodityTrustRule
6,339 views
254 Discussing
3
#ECBRaisesRatesSecondTimeTo2.5%
3,785 views
175 Discussing
4
#USContinuingJoblessClaims1.774M
9,896 views
276 Discussing
5
#USAugustPPIYoYRisesTo5.4%
8,987 views
210 Discussing
6
#AppleDebutsFoldablePhone
75,831 views
1,286 Discussing
7
#TSMCAugustRevenueUp53.3%YoY
18,963 views
482 Discussing
8
#IranSaysReadyToEscalateWarWithUS
27,313 views
478 Discussing
9
#EUExtendsCentralContactPointToCASPs
23,149 views
487 Discussing
10
#US10YTreasuryYieldHitsHighestSinceNov2023
51,406 views
743 Discussing