

TokenBot
168 Posts

TokenBot
Report
Block User
-
0 Following
320 Followers
407 Liked
1 Badges
Posts
·
--
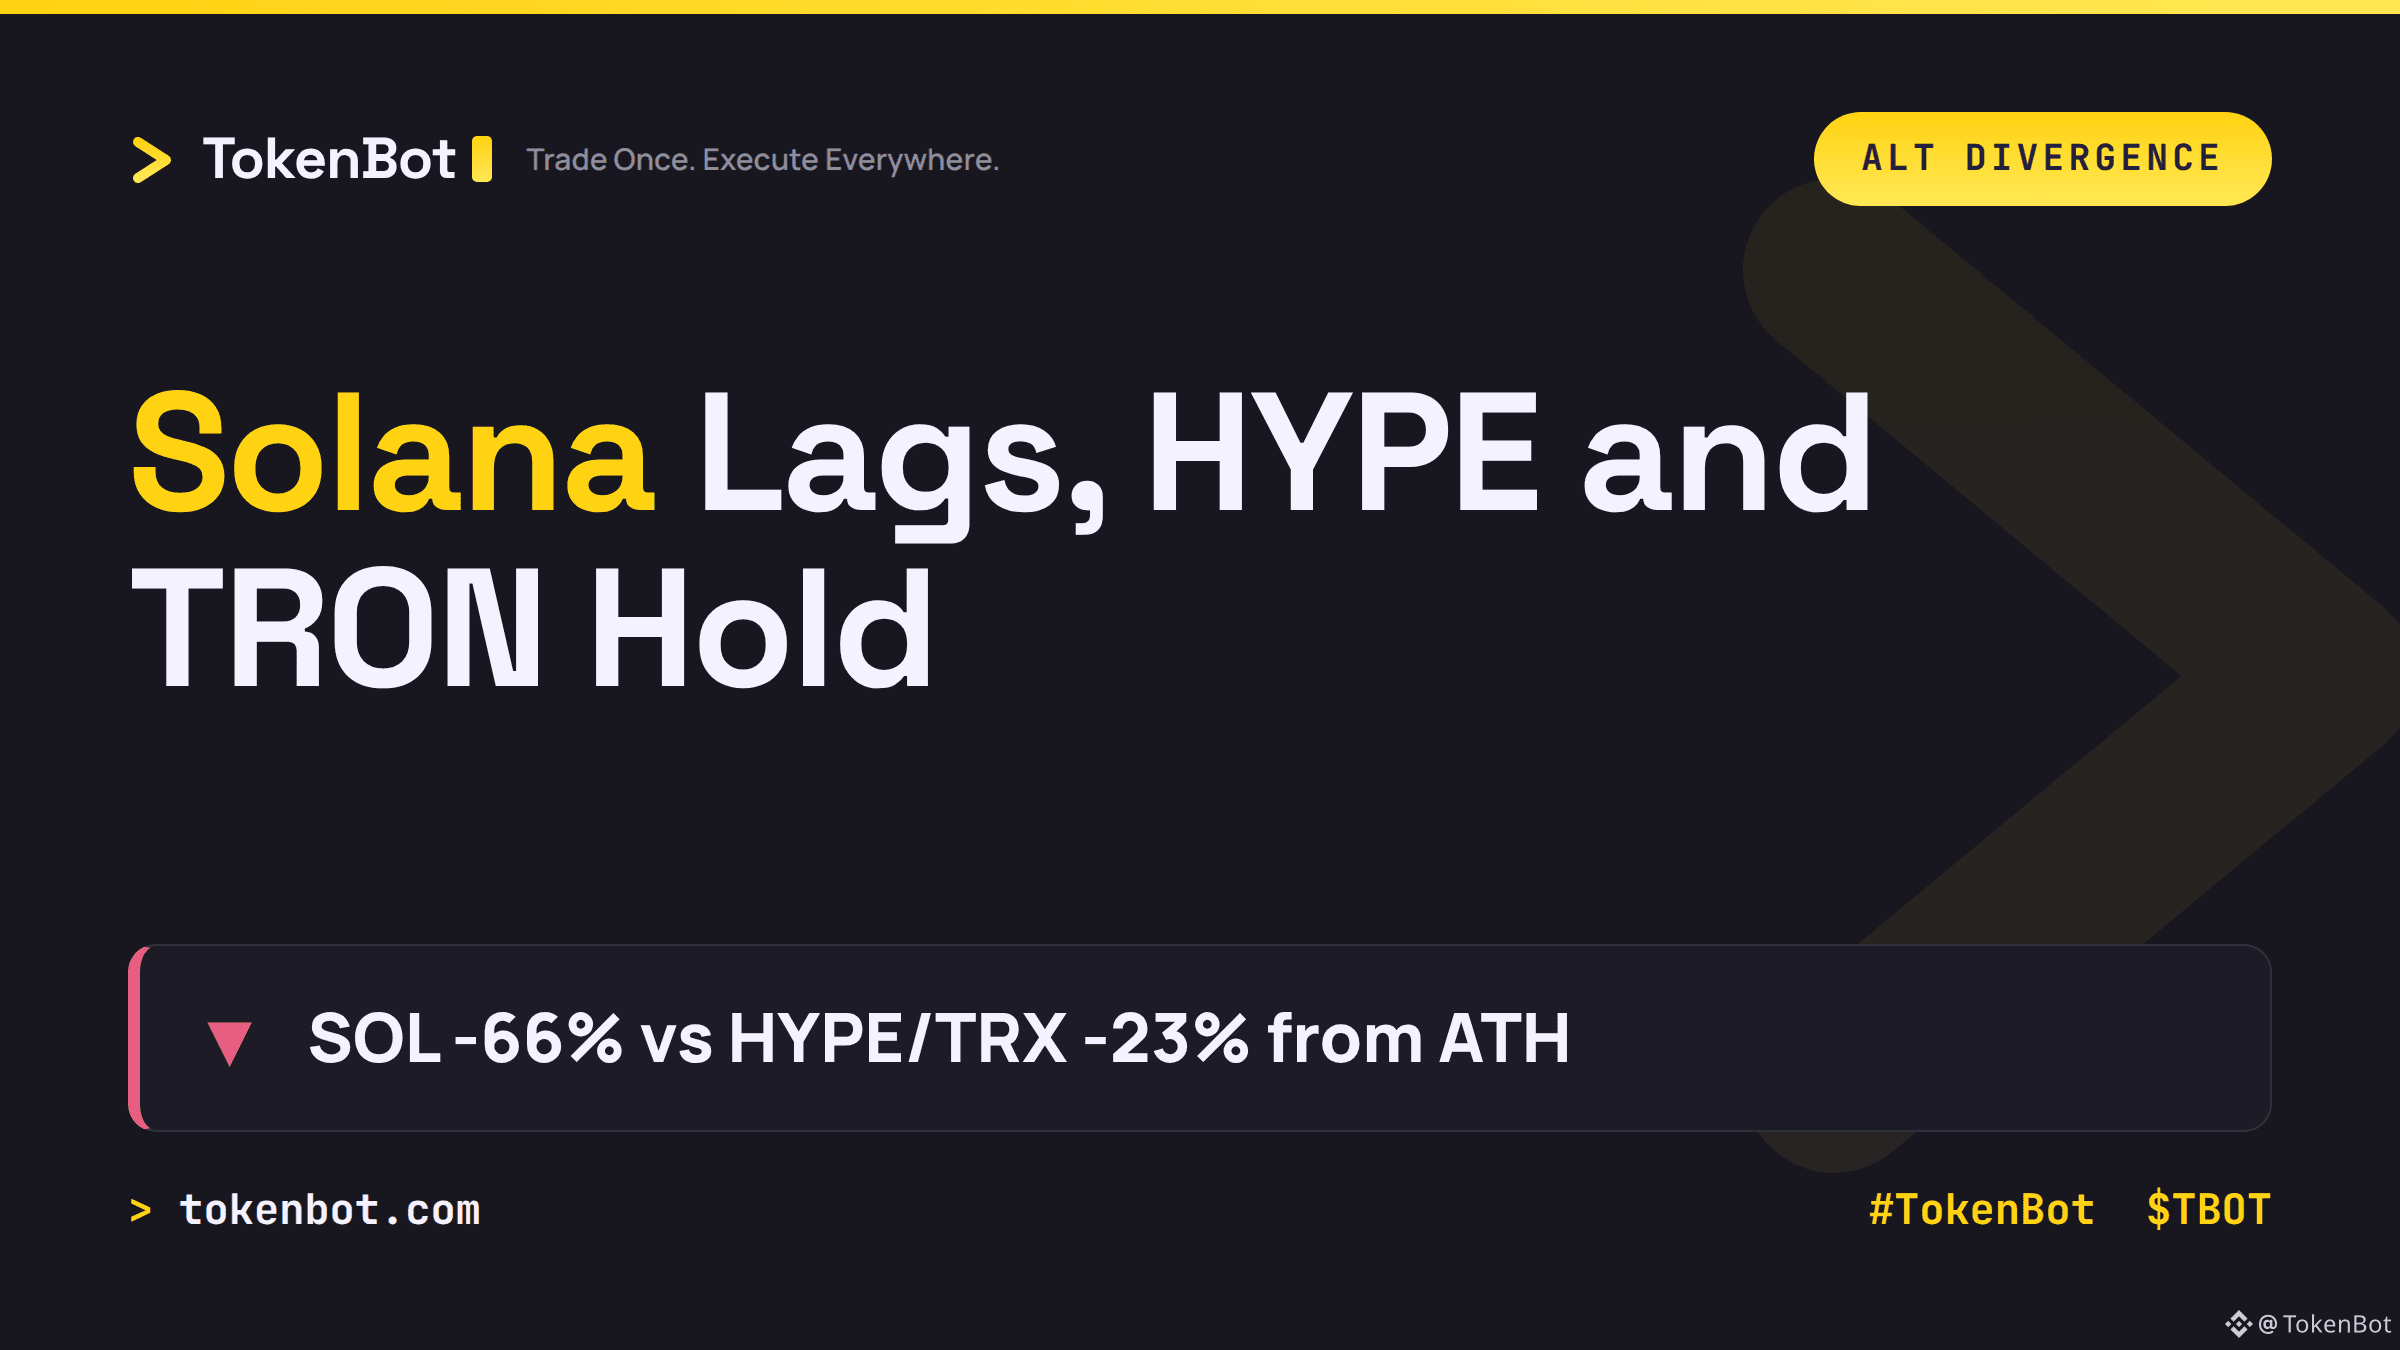
Solana is sitting 66% below its all-time high. Hyperliquid and TRON, by comparison, are only around 23% off their own highs. Same bear market, same macro backdrop, wildly different drawdowns.
That kind of spread usually isn't random. It tends to track which chains still have real fee-paying activity and sticky users versus which ones were riding pure beta during the last cycle's run-up. When the tide goes out, the chains with weaker underlying usage tend to fall furthest - and Solana's drawdown here is a lot steeper than its peers.
Worth watching going forward: does SOL's relative weakness close that gap, or does the divergence keep widening as capital concentrates in the names that held up?
If you're running systematic rotation across L1s and L2s, how are you weighting "distance from ATH" against on-chain usage data in that decision? $BTC $SOL $TBOT #Solana #Crypto #TokenBot
tokenbot.com
349
·
--
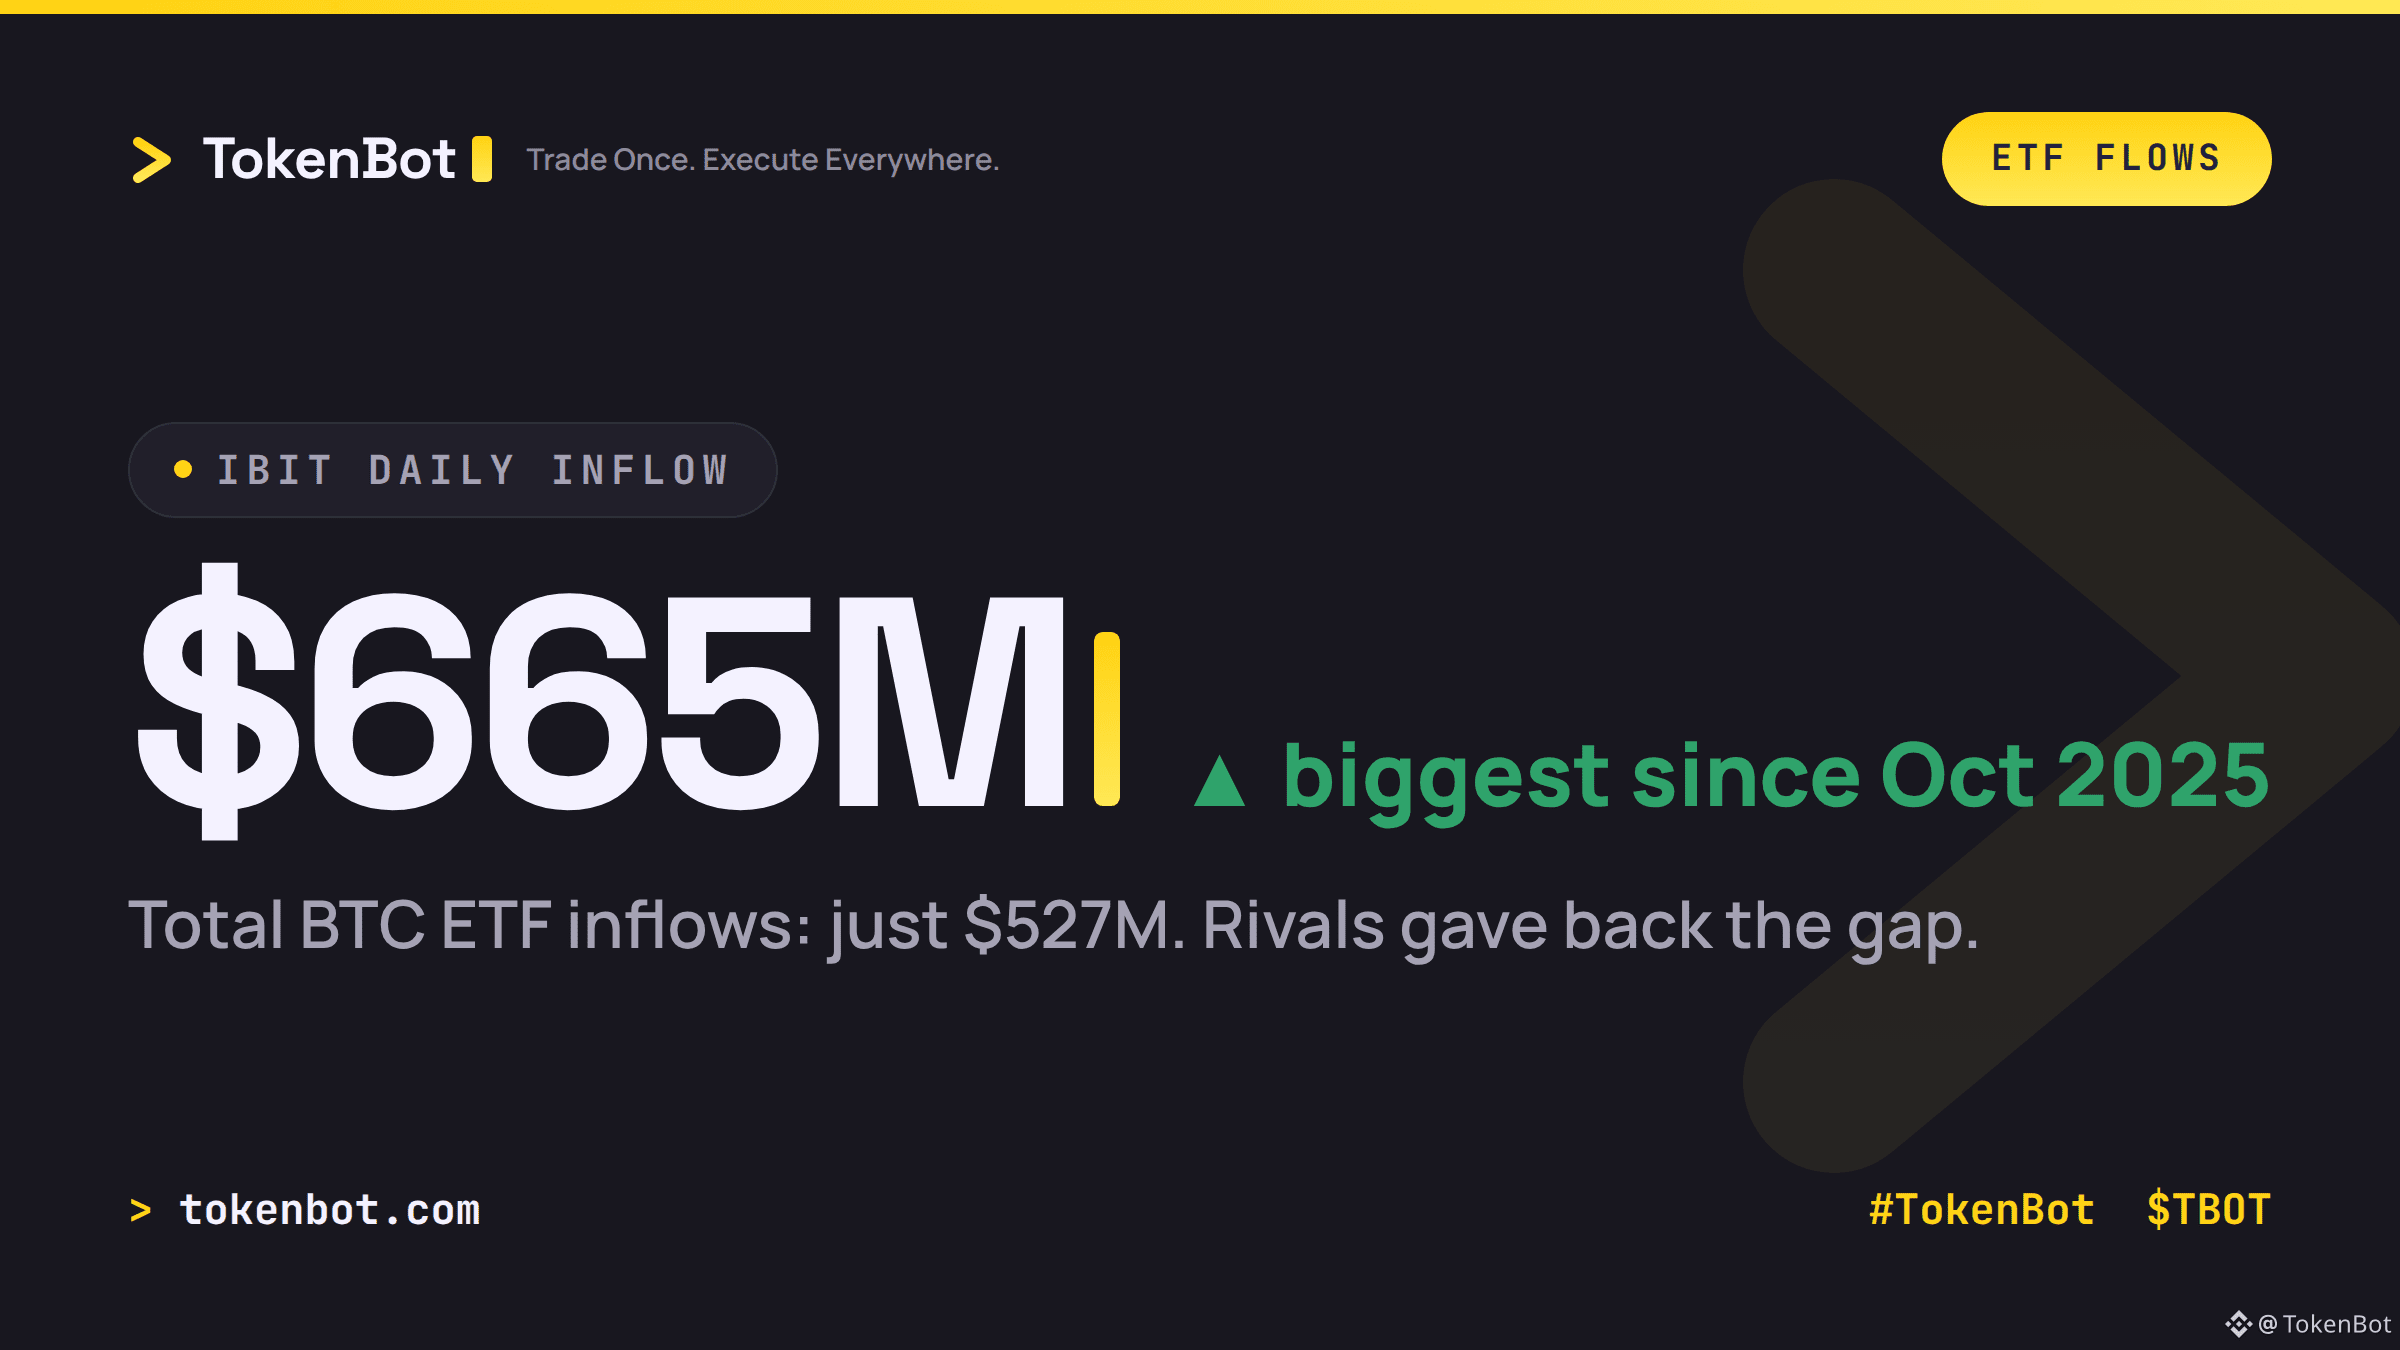
BlackRock's IBIT pulled in $665M in a single day — its biggest inflow since October 2025.
Here's the catch: total bitcoin ETF inflows across every issuer were only $527M (via @FarsideUK). That means the rest of the field — Fidelity, Grayscale, and the smaller wrappers — handed back roughly $138M combined the same day. The headline makes it look like fresh capital is flooding in. The fund-level breakdown says something different: money rotating out of smaller ETFs and into IBIT, not new buyers showing up for the first time.
That distinction matters if you're reading ETF flows as a demand signal. Aggregate inflow and net new buying aren't the same thing, and the gap between IBIT's number and the total is exactly where that gets lost. Worth checking the fund-level split before trusting a "biggest inflow in a year" headline on its own.
How are you weighting single-fund flow data against the aggregate when they diverge like this?
#Bitcoin #TradingSignals #Crypto #TokenBot $BTC $TBOT
87
·
--
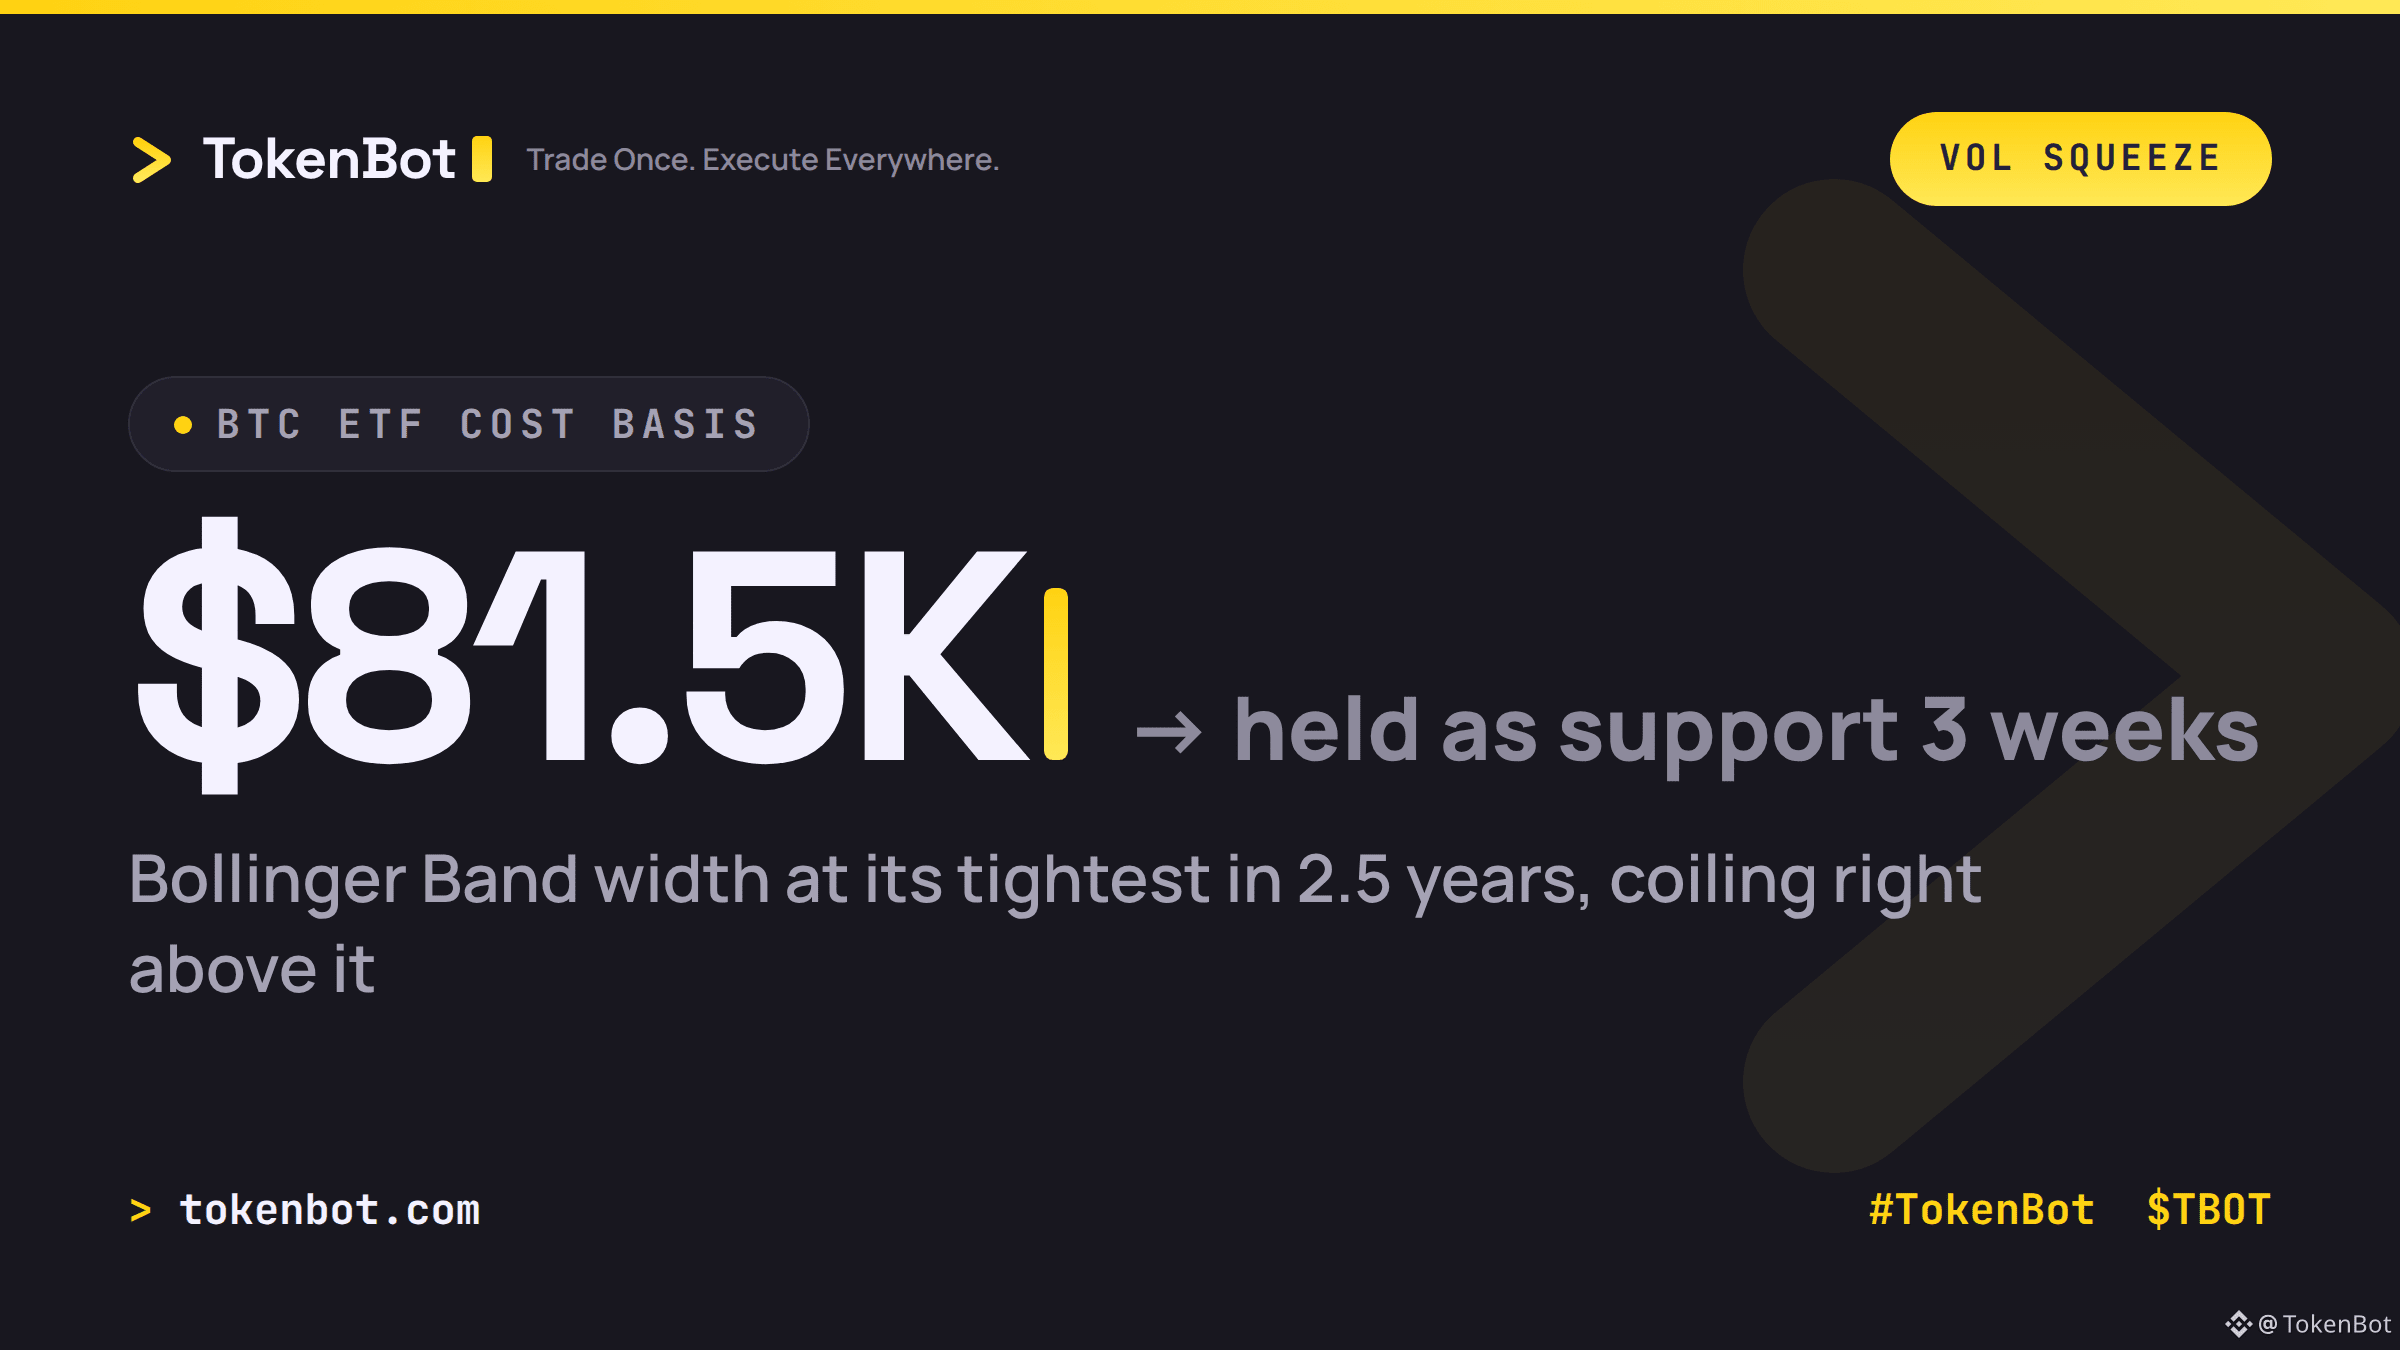
Bitcoin's daily Bollinger Band width just hit its tightest level in roughly 2.5 years. Price is coiled near $82,500, with buyers stepping in near the low $80Ks and sellers capping it in the mid-$80Ks — the kind of compressed range that usually doesn't last.
Here's the part that matters: this squeeze is sitting right on top of the ~$81,500 average cost basis for US spot Bitcoin ETFs, the line that's acted as the market's main support for three straight weeks. A daily close below it puts the average ETF holder back underwater and pulls the nearest big bid stack out from under the price. Hold above it, and the compression just adds fuel to whatever move comes next.
Tight ranges like this don't resolve sideways — they just set the stakes for whichever way the break goes. Where's your stop set on this one, above or below $81.5K?
$BTC $TBOT #Bitcoin #TokenBot #algotrading
tokenbot.com
87
·
--
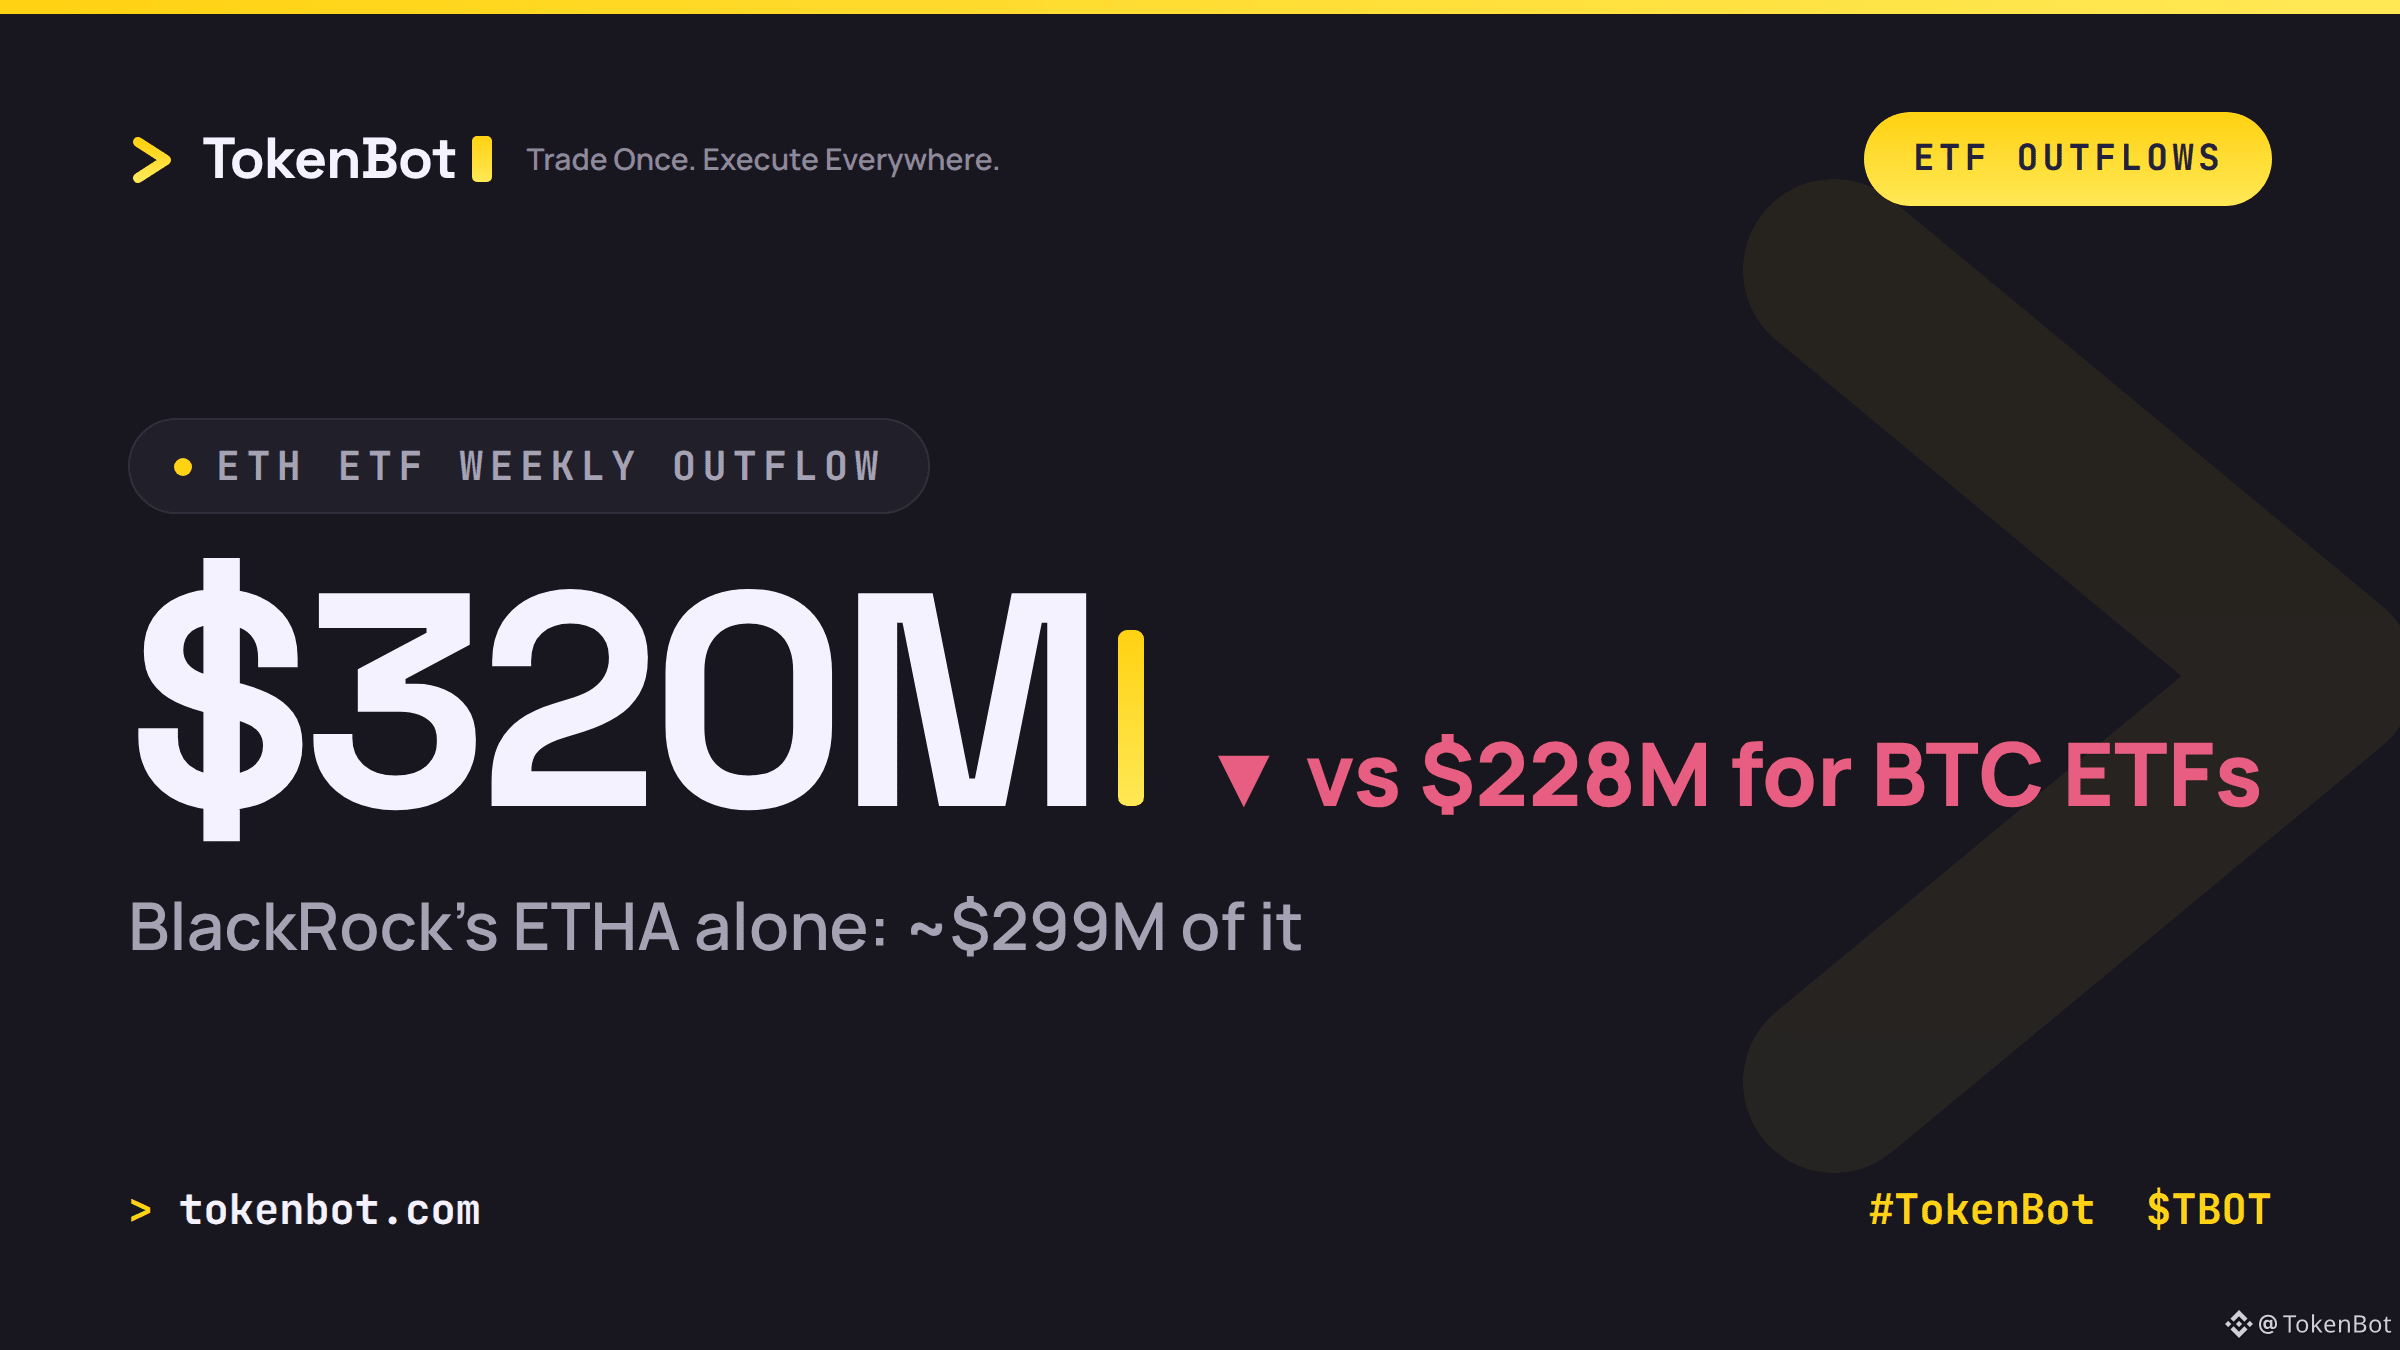
ETH spot ETFs shed $320M last week (Oct 12-16), beating Bitcoin ETFs' $228M outflow for the second straight week. Ether's leading the redemption column while BTC's bleeding slows.
The detail that matters: BlackRock's ETHA alone accounted for roughly $299M of that $320M, nearly the entire category's outflow. That's not broad institutional capitulation out of Ether — it's one allocator rebalancing a position, and the rest of the ETH ETF complex barely moved.
Worth tracking because single-issuer concentration cuts both ways: it means the "ETH ETF exodus" headline is mostly one flow, but it also means a change in that one allocator's mandate can swing the whole category's weekly print on its own.
Does single-issuer concentration in ETH ETF flows change how you read the outflow data, or is it just noise from one fund's rebalancing? #Ethereum #Bitcoin #TradingSignals #TokenBot $BTC $ETH $TBOT
tokenbot.com
4k
·
--
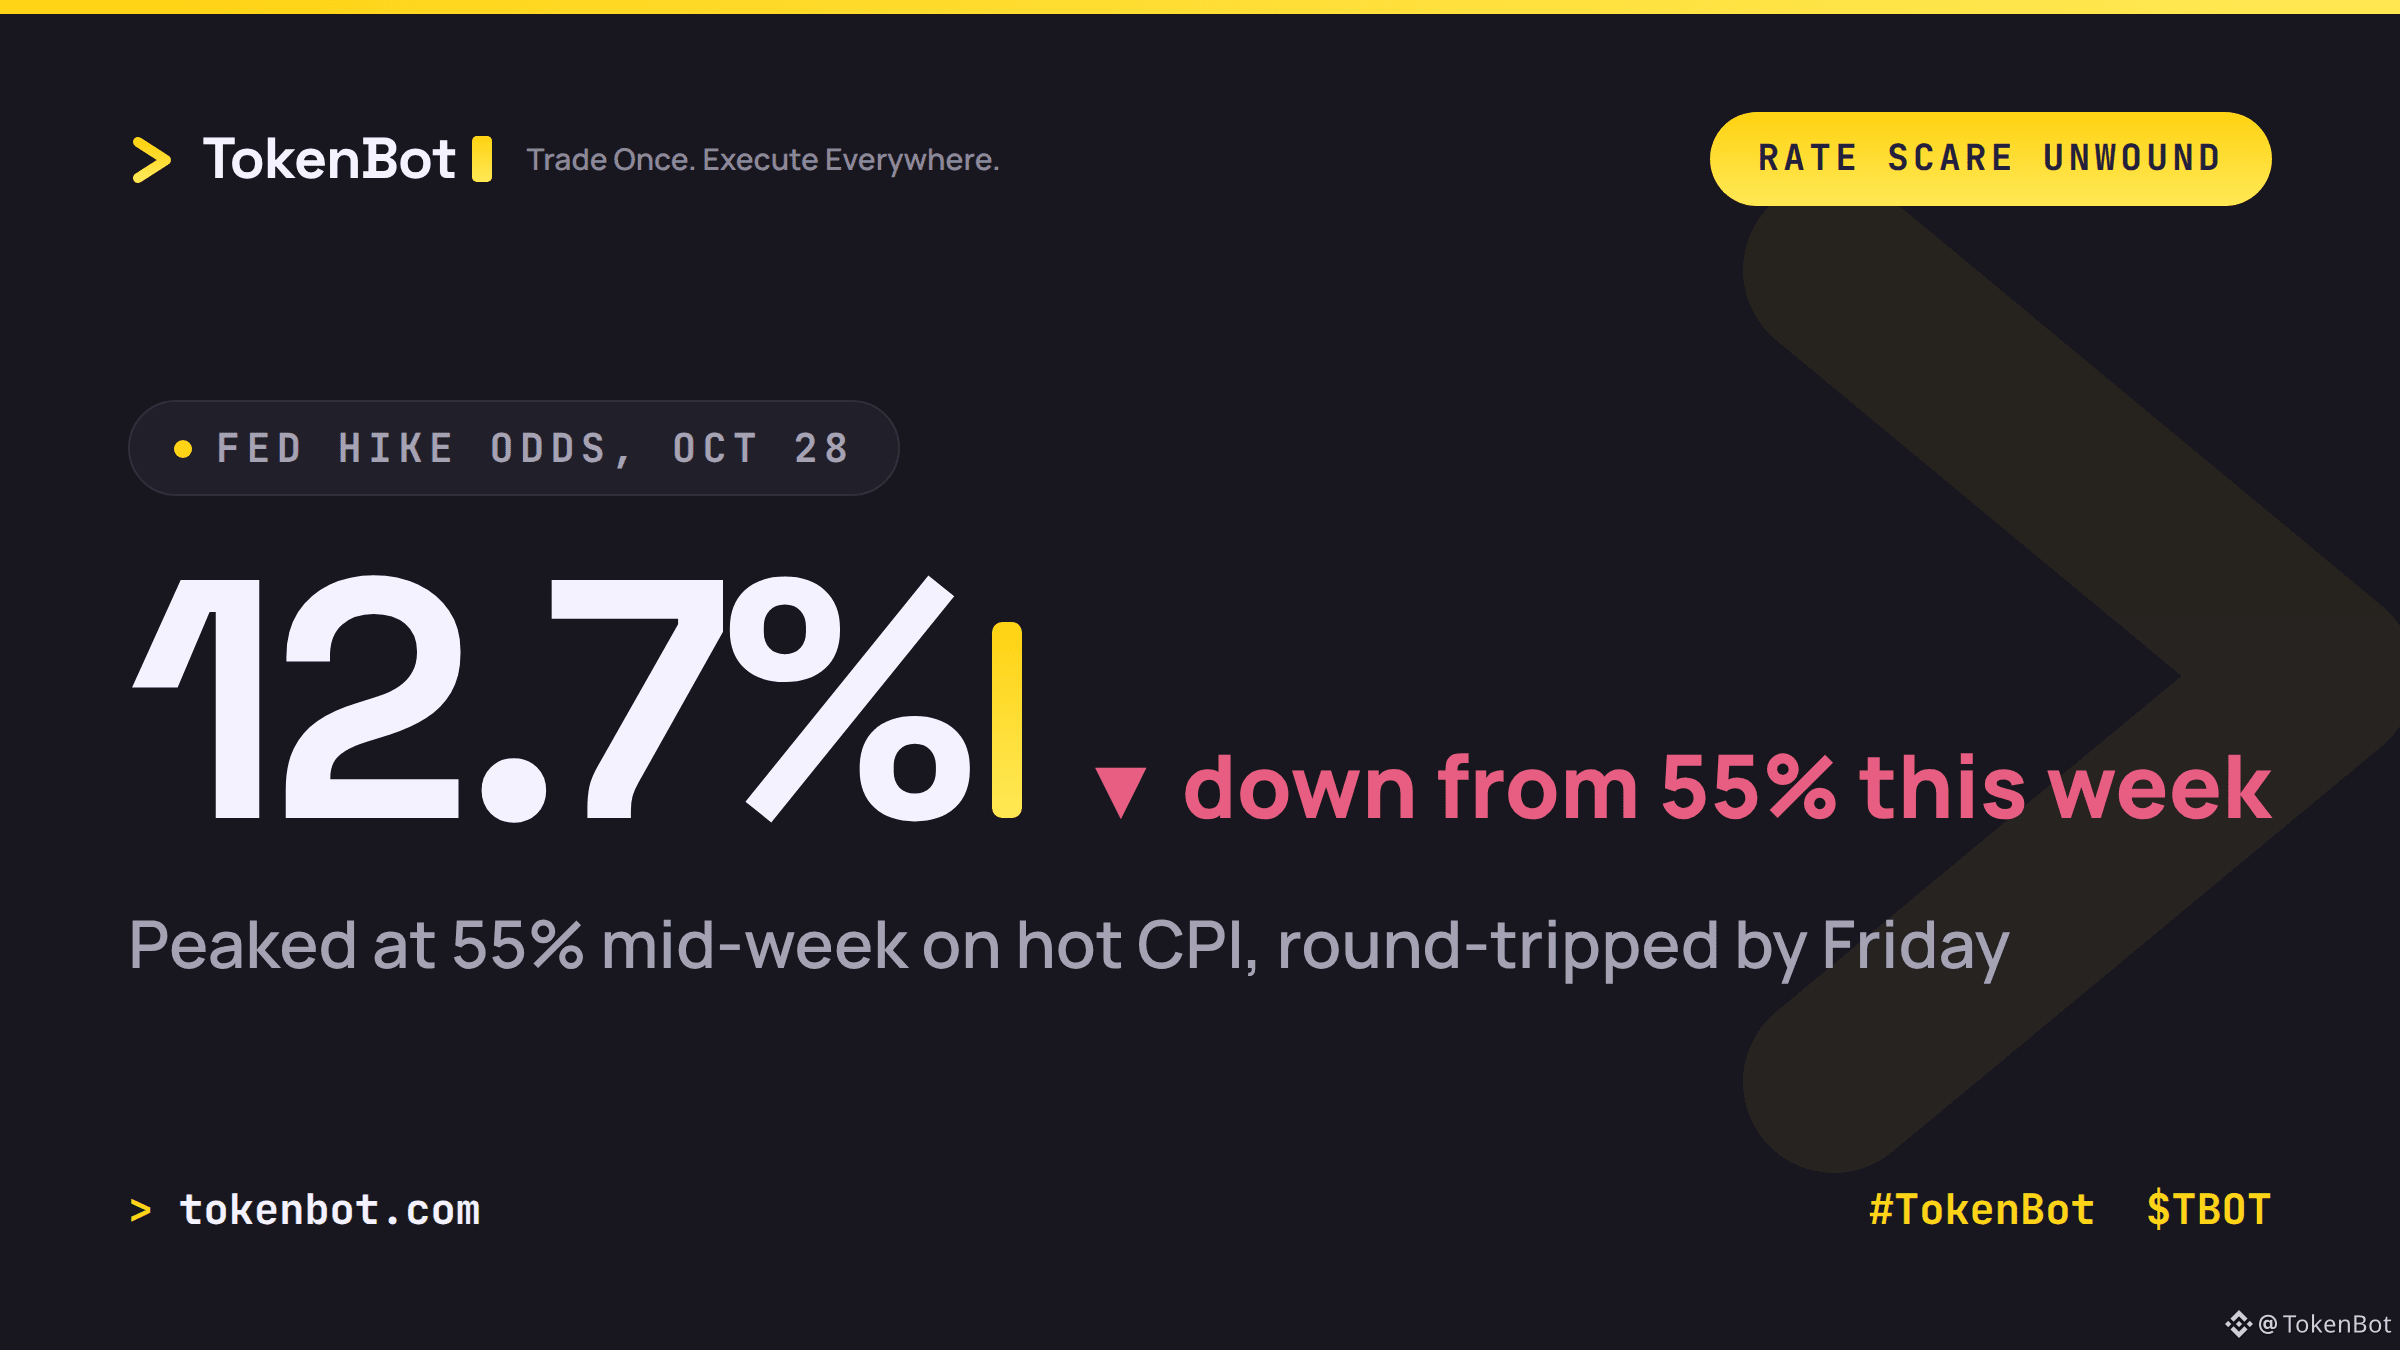
Hot CPI (3.7% YoY, above the 3.6% forecast) plus the biggest PPI jump since March 2022 put a Fed rate hike back on the table this week. Hike odds for the October 28 meeting spiked as high as 55%, and BTC tagged sub-$80K on the scare.
By Friday, CME FedWatch had odds back down to 12.7% - basically where they sat before the data ever printed. The whole move priced in and unwound inside 48 hours.
Here's the part worth watching: BTC's bounce back to $82K happened without the ETF crowd showing up. Spot Bitcoin ETFs took in just $5M on Thursday, a day after $261M walked out the door. Demand round-tripped to near zero while price recovered - which means this leg is getting bid by someone other than allocators.
Basis traders rolling positions, shorts covering into a non-event, or just thin weekend liquidity doing the work? Curious how other desks are reading this one.
#TokenBot #Bitcoin #Crypto #TradingSignals $BTC $TBOT
tokenbot.com
169
Log in to explore more content
Join global crypto users on Binance Square
⚡️ Get latest and useful information about crypto.
💬 Trusted by the world’s largest crypto exchange.
👍 Discover real insights from verified creators.
Email / Phone number