
#tokenbot
tokenbot
14,322 views
131 Discussing
Hot
Latest

·
--
The recent FOMO driven by the AI narrative has heated up the tokenbot sector to the max 🔥
$CLANKER has successfully attracted a large amount of capital with its low circulating supply, ample liquidity pool, and the project still being in its early stage of development, leading to a significant price surge.
Current data: price 12.61 USD, 24h trading volume 1.28M USD, market cap 12.44M USD.
What do you think about the tokenbot sector? Feel free to share your thoughts in the comments 👇
$CLANKER #AI #tokenbot
The recent FOMO driven by the AI narrative has heated up the tokenbot sector to the max 🔥
$CLANKER has successfully attracted a large amount of capital with its low circulating supply, ample liquidity pool, and the project still being in its early stage of development, leading to a significant price surge.
Current data: price 12.61 USD, 24h trading volume 1.28M USD, market cap 12.44M USD.
What do you think about the tokenbot sector? Feel free to share your thoughts in the comments 👇
$CLANKER #AI #tokenbot
$CLANKER has successfully attracted a large amount of capital with its low circulating supply, ample liquidity pool, and the project still being in its early stage of development, leading to a significant price surge.
Current data: price 12.61 USD, 24h trading volume 1.28M USD, market cap 12.44M USD.
What do you think about the tokenbot sector? Feel free to share your thoughts in the comments 👇
$CLANKER #AI #tokenbot
37

Recently, the overall popularity of the tokenbot sector has surged, and related token prices have seen a significant rise.
This rally was mainly driven by FOMO sentiment fueled by the AI narrative. Tokens like $CLANKER, with relatively low circulating supply, ample liquidity pools, and the advantages of an early-stage development phase, successfully attracted a large influx of capital.
For players who positioned themselves early, the returns from this wave did indeed exceed expectations, and it has also led more people to start paying attention to the potential of this niche sector.
$CLANKER #AI #tokenbot
Recently, the overall popularity of the tokenbot sector has surged, and related token prices have seen a significant rise.
This rally was mainly driven by FOMO sentiment fueled by the AI narrative. Tokens like $CLANKER , with relatively low circulating supply, ample liquidity pools, and the advantages of an early-stage development phase, successfully attracted a large influx of capital.
For players who positioned themselves early, the returns from this wave did indeed exceed expectations, and it has also led more people to start paying attention to the potential of this niche sector.
$CLANKER #AI #tokenbot
This rally was mainly driven by FOMO sentiment fueled by the AI narrative. Tokens like $CLANKER , with relatively low circulating supply, ample liquidity pools, and the advantages of an early-stage development phase, successfully attracted a large influx of capital.
For players who positioned themselves early, the returns from this wave did indeed exceed expectations, and it has also led more people to start paying attention to the potential of this niche sector.
$CLANKER #AI #tokenbot
67

·
--
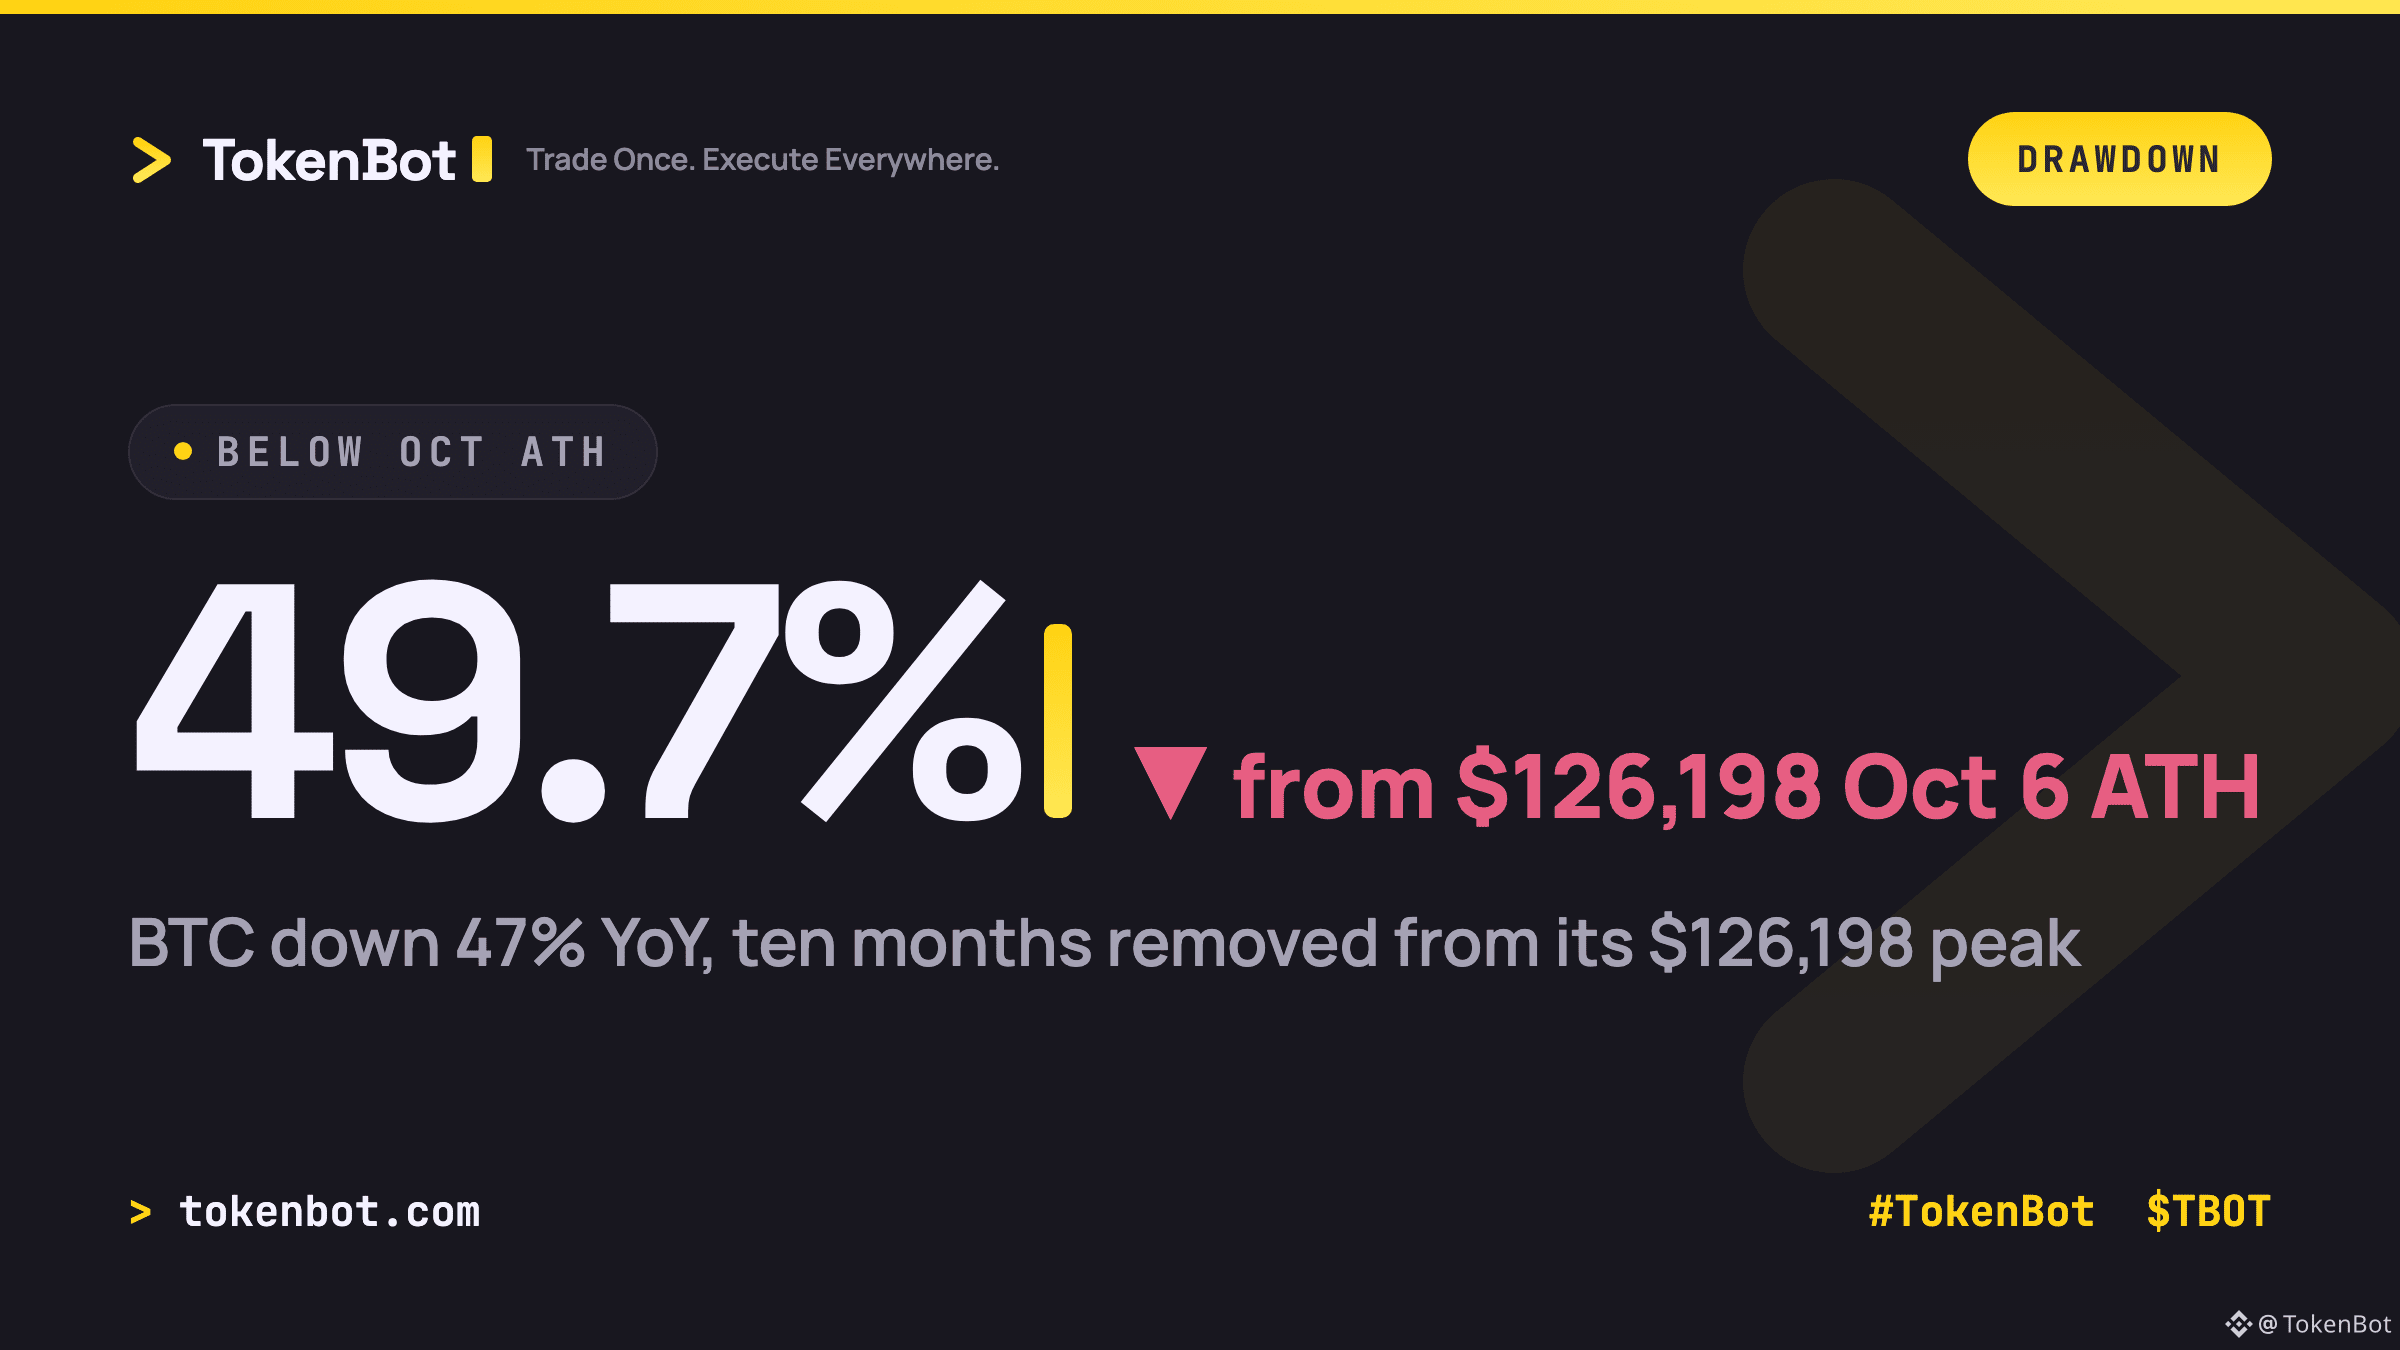
Bitcoin is down 47% over the past year and now sitting almost 50% below its own October all-time high of $126,198. Ten months, top to half-off.
What stands out isn't just the number — it's that every timeframe just turned negative at the same time. Daily, weekly, monthly and yearly changes are all red this morning, the first time that's happened this cycle. Resistance is clustering at $64,500-$65,000, support at $62,000-$62,500; lose that zone and $60K comes back into play.
Round-number drawdowns like "half off the top" tend to draw attention from both sides — dip buyers see a level, trend followers see confirmation. Curious how algo and quant traders here are weighting that signal right now: mean-reversion setup, or momentum keeps working until it doesn't?
If you're running strategies across venues, executing consistently while a chart looks like this matters as much as the thesis itself. That's the problem TokenBot is built for — one order, synced across 25+ exchanges.
#Bitcoin #Crypto #TradingSignals #TokenBot $BTC $TBOT
tokenbot.com
Bitcoin is down 47% over the past year and now sitting almost 50% below its own October all-time high of $126,198. Ten months, top to half-off.
What stands out isn't just the number — it's that every timeframe just turned negative at the same time. Daily, weekly, monthly and yearly changes are all red this morning, the first time that's happened this cycle. Resistance is clustering at $64,500-$65,000, support at $62,000-$62,500; lose that zone and $60K comes back into play.
Round-number drawdowns like "half off the top" tend to draw attention from both sides — dip buyers see a level, trend followers see confirmation. Curious how algo and quant traders here are weighting that signal right now: mean-reversion setup, or momentum keeps working until it doesn't?
If you're running strategies across venues, executing consistently while a chart looks like this matters as much as the thesis itself. That's the problem TokenBot is built for — one order, synced across 25+ exchanges.
#Bitcoin #Crypto #TradingSignals #TokenBot $BTC $TBOT
tokenbot.com
What stands out isn't just the number — it's that every timeframe just turned negative at the same time. Daily, weekly, monthly and yearly changes are all red this morning, the first time that's happened this cycle. Resistance is clustering at $64,500-$65,000, support at $62,000-$62,500; lose that zone and $60K comes back into play.
Round-number drawdowns like "half off the top" tend to draw attention from both sides — dip buyers see a level, trend followers see confirmation. Curious how algo and quant traders here are weighting that signal right now: mean-reversion setup, or momentum keeps working until it doesn't?
If you're running strategies across venues, executing consistently while a chart looks like this matters as much as the thesis itself. That's the problem TokenBot is built for — one order, synced across 25+ exchanges.
#Bitcoin #Crypto #TradingSignals #TokenBot $BTC $TBOT
tokenbot.com
75
·
--
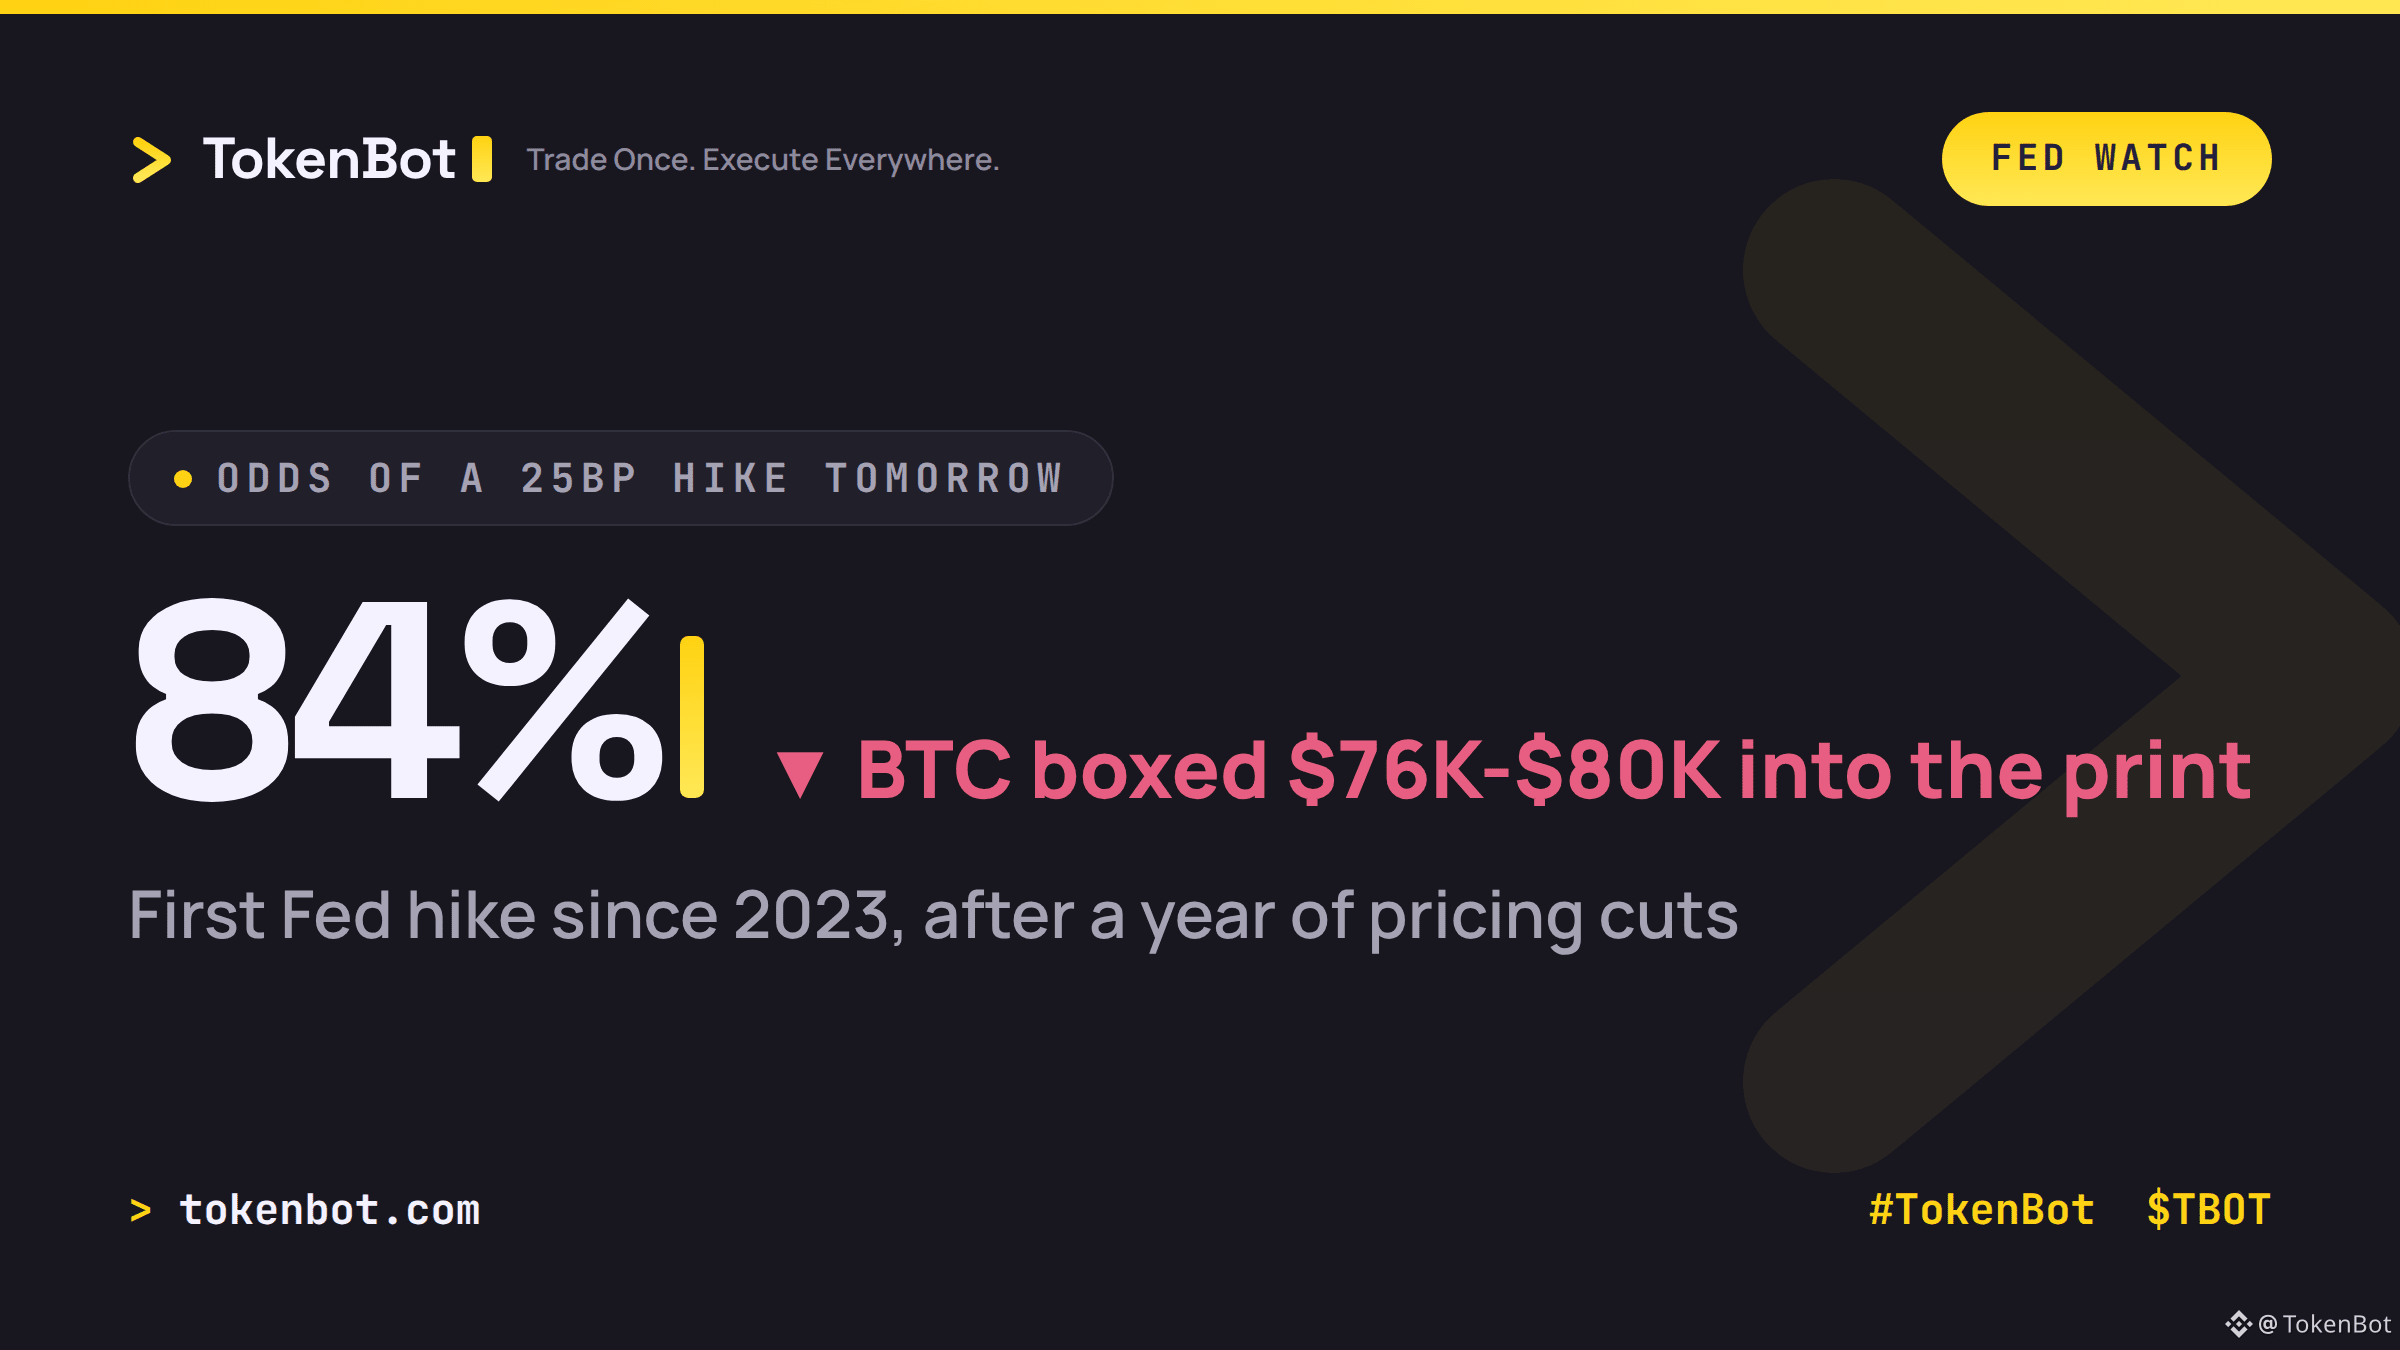
CME FedWatch is pricing an 84% chance the Fed hikes 25bp tomorrow. That would be the first US rate hike since 2023 — a full reversal after a year where the market was positioned for cuts.
The mechanism is simple: a hike pushes real yields and the dollar higher, which is the exact opposite of what's been fueling risk assets all year. Leveraged longs are the ones who pay if it lands. That's why volume has gone thin into the print — nobody wants to be the one holding size when the number crosses the wire.
BTC is boxed $76K-$80K heading into the decision. A hold instead of a hike and $85K opens up fast; a hike and price likely stays caged in the range while the market repriced funding costs.
How are you sizing into a binary macro print like this — trim ahead of it, or let the system work both sides?
#TokenBot #Bitcoin #FOMC #TradingSignals $BTC $TBOT
tokenbot.com
CME FedWatch is pricing an 84% chance the Fed hikes 25bp tomorrow. That would be the first US rate hike since 2023 — a full reversal after a year where the market was positioned for cuts.
The mechanism is simple: a hike pushes real yields and the dollar higher, which is the exact opposite of what's been fueling risk assets all year. Leveraged longs are the ones who pay if it lands. That's why volume has gone thin into the print — nobody wants to be the one holding size when the number crosses the wire.
BTC is boxed $76K-$80K heading into the decision. A hold instead of a hike and $85K opens up fast; a hike and price likely stays caged in the range while the market repriced funding costs.
How are you sizing into a binary macro print like this — trim ahead of it, or let the system work both sides?
#TokenBot #Bitcoin #FOMC #TradingSignals $BTC $TBOT
tokenbot.com
The mechanism is simple: a hike pushes real yields and the dollar higher, which is the exact opposite of what's been fueling risk assets all year. Leveraged longs are the ones who pay if it lands. That's why volume has gone thin into the print — nobody wants to be the one holding size when the number crosses the wire.
BTC is boxed $76K-$80K heading into the decision. A hold instead of a hike and $85K opens up fast; a hike and price likely stays caged in the range while the market repriced funding costs.
How are you sizing into a binary macro print like this — trim ahead of it, or let the system work both sides?
#TokenBot #Bitcoin #FOMC #TradingSignals $BTC $TBOT
tokenbot.com
104
·
--
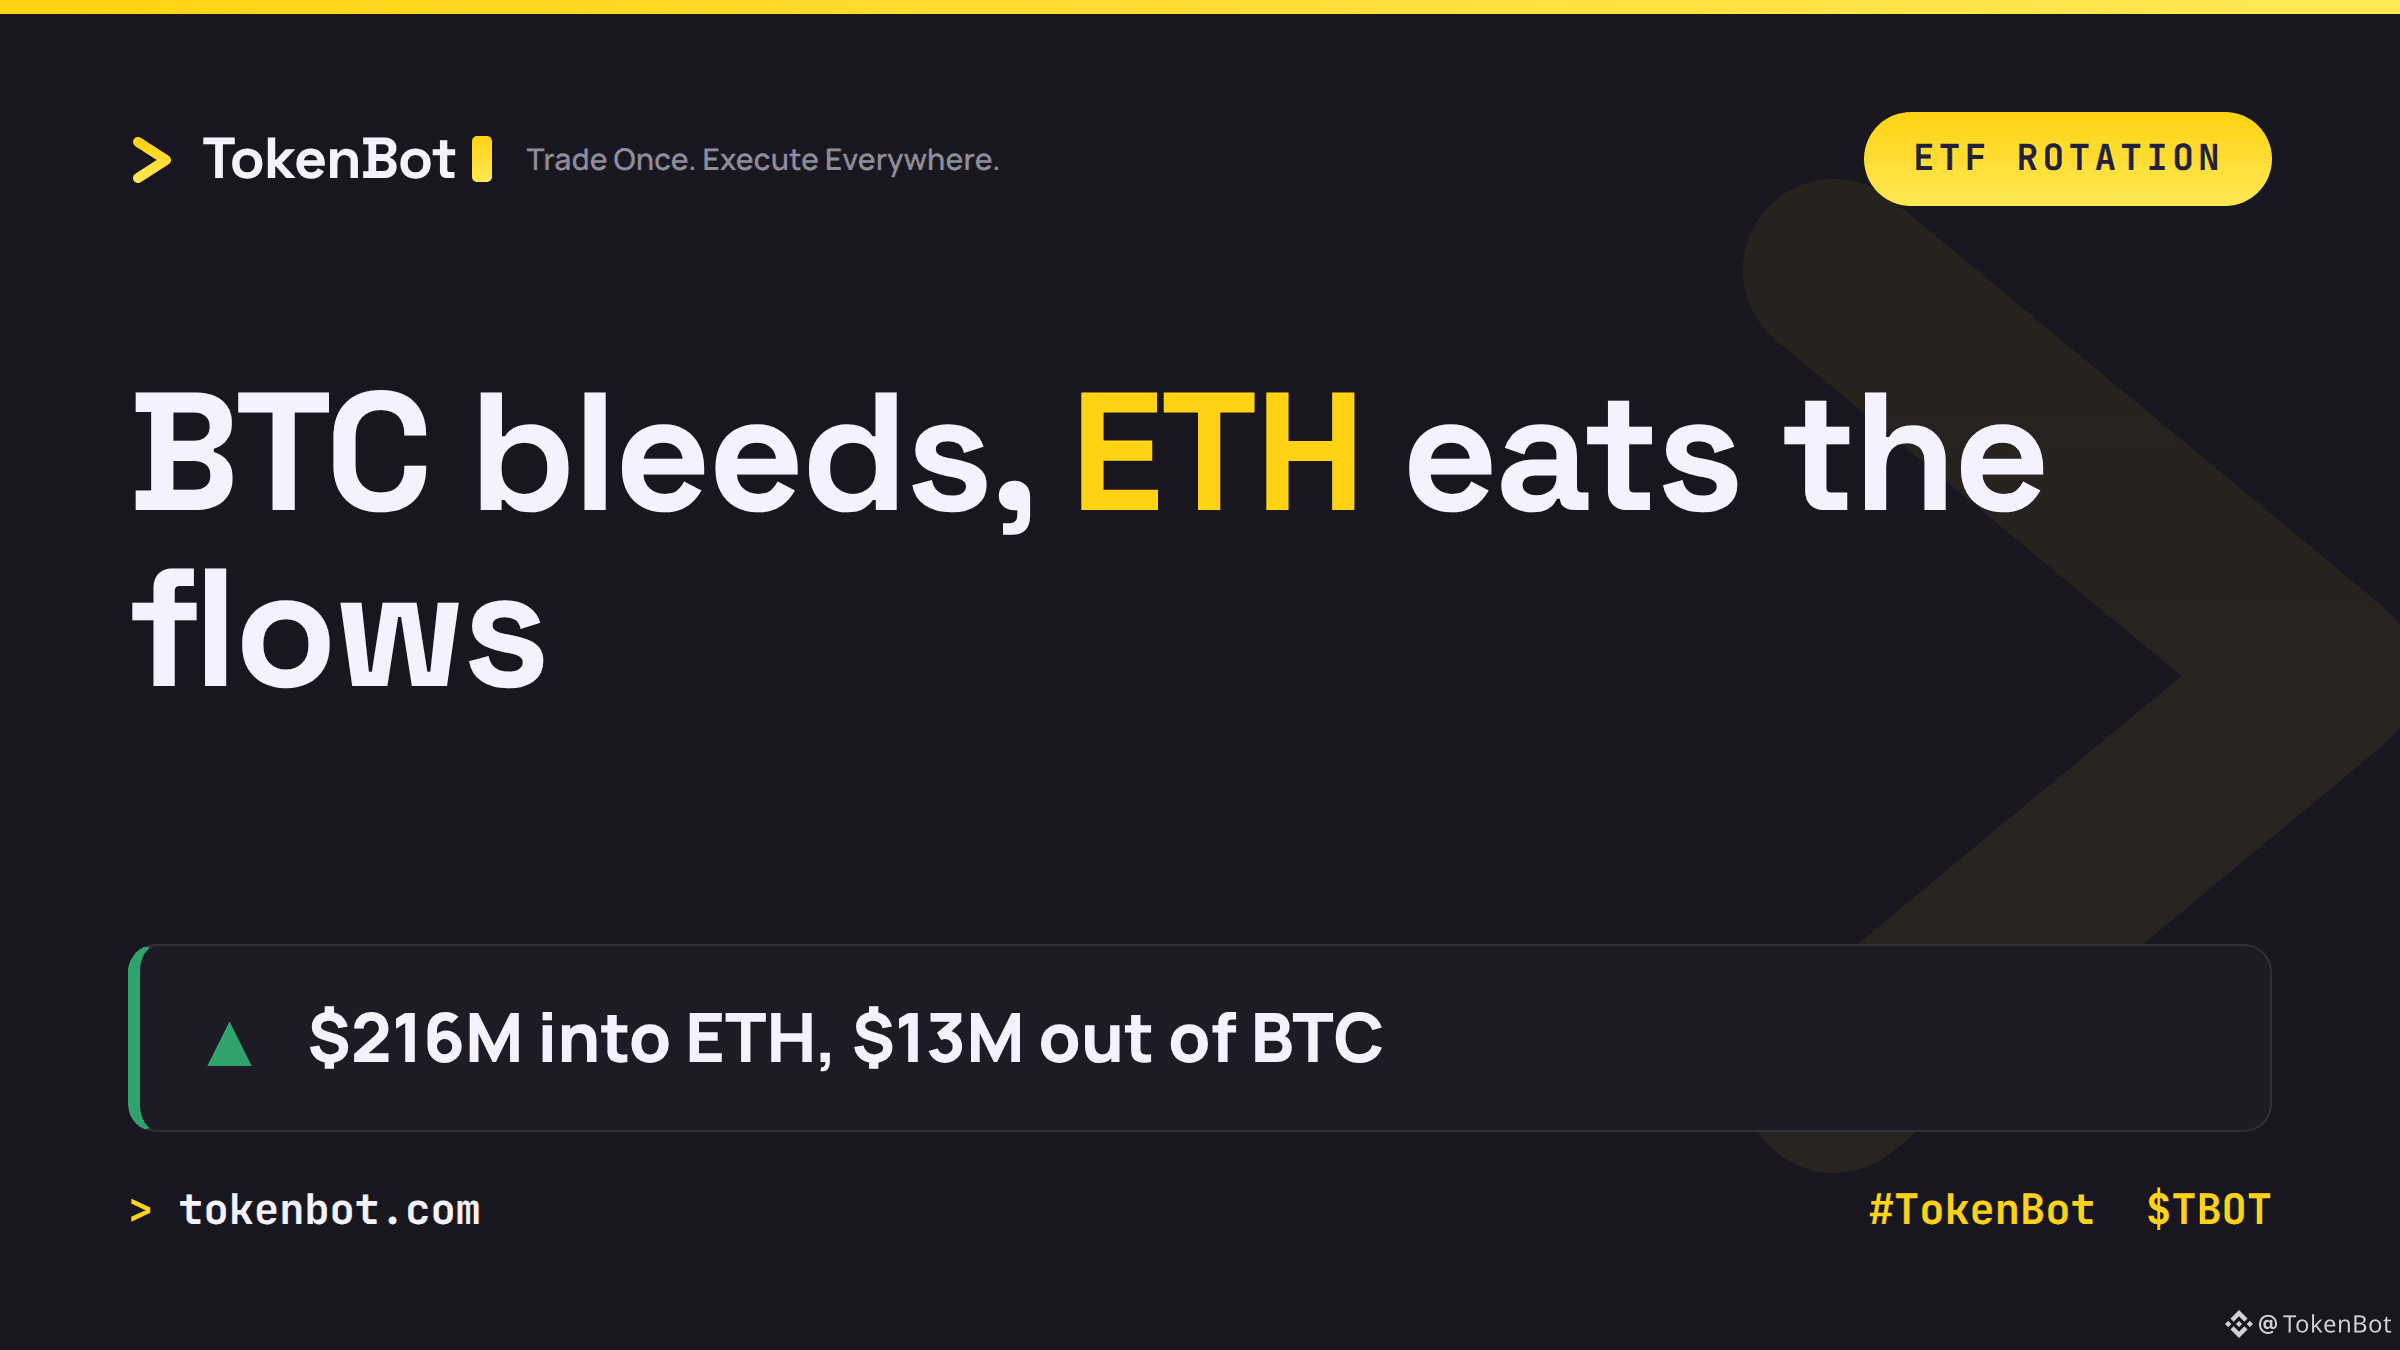
Bitcoin ETFs just logged their 4th straight day of outflows, losing $13.29M on Friday. Ether ETFs took in $216.41M the same day. Same market, opposite direction.
Zoom out and the pattern holds: BTC spot ETFs are down $463M for the week while ETH ETFs are up $197M, their 4th consecutive week of net inflows. This isn't money leaving crypto, it's money leaving Bitcoin exposure and rotating into Ethereum exposure. BlackRock's IBIT alone shed $19.23M even as smaller ETH-focused funds kept absorbing flow.
Worth watching into FOMC week: is this rotation a read on relative rate sensitivity between the two assets, or just funds squaring up before the decision? If you're running spread or pairs exposure across BTC and ETH, which leg are you trimming here?
#TokenBot #Bitcoin #Ethereum #TradingSignals $BTC $ETH $TBOT tokenbot.com
Bitcoin ETFs just logged their 4th straight day of outflows, losing $13.29M on Friday. Ether ETFs took in $216.41M the same day. Same market, opposite direction.
Zoom out and the pattern holds: BTC spot ETFs are down $463M for the week while ETH ETFs are up $197M, their 4th consecutive week of net inflows. This isn't money leaving crypto, it's money leaving Bitcoin exposure and rotating into Ethereum exposure. BlackRock's IBIT alone shed $19.23M even as smaller ETH-focused funds kept absorbing flow.
Worth watching into FOMC week: is this rotation a read on relative rate sensitivity between the two assets, or just funds squaring up before the decision? If you're running spread or pairs exposure across BTC and ETH, which leg are you trimming here?
#TokenBot #Bitcoin #Ethereum #TradingSignals $BTC $ETH $TBOT tokenbot.com
Zoom out and the pattern holds: BTC spot ETFs are down $463M for the week while ETH ETFs are up $197M, their 4th consecutive week of net inflows. This isn't money leaving crypto, it's money leaving Bitcoin exposure and rotating into Ethereum exposure. BlackRock's IBIT alone shed $19.23M even as smaller ETH-focused funds kept absorbing flow.
Worth watching into FOMC week: is this rotation a read on relative rate sensitivity between the two assets, or just funds squaring up before the decision? If you're running spread or pairs exposure across BTC and ETH, which leg are you trimming here?
#TokenBot #Bitcoin #Ethereum #TradingSignals $BTC $ETH $TBOT tokenbot.com
468
·
--
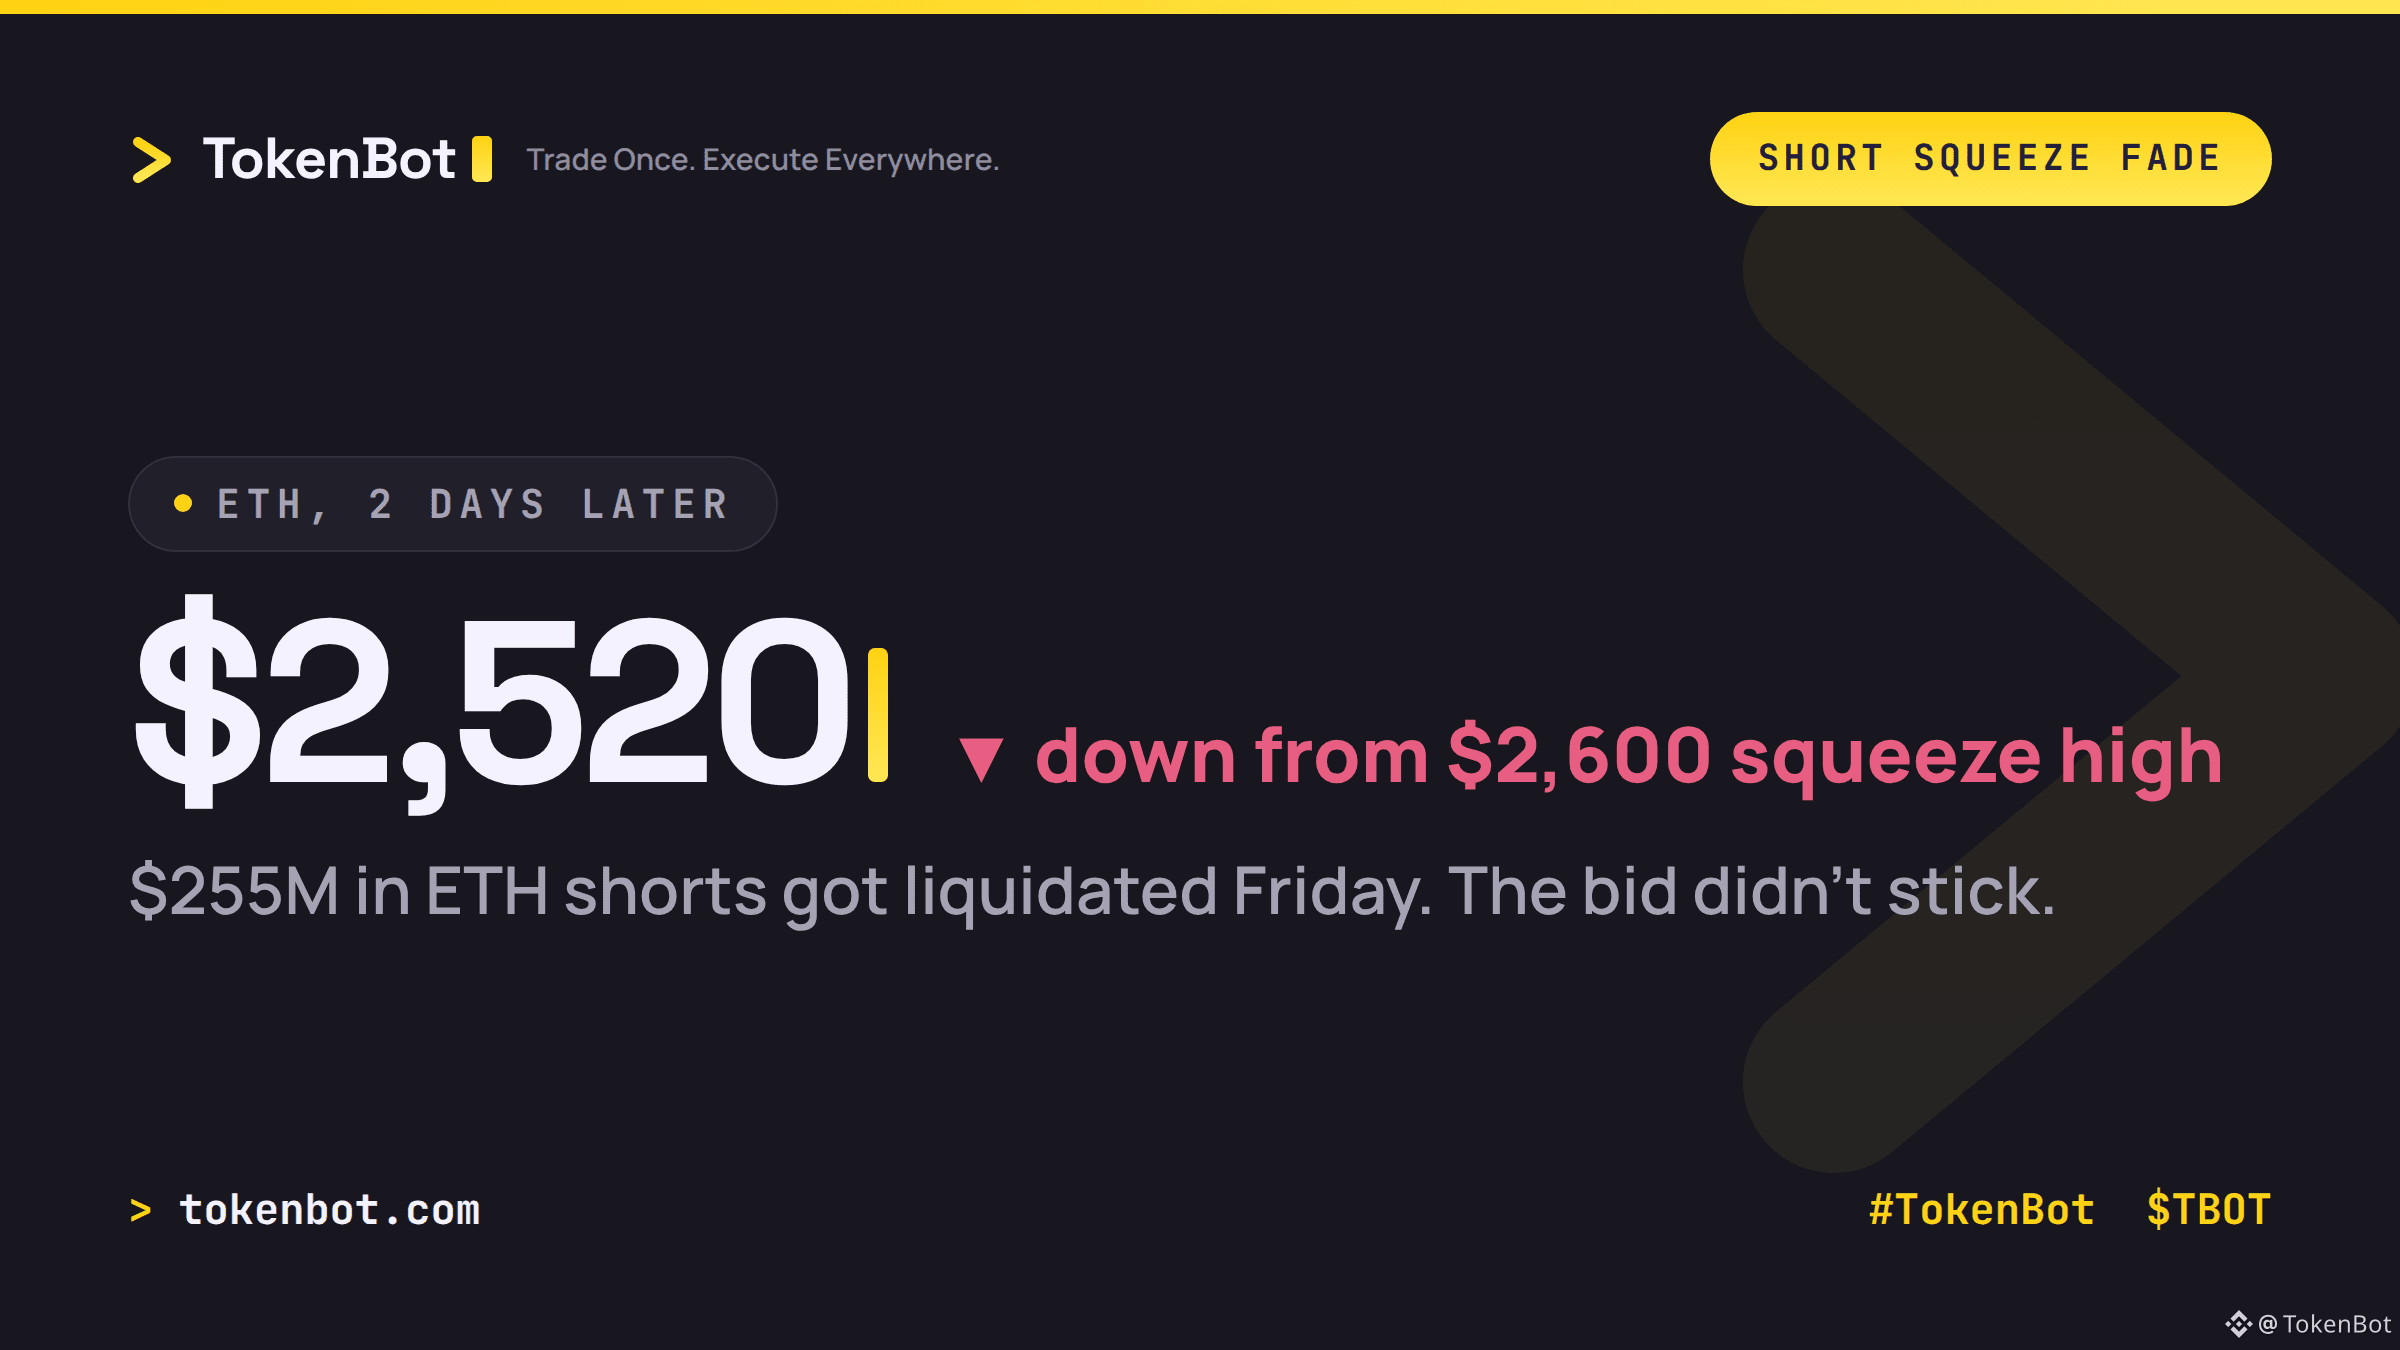
ETH ripped 8.3% Friday, its sharpest intraday move in weeks, on $255M of short liquidations — the first trip above $2,600 in months. Bitcoin shorts got hit too, another $172M wiped out in the same window.
Two days later, ETH is back at $2,520.
That's the tell on squeeze-driven rallies: the move is shorts covering, not new buyers stepping in. Once the leveraged bears are flushed, there's no fresh demand left to hold the level, and price drifts right back toward where it started.
Worth building into signal logic if you're trading breakouts — a $2,600 print backed by $255M of forced covering reads very differently than one backed by spot flow. Are you tagging liquidation-driven moves separately from your models, or treating every breakout the same?
#TokenBot #Ethereum #Bitcoin #TradingSignals $BTC $ETH $TBOT
tokenbot.com
ETH ripped 8.3% Friday, its sharpest intraday move in weeks, on $255M of short liquidations — the first trip above $2,600 in months. Bitcoin shorts got hit too, another $172M wiped out in the same window.
Two days later, ETH is back at $2,520.
That's the tell on squeeze-driven rallies: the move is shorts covering, not new buyers stepping in. Once the leveraged bears are flushed, there's no fresh demand left to hold the level, and price drifts right back toward where it started.
Worth building into signal logic if you're trading breakouts — a $2,600 print backed by $255M of forced covering reads very differently than one backed by spot flow. Are you tagging liquidation-driven moves separately from your models, or treating every breakout the same?
#TokenBot #Ethereum #Bitcoin #TradingSignals $BTC $ETH $TBOT
tokenbot.com
Two days later, ETH is back at $2,520.
That's the tell on squeeze-driven rallies: the move is shorts covering, not new buyers stepping in. Once the leveraged bears are flushed, there's no fresh demand left to hold the level, and price drifts right back toward where it started.
Worth building into signal logic if you're trading breakouts — a $2,600 print backed by $255M of forced covering reads very differently than one backed by spot flow. Are you tagging liquidation-driven moves separately from your models, or treating every breakout the same?
#TokenBot #Ethereum #Bitcoin #TradingSignals $BTC $ETH $TBOT
tokenbot.com
140
·
--
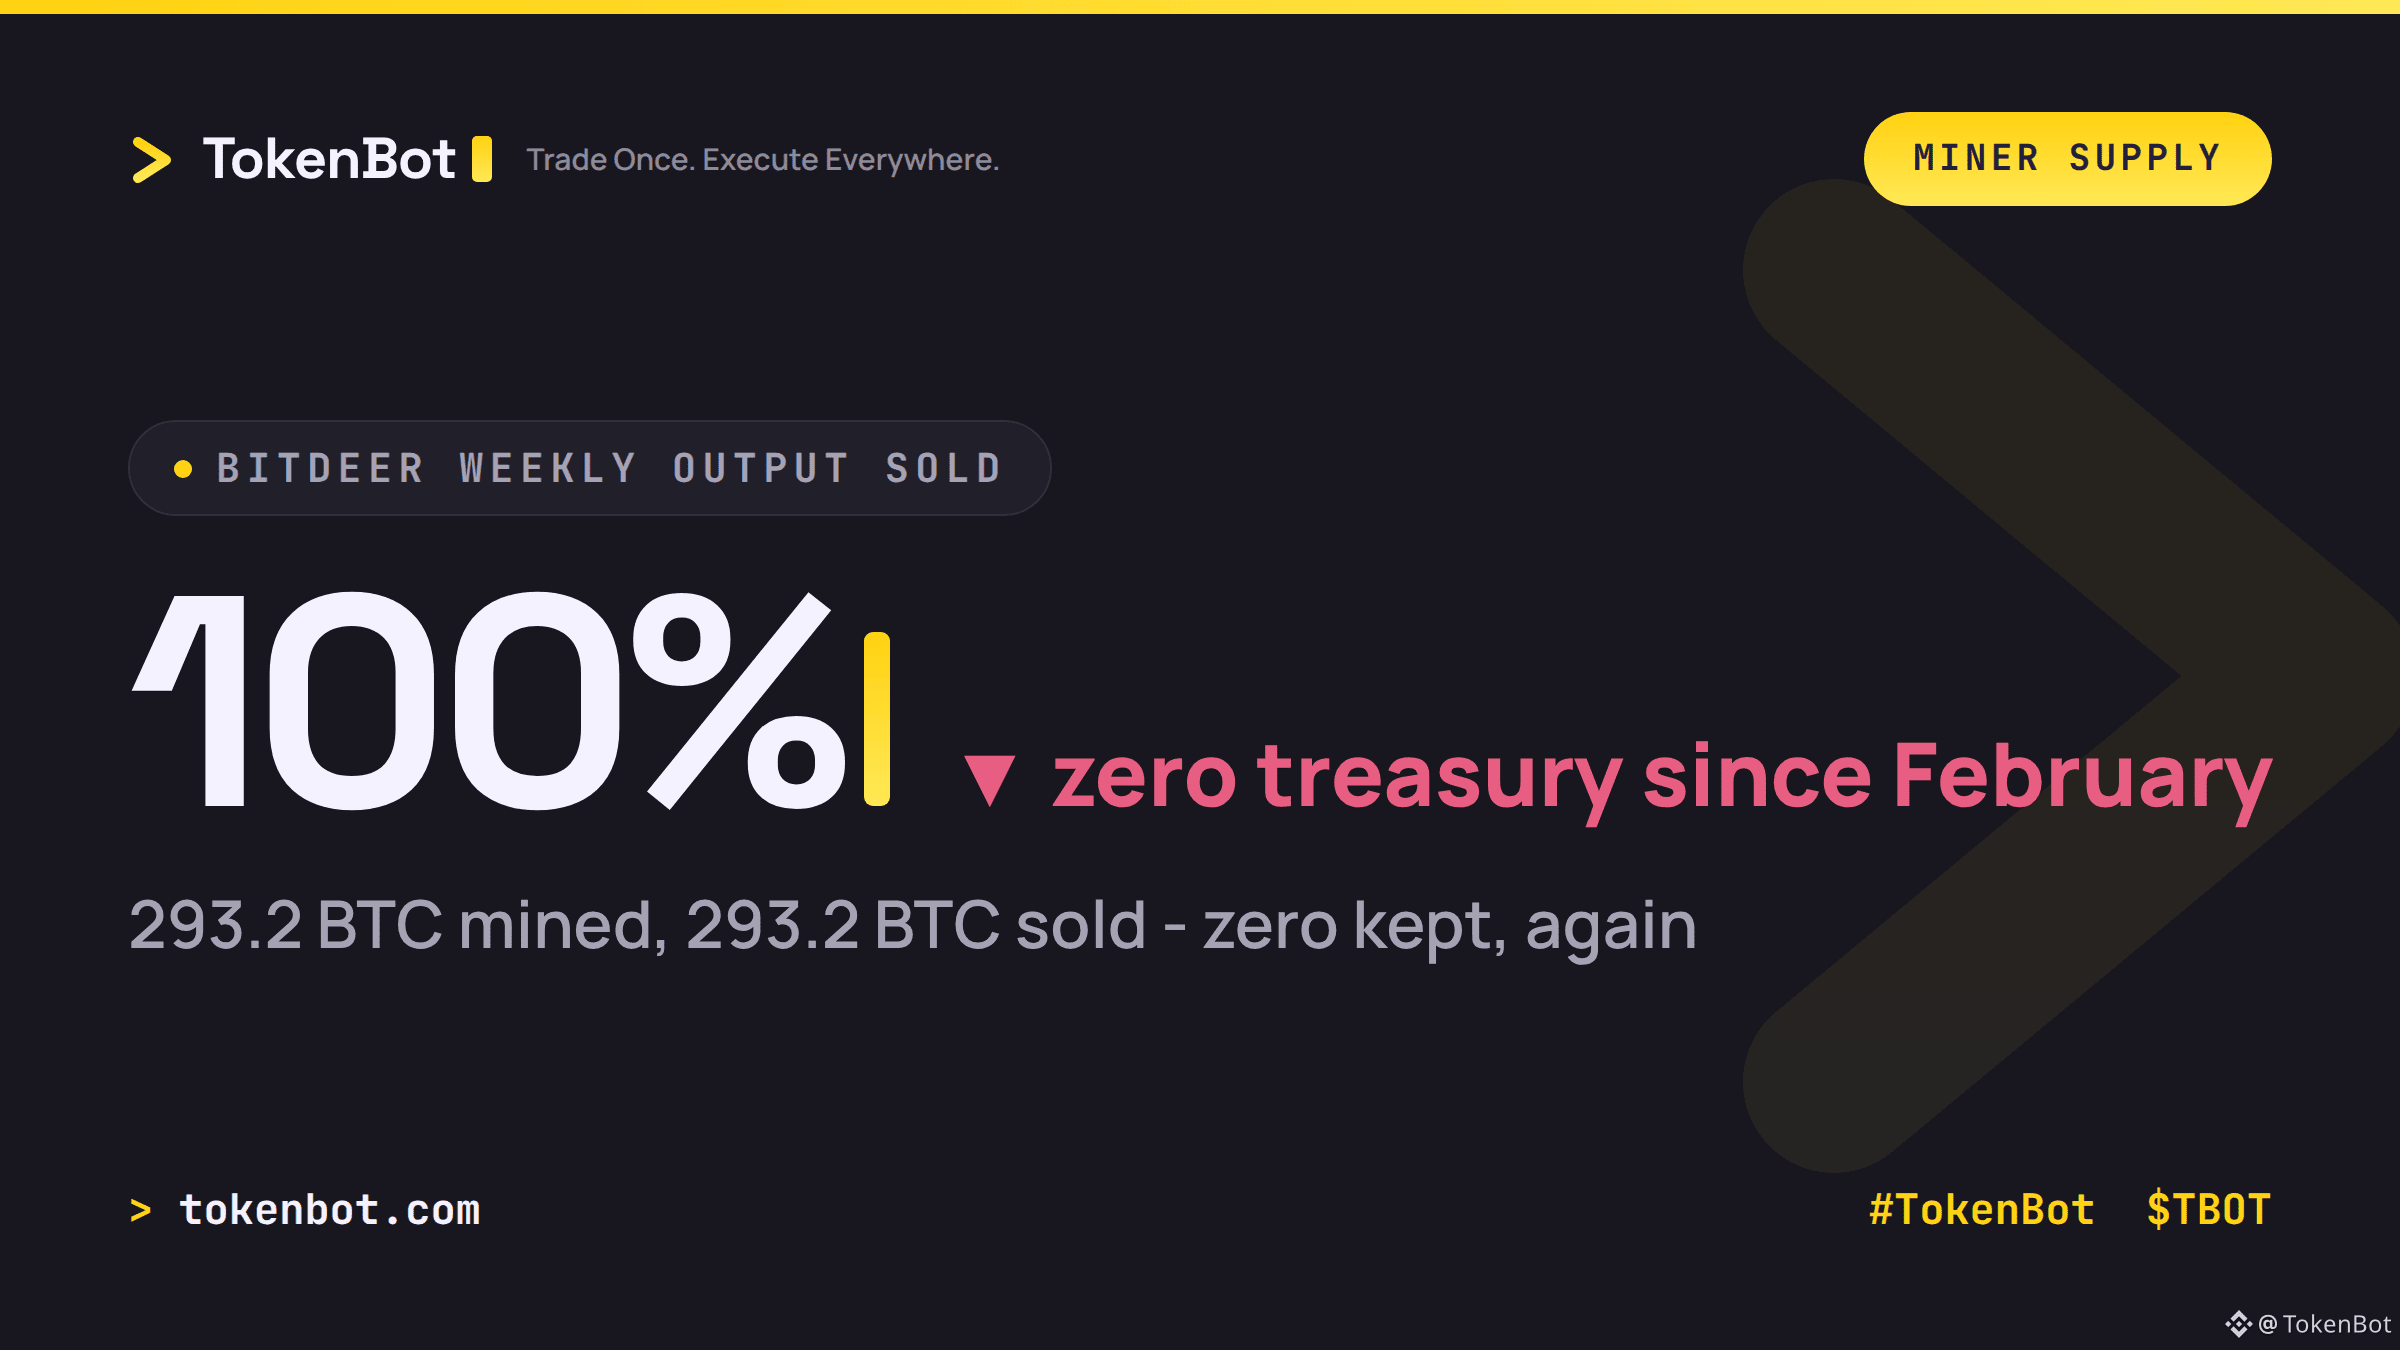
Bitdeer mined 293.2 BTC last week. It sold every single coin — zero BTC held in treasury, the same as every week since February.
That's not a one-off. A Nasdaq-listed miner is now running bitcoin as a cash-flow instrument instead of a balance-sheet asset, funneling fresh supply straight into fiat to fund its AI/HPC buildout. The old miner playbook was hold-through-halving; the new one is sell-on-mint.
Worth tracking: when the biggest structural sellers in the market refuse to hold their own output, who's actually absorbing that supply on every dip?
Trade the read, not just the headline — tokenbot.com
$BTC $TBOT #TokenBot #Bitcoin #Mining
Bitdeer mined 293.2 BTC last week. It sold every single coin — zero BTC held in treasury, the same as every week since February.
That's not a one-off. A Nasdaq-listed miner is now running bitcoin as a cash-flow instrument instead of a balance-sheet asset, funneling fresh supply straight into fiat to fund its AI/HPC buildout. The old miner playbook was hold-through-halving; the new one is sell-on-mint.
Worth tracking: when the biggest structural sellers in the market refuse to hold their own output, who's actually absorbing that supply on every dip?
Trade the read, not just the headline — tokenbot.com
$BTC $TBOT #TokenBot #Bitcoin #Mining
That's not a one-off. A Nasdaq-listed miner is now running bitcoin as a cash-flow instrument instead of a balance-sheet asset, funneling fresh supply straight into fiat to fund its AI/HPC buildout. The old miner playbook was hold-through-halving; the new one is sell-on-mint.
Worth tracking: when the biggest structural sellers in the market refuse to hold their own output, who's actually absorbing that supply on every dip?
Trade the read, not just the headline — tokenbot.com
$BTC $TBOT #TokenBot #Bitcoin #Mining
71
·
--
Bitcoin ETFs just posted their worst single day since July 13. US spot BTC ETFs bled $283M on Thursday, and the three-day total is now $449M out — the biggest outflow stretch since that July selloff.
It's not evenly spread. ARKB (ARK 21Shares) alone accounted for $164M of Thursday's total, more than half. GBTC and FBTC each lost a more modest $30-40M. That's a concentration story, not a broad exodus — one fund's redemptions doing most of the damage while BTC ETF AUM still sits near $97.5B.
Mechanically, ETF outflows mean authorized participants are redeeming shares and the issuer is selling spot BTC to fund it — real spot supply hitting the market, not just derivatives churn. Worth separating from the leverage/liquidation flush from earlier this week.
Is anyone here actually tracking ARKB's create/redeem flow as a leading indicator, or treating single-fund outflows as noise until the AUM/market-cap ratio breaks meaningfully?
$BTC $TBOT #Bitcoin #TokenBot #TradingSignals
tokenbot.com
Bitcoin ETFs just posted their worst single day since July 13. US spot BTC ETFs bled $283M on Thursday, and the three-day total is now $449M out — the biggest outflow stretch since that July selloff.
It's not evenly spread. ARKB (ARK 21Shares) alone accounted for $164M of Thursday's total, more than half. GBTC and FBTC each lost a more modest $30-40M. That's a concentration story, not a broad exodus — one fund's redemptions doing most of the damage while BTC ETF AUM still sits near $97.5B.
Mechanically, ETF outflows mean authorized participants are redeeming shares and the issuer is selling spot BTC to fund it — real spot supply hitting the market, not just derivatives churn. Worth separating from the leverage/liquidation flush from earlier this week.
Is anyone here actually tracking ARKB's create/redeem flow as a leading indicator, or treating single-fund outflows as noise until the AUM/market-cap ratio breaks meaningfully?
$BTC $TBOT #Bitcoin #TokenBot #TradingSignals
tokenbot.com
It's not evenly spread. ARKB (ARK 21Shares) alone accounted for $164M of Thursday's total, more than half. GBTC and FBTC each lost a more modest $30-40M. That's a concentration story, not a broad exodus — one fund's redemptions doing most of the damage while BTC ETF AUM still sits near $97.5B.
Mechanically, ETF outflows mean authorized participants are redeeming shares and the issuer is selling spot BTC to fund it — real spot supply hitting the market, not just derivatives churn. Worth separating from the leverage/liquidation flush from earlier this week.
Is anyone here actually tracking ARKB's create/redeem flow as a leading indicator, or treating single-fund outflows as noise until the AUM/market-cap ratio breaks meaningfully?
$BTC $TBOT #Bitcoin #TokenBot #TradingSignals
tokenbot.com

BTC-3.37%
ARKBETF-0.47%
1.1k
·
--
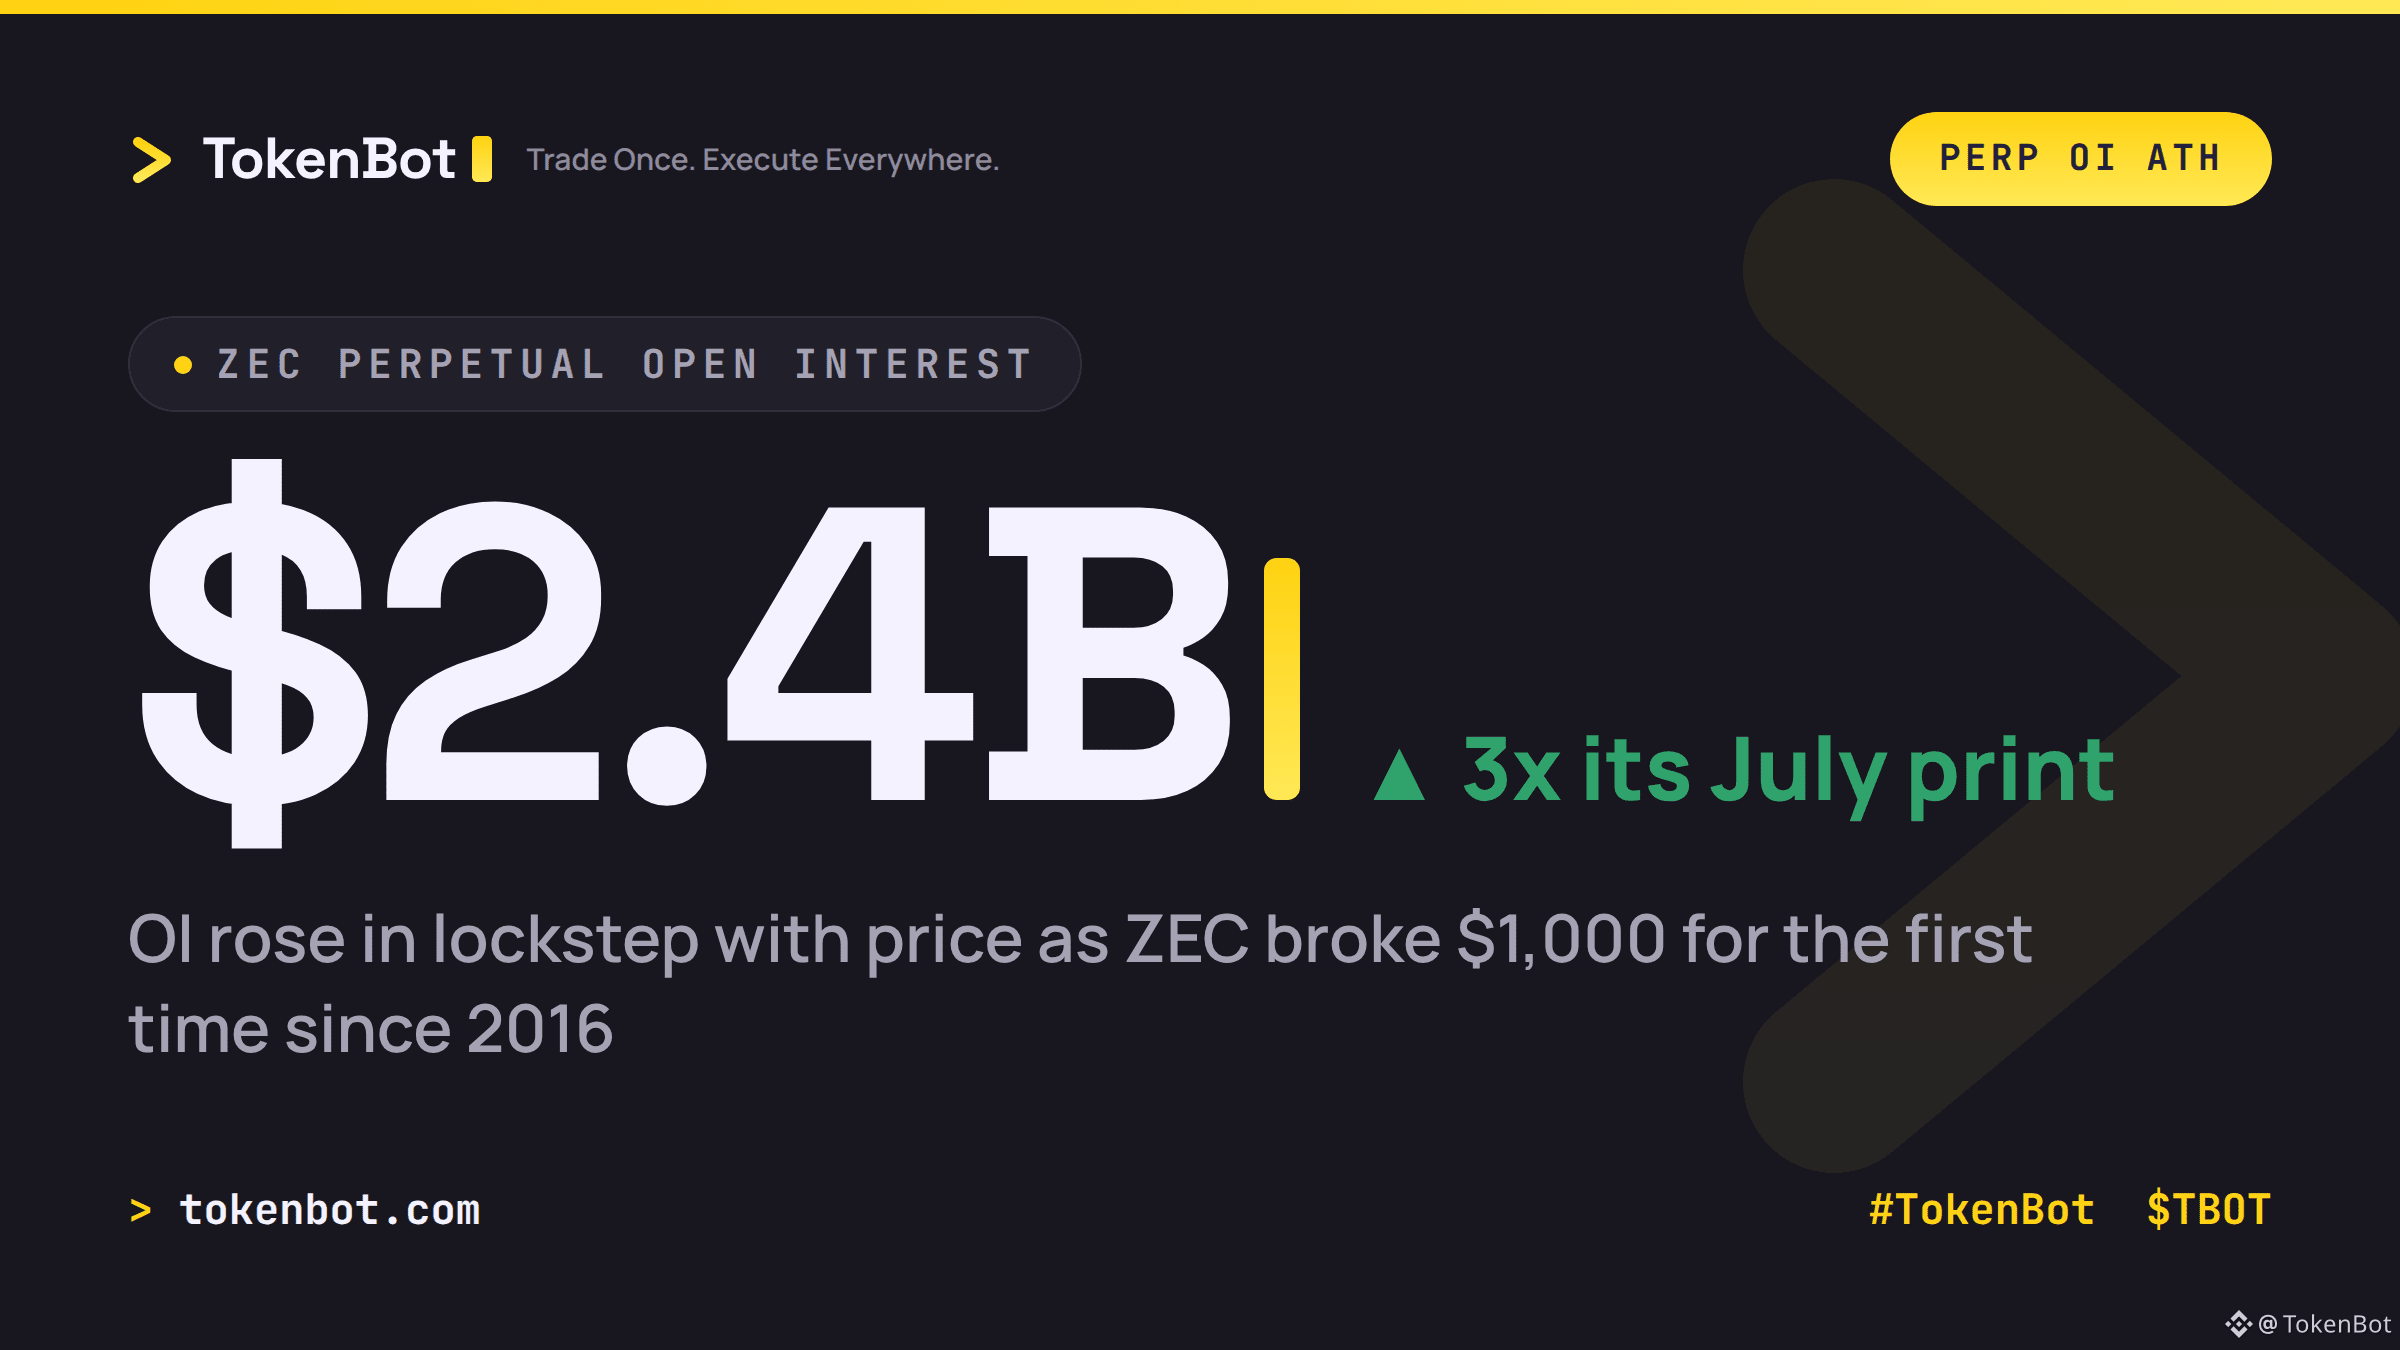
ZEC broke $1,000 for the first time since 2016, and it wasn't a clean breakout — $36.6M got liquidated in 24 hours doing it, most of it shorts caught leaning the wrong way. Perp open interest hit a $2.4B all-time high, more than 3x where it sat back in July (via @coinglass_com).
The part worth watching: OI didn't trail the price higher, it moved in near lockstep with it. That's leverage building into the rally in real time, not spot buyers accumulating quietly and derivatives catching up later. When positioning gets built that way, the unwind tends to be just as violent as the run-up — a move in the other direction doesn't need much to trigger a cascade of its own.
Grayscale's spot Zcash ETF (ZCSH) going live on NYSE Arca in late August gave the move a legitimate demand story, so this isn't pure momentum chasing. But $2.4B in perp exposure stacked on a coin that traded under $700M OI in July is a lot of leverage riding on that narrative holding.
Anyone actually hedged into this move, or is it one-way perp exposure across the board right now?
#Zcash #Crypto #TradingSignals #TokenBot $ZEC $TBOT
tokenbot.com
ZEC broke $1,000 for the first time since 2016, and it wasn't a clean breakout — $36.6M got liquidated in 24 hours doing it, most of it shorts caught leaning the wrong way. Perp open interest hit a $2.4B all-time high, more than 3x where it sat back in July (via @coinglass_com).
The part worth watching: OI didn't trail the price higher, it moved in near lockstep with it. That's leverage building into the rally in real time, not spot buyers accumulating quietly and derivatives catching up later. When positioning gets built that way, the unwind tends to be just as violent as the run-up — a move in the other direction doesn't need much to trigger a cascade of its own.
Grayscale's spot Zcash ETF (ZCSH) going live on NYSE Arca in late August gave the move a legitimate demand story, so this isn't pure momentum chasing. But $2.4B in perp exposure stacked on a coin that traded under $700M OI in July is a lot of leverage riding on that narrative holding.
Anyone actually hedged into this move, or is it one-way perp exposure across the board right now?
#Zcash #Crypto #TradingSignals #TokenBot $ZEC $TBOT
tokenbot.com
The part worth watching: OI didn't trail the price higher, it moved in near lockstep with it. That's leverage building into the rally in real time, not spot buyers accumulating quietly and derivatives catching up later. When positioning gets built that way, the unwind tends to be just as violent as the run-up — a move in the other direction doesn't need much to trigger a cascade of its own.
Grayscale's spot Zcash ETF (ZCSH) going live on NYSE Arca in late August gave the move a legitimate demand story, so this isn't pure momentum chasing. But $2.4B in perp exposure stacked on a coin that traded under $700M OI in July is a lot of leverage riding on that narrative holding.
Anyone actually hedged into this move, or is it one-way perp exposure across the board right now?
#Zcash #Crypto #TradingSignals #TokenBot $ZEC $TBOT
tokenbot.com
117
·
--
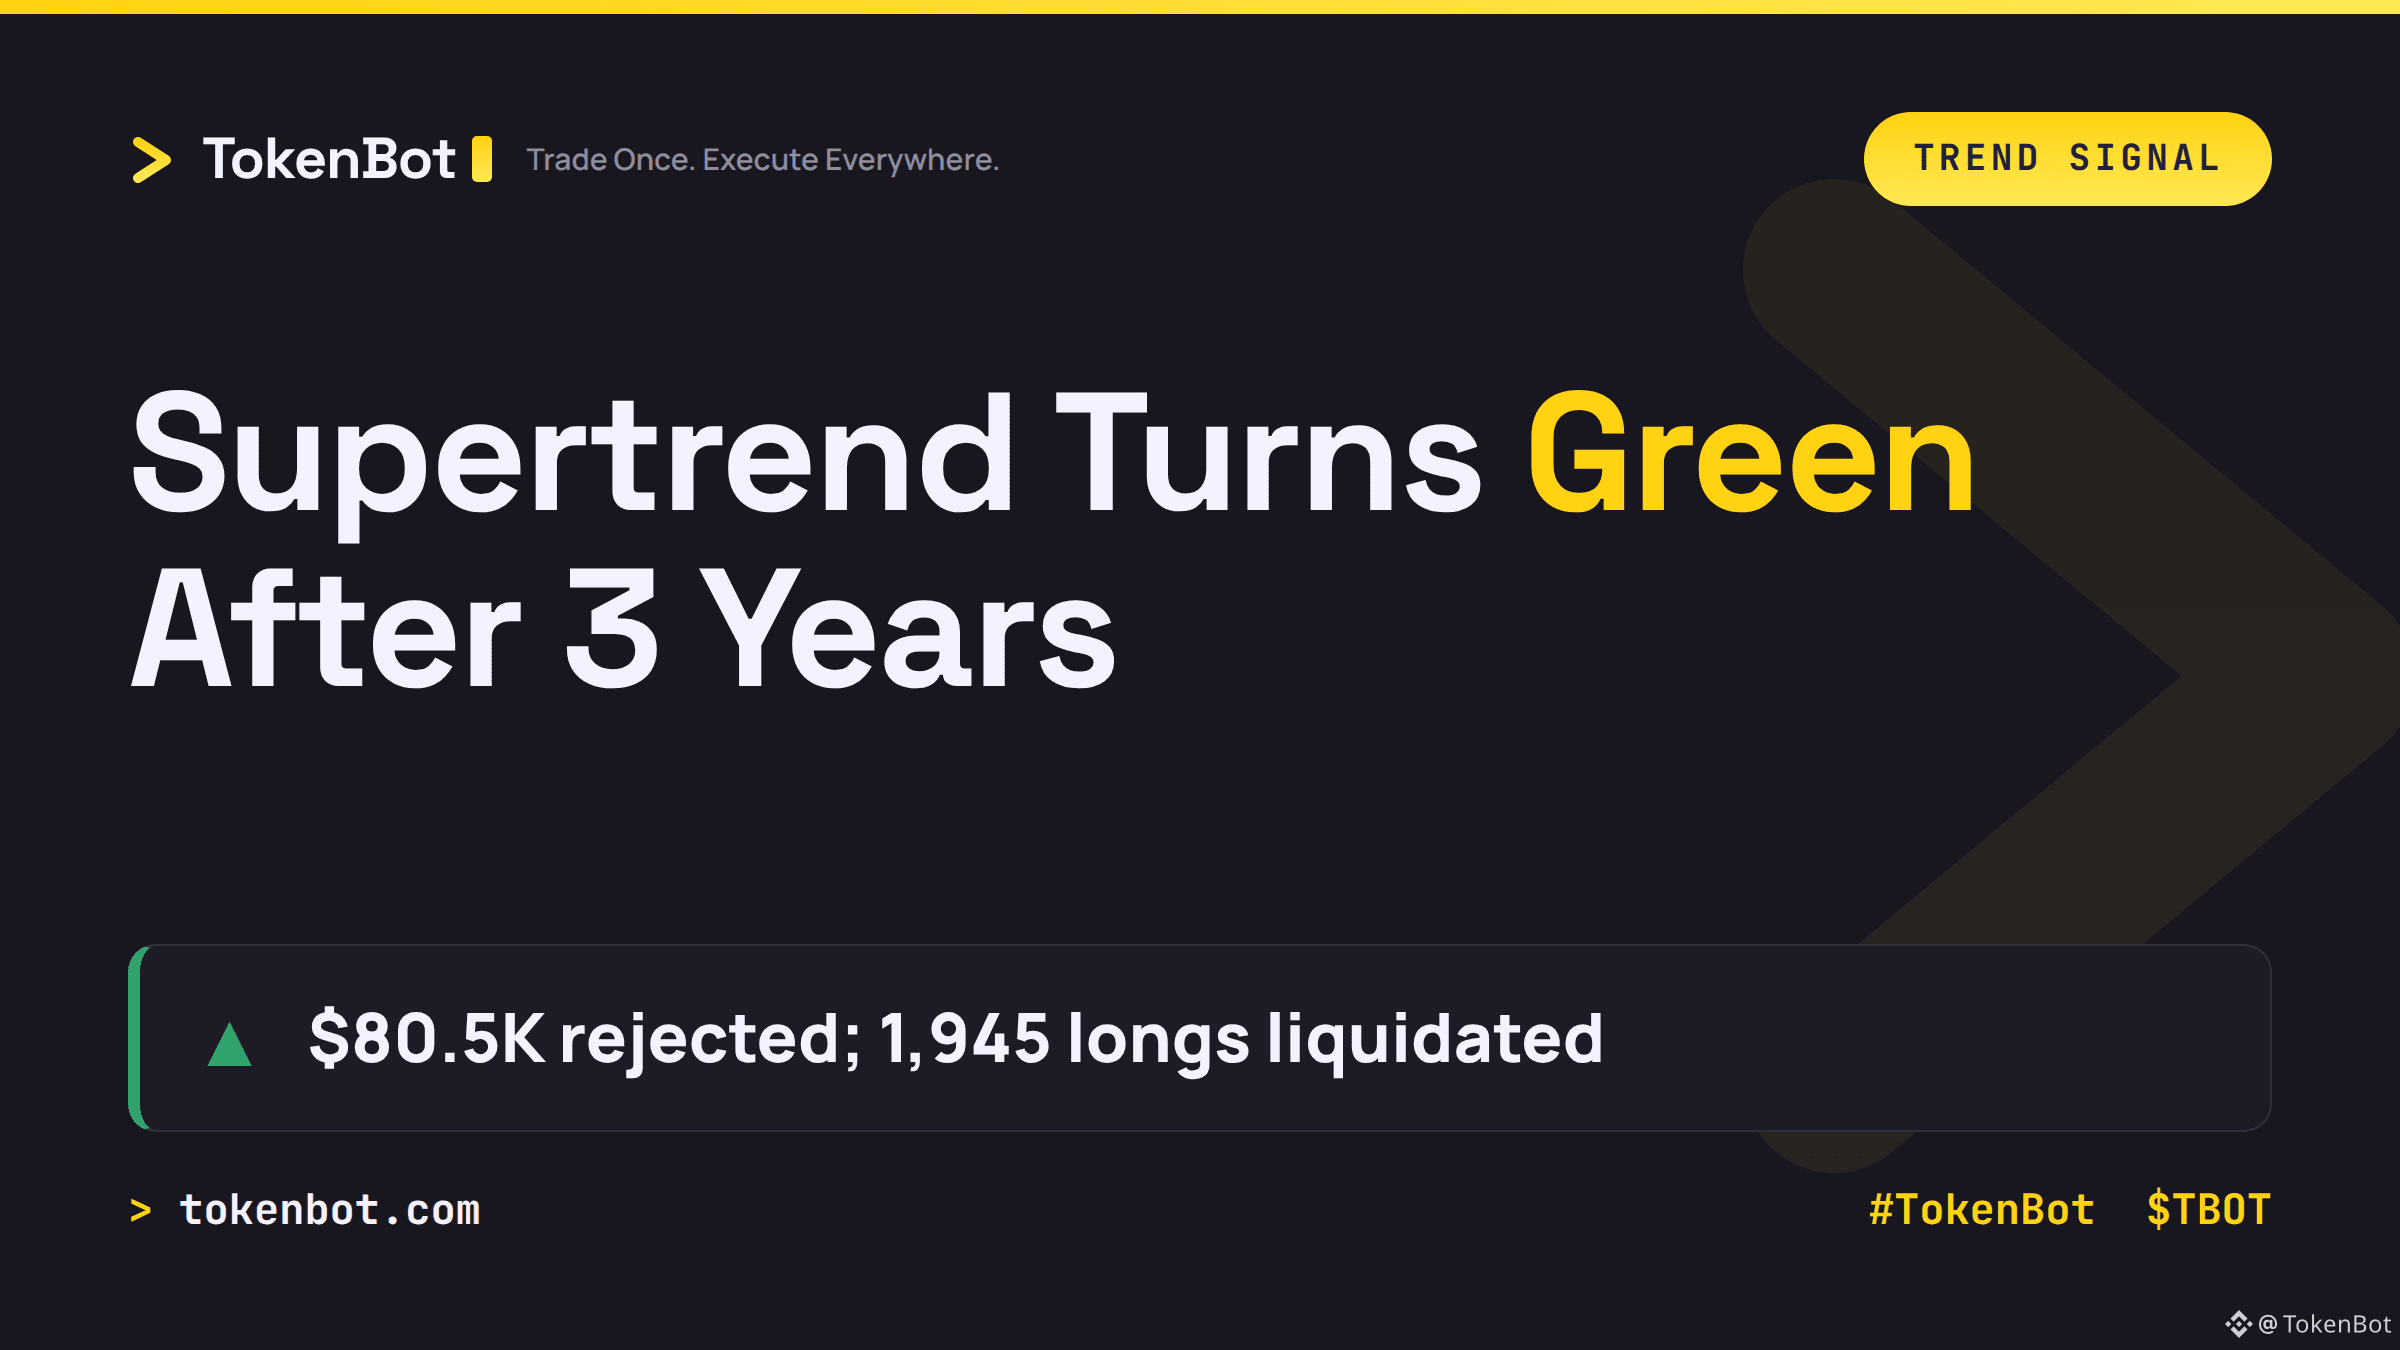
BTC's weekly Supertrend just flipped green for the first time since January 2023. That's a close above the trend line on the weekly chart — and per its track record, that flip has never printed while price was still inside a bear market.
The catch: it happened in the same stretch where $80,500 got rejected on the upside. In the four hours around that rejection, CoinGlass counted 961 long liquidations against 181 shorts — and over the full 24 hours, 1,945 longs got liquidated versus 1,360 shorts. Leverage got flushed exactly where a bullish technical signal turned on.
That's the tension right now: a multi-year trend indicator says the regime has shifted, while short-term positioning says traders are still getting caught leaning long into resistance. One of these is noise. Which one are you actually trading off of at $80K?
#TokenBot #Bitcoin #TradingSignals $BTC $TBOT
tokenbot.com
BTC's weekly Supertrend just flipped green for the first time since January 2023. That's a close above the trend line on the weekly chart — and per its track record, that flip has never printed while price was still inside a bear market.
The catch: it happened in the same stretch where $80,500 got rejected on the upside. In the four hours around that rejection, CoinGlass counted 961 long liquidations against 181 shorts — and over the full 24 hours, 1,945 longs got liquidated versus 1,360 shorts. Leverage got flushed exactly where a bullish technical signal turned on.
That's the tension right now: a multi-year trend indicator says the regime has shifted, while short-term positioning says traders are still getting caught leaning long into resistance. One of these is noise. Which one are you actually trading off of at $80K?
#TokenBot #Bitcoin #TradingSignals $BTC $TBOT
tokenbot.com
The catch: it happened in the same stretch where $80,500 got rejected on the upside. In the four hours around that rejection, CoinGlass counted 961 long liquidations against 181 shorts — and over the full 24 hours, 1,945 longs got liquidated versus 1,360 shorts. Leverage got flushed exactly where a bullish technical signal turned on.
That's the tension right now: a multi-year trend indicator says the regime has shifted, while short-term positioning says traders are still getting caught leaning long into resistance. One of these is noise. Which one are you actually trading off of at $80K?
#TokenBot #Bitcoin #TradingSignals $BTC $TBOT
tokenbot.com
49
·
--
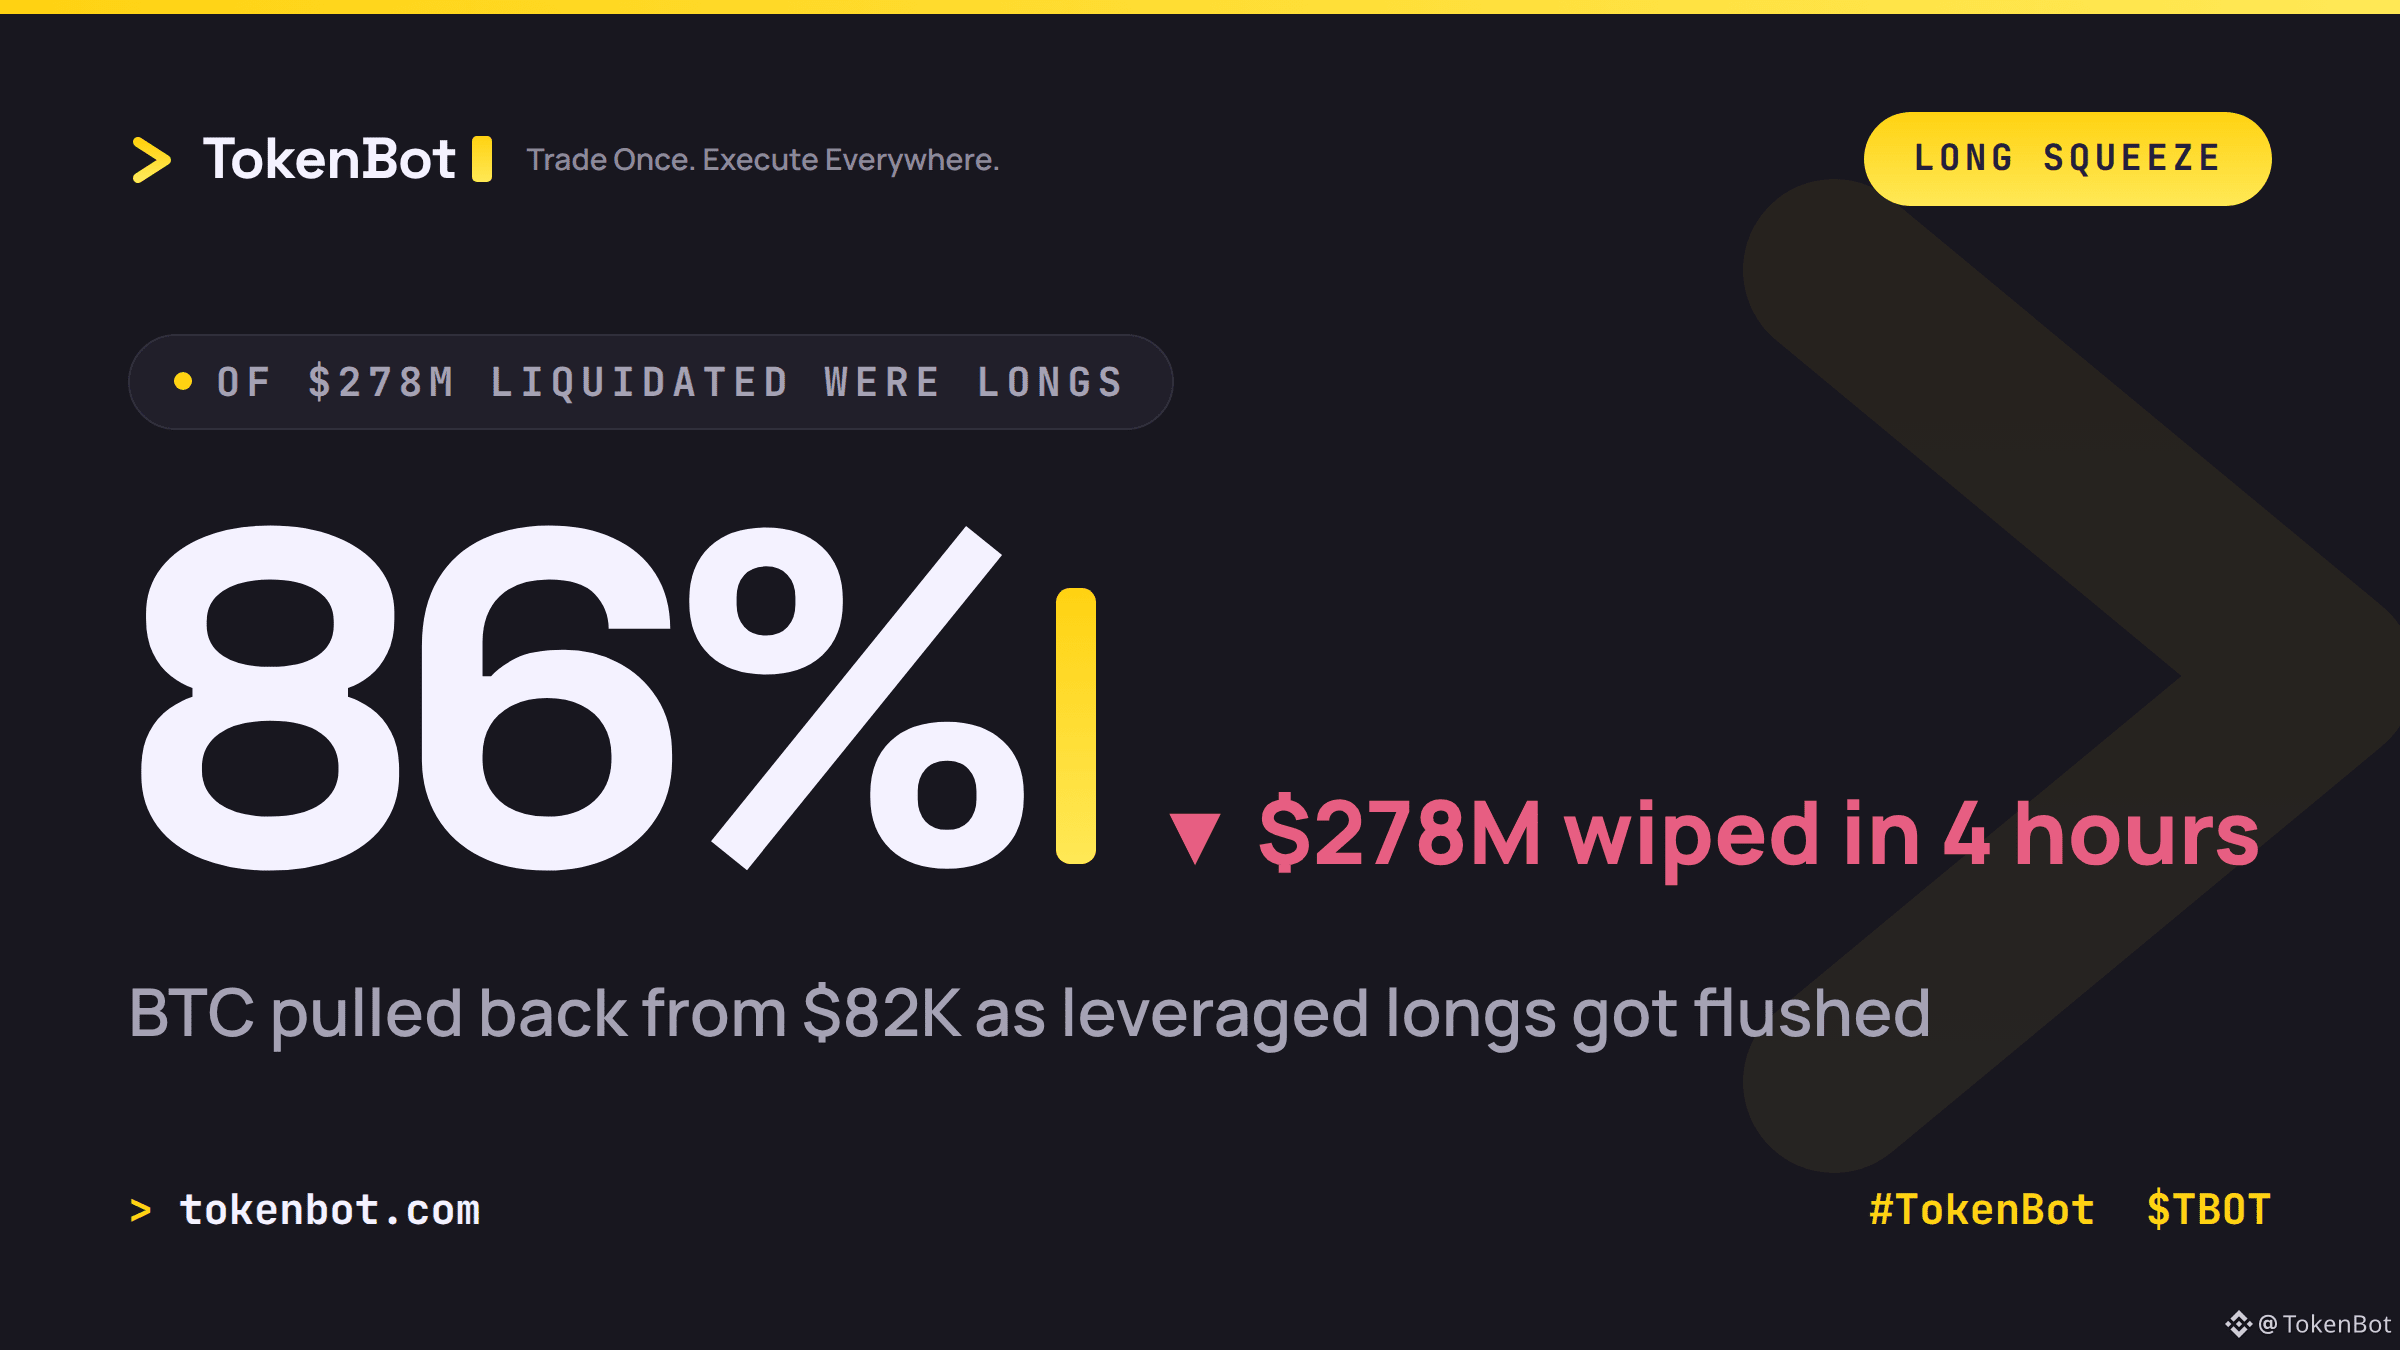
BTC pulled back from above $82K to the $80K zone this weekend, and it wasn't just profit-taking — $278M in leveraged derivatives positions got liquidated in a 4-hour window, with roughly 86% of that being long positions.
The mechanism: stronger-than-expected US jobs data cut the odds of a near-term Fed rate cut, and it was the crowded long exposure that paid for it first. Aggregate BTC futures open interest has already eased over the past week as traders trim risk ahead of the next catalyst — CPI lands September 11, and another hot print could trigger the next flush.
If you're running systematic strategies, how are you sizing into CPI week: cutting leverage now, or waiting for the print?
$BTC $TBOT #TokenBot #Bitcoin #CPI
BTC pulled back from above $82K to the $80K zone this weekend, and it wasn't just profit-taking — $278M in leveraged derivatives positions got liquidated in a 4-hour window, with roughly 86% of that being long positions.
The mechanism: stronger-than-expected US jobs data cut the odds of a near-term Fed rate cut, and it was the crowded long exposure that paid for it first. Aggregate BTC futures open interest has already eased over the past week as traders trim risk ahead of the next catalyst — CPI lands September 11, and another hot print could trigger the next flush.
If you're running systematic strategies, how are you sizing into CPI week: cutting leverage now, or waiting for the print?
$BTC $TBOT #TokenBot #Bitcoin #CPI
The mechanism: stronger-than-expected US jobs data cut the odds of a near-term Fed rate cut, and it was the crowded long exposure that paid for it first. Aggregate BTC futures open interest has already eased over the past week as traders trim risk ahead of the next catalyst — CPI lands September 11, and another hot print could trigger the next flush.
If you're running systematic strategies, how are you sizing into CPI week: cutting leverage now, or waiting for the print?
$BTC $TBOT #TokenBot #Bitcoin #CPI
96
·
--
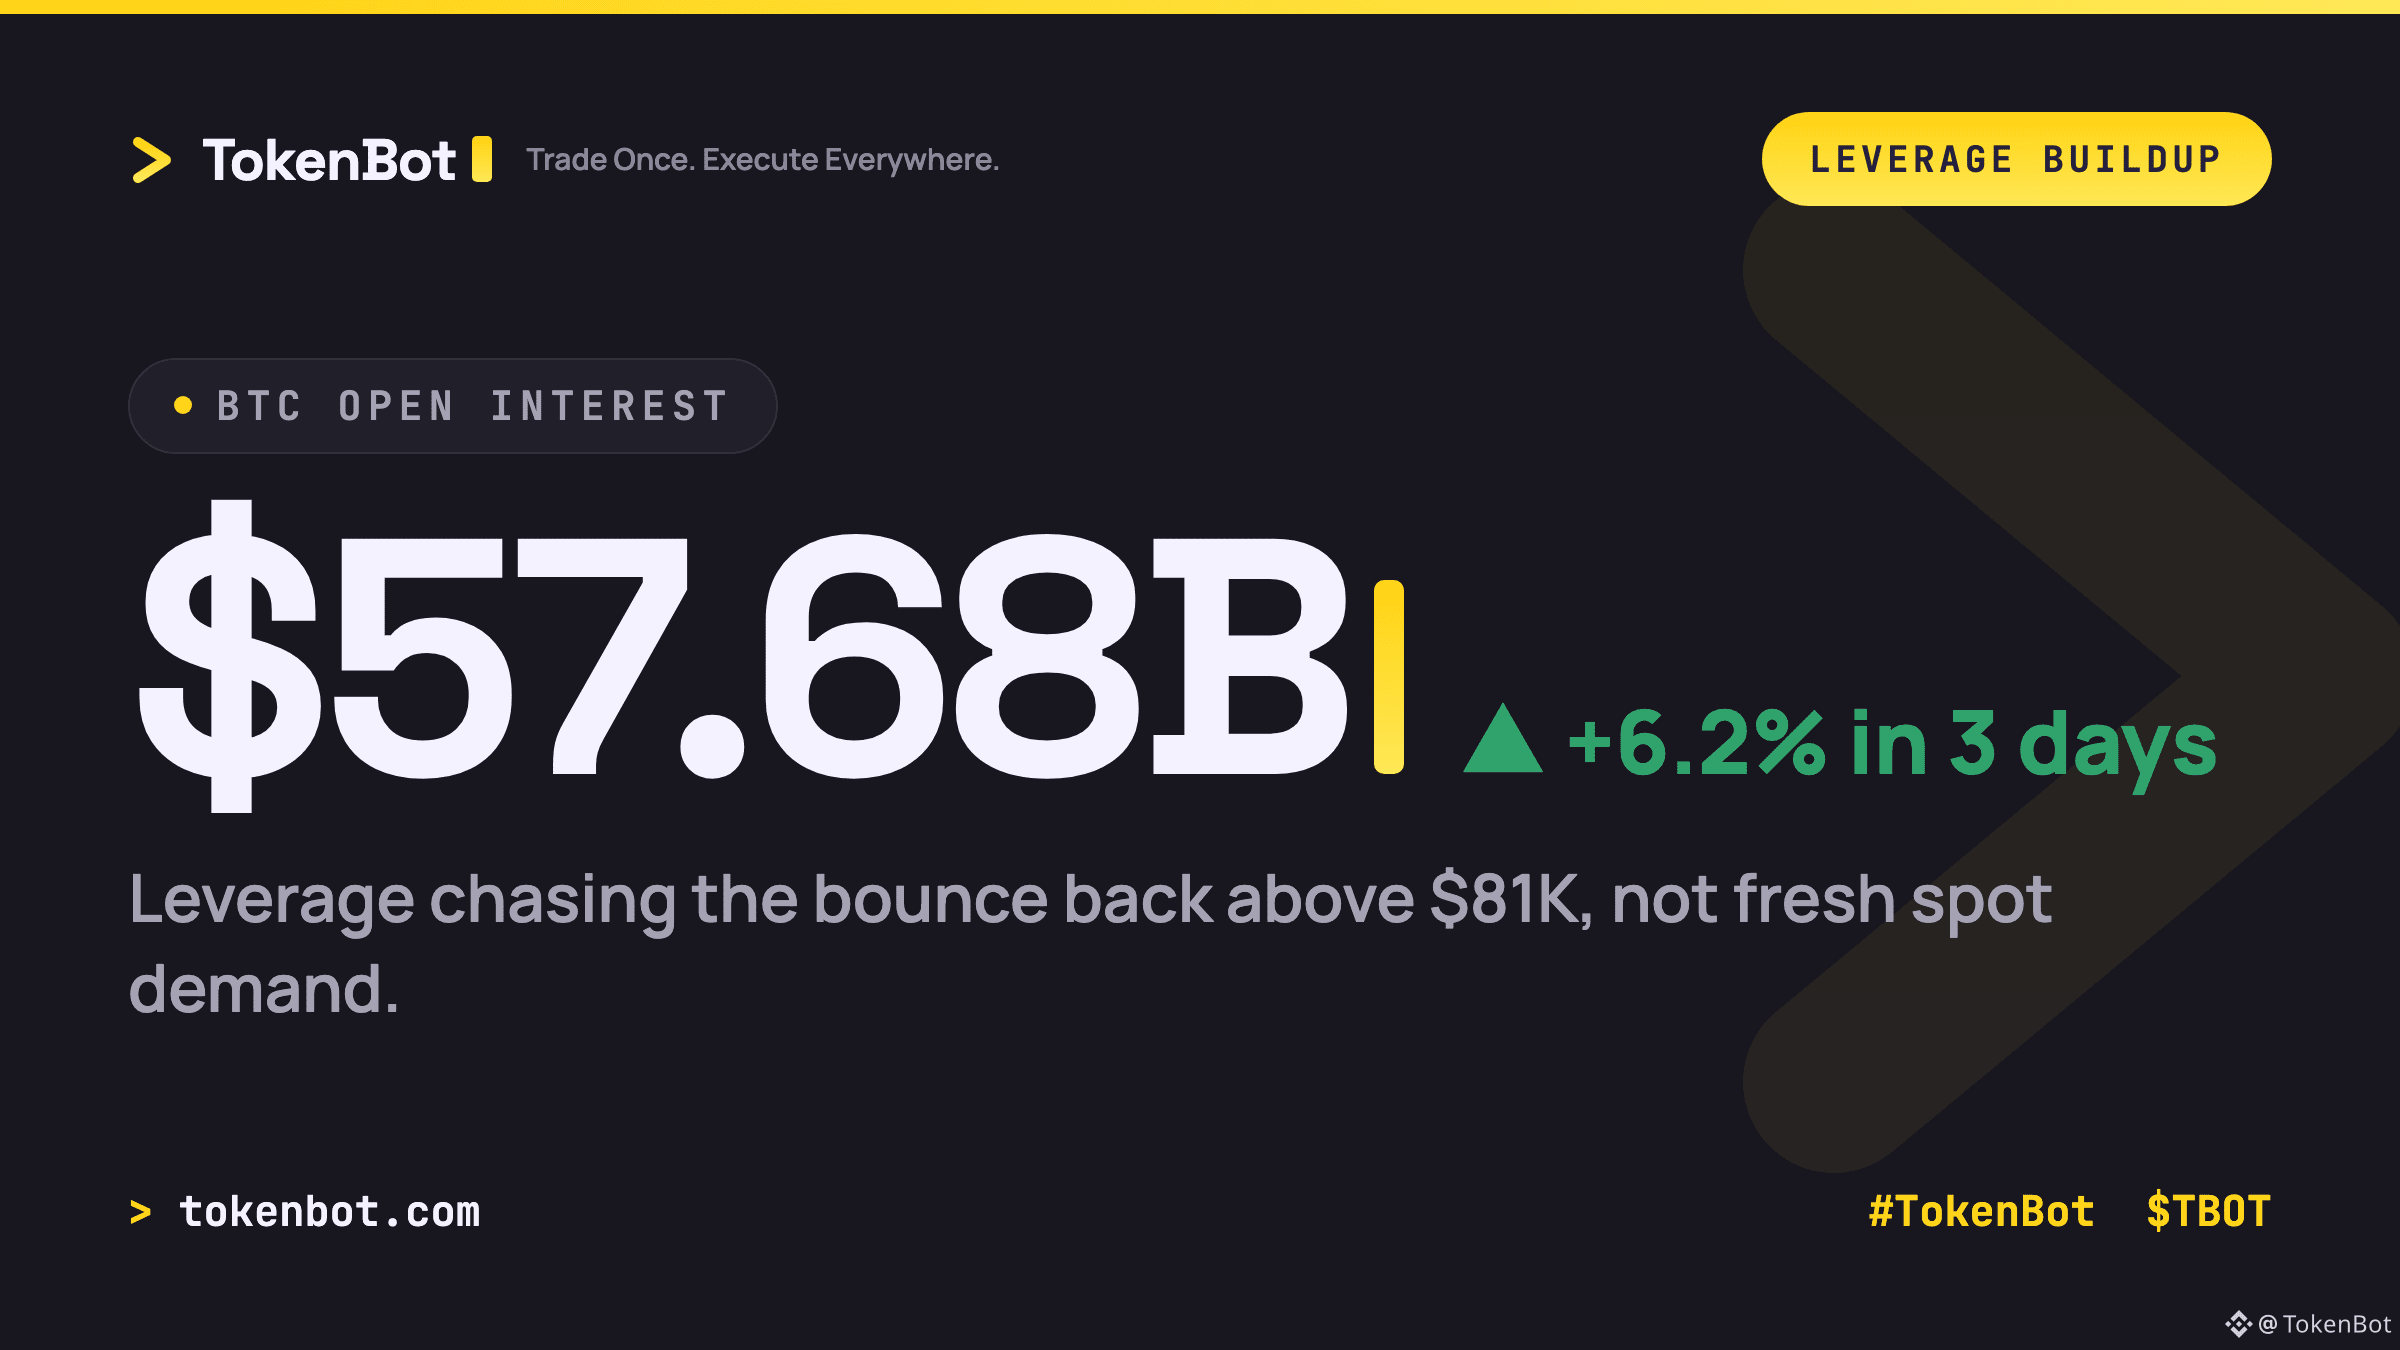
BTC open interest jumped to $57.68B, up 6.2% in just three days, right as price ripped back through $81K.
Here's the part that matters: that's leverage chasing the move, not fresh spot demand showing up. Rising price plus rising OI at the same time usually means traders are re-leveraging into the bounce rather than accumulating outright. It's the exact setup that can flush in either direction once funding gets crowded — a squeeze up if shorts keep capitulating, or a sharp two-sided wick if longs get greedy and funding runs hot.
Worth watching the OI-vs-spot divergence here rather than just the price candle. Anyone else tracking leverage build like this as a crowding signal on the way back up?
Trade once, execute everywhere — tokenbot.com
#TokenBot #Bitcoin #TradingSignals $BTC $TBOT
BTC open interest jumped to $57.68B, up 6.2% in just three days, right as price ripped back through $81K.
Here's the part that matters: that's leverage chasing the move, not fresh spot demand showing up. Rising price plus rising OI at the same time usually means traders are re-leveraging into the bounce rather than accumulating outright. It's the exact setup that can flush in either direction once funding gets crowded — a squeeze up if shorts keep capitulating, or a sharp two-sided wick if longs get greedy and funding runs hot.
Worth watching the OI-vs-spot divergence here rather than just the price candle. Anyone else tracking leverage build like this as a crowding signal on the way back up?
Trade once, execute everywhere — tokenbot.com
#TokenBot #Bitcoin #TradingSignals $BTC $TBOT
Here's the part that matters: that's leverage chasing the move, not fresh spot demand showing up. Rising price plus rising OI at the same time usually means traders are re-leveraging into the bounce rather than accumulating outright. It's the exact setup that can flush in either direction once funding gets crowded — a squeeze up if shorts keep capitulating, or a sharp two-sided wick if longs get greedy and funding runs hot.
Worth watching the OI-vs-spot divergence here rather than just the price candle. Anyone else tracking leverage build like this as a crowding signal on the way back up?
Trade once, execute everywhere — tokenbot.com
#TokenBot #Bitcoin #TradingSignals $BTC $TBOT
1
79
·
--
Two weeks, two completely different liquidation events -- same market.
On August 19, BTC shorts got torched in a $1.74B liquidation flush, the second-largest short wipeout on record. Leverage was stacked against the rally and paid for it. By September 2, the script flipped: of a $324M liquidation event, $270M -- about 83% -- hit longs instead, as price cooled off from the $80,797 August peak back toward $77K.
The mechanism is the same both times: whichever side is most crowded eats the flush first. What made this one notable is timing -- open interest had already dropped to a five-month low right as BTC topped out, meaning a lot of the leveraged fuel for a squeeze was gone before price even peaked.
Worth asking: are you actively sizing entries around OI and funding resets, or is that data you mostly ignore until liquidations already happened?
$BTC $TBOT #Bitcoin #TokenBot #TradingSignals
tokenbot.com
Two weeks, two completely different liquidation events -- same market.
On August 19, BTC shorts got torched in a $1.74B liquidation flush, the second-largest short wipeout on record. Leverage was stacked against the rally and paid for it. By September 2, the script flipped: of a $324M liquidation event, $270M -- about 83% -- hit longs instead, as price cooled off from the $80,797 August peak back toward $77K.
The mechanism is the same both times: whichever side is most crowded eats the flush first. What made this one notable is timing -- open interest had already dropped to a five-month low right as BTC topped out, meaning a lot of the leveraged fuel for a squeeze was gone before price even peaked.
Worth asking: are you actively sizing entries around OI and funding resets, or is that data you mostly ignore until liquidations already happened?
$BTC $TBOT #Bitcoin #TokenBot #TradingSignals
tokenbot.com
On August 19, BTC shorts got torched in a $1.74B liquidation flush, the second-largest short wipeout on record. Leverage was stacked against the rally and paid for it. By September 2, the script flipped: of a $324M liquidation event, $270M -- about 83% -- hit longs instead, as price cooled off from the $80,797 August peak back toward $77K.
The mechanism is the same both times: whichever side is most crowded eats the flush first. What made this one notable is timing -- open interest had already dropped to a five-month low right as BTC topped out, meaning a lot of the leveraged fuel for a squeeze was gone before price even peaked.
Worth asking: are you actively sizing entries around OI and funding resets, or is that data you mostly ignore until liquidations already happened?
$BTC $TBOT #Bitcoin #TokenBot #TradingSignals
tokenbot.com

1.9k
·
--
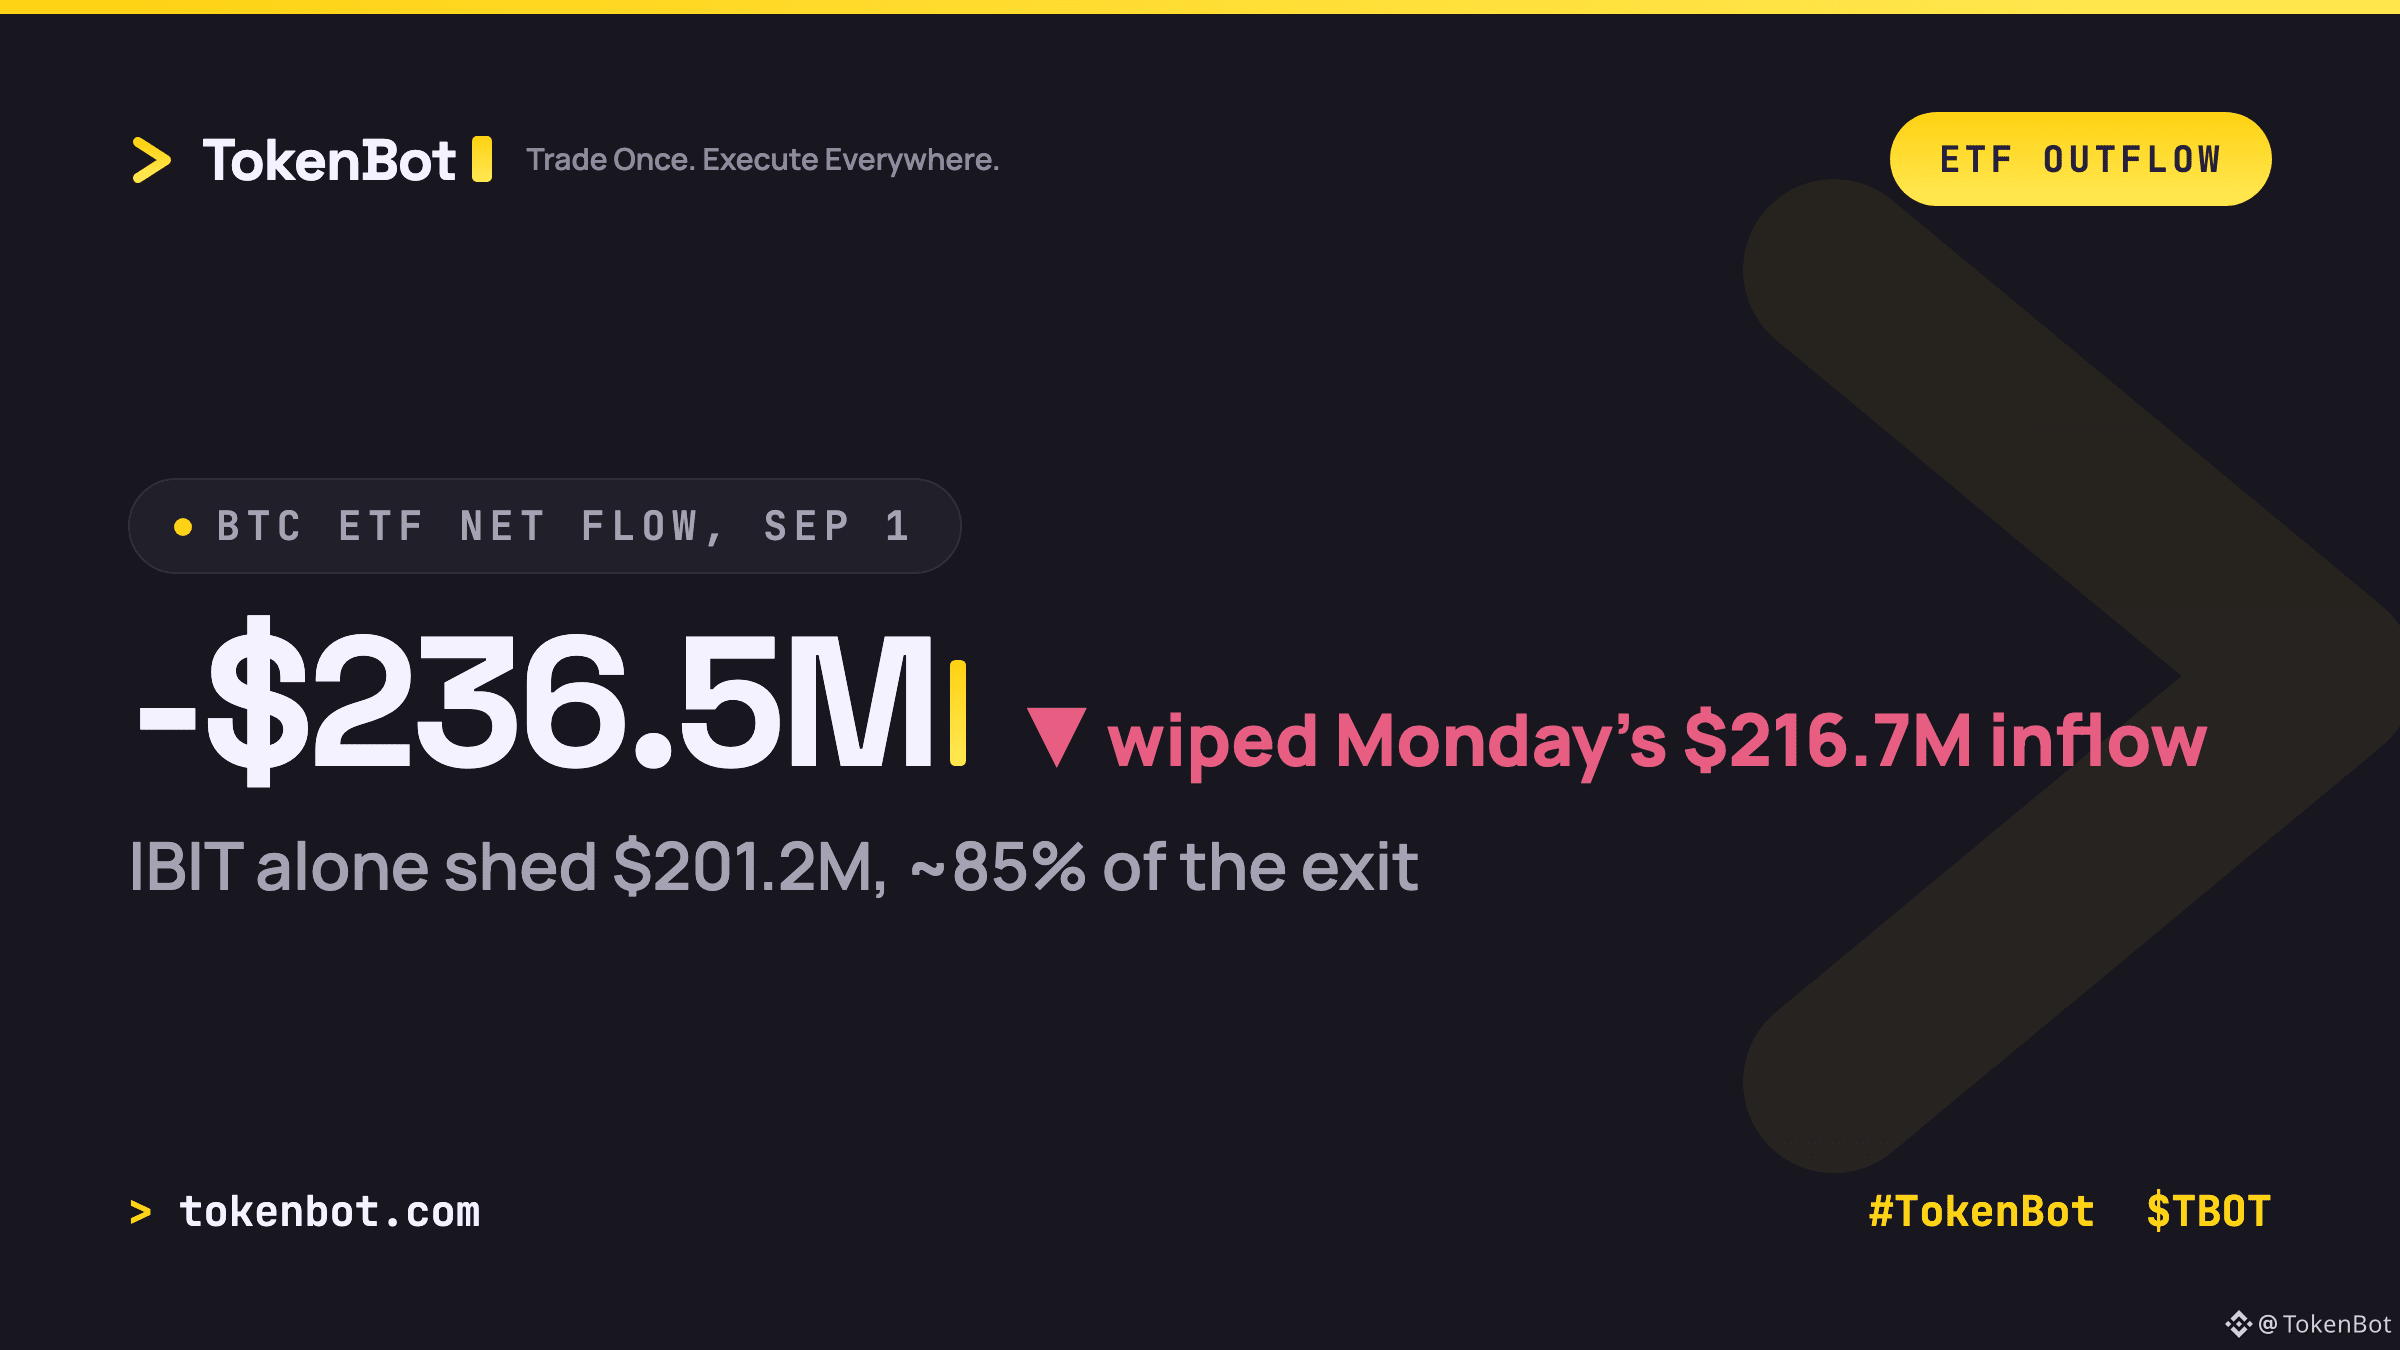
Bitcoin ETFs erased a full day of inflows in a single session. Monday (Aug 31) brought $216.7M in net buying. Tuesday (Sep 1) wiped it out with $236.5M in outflows — a clean round-trip in 24 hours.
The concentration is the real story: BlackRock's IBIT alone accounted for $201.2M of that exit, roughly 85% of the total outflow. Fidelity's FBTC added another $43.7M out, while Bitwise's BITB was the lone holdout with $8.4M in fresh inflows. This wasn't broad-based de-risking — it was one dominant fund's flow doing most of the work to swing the tape.
For anyone trading the spot-ETF basis or running flow-based signals, single-issuer concentration like this matters more than the headline net number. Are you weighting individual-fund flow data over aggregate ETF volume in your models yet?
#TokenBot #Bitcoin #TradingSignals $BTC $TBOT
tokenbot.com
Bitcoin ETFs erased a full day of inflows in a single session. Monday (Aug 31) brought $216.7M in net buying. Tuesday (Sep 1) wiped it out with $236.5M in outflows — a clean round-trip in 24 hours.
The concentration is the real story: BlackRock's IBIT alone accounted for $201.2M of that exit, roughly 85% of the total outflow. Fidelity's FBTC added another $43.7M out, while Bitwise's BITB was the lone holdout with $8.4M in fresh inflows. This wasn't broad-based de-risking — it was one dominant fund's flow doing most of the work to swing the tape.
For anyone trading the spot-ETF basis or running flow-based signals, single-issuer concentration like this matters more than the headline net number. Are you weighting individual-fund flow data over aggregate ETF volume in your models yet?
#TokenBot #Bitcoin #TradingSignals $BTC $TBOT
tokenbot.com
The concentration is the real story: BlackRock's IBIT alone accounted for $201.2M of that exit, roughly 85% of the total outflow. Fidelity's FBTC added another $43.7M out, while Bitwise's BITB was the lone holdout with $8.4M in fresh inflows. This wasn't broad-based de-risking — it was one dominant fund's flow doing most of the work to swing the tape.
For anyone trading the spot-ETF basis or running flow-based signals, single-issuer concentration like this matters more than the headline net number. Are you weighting individual-fund flow data over aggregate ETF volume in your models yet?
#TokenBot #Bitcoin #TradingSignals $BTC $TBOT
tokenbot.com
203
·
--
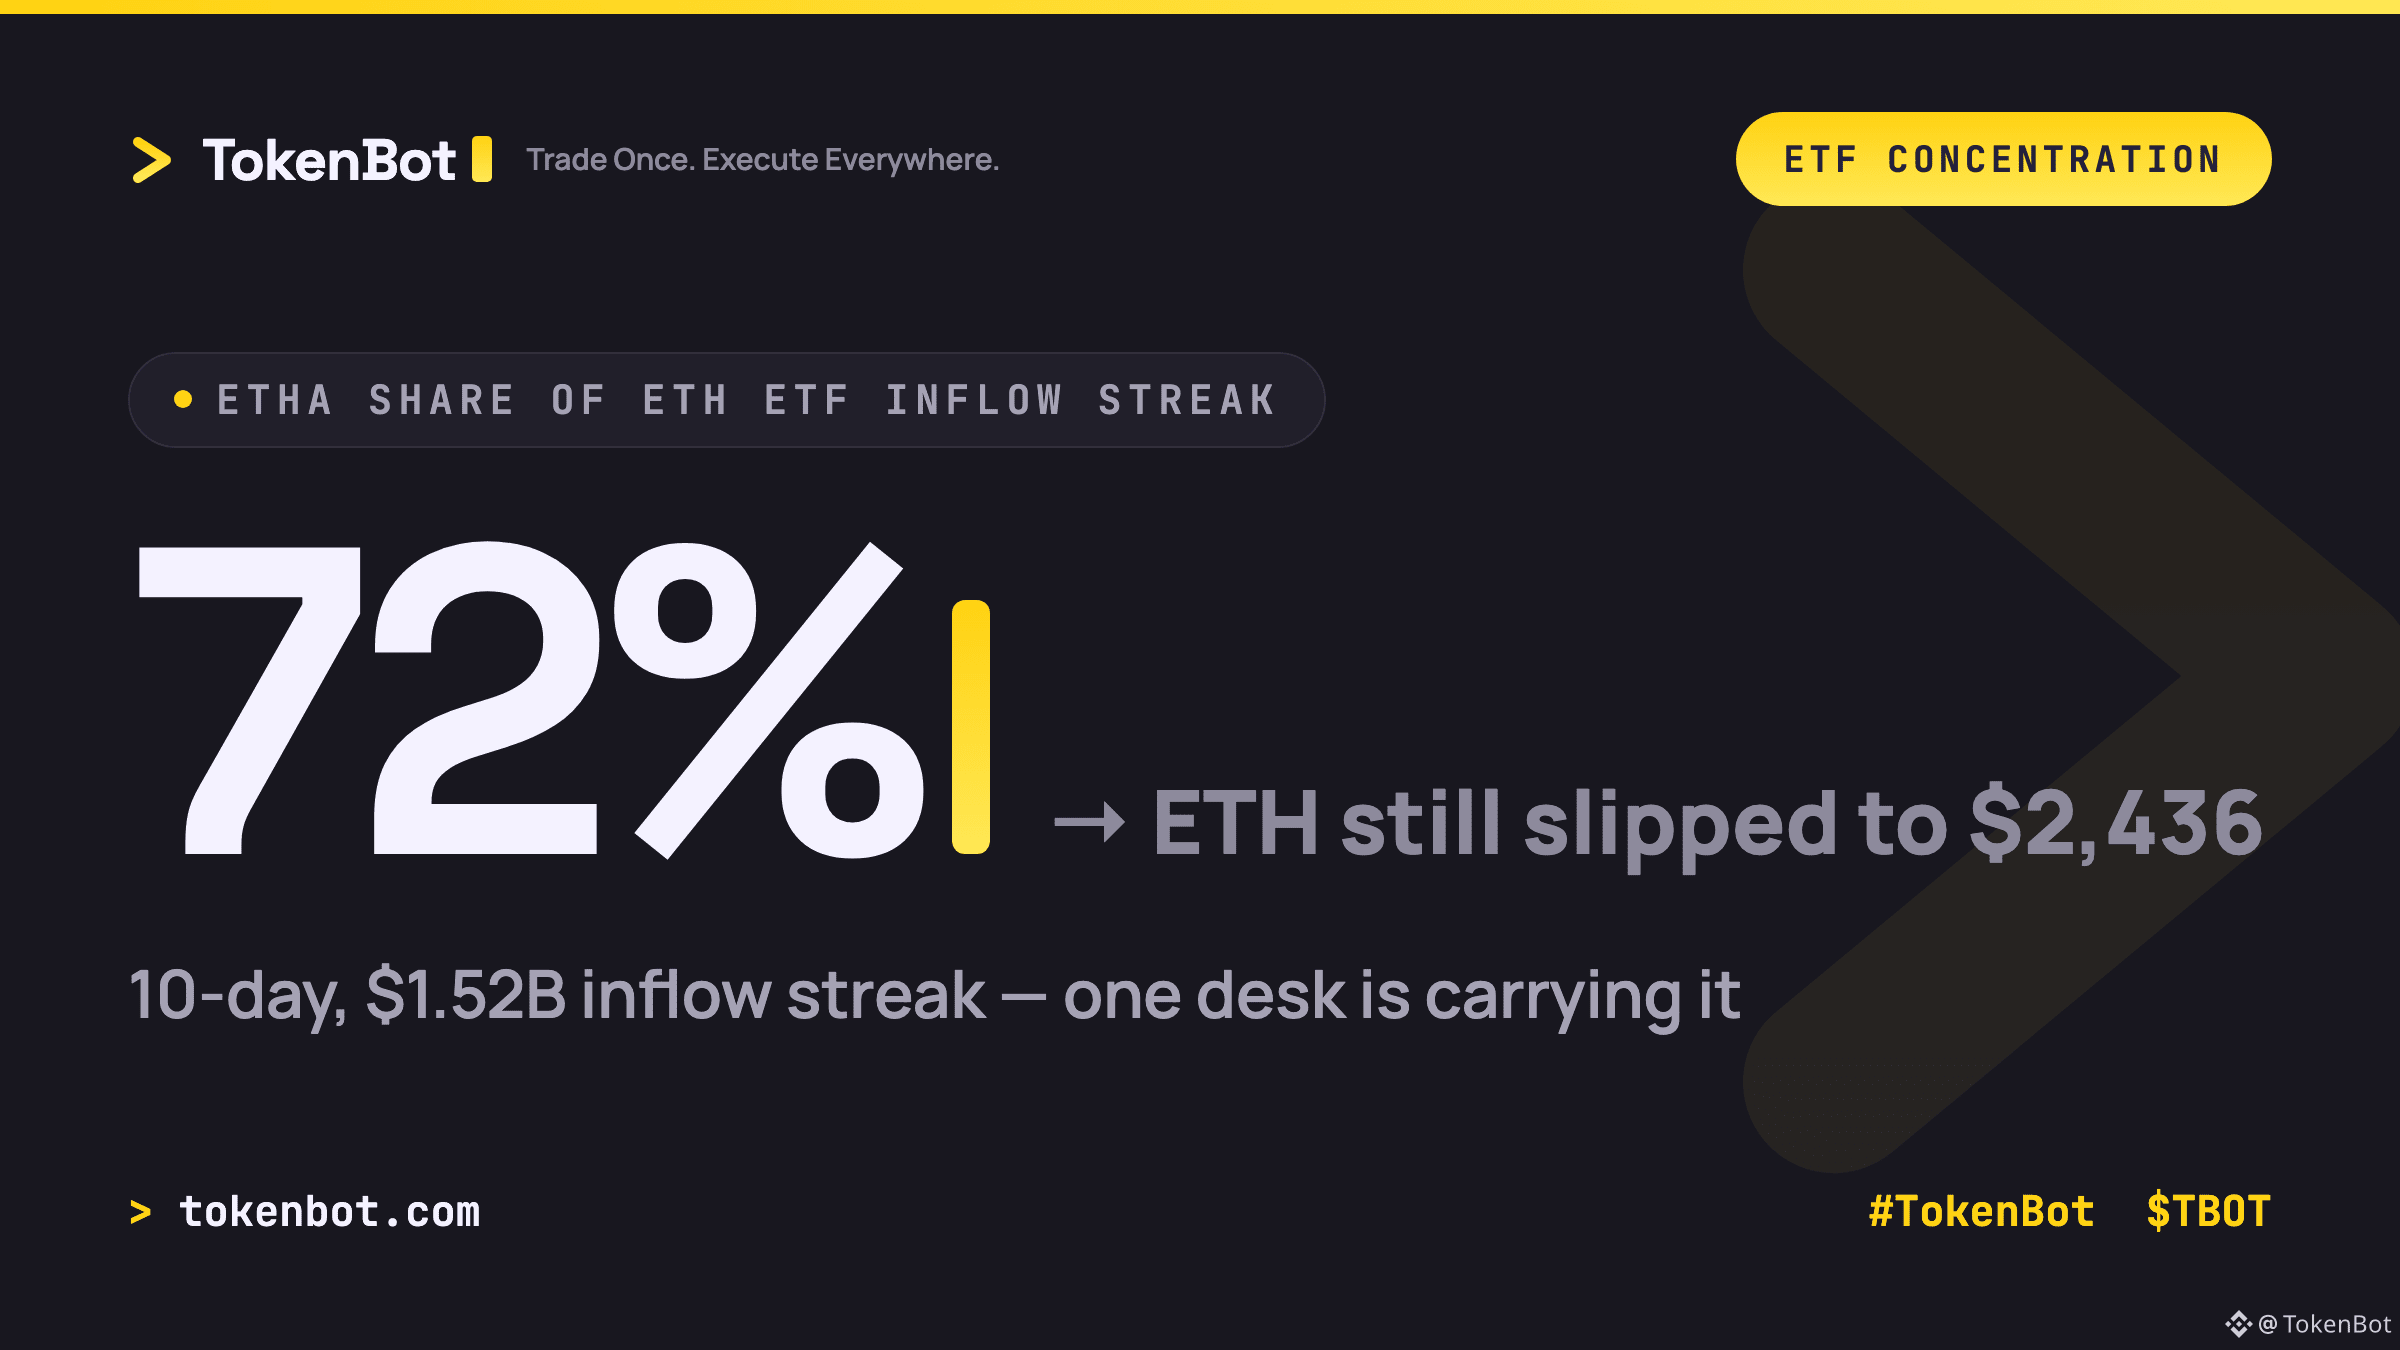
ETH spot ETFs just closed out a 10-day inflow streak, roughly $1.52B in total — and ETH still slipped to $2,436 over the same stretch.
Here's the part that matters more than the headline number: BlackRock's ETHA alone accounts for about 72% of that flow, close to $1.02B on its own, with a record $225.8M single-day print in the mix. That's not ten days of broad institutional demand walking in the door. That's one issuer's rebalance cycle doing almost all the work while everyone else reads the aggregate as a market signal.
Concentration like that cuts both ways. If ETHA's flow slows or reverses, the "streak" narrative disappears with it — there's no depth behind the number. Worth separating aggregate ETF inflow from who's actually buying before treating it as demand confirmation.
Is single-issuer-dominated ETF flow still a useful read on spot demand, or has it become a distortion that mostly reflects one desk's positioning?
#TokenBot #Ethereum #Crypto #TradingSignals $ETH $TBOT
tokenbot.com
ETH spot ETFs just closed out a 10-day inflow streak, roughly $1.52B in total — and ETH still slipped to $2,436 over the same stretch.
Here's the part that matters more than the headline number: BlackRock's ETHA alone accounts for about 72% of that flow, close to $1.02B on its own, with a record $225.8M single-day print in the mix. That's not ten days of broad institutional demand walking in the door. That's one issuer's rebalance cycle doing almost all the work while everyone else reads the aggregate as a market signal.
Concentration like that cuts both ways. If ETHA's flow slows or reverses, the "streak" narrative disappears with it — there's no depth behind the number. Worth separating aggregate ETF inflow from who's actually buying before treating it as demand confirmation.
Is single-issuer-dominated ETF flow still a useful read on spot demand, or has it become a distortion that mostly reflects one desk's positioning?
#TokenBot #Ethereum #Crypto #TradingSignals $ETH $TBOT
tokenbot.com
Here's the part that matters more than the headline number: BlackRock's ETHA alone accounts for about 72% of that flow, close to $1.02B on its own, with a record $225.8M single-day print in the mix. That's not ten days of broad institutional demand walking in the door. That's one issuer's rebalance cycle doing almost all the work while everyone else reads the aggregate as a market signal.
Concentration like that cuts both ways. If ETHA's flow slows or reverses, the "streak" narrative disappears with it — there's no depth behind the number. Worth separating aggregate ETF inflow from who's actually buying before treating it as demand confirmation.
Is single-issuer-dominated ETF flow still a useful read on spot demand, or has it become a distortion that mostly reflects one desk's positioning?
#TokenBot #Ethereum #Crypto #TradingSignals $ETH $TBOT
tokenbot.com
ETH-4.62%
ETHAETF-0.57%
129
·
--
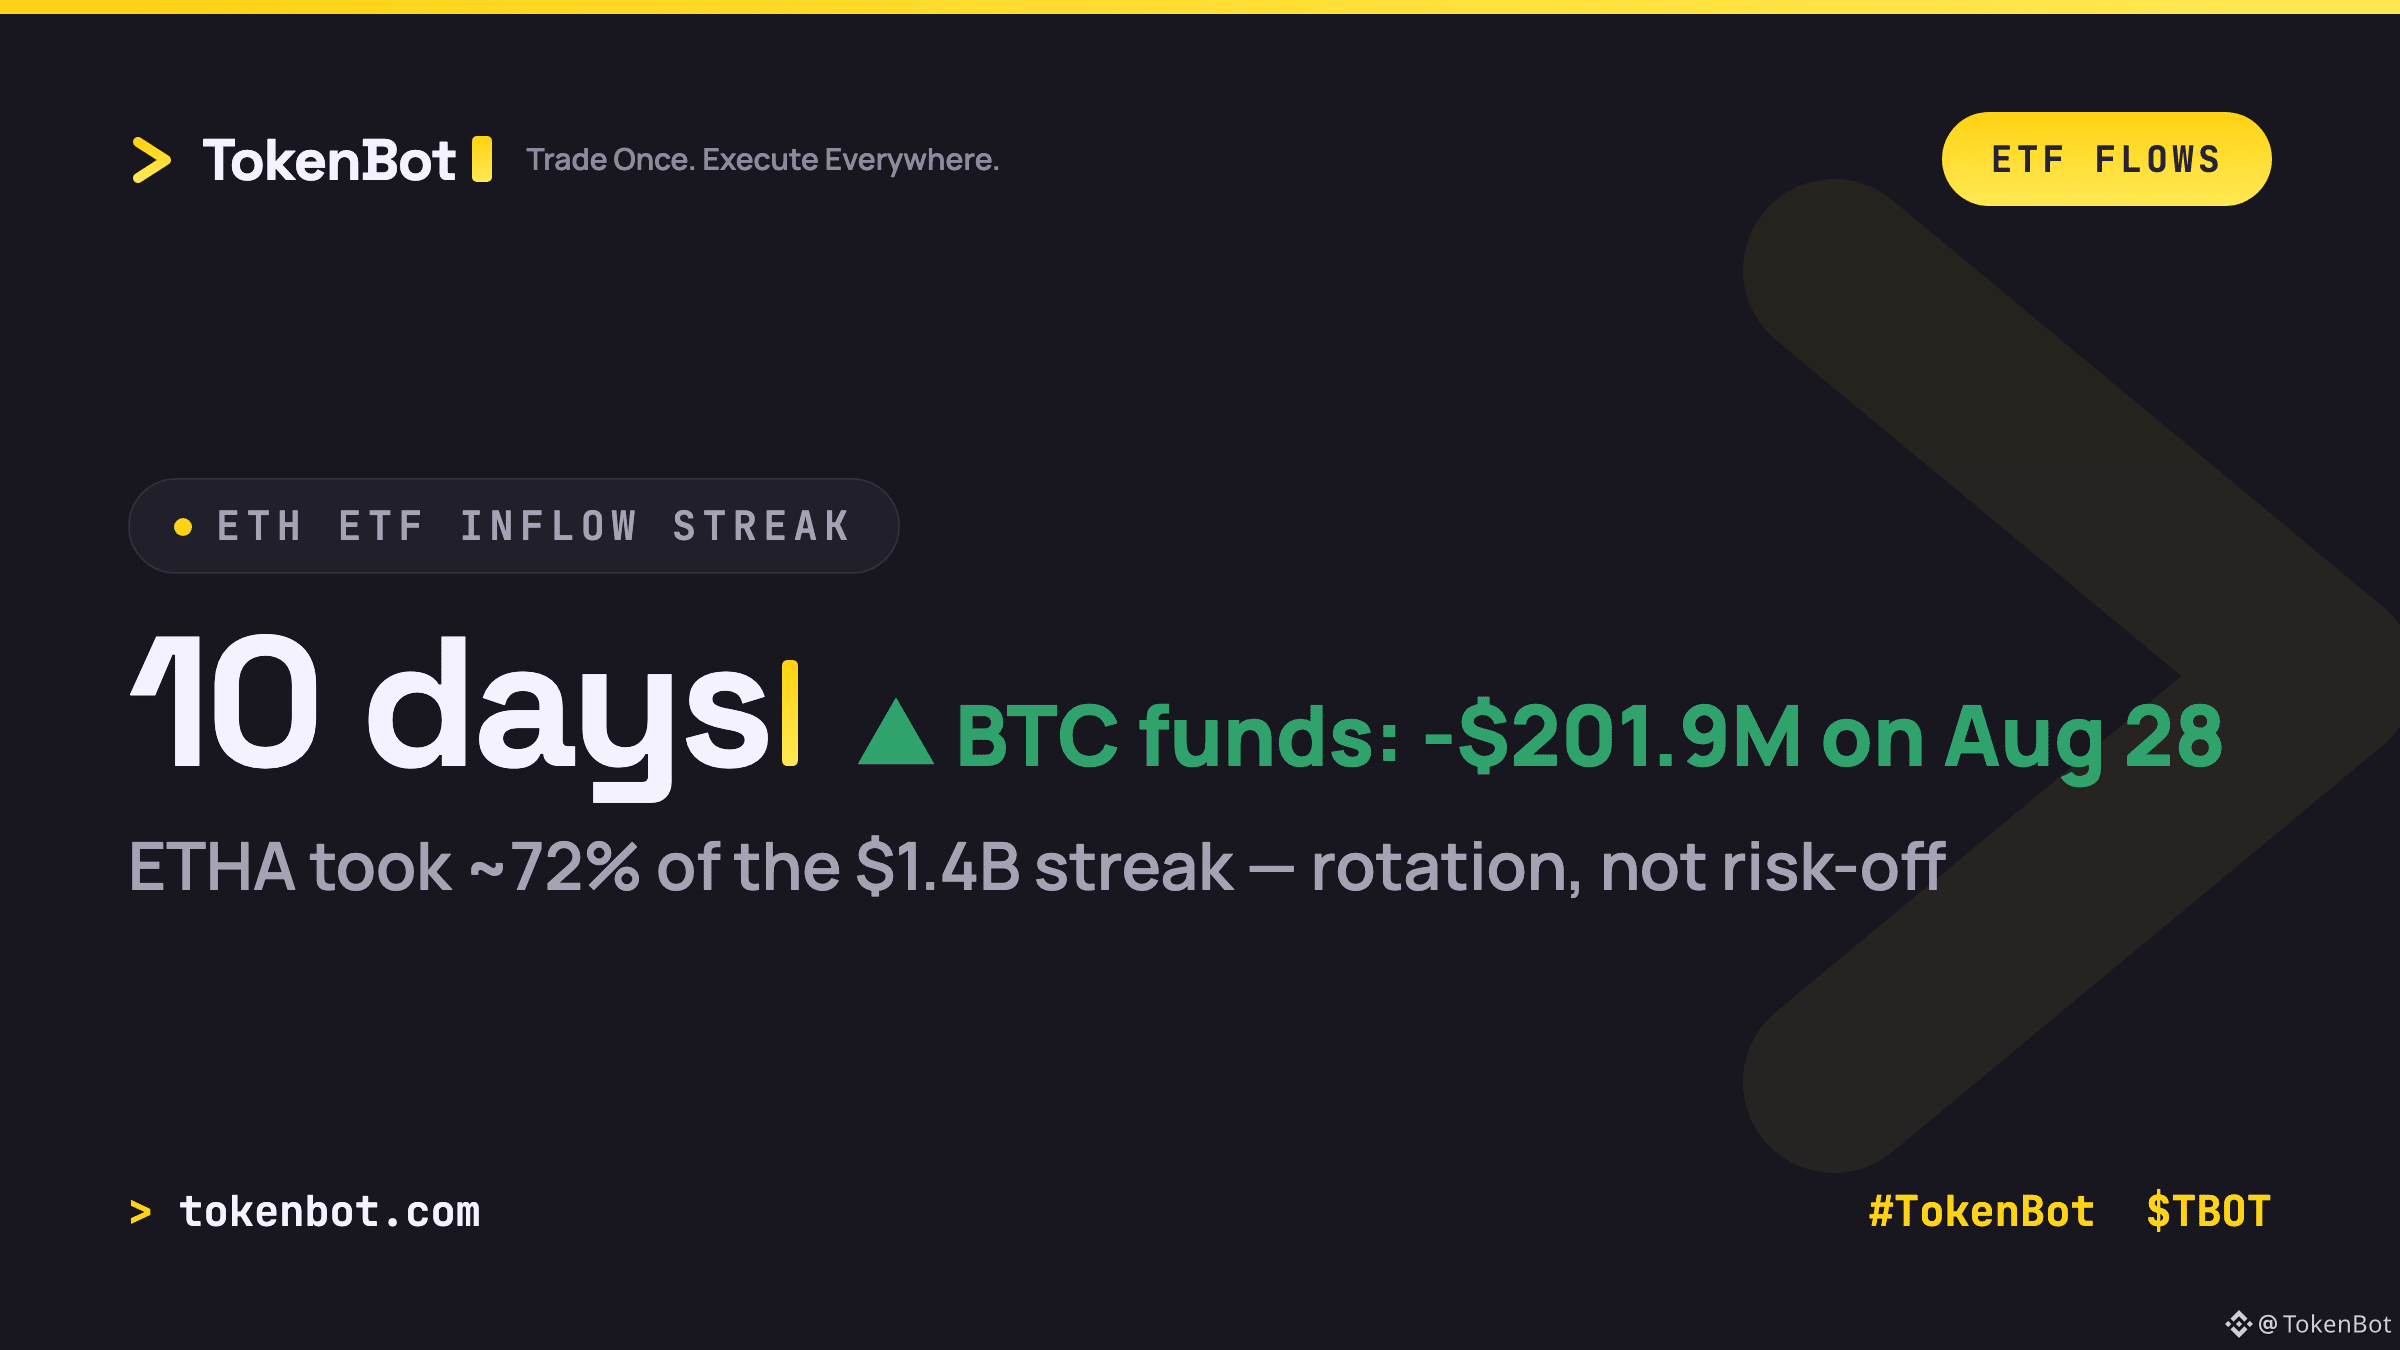
Spot ETH ETFs just logged their 10th straight day of net inflows, while spot Bitcoin ETFs snapped a nine-day inflow streak with a $201.9M outflow on August 28.
The mechanism worth watching: BlackRock's ETHA alone accounted for roughly 72% of the $1.4B ETH streak. That concentration, plus the timing against BTC's outflow, reads more like institutional rotation into Ethereum than a broad risk-off retreat from crypto. Money isn't leaving the asset class — it's repositioning inside it.
If that divergence holds through the first week of September, BTC dominance likely keeps drifting lower. If it's just a one-week rebalance out of BTC funds, dominance snaps back fast.
Which is it — early rotation or a blip? Curious how algo desks are reading the ETH/BTC flow spread right now.
$BTC $ETH $TBOT #Ethereum #Bitcoin #TokenBot #TradingSignals
tokenbot.com
Spot ETH ETFs just logged their 10th straight day of net inflows, while spot Bitcoin ETFs snapped a nine-day inflow streak with a $201.9M outflow on August 28.
The mechanism worth watching: BlackRock's ETHA alone accounted for roughly 72% of the $1.4B ETH streak. That concentration, plus the timing against BTC's outflow, reads more like institutional rotation into Ethereum than a broad risk-off retreat from crypto. Money isn't leaving the asset class — it's repositioning inside it.
If that divergence holds through the first week of September, BTC dominance likely keeps drifting lower. If it's just a one-week rebalance out of BTC funds, dominance snaps back fast.
Which is it — early rotation or a blip? Curious how algo desks are reading the ETH/BTC flow spread right now.
$BTC $ETH $TBOT #Ethereum #Bitcoin #TokenBot #TradingSignals
tokenbot.com
The mechanism worth watching: BlackRock's ETHA alone accounted for roughly 72% of the $1.4B ETH streak. That concentration, plus the timing against BTC's outflow, reads more like institutional rotation into Ethereum than a broad risk-off retreat from crypto. Money isn't leaving the asset class — it's repositioning inside it.
If that divergence holds through the first week of September, BTC dominance likely keeps drifting lower. If it's just a one-week rebalance out of BTC funds, dominance snaps back fast.
Which is it — early rotation or a blip? Curious how algo desks are reading the ETH/BTC flow spread right now.
$BTC $ETH $TBOT #Ethereum #Bitcoin #TokenBot #TradingSignals
tokenbot.com
78
·
--
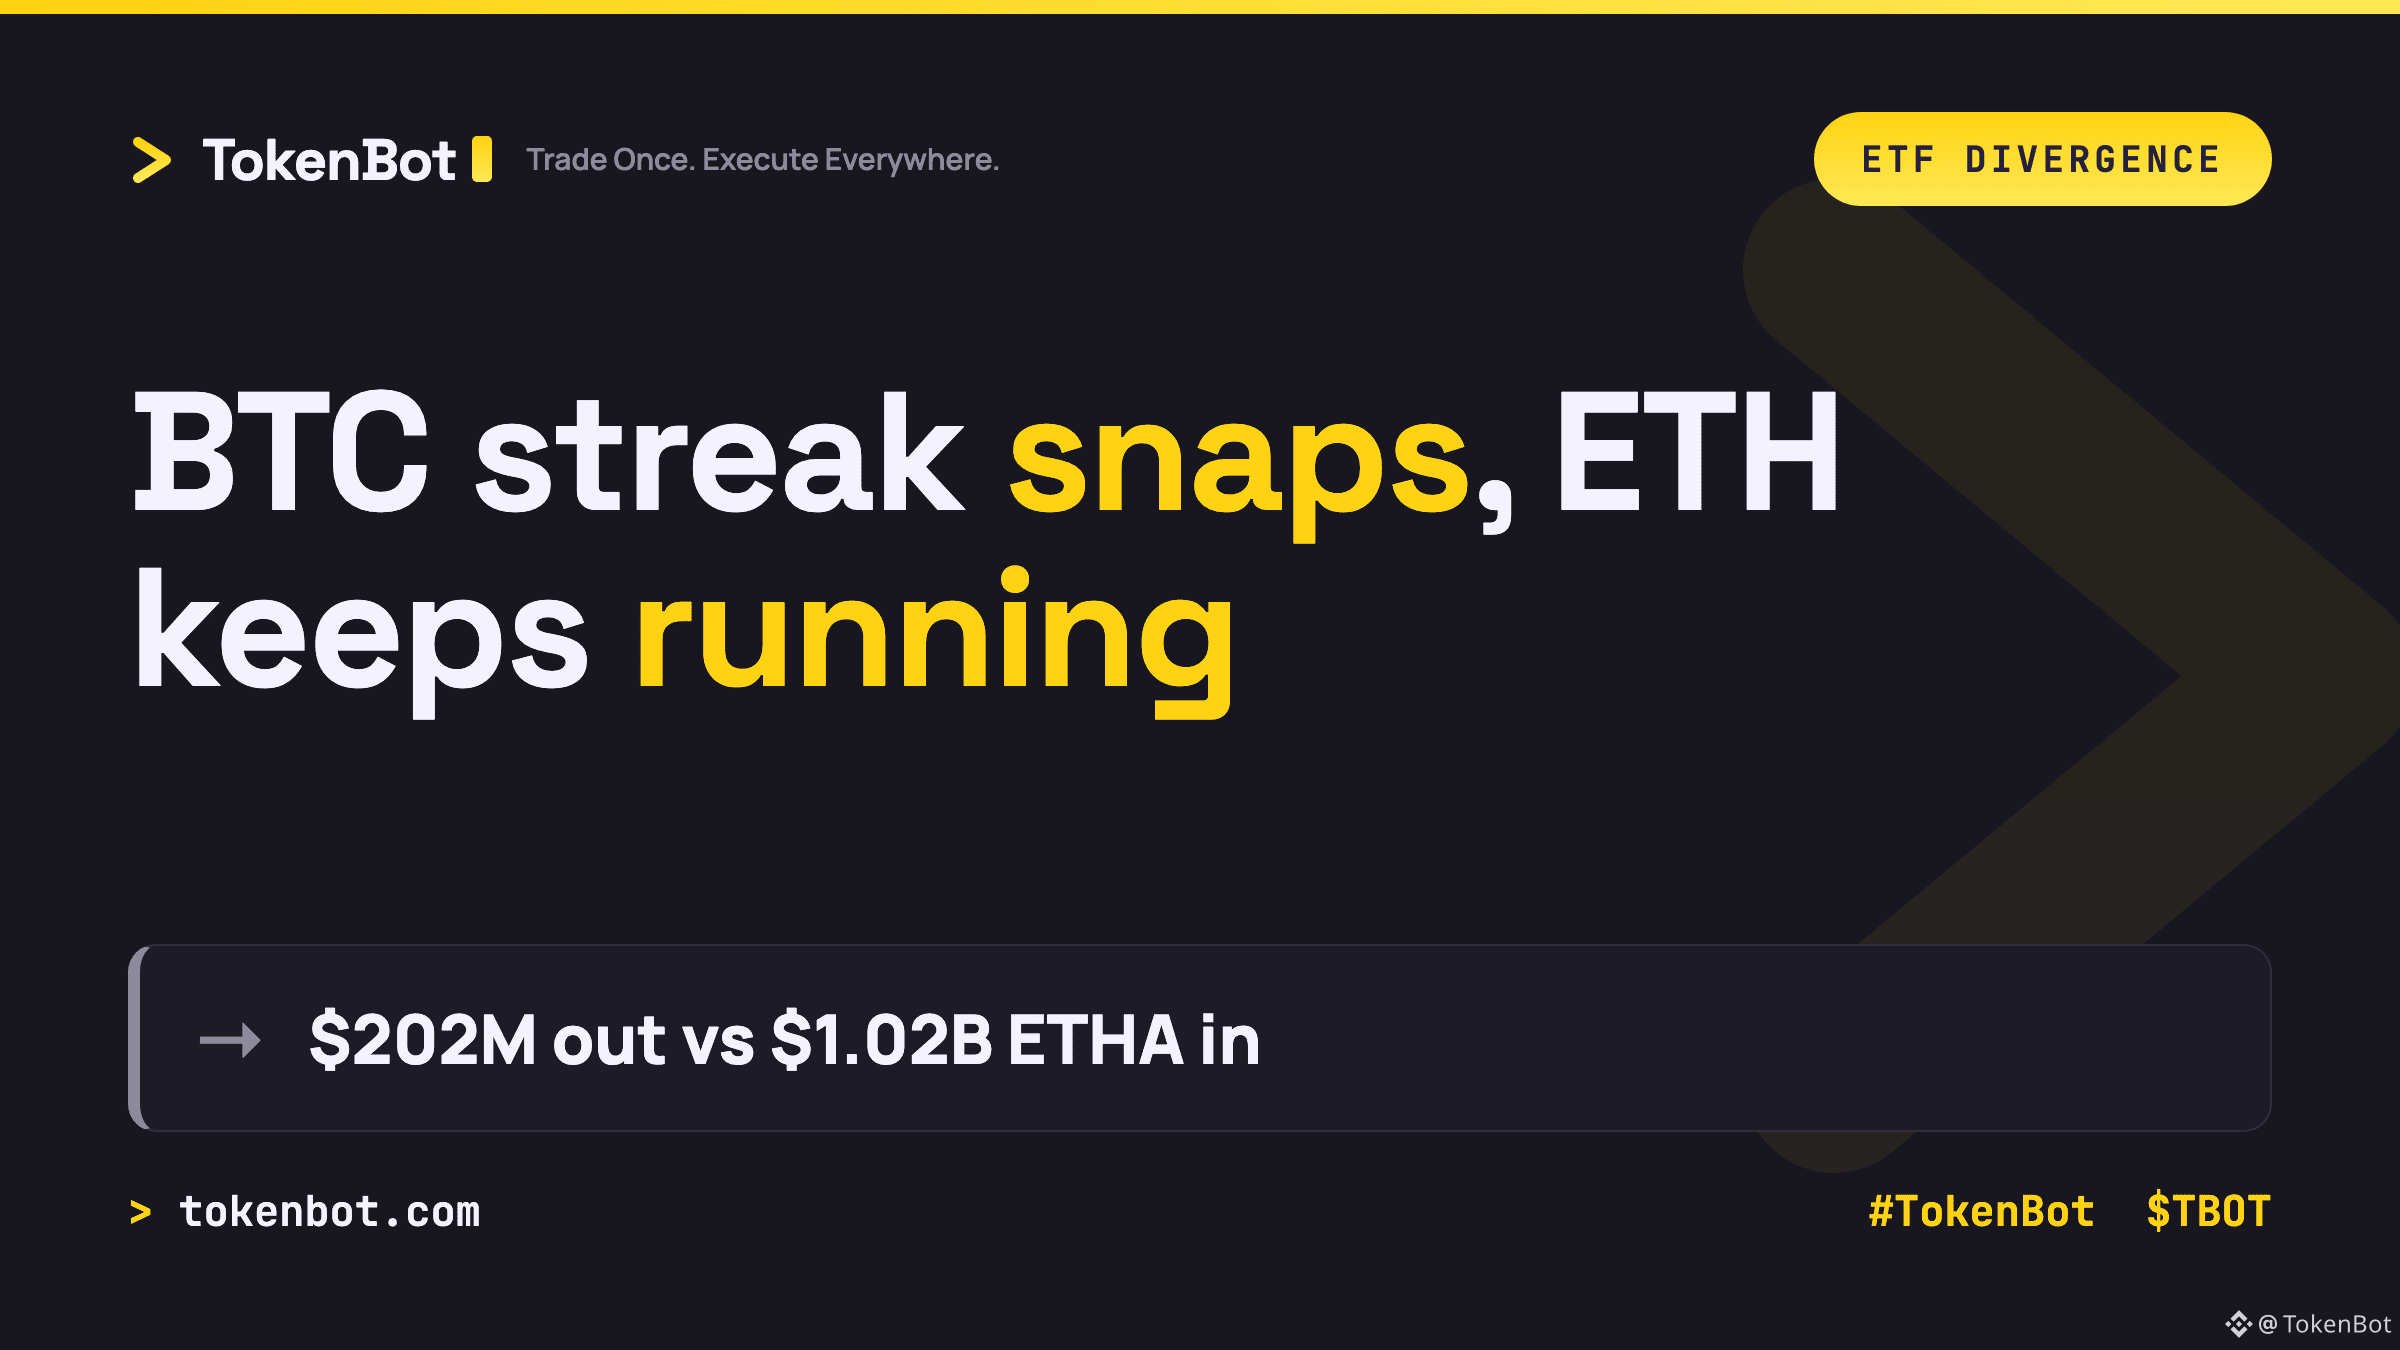
Bitcoin ETFs snapped their 9-day, $2.8B inflow streak on Friday with a $202M net outflow -- the first red day in over a week. Same session, Ethereum ETFs logged their 10th straight day of inflows, pushing the streak to $1.42B. BlackRock's ETHA alone accounted for $1.02B of that run, roughly 72% of the total.
That's not the divergence you'd expect from a broad risk-off flush. Both assets caught the same hawkish-Fed headwind that knocked BTC down 3.8% Friday, but institutional flow only backed off Bitcoin -- ETH's streak didn't blink.
Rotation into ETH, or BTC holders just booking gains into strength after the run from $62K? The flow data and the price action are telling two different stories right now.
$BTC $ETH $TBOT #Ethereum #Bitcoin #TokenBot
Trade once, execute everywhere -- tokenbot.com
Bitcoin ETFs snapped their 9-day, $2.8B inflow streak on Friday with a $202M net outflow -- the first red day in over a week. Same session, Ethereum ETFs logged their 10th straight day of inflows, pushing the streak to $1.42B. BlackRock's ETHA alone accounted for $1.02B of that run, roughly 72% of the total.
That's not the divergence you'd expect from a broad risk-off flush. Both assets caught the same hawkish-Fed headwind that knocked BTC down 3.8% Friday, but institutional flow only backed off Bitcoin -- ETH's streak didn't blink.
Rotation into ETH, or BTC holders just booking gains into strength after the run from $62K? The flow data and the price action are telling two different stories right now.
$BTC $ETH $TBOT #Ethereum #Bitcoin #TokenBot
Trade once, execute everywhere -- tokenbot.com
That's not the divergence you'd expect from a broad risk-off flush. Both assets caught the same hawkish-Fed headwind that knocked BTC down 3.8% Friday, but institutional flow only backed off Bitcoin -- ETH's streak didn't blink.
Rotation into ETH, or BTC holders just booking gains into strength after the run from $62K? The flow data and the price action are telling two different stories right now.
$BTC $ETH $TBOT #Ethereum #Bitcoin #TokenBot
Trade once, execute everywhere -- tokenbot.com
1.7k
·
--
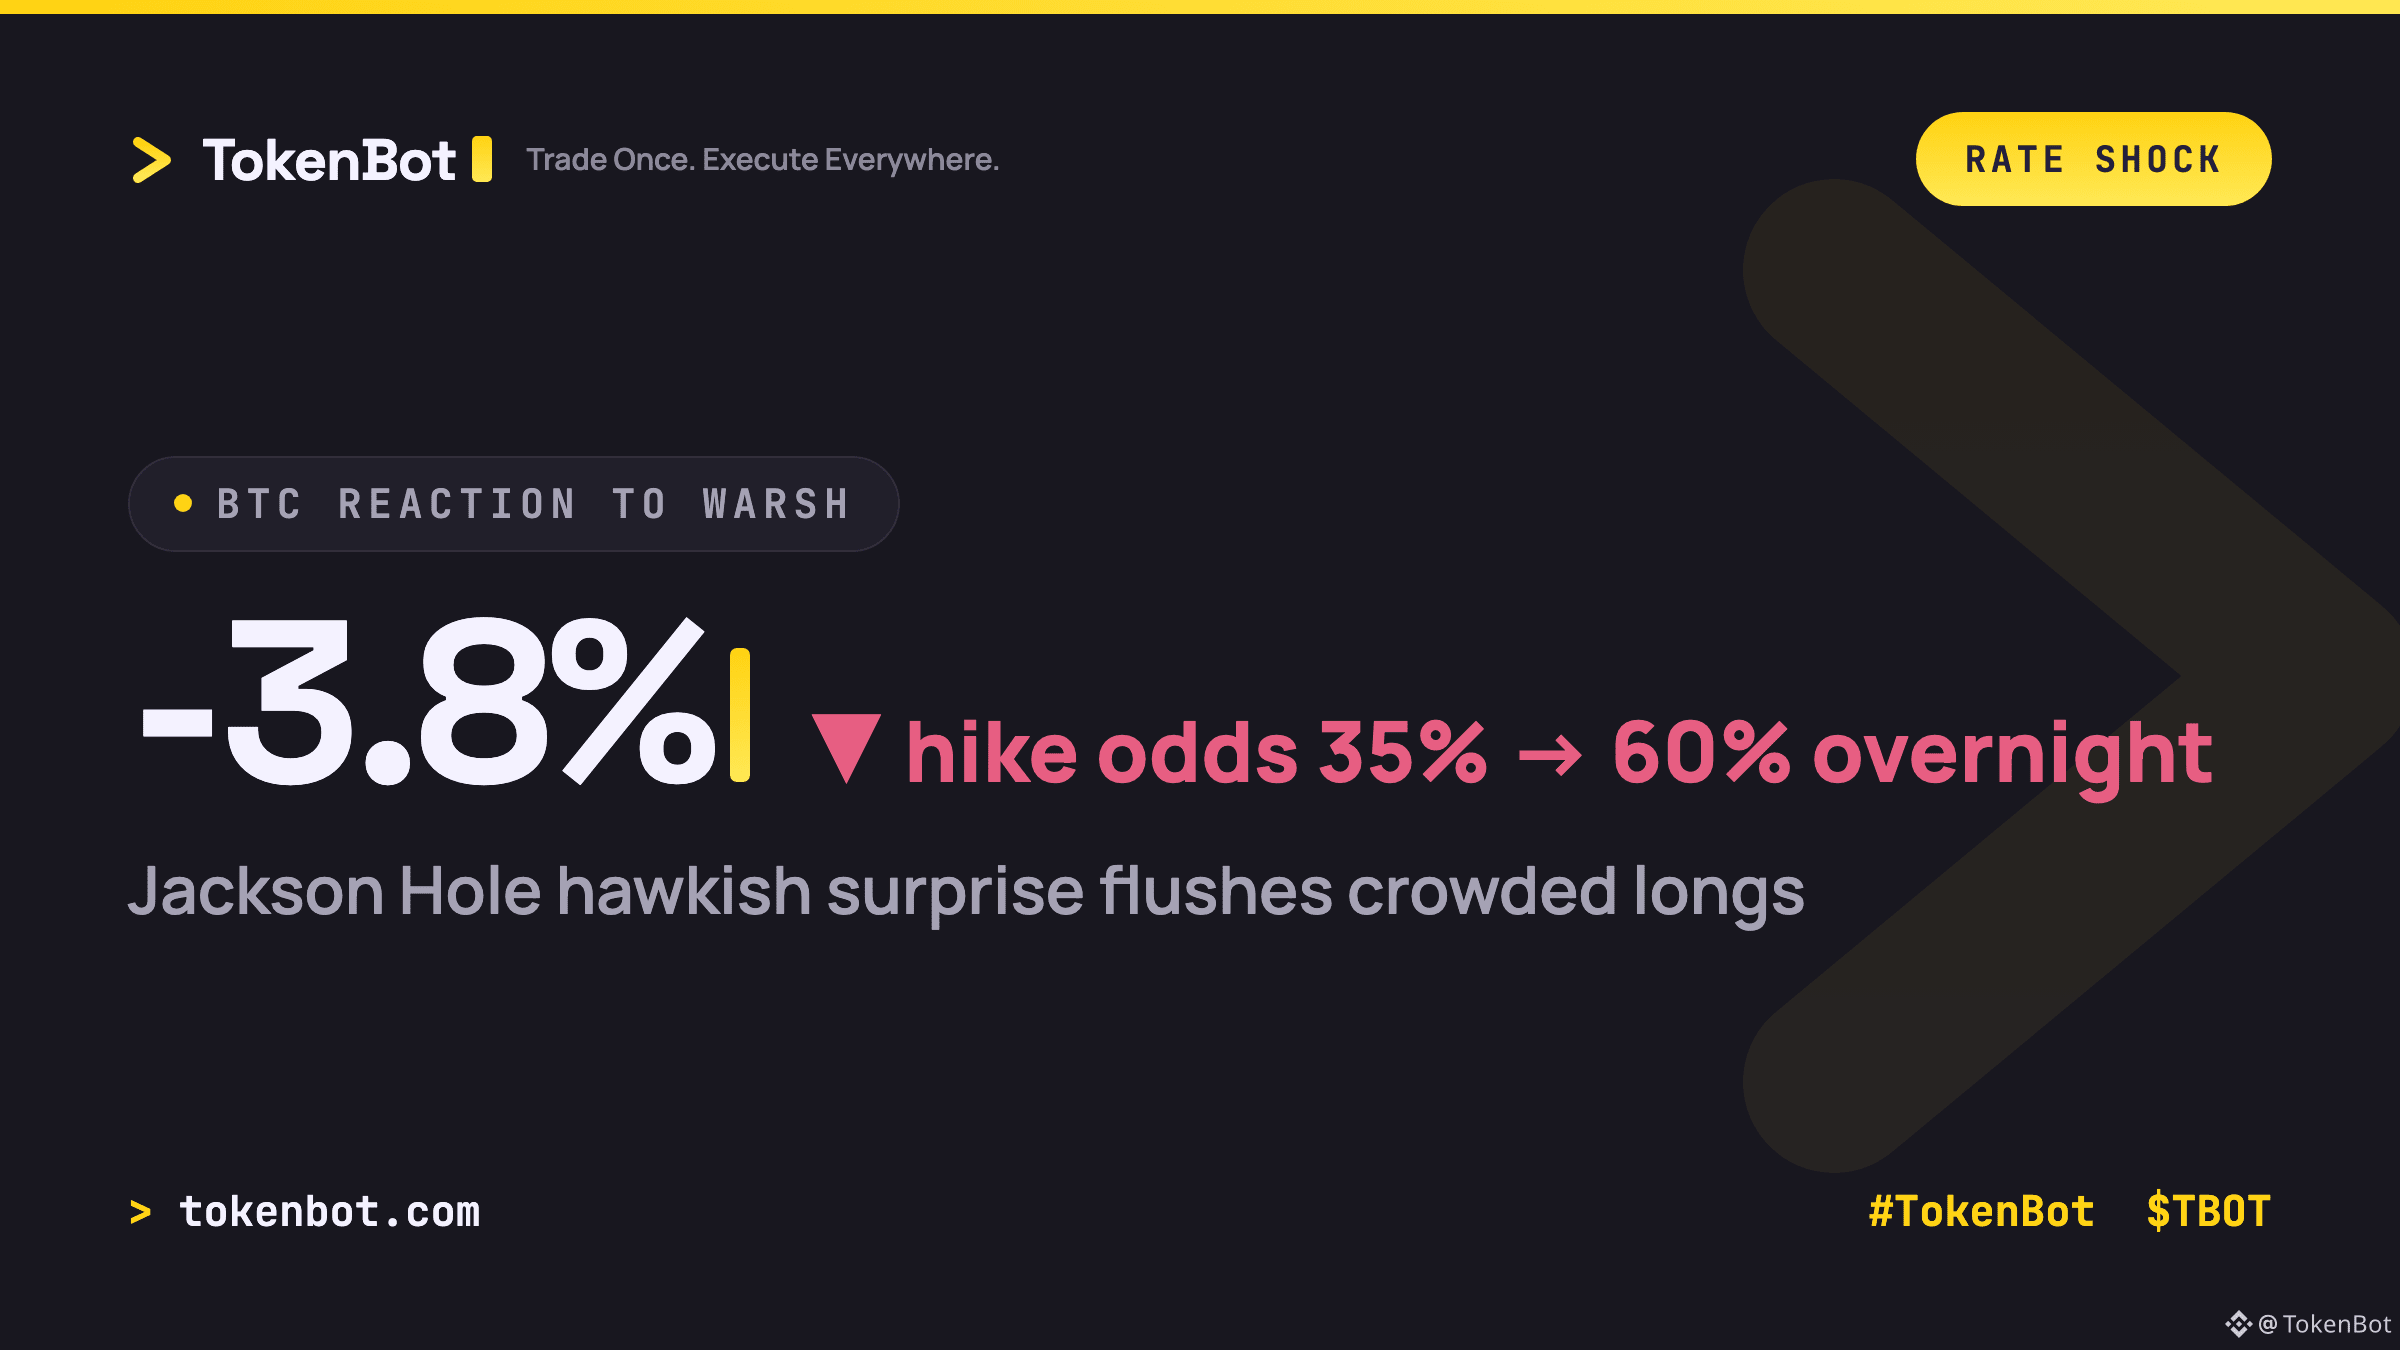
Fed Chair Kevin Warsh turned hawkish at his Jackson Hole speech, and the rates market repriced fast: CME odds of a rate hike next month jumped from roughly 35% to 60% overnight. Bitcoin dropped 3.8% to about $77.8K on the reaction, and the broader crypto market cap fell 2.9% to $2.72T.
The setup that made this hurt: funding had been positive in 88 of the prior 90 eight-hour windows heading into the speech. That's a crowded long book that got fat on the "no more hikes" thesis, and a hawkish surprise is exactly what unwinds it. The 2-year Treasury yield jumped 11bps to 4.34%, its highest in a month, which is the tell that this is a real repricing, not just a headline spike.
If Warsh actually follows through with a hike next month, does $70K hold as the new floor, or was today just the first leg down?
#TokenBot #Bitcoin #Macro #TradingSignals $BTC $TBOT
tokenbot.com
Fed Chair Kevin Warsh turned hawkish at his Jackson Hole speech, and the rates market repriced fast: CME odds of a rate hike next month jumped from roughly 35% to 60% overnight. Bitcoin dropped 3.8% to about $77.8K on the reaction, and the broader crypto market cap fell 2.9% to $2.72T.
The setup that made this hurt: funding had been positive in 88 of the prior 90 eight-hour windows heading into the speech. That's a crowded long book that got fat on the "no more hikes" thesis, and a hawkish surprise is exactly what unwinds it. The 2-year Treasury yield jumped 11bps to 4.34%, its highest in a month, which is the tell that this is a real repricing, not just a headline spike.
If Warsh actually follows through with a hike next month, does $70K hold as the new floor, or was today just the first leg down?
#TokenBot #Bitcoin #Macro #TradingSignals $BTC $TBOT
tokenbot.com
The setup that made this hurt: funding had been positive in 88 of the prior 90 eight-hour windows heading into the speech. That's a crowded long book that got fat on the "no more hikes" thesis, and a hawkish surprise is exactly what unwinds it. The 2-year Treasury yield jumped 11bps to 4.34%, its highest in a month, which is the tell that this is a real repricing, not just a headline spike.
If Warsh actually follows through with a hike next month, does $70K hold as the new floor, or was today just the first leg down?
#TokenBot #Bitcoin #Macro #TradingSignals $BTC $TBOT
tokenbot.com
131
·
--
Charles Schwab, custodian of roughly $10 trillion in client assets, just announced it's adding Solana, Avalanche, and Chainlink to its crypto trading platform. They join Bitcoin and Ethereum, which have been the only two coins on offer since Schwab Crypto launched in May. Solana led the reaction, up 6.89% to $109.
The number that matters here isn't the SOL pop, it's the menu. For three months, the biggest brokerages treated "crypto" as a two-asset category: BTC and ETH, full stop. Schwab just broke that consensus, and it did so citing client demand, not a narrative cycle. That's a different kind of buy signal than a CT trend -- it's brokerage order flow telling a $10T platform what its own users are asking for.
Worth watching: which asset gets whitelisted next when the filter is actual account demand instead of social volume? Schwab said more coins are coming.
$BTC $ETH $TBOT #Solana #TradFi #TokenBot
tokenbot.com
Charles Schwab, custodian of roughly $10 trillion in client assets, just announced it's adding Solana, Avalanche, and Chainlink to its crypto trading platform. They join Bitcoin and Ethereum, which have been the only two coins on offer since Schwab Crypto launched in May. Solana led the reaction, up 6.89% to $109.
The number that matters here isn't the SOL pop, it's the menu. For three months, the biggest brokerages treated "crypto" as a two-asset category: BTC and ETH, full stop. Schwab just broke that consensus, and it did so citing client demand, not a narrative cycle. That's a different kind of buy signal than a CT trend -- it's brokerage order flow telling a $10T platform what its own users are asking for.
Worth watching: which asset gets whitelisted next when the filter is actual account demand instead of social volume? Schwab said more coins are coming.
$BTC $ETH $TBOT #Solana #TradFi #TokenBot
tokenbot.com
The number that matters here isn't the SOL pop, it's the menu. For three months, the biggest brokerages treated "crypto" as a two-asset category: BTC and ETH, full stop. Schwab just broke that consensus, and it did so citing client demand, not a narrative cycle. That's a different kind of buy signal than a CT trend -- it's brokerage order flow telling a $10T platform what its own users are asking for.
Worth watching: which asset gets whitelisted next when the filter is actual account demand instead of social volume? Schwab said more coins are coming.
$BTC $ETH $TBOT #Solana #TradFi #TokenBot
tokenbot.com

158
·
--
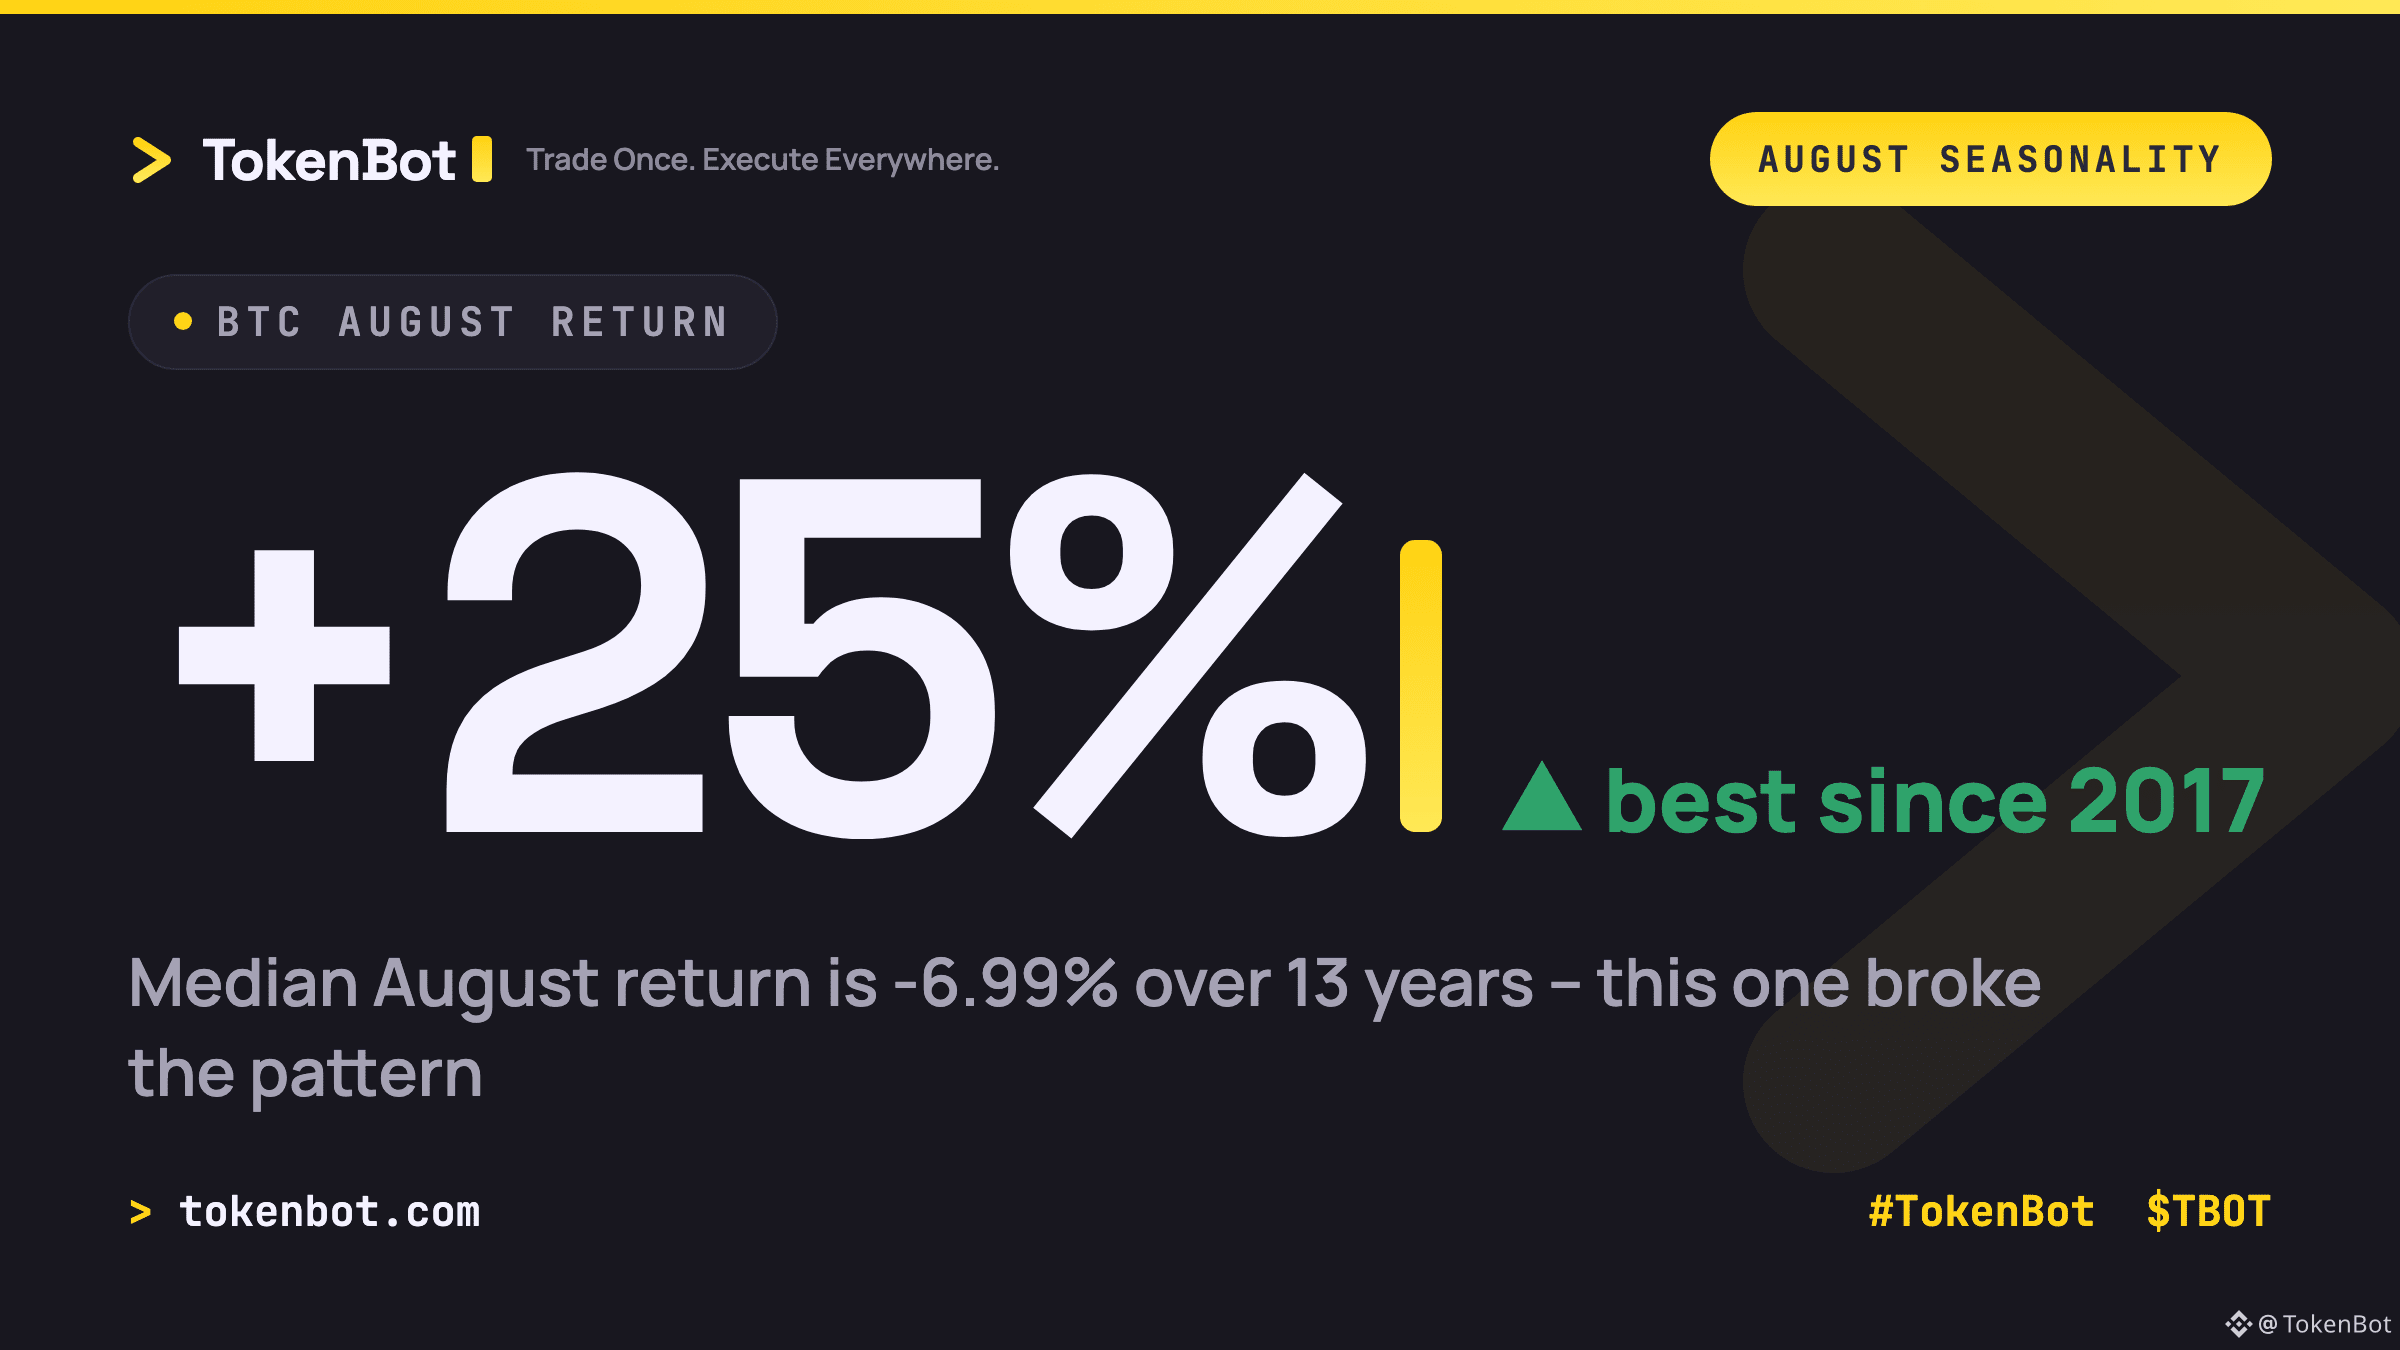
Bitcoin is up roughly 25% this August, putting it on pace for the best August since 2017 -- and the first green August since 2021.
That matters because August has quietly been bitcoin's worst seasonal month for over a decade: the median August return across the last 13 years is -6.99%, and there hasn't been a green one since 2021. Traders who lean on that seasonality -- shorting into August, fading summer strength -- got run over this year.
Whatever's behind the move (ETF flow, positioning unwind, macro), it isn't the calendar. Worth asking whether seasonality-based models need a rewrite, or if this year is simply the outlier that proves the rule.
How much of your book still runs on calendar-based seasonality signals?
$BTC $TBOT #Bitcoin #Crypto #TradingSignals #TokenBot
Bitcoin is up roughly 25% this August, putting it on pace for the best August since 2017 -- and the first green August since 2021.
That matters because August has quietly been bitcoin's worst seasonal month for over a decade: the median August return across the last 13 years is -6.99%, and there hasn't been a green one since 2021. Traders who lean on that seasonality -- shorting into August, fading summer strength -- got run over this year.
Whatever's behind the move (ETF flow, positioning unwind, macro), it isn't the calendar. Worth asking whether seasonality-based models need a rewrite, or if this year is simply the outlier that proves the rule.
How much of your book still runs on calendar-based seasonality signals?
$BTC $TBOT #Bitcoin #Crypto #TradingSignals #TokenBot
That matters because August has quietly been bitcoin's worst seasonal month for over a decade: the median August return across the last 13 years is -6.99%, and there hasn't been a green one since 2021. Traders who lean on that seasonality -- shorting into August, fading summer strength -- got run over this year.
Whatever's behind the move (ETF flow, positioning unwind, macro), it isn't the calendar. Worth asking whether seasonality-based models need a rewrite, or if this year is simply the outlier that proves the rule.
How much of your book still runs on calendar-based seasonality signals?
$BTC $TBOT #Bitcoin #Crypto #TradingSignals #TokenBot
138
Log in to explore more content
Join global crypto users on Binance Square
⚡️ Get latest and useful information about crypto.
💬 Trusted by the world’s largest crypto exchange.
👍 Discover real insights from verified creators.
Email / Phone number
Trending Topics
1
#FedRateWatch
562,934 views
2,670 Discussing
2
#BitcoinSlidesTo$76000
21,176 views
116 Discussing
3
#BitcoinReboundsTo$79K
61,739 views
401 Discussing
4
#StrategyMarketCapPassesFord
38,048 views
637 Discussing
5
#ClarityActOddsHalveOnPolymarket
55,564 views
530 Discussing
6
#US30YTreasuryYieldTops5.40%
32,504 views
355 Discussing
7
#BessentEndorsesFinalClarityActDraft
55,097 views
734 Discussing
8
#ZamaOpens16ConfidentialMorphoVaults
18,828 views
352 Discussing
9
#USDCOnChainVolumeTops$100Trillion
2,902 views
49 Discussing
10
#BitcoinSpotETFsNetInflow$160M
4,885 views
102 Discussing