
Capricorn7
2.3k Posts

Capricorn7
Navigating the Web3 space with a long-term vision.Rather than trading short-term volatility, I focus on holding quality crypto assets for the future💪#PrAy4@LL#
Open Trade
Occasional Trader
1.5 Years
2.9K+ Following
2.1K+ Followers
1.5K+ Liked
Posts
Portfolio
All
Quotes
Videos
Live
PINNED
PINNED


Moisa16
·
--
[Replay] 🎙️ Learning on BINANCE 💫
03 h 57 m 27 s · 2.3k listens

Twin Tulips
·
--
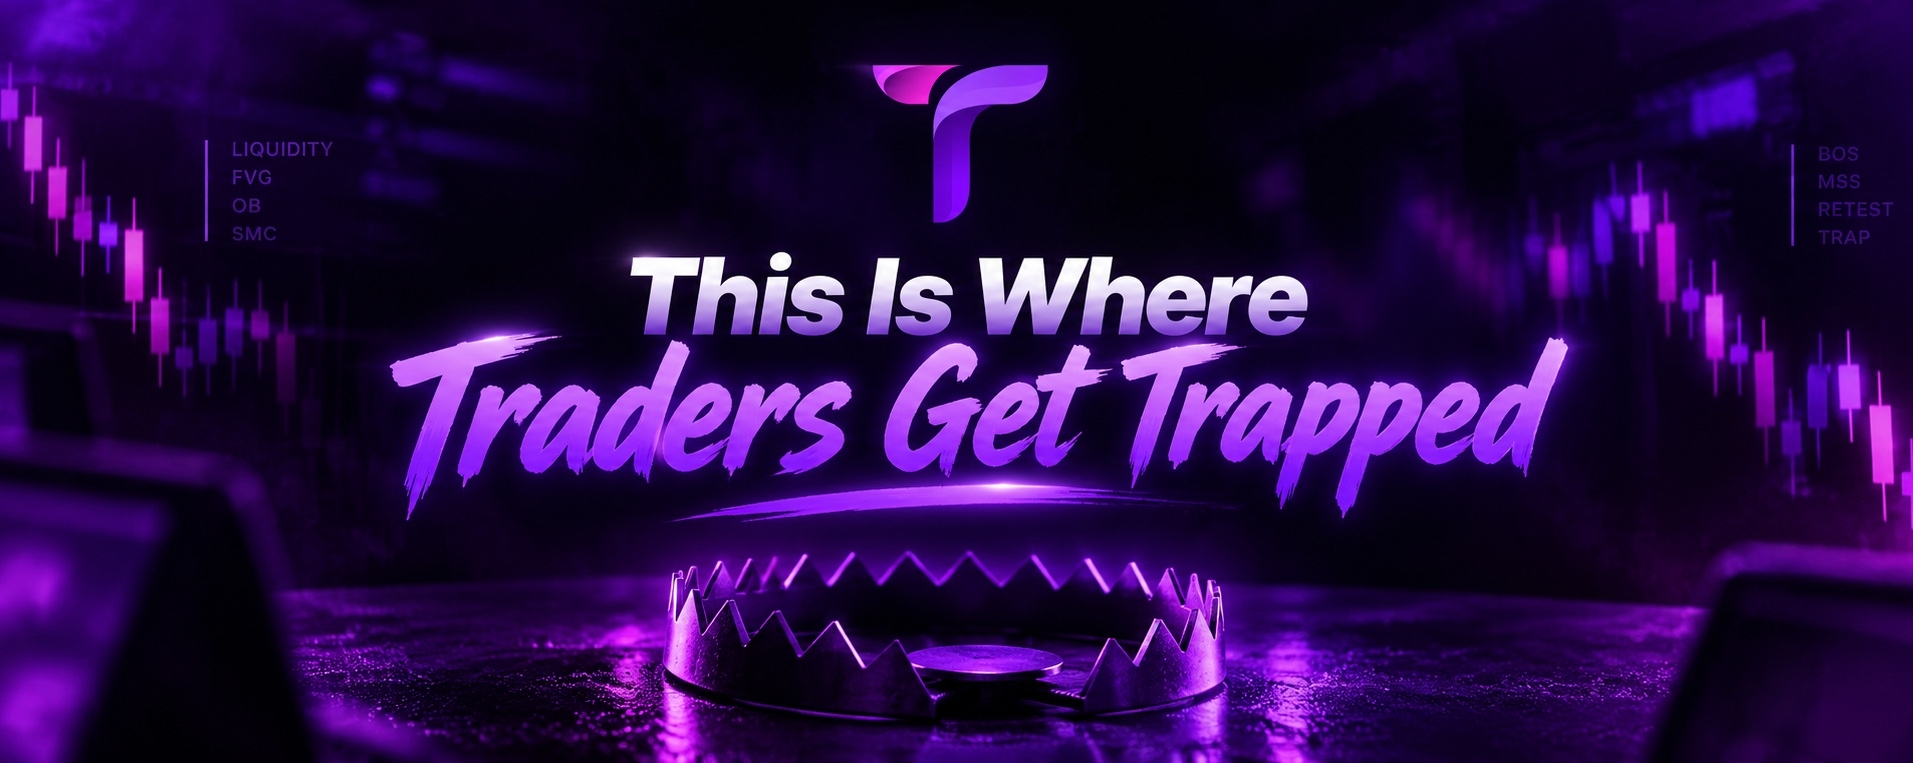
This Is Where Traders Get Trapped ‼️
Most traders think they lose because they entered the wrong direction.
But many times, the real problem is where they entered.
The market often creates a setup that looks perfect to the majority of traders. Price approaches an obvious high or low, breaks it with a strong candle, and suddenly everyone thinks the move has started.
That’s where the trap begins.
The Breakout Trap
Imagine price has been respecting a clear resistance level for several hours.
Everyone can see the same high.
Buy orders are waiting above it, while short sellers have their stop losses there.
Then price suddenly pushes above the high.
Retail traders see the breakout and enter long, expecting continuation.
But instead of continuing, price quickly reverses back below the level.
What happened?
The market may have simply taken the buy-side liquidity above that high.
The breakout wasn’t necessarily confirmation.
It was the liquidity sweep.
Don’t Chase the First Move
This is one of the biggest differences between an emotional trader and a patient trader.
An emotional trader sees:
Breakout → Entry → Hope
A patient trader looks for:
Liquidity Sweep → MSS → Retracement → Entry
After liquidity is taken, wait for a Market Structure Shift (MSS).
The MSS can provide evidence that the short-term direction has changed.
Then look for your execution area, such as an Order Block (OB), Fair Value Gap (FVG), or 0.71 Fibonacci area, depending on your strategy.
You don’t need to predict the reversal.
You need to wait for the market to show it.
Where Most Traders Get Trapped
There are usually three emotions behind these entries:
FOMO:
“Price is moving without me. I need to enter now.”
Confirmation Bias:
“The candle is huge, so the breakout must be real.”
Impatience:
“I can’t wait for another confirmation.”
These emotions push traders into the market at the exact moment when liquidity is being collected.
And once the reversal starts, they become the liquidity for someone else’s trade.
A Better Way to Read the Chart
Before entering, ask yourself:
Where is the liquidity?
Look for obvious equal highs, equal lows, previous highs/lows and areas where many traders are likely placing stops.
Then wait for the sequence:
Liquidity → Sweep → MSS → OB/FVG → Entry → Target Liquidity
This doesn’t guarantee a winning trade.
But it gives you a structured process instead of blindly chasing candles.
Remember This
The breakout is not always the opportunity. Sometimes, the breakout IS the trap.
You don’t get paid for entering first.
You get paid for entering when your setup is confirmed.
No Shift = No Trade.
Be patient. Let the market take liquidity first.
Then let the market prove your idea.
This post is for educational purposes only and cannot be taken as financial advice.
#CryptoTrading #TradingEducation #SMC #ICT #SmartMoneyConcepts #Liquidity #MSS #FVG #OrderBlock #PriceAction #ForexTrading #CryptoEducation #TwinTulips
But many times, the real problem is where they entered.
The market often creates a setup that looks perfect to the majority of traders. Price approaches an obvious high or low, breaks it with a strong candle, and suddenly everyone thinks the move has started.
That’s where the trap begins.
The Breakout Trap
Imagine price has been respecting a clear resistance level for several hours.
Everyone can see the same high.
Buy orders are waiting above it, while short sellers have their stop losses there.
Then price suddenly pushes above the high.
Retail traders see the breakout and enter long, expecting continuation.
But instead of continuing, price quickly reverses back below the level.
What happened?
The market may have simply taken the buy-side liquidity above that high.
The breakout wasn’t necessarily confirmation.
It was the liquidity sweep.
Don’t Chase the First Move
This is one of the biggest differences between an emotional trader and a patient trader.
An emotional trader sees:
Breakout → Entry → Hope
A patient trader looks for:
Liquidity Sweep → MSS → Retracement → Entry
After liquidity is taken, wait for a Market Structure Shift (MSS).
The MSS can provide evidence that the short-term direction has changed.
Then look for your execution area, such as an Order Block (OB), Fair Value Gap (FVG), or 0.71 Fibonacci area, depending on your strategy.
You don’t need to predict the reversal.
You need to wait for the market to show it.
Where Most Traders Get Trapped
There are usually three emotions behind these entries:
FOMO:
“Price is moving without me. I need to enter now.”
Confirmation Bias:
“The candle is huge, so the breakout must be real.”
Impatience:
“I can’t wait for another confirmation.”
These emotions push traders into the market at the exact moment when liquidity is being collected.
And once the reversal starts, they become the liquidity for someone else’s trade.
A Better Way to Read the Chart
Before entering, ask yourself:
Where is the liquidity?
Look for obvious equal highs, equal lows, previous highs/lows and areas where many traders are likely placing stops.
Then wait for the sequence:
Liquidity → Sweep → MSS → OB/FVG → Entry → Target Liquidity
This doesn’t guarantee a winning trade.
But it gives you a structured process instead of blindly chasing candles.
Remember This
The breakout is not always the opportunity. Sometimes, the breakout IS the trap.
You don’t get paid for entering first.
You get paid for entering when your setup is confirmed.
No Shift = No Trade.
Be patient. Let the market take liquidity first.
Then let the market prove your idea.
This post is for educational purposes only and cannot be taken as financial advice.
#CryptoTrading #TradingEducation #SMC #ICT #SmartMoneyConcepts #Liquidity #MSS #FVG #OrderBlock #PriceAction #ForexTrading #CryptoEducation #TwinTulips

CANProtocol
·
--
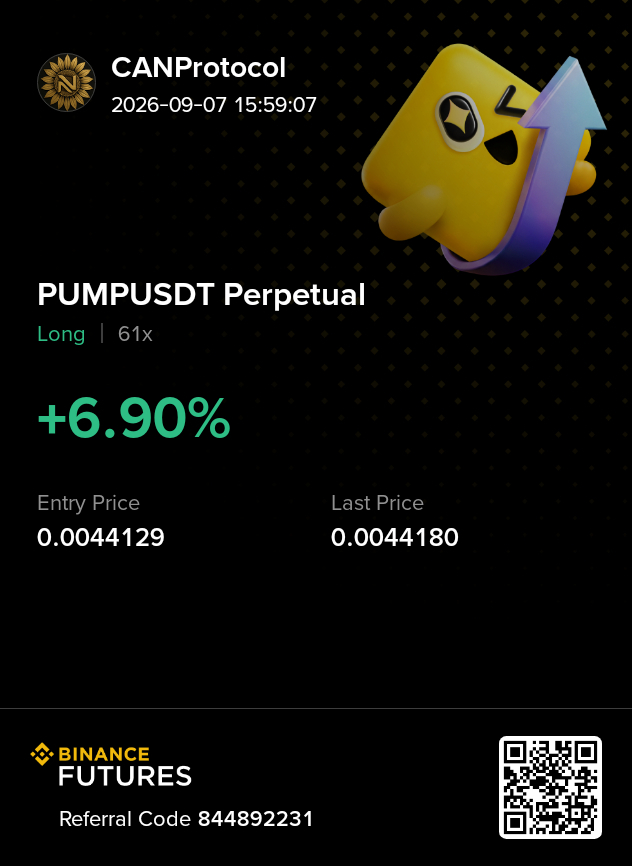
Bullish$PUMP LONG
ENTRY : Now
TP : 0.0045, 0.0048, 0.0052, 0.0058
SL : 0.004158
use proper risk management. SL is adjustable. Best Wishes 💚 #CANProtocol
ENTRY : Now
TP : 0.0045, 0.0048, 0.0052, 0.0058
SL : 0.004158
use proper risk management. SL is adjustable. Best Wishes 💚 #CANProtocol

POCHITA 2113 保拉
·
--
Bullish📊 XRP/USDC – Quick 5M Analysis
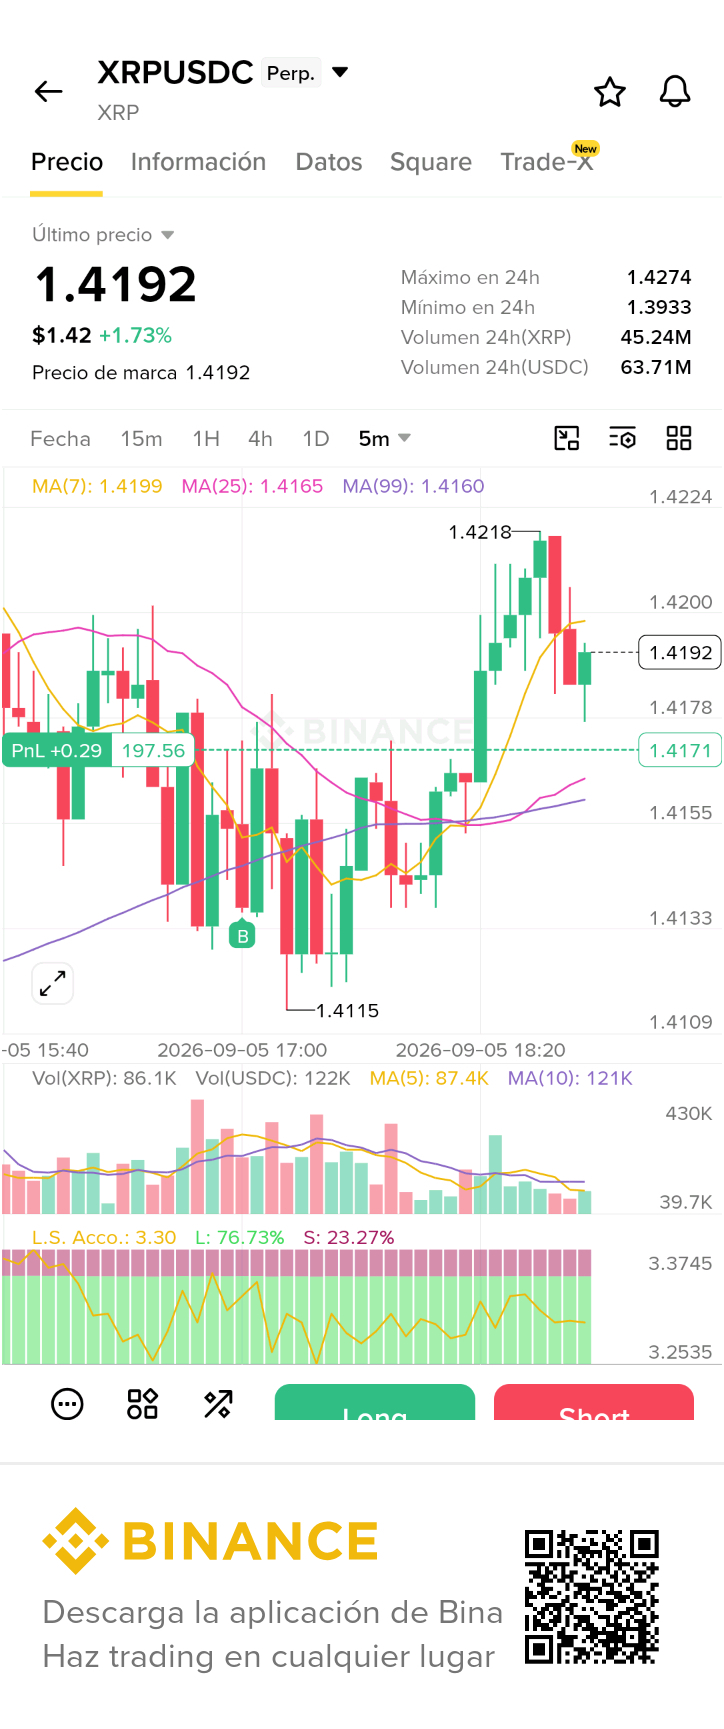
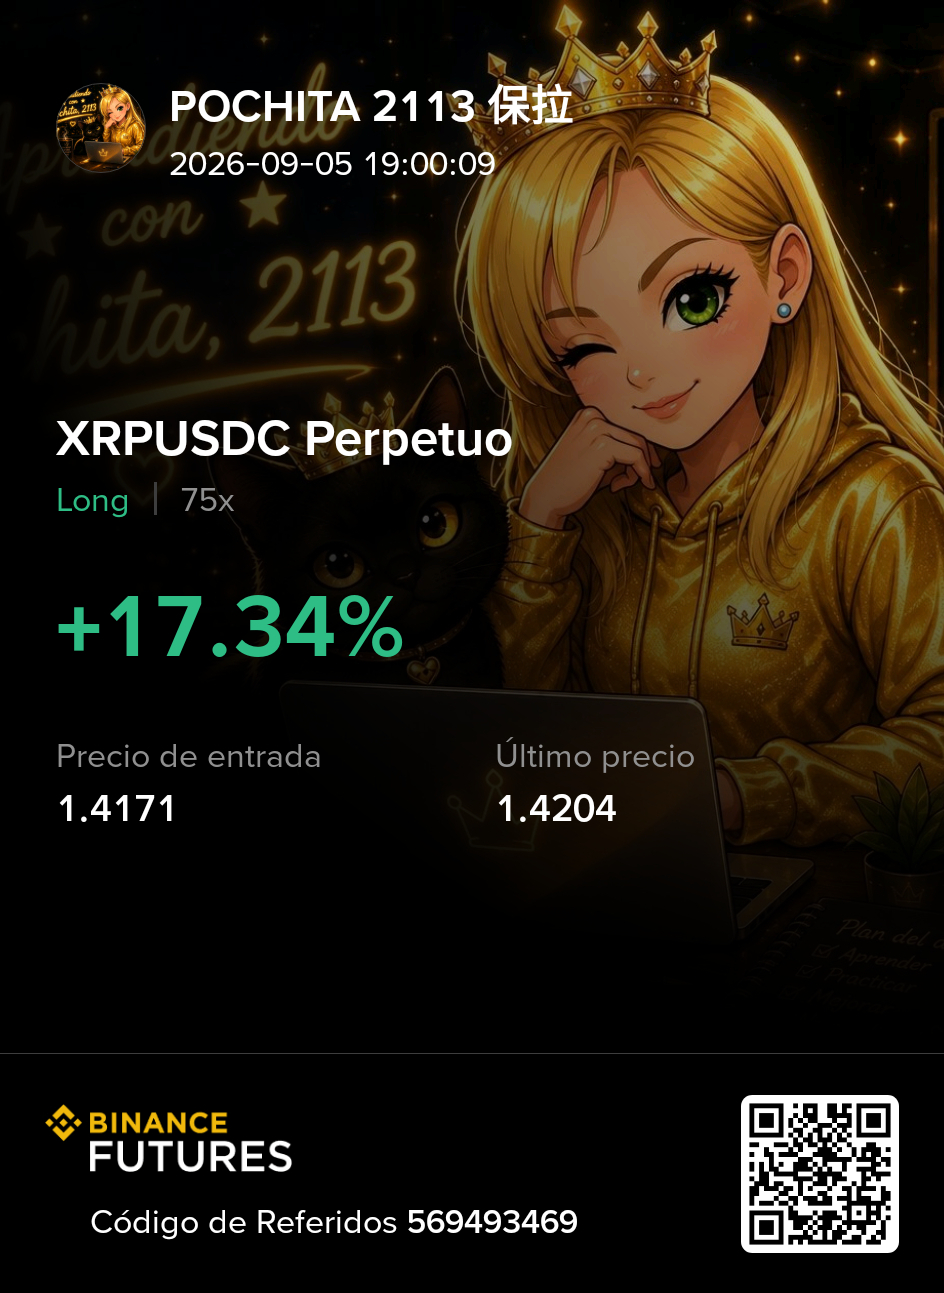
🚀 XRP is coming in with strong bullish momentum, recovering from the 1.4115 zone and reaching 1.4218.
🔹 Resistance: 1.4218–1.4224
🔹 Key support: 1.4170
🔹 MA(7) > MA(25) > MA(99): favorable structure for buyers.
⚠️ We’re now seeing a small pullback after the rejection at 1.4218.
👉 If it holds 1.4170, it could try again to break 1.4224.
👉 If it loses that support, it could look for a deeper correction.
🔥 XRP is in a decision zone: will it break resistance or take a breather?
Not financial advice; the chart can change quickly. 🔜 $XRP
🚀 XRP is coming in with strong bullish momentum, recovering from the 1.4115 zone and reaching 1.4218.
🔹 Resistance: 1.4218–1.4224
🔹 Key support: 1.4170
🔹 MA(7) > MA(25) > MA(99): favorable structure for buyers.
⚠️ We’re now seeing a small pullback after the rejection at 1.4218.
👉 If it holds 1.4170, it could try again to break 1.4224.
👉 If it loses that support, it could look for a deeper correction.
🔥 XRP is in a decision zone: will it break resistance or take a breather?
Not financial advice; the chart can change quickly. 🔜 $XRP
POCHITA 2113 保拉
·
--
Bullish🚨 WHAT COULD BTC BRING US THIS WEEKEND? ₿
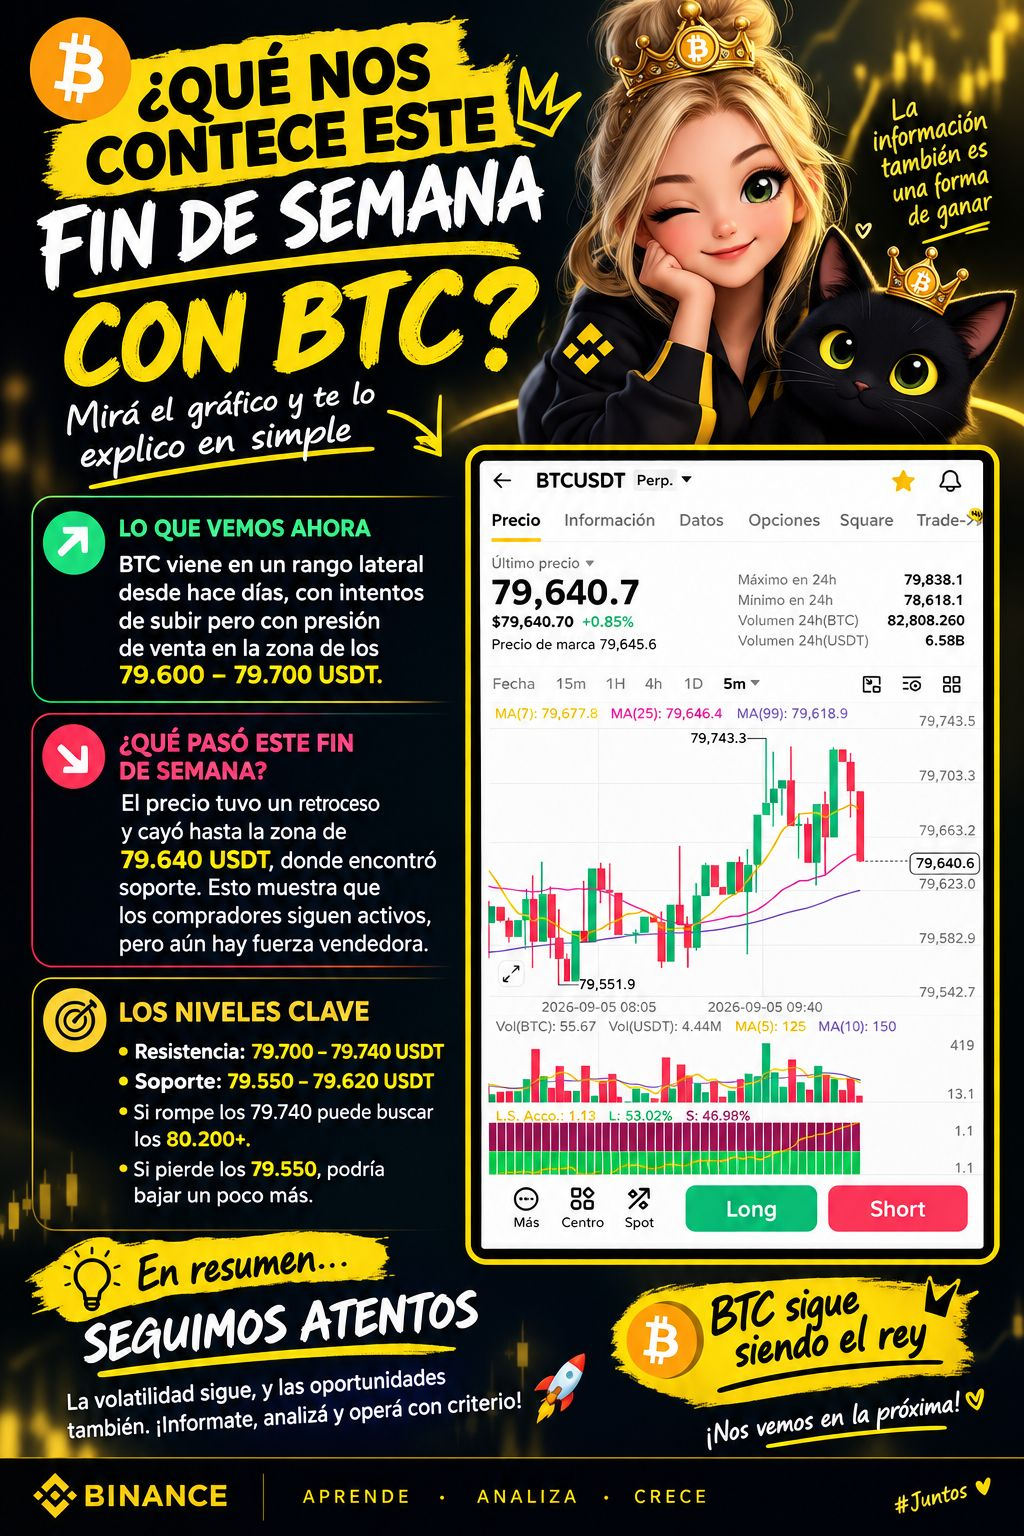
Bitcoin heads into the weekend near 79,600 USDT, in an area where buyers and sellers are fighting hard. 👀
📈 Resistance: 79,700 – 79,740
📉 Support: 79,550 – 79,620
👉 If it breaks 79,740 with strength, we could see an attempt toward 80,000+.
👉 If it loses 79,550, the chance of a pullback increases.
⚠️ Let’s remember: the weekend can bring fast moves and false breakouts. It’s not about guessing, but about waiting for confirmations and managing risk.
💬 What do you think? Will BTC break 80K this weekend or go back to look for support? 👇🔥
Bitcoin heads into the weekend near 79,600 USDT, in an area where buyers and sellers are fighting hard. 👀
📈 Resistance: 79,700 – 79,740
📉 Support: 79,550 – 79,620
👉 If it breaks 79,740 with strength, we could see an attempt toward 80,000+.
👉 If it loses 79,550, the chance of a pullback increases.
⚠️ Let’s remember: the weekend can bring fast moves and false breakouts. It’s not about guessing, but about waiting for confirmations and managing risk.
💬 What do you think? Will BTC break 80K this weekend or go back to look for support? 👇🔥
POCHITA 2113 保拉
·
--
🦋🦋🦋🦋🧧🦋🦋🦋🦋

Pixie Decor
·
--
Major headlines for an era of major changes
Starting October 3, there are high expectations that Hyperliquid will generate more than an additional $180 million in annual revenue.
Focus on NVIDIA: The GPU manufacturer will release its quarterly results tomorrow, August 26. At this time, NVIDIA shares point to a 5.4% change after the results are published.
RedotPay expects a fourfold growth in the use of Stablecoin cards.
The stablecoin payments company anticipates up to $50 billion globally in spending on stablecoin cards.
Focus on NVIDIA: The GPU manufacturer will release its quarterly results tomorrow, August 26. At this time, NVIDIA shares point to a 5.4% change after the results are published.
RedotPay expects a fourfold growth in the use of Stablecoin cards.
The stablecoin payments company anticipates up to $50 billion globally in spending on stablecoin cards.
POCHITA 2113 保拉
·
--
[Ended] 🎙️ happy start of the week success is for everyone with POCHITA2113
3.6k listens

Peke 愛 Puppies
·
--
BullishQuantum computers haven’t arrived yet, but Ripple has already slipped $XRP Ledger in some body armor
In the past few days, everyone has been talking about gains and losses. Today there’s a piece of news that has little to do with the candlestick chart, yet it may be more important than any single green candle—Ripple has officially released a quantum-resilience roadmap for the XRP Ledger, with the goal of being fully quantum-ready by 2028.
First, let’s clarify what a “Q Day” is: the day when quantum computers become powerful enough to break today’s cryptographic algorithms. This used to sound more like science fiction, but in this four-phase plan there’s a chilling detail— the research team tested an Anthropic model and calculated the work required to break a leading post-quantum signature candidate scheme, cutting it by 67 times directly. AI is helping people build walls, and also helping them find ladders—how surreal.
So this roadmap isn’t just step-by-step; it also includes a “Q Day emergency plan”: if quantum threats arrive early, the chain can immediately kick off an emergency mechanism. And recently, quantum research has kept adjusting threat timelines—some scenarios already put it as early as 2032. That’s not “ten years from now.” It feels like you blink and it’s here.
Back to the market: today the leaders aren’t moving much. $BTC is hovering around $78,000, while $ETH is about 2,450. XRP is up 1.13%, with a market cap of roughly $87.6 billion. On the same day everyone is watching the candlesticks, XRP is actually showing technical strength instead: the price doesn’t move much, but the chain is already dressing itself in body armor ahead of time.
#首笔抗量子比特币交易主网完成 #比特币现货ETF结束9日净流入 #日元跌破160创一个月新低
At the end of the day, price is a projection of sentiment—the roadmap is where the confidence comes from. When the market is flat, some people are still willing to do the groundwork early for risks that could play out in eight or ten years. That kind of drive, working quietly even when no one’s watching, is completely different from projects that only show up when it’s exciting. Pumping can create candlestick charts; only gathering together can create history. Some projects 🐶 are betting on the latter.
🐶 Let’s take a look at Rocket Brother’s little doggie ✨🚀
In the past few days, everyone has been talking about gains and losses. Today there’s a piece of news that has little to do with the candlestick chart, yet it may be more important than any single green candle—Ripple has officially released a quantum-resilience roadmap for the XRP Ledger, with the goal of being fully quantum-ready by 2028.
First, let’s clarify what a “Q Day” is: the day when quantum computers become powerful enough to break today’s cryptographic algorithms. This used to sound more like science fiction, but in this four-phase plan there’s a chilling detail— the research team tested an Anthropic model and calculated the work required to break a leading post-quantum signature candidate scheme, cutting it by 67 times directly. AI is helping people build walls, and also helping them find ladders—how surreal.
So this roadmap isn’t just step-by-step; it also includes a “Q Day emergency plan”: if quantum threats arrive early, the chain can immediately kick off an emergency mechanism. And recently, quantum research has kept adjusting threat timelines—some scenarios already put it as early as 2032. That’s not “ten years from now.” It feels like you blink and it’s here.
Back to the market: today the leaders aren’t moving much. $BTC is hovering around $78,000, while $ETH is about 2,450. XRP is up 1.13%, with a market cap of roughly $87.6 billion. On the same day everyone is watching the candlesticks, XRP is actually showing technical strength instead: the price doesn’t move much, but the chain is already dressing itself in body armor ahead of time.
#首笔抗量子比特币交易主网完成 #比特币现货ETF结束9日净流入 #日元跌破160创一个月新低
At the end of the day, price is a projection of sentiment—the roadmap is where the confidence comes from. When the market is flat, some people are still willing to do the groundwork early for risks that could play out in eight or ten years. That kind of drive, working quietly even when no one’s watching, is completely different from projects that only show up when it’s exciting. Pumping can create candlestick charts; only gathering together can create history. Some projects 🐶 are betting on the latter.
🐶 Let’s take a look at Rocket Brother’s little doggie ✨🚀


POCHITA 2113 保拉
·
--
[Ended] 🎙️ HAPPY THURSDAY with Pochita 2112 successes for everyone
3.1k listens
Twin Tulips
·
--
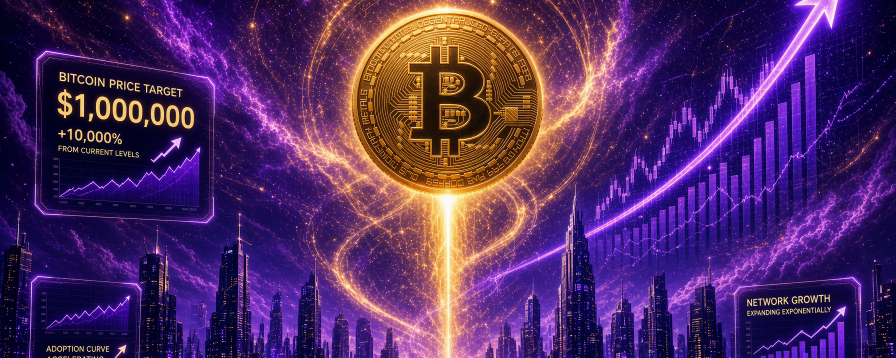
Could Bitcoin Reach $1 Million?
A $1 million Bitcoin has been one of the biggest long-term targets in crypto. It sounds extreme today, but the mathematics behind the target is worth understanding.
At $1 million per BTC, Bitcoin’s valuation would approach $20–21 trillion, depending on the circulating supply used. Bitcoin’s maximum supply is fixed at 21 million coins, and more than 20 million BTC have already been mined. (The Block)
That would make Bitcoin one of the largest stores of value in the world.
So, what would need to happen?
1. Bitcoin Becomes Digital Gold
The strongest argument for $1 million is Bitcoin’s potential to capture a significant share of the global store-of-value market.
Gold already represents a massive pool of wealth. If investors increasingly treat Bitcoin as a digital alternative to gold, even a partial shift of capital could dramatically increase BTC’s valuation.
Bitcoin doesn’t need to replace gold completely.
It only needs to capture a meaningful portion of the capital currently looking for scarce assets.
2. Institutional Adoption Accelerates
Institutional access has changed the Bitcoin market.
ETFs, regulated custody and professional investment products have made BTC easier for traditional investors to own. If pension funds, asset managers, corporations and sovereign institutions continue increasing their allocations, the potential demand pool becomes much larger.
Bitcoin recently moved above $80,000 again, with renewed investor demand and a softer dollar helping the latest rally. (Reuters)
The bigger question is whether this demand can continue for years rather than weeks.
3. Supply Remains Limited
Bitcoin’s biggest structural advantage is scarcity.
There can never be more than 21 million BTC under the current protocol rules. More than 95% of the eventual supply has already been mined. (Binance)
At the same time, some Bitcoin is believed to be permanently inaccessible because of lost keys.
This creates an interesting supply-demand equation:
Limited supply + increasing demand = potential long-term price appreciation.
But scarcity alone doesn’t guarantee a $1 million price.
Demand still has to become enormous.
4. Global Monetary Expansion
Another potential catalyst is the growth of global money and debt.
If investors become increasingly concerned about inflation, currency debasement or excessive government debt, scarce assets could attract more capital.
Bitcoin’s fixed monetary policy makes it particularly attractive to investors looking for an asset whose supply cannot simply be expanded by a central authority.
5. The Biggest Obstacle
The biggest challenge is valuation.
A $1 million Bitcoin would require a market value of roughly $20 trillion or more. (CoinLedger)
That means Bitcoin would need to absorb an enormous amount of global capital.
It also means the journey would almost certainly not be straight.
There could be multiple 30%, 50% or even larger corrections along the way.
So, Can It Happen?
Yes, it is mathematically possible.
But whether Bitcoin reaches $1 million depends on adoption, liquidity, institutional allocation, macroeconomic conditions and whether BTC becomes a dominant global store of value.
The important point is that $1 million isn’t simply a price target.
It represents a world where Bitcoin has become a $20+ trillion global asset.
The real question isn’t:
“Can Bitcoin reach $1 million?”
It’s:
“Can Bitcoin become important enough to justify a $20 trillion valuation?”
If the answer eventually becomes yes, the $1 million Bitcoin target stops looking impossible and starts looking like a consequence of massive global adoption.
This article is for educational purposes only and should not be considered financial advice.
At $1 million per BTC, Bitcoin’s valuation would approach $20–21 trillion, depending on the circulating supply used. Bitcoin’s maximum supply is fixed at 21 million coins, and more than 20 million BTC have already been mined. (The Block)
That would make Bitcoin one of the largest stores of value in the world.
So, what would need to happen?
1. Bitcoin Becomes Digital Gold
The strongest argument for $1 million is Bitcoin’s potential to capture a significant share of the global store-of-value market.
Gold already represents a massive pool of wealth. If investors increasingly treat Bitcoin as a digital alternative to gold, even a partial shift of capital could dramatically increase BTC’s valuation.
Bitcoin doesn’t need to replace gold completely.
It only needs to capture a meaningful portion of the capital currently looking for scarce assets.
2. Institutional Adoption Accelerates
Institutional access has changed the Bitcoin market.
ETFs, regulated custody and professional investment products have made BTC easier for traditional investors to own. If pension funds, asset managers, corporations and sovereign institutions continue increasing their allocations, the potential demand pool becomes much larger.
Bitcoin recently moved above $80,000 again, with renewed investor demand and a softer dollar helping the latest rally. (Reuters)
The bigger question is whether this demand can continue for years rather than weeks.
3. Supply Remains Limited
Bitcoin’s biggest structural advantage is scarcity.
There can never be more than 21 million BTC under the current protocol rules. More than 95% of the eventual supply has already been mined. (Binance)
At the same time, some Bitcoin is believed to be permanently inaccessible because of lost keys.
This creates an interesting supply-demand equation:
Limited supply + increasing demand = potential long-term price appreciation.
But scarcity alone doesn’t guarantee a $1 million price.
Demand still has to become enormous.
4. Global Monetary Expansion
Another potential catalyst is the growth of global money and debt.
If investors become increasingly concerned about inflation, currency debasement or excessive government debt, scarce assets could attract more capital.
Bitcoin’s fixed monetary policy makes it particularly attractive to investors looking for an asset whose supply cannot simply be expanded by a central authority.
5. The Biggest Obstacle
The biggest challenge is valuation.
A $1 million Bitcoin would require a market value of roughly $20 trillion or more. (CoinLedger)
That means Bitcoin would need to absorb an enormous amount of global capital.
It also means the journey would almost certainly not be straight.
There could be multiple 30%, 50% or even larger corrections along the way.
So, Can It Happen?
Yes, it is mathematically possible.
But whether Bitcoin reaches $1 million depends on adoption, liquidity, institutional allocation, macroeconomic conditions and whether BTC becomes a dominant global store of value.
The important point is that $1 million isn’t simply a price target.
It represents a world where Bitcoin has become a $20+ trillion global asset.
The real question isn’t:
“Can Bitcoin reach $1 million?”
It’s:
“Can Bitcoin become important enough to justify a $20 trillion valuation?”
If the answer eventually becomes yes, the $1 million Bitcoin target stops looking impossible and starts looking like a consequence of massive global adoption.
This article is for educational purposes only and should not be considered financial advice.

Augustingo_交易40
·
--
[Ended] 🎙️ Let’s go, Lions 🦁 to fight the crypto market 💹
533 listens
Augustingo_交易40
·
--
Post, Share, and Earn on Binance Square! 💰🚀
Did you know that your market analyses, ideas, and opinions can generate daily income? With the dynamics of Publish and Earn, every interaction and every reader matters.
$BTC
How do you get the most out of it?
Provide real value: Share technical analysis, key news, or your day-to-day reflections on trading.
Be consistent: Staying present and posting frequently helps the algorithm recommend your content to new users.
Start a conversation: Ask questions at the end of your posts to encourage comments and debate in the community.
$BTC
How do you get the most out of it?
Provide real value: Share technical analysis, key news, or your day-to-day reflections on trading.
Be consistent: Staying present and posting frequently helps the algorithm recommend your content to new users.
Start a conversation: Ask questions at the end of your posts to encourage comments and debate in the community.

POCHITA 2113 保拉
·
--
Bullish📊 What is the Parabolic SAR and how can it help you understand a trend?
If you’re just starting to learn about trading, you’re probably finding many indicators on the charts. One of them is the Parabolic SAR. 📈
🔹 What does SAR mean?
SAR stands for Stop And Reverse, which can be translated as “stop and reverse”.
This indicator appears on the chart as small dots that can be placed above or below the price.
🟢 When the dots are below the price:
It may indicate an uptrend or buying pressure. 📈
🔴 When the dots appear above the price:
It may indicate a downtrend or selling pressure. 📉
🔄 When the dots switch from one side of the price to the other:
It can be a signal that the trend is losing strength or that a possible direction change could be occurring.
⚠️ Important:
The Parabolic SAR should not be used as a magical signal to buy or sell. It’s an analysis tool that may work better when combined with other indicators, such as:
📊 Moving averages
📈 Volume
📉 Supports and resistances
🔎 RSI or other indicators
💡 Tip for beginners: Before placing a trade, watch the overall trend and learn how the price behaves. Indicators are support tools, but we must always manage risk.
📚 Little by little, indicator by indicator, we can learn to better understand the charts.
Did you already know about the Parabolic SAR? 👇😊
#trading #AprenderTrading #Criptomon
#BinanceSquareTalks #ParabolicSAR @jesustraderlux @FerDanzigPY @Moisa16
If you’re just starting to learn about trading, you’re probably finding many indicators on the charts. One of them is the Parabolic SAR. 📈
🔹 What does SAR mean?
SAR stands for Stop And Reverse, which can be translated as “stop and reverse”.
This indicator appears on the chart as small dots that can be placed above or below the price.
🟢 When the dots are below the price:
It may indicate an uptrend or buying pressure. 📈
🔴 When the dots appear above the price:
It may indicate a downtrend or selling pressure. 📉
🔄 When the dots switch from one side of the price to the other:
It can be a signal that the trend is losing strength or that a possible direction change could be occurring.
⚠️ Important:
The Parabolic SAR should not be used as a magical signal to buy or sell. It’s an analysis tool that may work better when combined with other indicators, such as:
📊 Moving averages
📈 Volume
📉 Supports and resistances
🔎 RSI or other indicators
💡 Tip for beginners: Before placing a trade, watch the overall trend and learn how the price behaves. Indicators are support tools, but we must always manage risk.
📚 Little by little, indicator by indicator, we can learn to better understand the charts.
Did you already know about the Parabolic SAR? 👇😊
#trading #AprenderTrading #Criptomon
#BinanceSquareTalks #ParabolicSAR @jesustraderlux @FerDanzigPY @Moisa16
CANProtocol
·
--
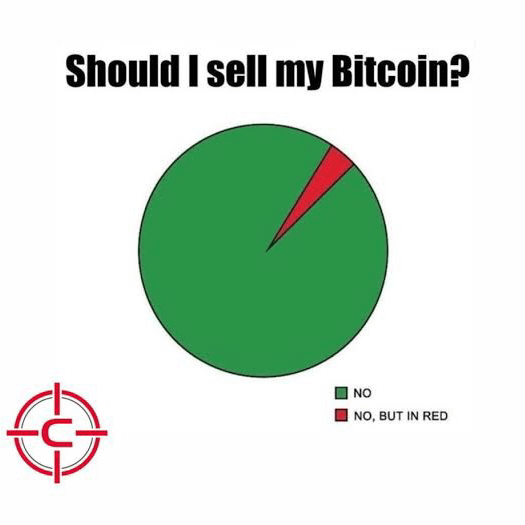
Guys don't forget this: NEVER SELL YOUR BITCOIN 💚
POCHITA 2113 保拉
·
--
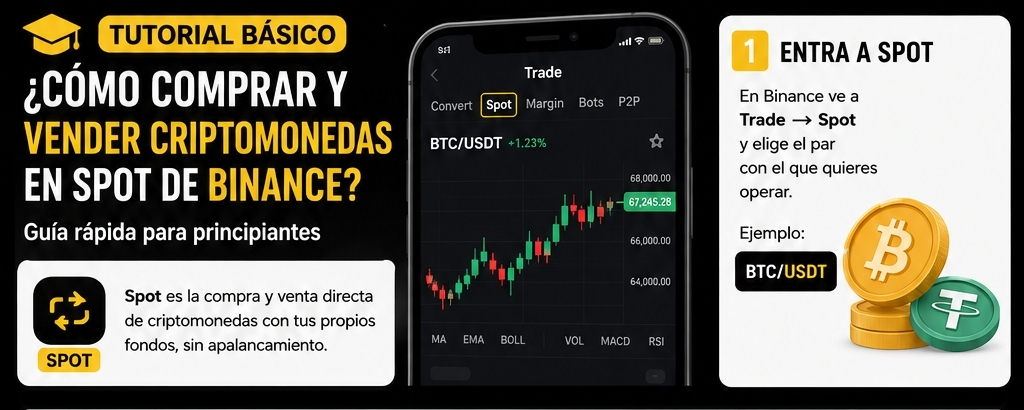
📚 Basic tutorial: How to do Spot Trading on Binance?
If you're starting out in the crypto world, Spot is one of the simplest ways to learn how to buy and sell cryptocurrencies.
🟢 1. Go to Spot
On Binance, go to Trade → Spot and select the pair you want to trade.
Example: BTC/USDT.
💰 2. Buy
When Buying, you can choose:
🔹 Market: you buy immediately at the best available price.
🔹 Limit: you choose the price at which you want to buy, and the order waits until the market reaches that price.
Example: you have 50 USDT and want to buy BTC. You select BTC/USDT, enter the amount, and confirm the purchase.
🟢 1. Go to Spot
On Binance, go to Trade → Spot and select the pair you want to trade.
Example: BTC/USDT.
💰 2. Buy
When Buying, you can choose:
🔹 Market: you buy immediately at the best available price.
🔹 Limit: you choose the price at which you want to buy, and the order waits until the market reaches that price.
Example: you have 50 USDT and want to buy BTC. You select BTC/USDT, enter the amount, and confirm the purchase.
POCHITA 2113 保拉
·
--
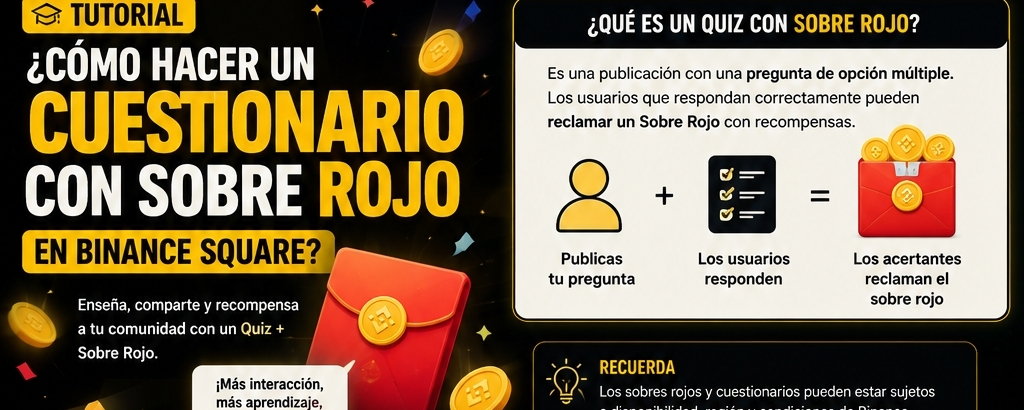
🧧📚 TUTORIAL: How to Create a Quiz with a Red Packet?
Do you want to teach something on Binance Square while also rewarding those who answer correctly? You can do it with a Red Packet Quiz.
1️⃣ CREATE YOUR QUESTION
Think of a simple question related to the topic of your post.
Example:
❓ What cryptocurrency was created by Satoshi Nakamoto?
A) ETH
B) BTC
C) BNB
✅ Correct answer: BTC
2️⃣ CREATE THE RED ENVELOPE 🧧
When preparing your post, select the Red Packet option and set the reward you want to share.
1️⃣ CREATE YOUR QUESTION
Think of a simple question related to the topic of your post.
Example:
❓ What cryptocurrency was created by Satoshi Nakamoto?
A) ETH
B) BTC
C) BNB
✅ Correct answer: BTC
2️⃣ CREATE THE RED ENVELOPE 🧧
When preparing your post, select the Red Packet option and set the reward you want to share.
Log in to explore more content