
Gabbbar
15 Posts

Gabbbar
Report
Block User
High-Frequency Trader
5.7 Years
37 Following
13 Followers
2 Liked
Posts
·
--
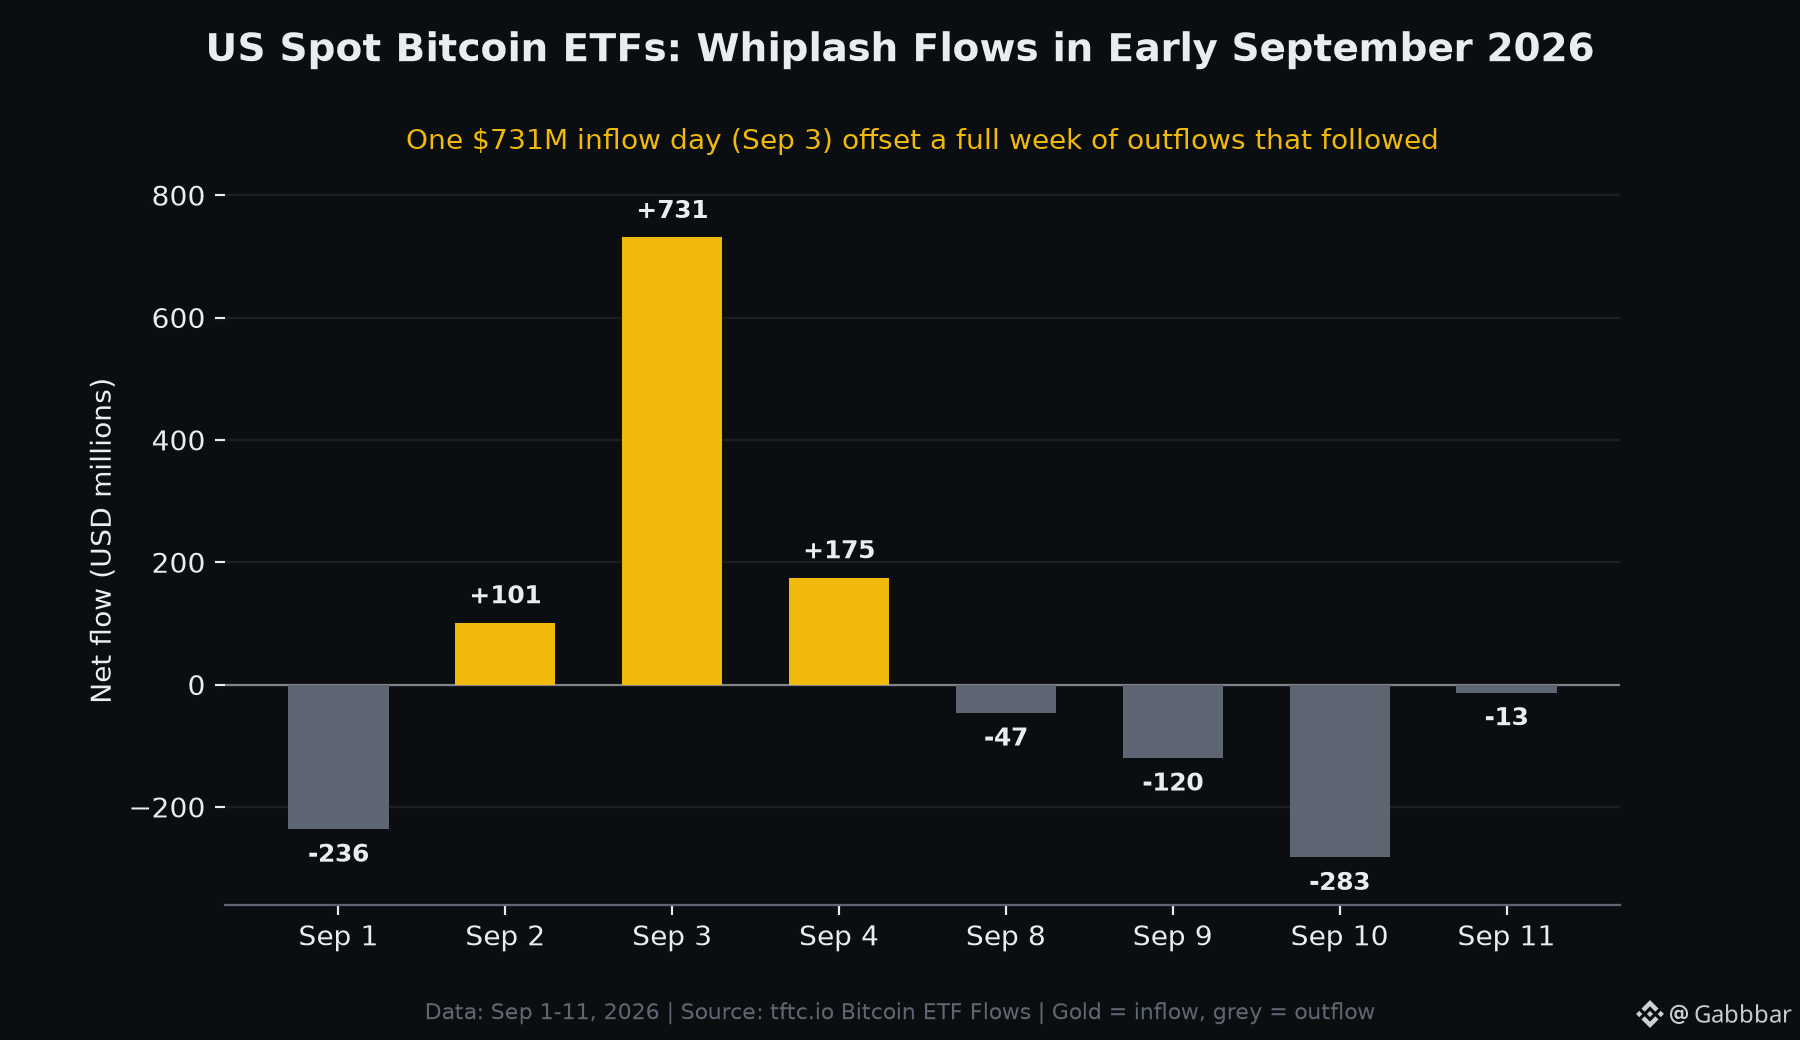
One record day did most of the work. On September 3, 2026, US spot Bitcoin ETFs pulled in $730.9 million in a single session -- their largest daily net inflow since January 2026. But zoom out to the eleven days around it and the picture is far messier than one green bar suggests.
Here is the full early-September sequence (net flows, USD):
- Sep 1: -$236.5M (outflow)
- Sep 2: +$101.1M
- Sep 3: +$730.9M
- Sep 4: +$174.6M
- Sep 8: -$46.6M
- Sep 9: -$120.2M
- Sep 10: -$282.6M
- Sep 11: -$13.3M
Add it up and the eight trading days net to roughly +$307M. In other words, the entire stretch was positive only because of that one Sep 3 spike -- every session that followed it saw money leave.
A concentration detail worth noting: on Sep 3, BlackRock's IBIT alone captured about $454M, more than 60% of all money entering the sector that day, with ARKB (~$138M) and FBTC (~$74M) taking most of the rest. Single-day totals are increasingly driven by one or two funds.
For context, combined US Bitcoin ETF net assets sat near $103.34 billion as of early September 2026 -- roughly 6.3% of Bitcoin's total market cap.
The takeaway isn't direction, it's dispersion: daily ETF flow headlines can swing from record inflow to week-long outflow within days. When you see a single-day flow number, what's the right window to judge institutional demand -- a day, a week, or a month?
#Bitcoin #BitcoinETF #CryptoNews
One record day did most of the work. On September 3, 2026, US spot Bitcoin ETFs pulled in $730.9 million in a single session -- their largest daily net inflow since January 2026. But zoom out to the eleven days around it and the picture is far messier than one green bar suggests.
Here is the full early-September sequence (net flows, USD):
- Sep 1: -$236.5M (outflow)
- Sep 2: +$101.1M
- Sep 3: +$730.9M
- Sep 4: +$174.6M
- Sep 8: -$46.6M
- Sep 9: -$120.2M
- Sep 10: -$282.6M
- Sep 11: -$13.3M
Add it up and the eight trading days net to roughly +$307M. In other words, the entire stretch was positive only because of that one Sep 3 spike -- every session that followed it saw money leave.
A concentration detail worth noting: on Sep 3, BlackRock's IBIT alone captured about $454M, more than 60% of all money entering the sector that day, with ARKB (~$138M) and FBTC (~$74M) taking most of the rest. Single-day totals are increasingly driven by one or two funds.
For context, combined US Bitcoin ETF net assets sat near $103.34 billion as of early September 2026 -- roughly 6.3% of Bitcoin's total market cap.
The takeaway isn't direction, it's dispersion: daily ETF flow headlines can swing from record inflow to week-long outflow within days. When you see a single-day flow number, what's the right window to judge institutional demand -- a day, a week, or a month?
#Bitcoin #BitcoinETF #CryptoNews
Here is the full early-September sequence (net flows, USD):
- Sep 1: -$236.5M (outflow)
- Sep 2: +$101.1M
- Sep 3: +$730.9M
- Sep 4: +$174.6M
- Sep 8: -$46.6M
- Sep 9: -$120.2M
- Sep 10: -$282.6M
- Sep 11: -$13.3M
Add it up and the eight trading days net to roughly +$307M. In other words, the entire stretch was positive only because of that one Sep 3 spike -- every session that followed it saw money leave.
A concentration detail worth noting: on Sep 3, BlackRock's IBIT alone captured about $454M, more than 60% of all money entering the sector that day, with ARKB (~$138M) and FBTC (~$74M) taking most of the rest. Single-day totals are increasingly driven by one or two funds.
For context, combined US Bitcoin ETF net assets sat near $103.34 billion as of early September 2026 -- roughly 6.3% of Bitcoin's total market cap.
The takeaway isn't direction, it's dispersion: daily ETF flow headlines can swing from record inflow to week-long outflow within days. When you see a single-day flow number, what's the right window to judge institutional demand -- a day, a week, or a month?
#Bitcoin #BitcoinETF #CryptoNews
59
·
--
Bitcoin dominance is one of the most quoted numbers in crypto — and one of the least consistent.
Check three trackers right now and you might see 57%, 59%, and 60%. None of them is wrong. They're answering slightly different questions.
The formula is simple: BTC market cap ÷ total crypto market cap × 100.
The argument is over what goes in the denominator.
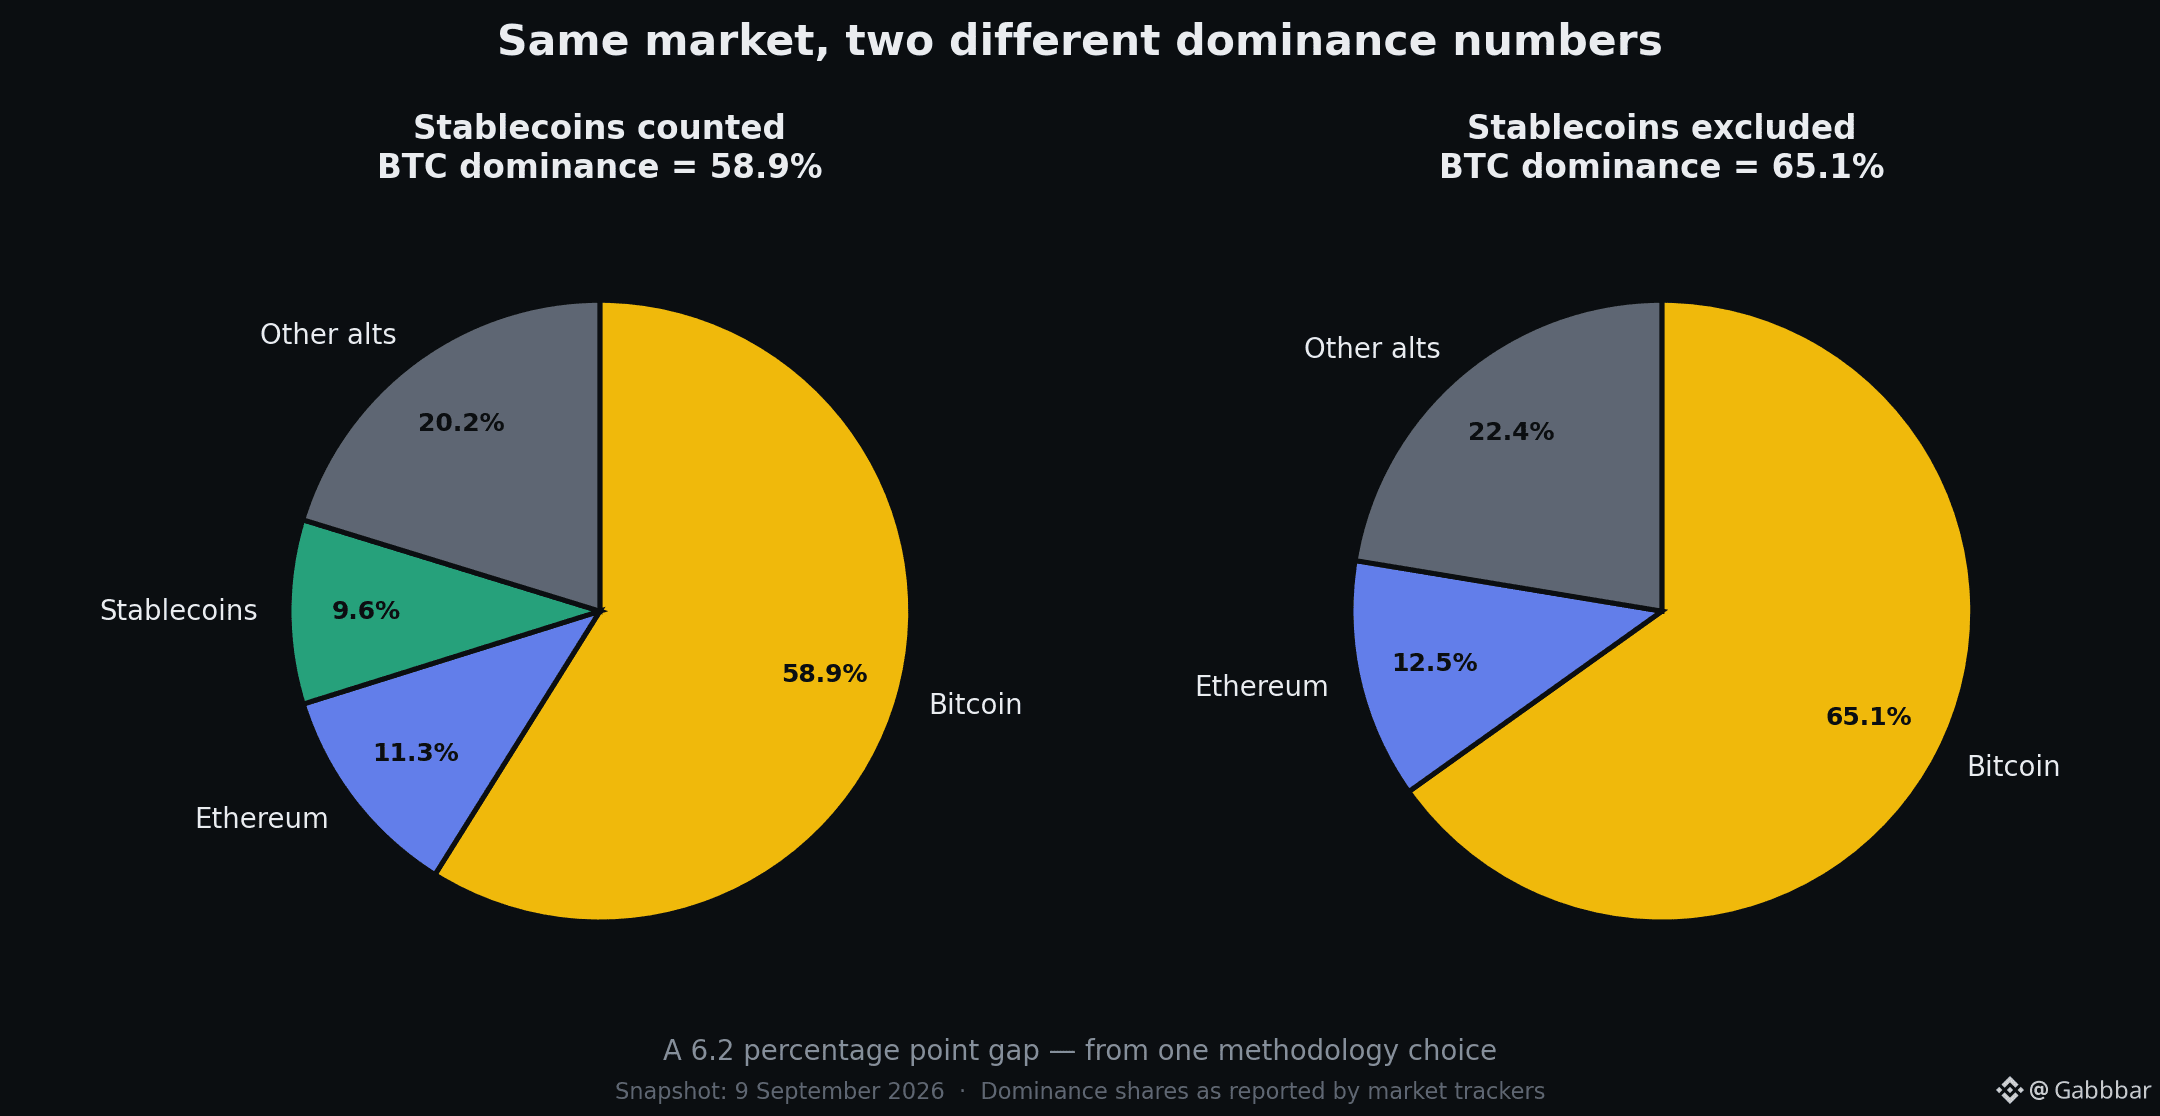
Stablecoins now sit near 10% of the total crypto market. Include them and BTC dominance reads ~58.9%. Exclude them and the same market reads ~65.1%.
Same day. Same market. A 6.2 point gap.
The case for excluding them: stablecoins aren't competing with Bitcoin for capital. They're parked cash — sideline money waiting to be deployed.
The case for including them: that parked cash is still capital sitting inside crypto, and where it sits tells you something about positioning.
One practical consequence worth knowing: BTC dominance can rise while Bitcoin falls, if altcoins are falling faster. Dominance measures share, not price.
So next time a dominance chart gets quoted at you, the useful question isn't "is this bullish" — it's "what's in the denominator?"
#Bitcoin #BTC #CryptoEducation
Bitcoin dominance is one of the most quoted numbers in crypto — and one of the least consistent.
Check three trackers right now and you might see 57%, 59%, and 60%. None of them is wrong. They're answering slightly different questions.
The formula is simple: BTC market cap ÷ total crypto market cap × 100.
The argument is over what goes in the denominator.
Stablecoins now sit near 10% of the total crypto market. Include them and BTC dominance reads ~58.9%. Exclude them and the same market reads ~65.1%.
Same day. Same market. A 6.2 point gap.
The case for excluding them: stablecoins aren't competing with Bitcoin for capital. They're parked cash — sideline money waiting to be deployed.
The case for including them: that parked cash is still capital sitting inside crypto, and where it sits tells you something about positioning.
One practical consequence worth knowing: BTC dominance can rise while Bitcoin falls, if altcoins are falling faster. Dominance measures share, not price.
So next time a dominance chart gets quoted at you, the useful question isn't "is this bullish" — it's "what's in the denominator?"
#Bitcoin #BTC #CryptoEducation
Check three trackers right now and you might see 57%, 59%, and 60%. None of them is wrong. They're answering slightly different questions.
The formula is simple: BTC market cap ÷ total crypto market cap × 100.
The argument is over what goes in the denominator.
Stablecoins now sit near 10% of the total crypto market. Include them and BTC dominance reads ~58.9%. Exclude them and the same market reads ~65.1%.
Same day. Same market. A 6.2 point gap.
The case for excluding them: stablecoins aren't competing with Bitcoin for capital. They're parked cash — sideline money waiting to be deployed.
The case for including them: that parked cash is still capital sitting inside crypto, and where it sits tells you something about positioning.
One practical consequence worth knowing: BTC dominance can rise while Bitcoin falls, if altcoins are falling faster. Dominance measures share, not price.
So next time a dominance chart gets quoted at you, the useful question isn't "is this bullish" — it's "what's in the denominator?"
#Bitcoin #BTC #CryptoEducation
126
Log in to explore more content
Join global crypto users on Binance Square
⚡️ Get latest and useful information about crypto.
💬 Trusted by the world’s largest crypto exchange.
👍 Discover real insights from verified creators.
Email / Phone number
Trending Topics
BitcoinReboundsTo$79K
18,237 views
152 Discussing
🚨 $BTC is pushing higher.
Bitcoin is trading around $78,804, up roughly 1.9%, after reclaiming the $78K area. The next level to watch is the intraday high near $78,905.
A clean break above that level could open the way toward $79K–$80K. If BTC gets rejected, support sits around $78,300, then $77,975.
Bulls have momentum, but BTC needs to hold above $78K.
#Bitcoin #BTC #CryptoTrading #CryptoMarket #CryptoAnalysis
PulseON
·17 Likes
·16.3k views
SouthKoreaCryptoTaxDelayPetitionTops50000
4,877 views
148 Discussing
SolanaTransactionV1GoesLiveOnMainnet
2,348 views
93 Discussing