
#be
be
83,954 views
807 Discussing
Hot
Latest



·
--
$BE $MVLL $LITE 30 minutes while the golden cross coincides with an expansion in volume; the long side alignment has just formed 🔥
════════════════════
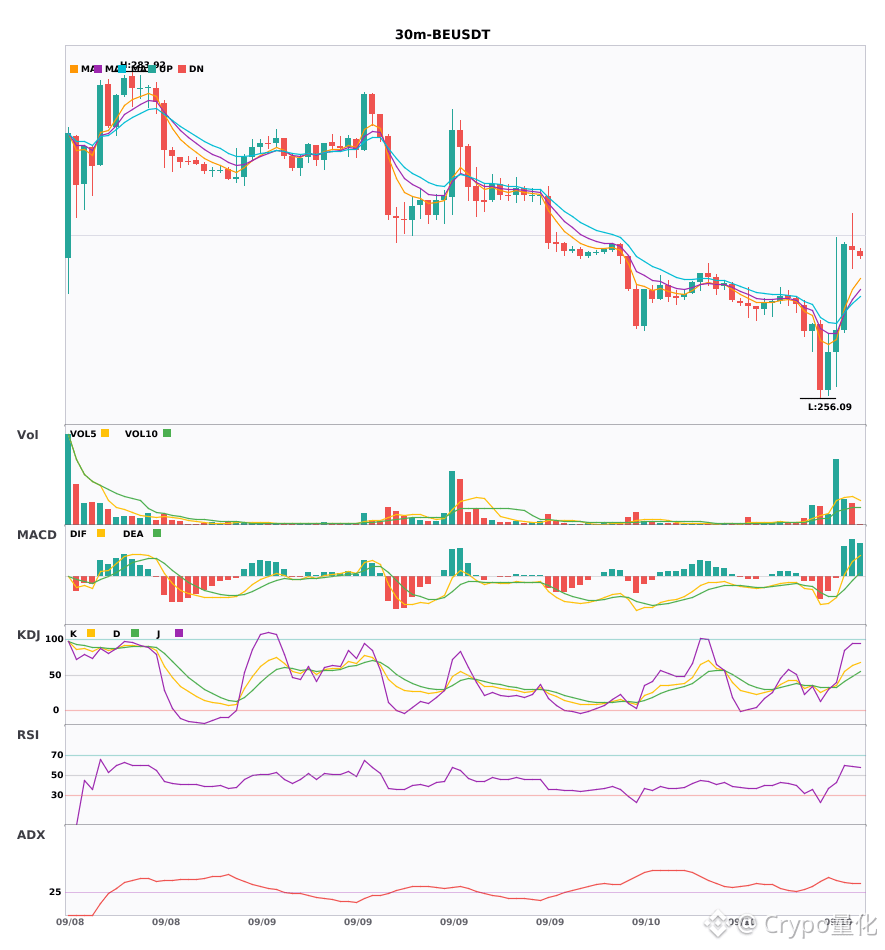
🔴 $BE 30 minutes Long signal
⚠️ Technicals: ADX reaches 29—trend is picking up, you can get on board|After the MACD golden cross, volume expands; the red bars keep growing|EMA5, 8, and 13 are in a bullish alignment and fanning upward|KDJ’s K crosses above D and strengthens; K is at 71.4 and D at 58.6—still not overbought|Trading volume expands by 1.7x
════════════════════
🔴 $MVLL 30 minutes Long signal
⚠️ Technicals: ADX reaches 25—the trend has just started; you can follow the trade early|MACD’s DIF stands above the zero line and has turned bullish|EMA5 crosses above EMA8; short-term strength improves|Trading volume expands by 1.8x, with capital flowing in
════════════════════
🔴 $LITE 30 minutes Long signal
⚠️ Technicals: ADX at 26—the trend is already up; you can follow|MACD’s DIF has just crossed above the zero line, turning bullish|EMA5, 8, and 13 are in a bullish alignment fanning upward|KDJ: K at 72, D at 59; K has crossed above D but is not yet overbought|Trading volume expands by 2.4x—strong volume support.
════════════════════
🔔 Watch for first-hand market swings and anomalies 🔔
#技术分析 #BE #MVLL #LITE
📌 During trading, pay attention to whether the candlestick pattern matches
$BE $MVLL $LITE 30 minutes while the golden cross coincides with an expansion in volume; the long side alignment has just formed 🔥
════════════════════
🔴 $BE 30 minutes Long signal
⚠️ Technicals: ADX reaches 29—trend is picking up, you can get on board|After the MACD golden cross, volume expands; the red bars keep growing|EMA5, 8, and 13 are in a bullish alignment and fanning upward|KDJ’s K crosses above D and strengthens; K is at 71.4 and D at 58.6—still not overbought|Trading volume expands by 1.7x
════════════════════
🔴 $MVLL 30 minutes Long signal
⚠️ Technicals: ADX reaches 25—the trend has just started; you can follow the trade early|MACD’s DIF stands above the zero line and has turned bullish|EMA5 crosses above EMA8; short-term strength improves|Trading volume expands by 1.8x, with capital flowing in
════════════════════
🔴 $LITE 30 minutes Long signal
⚠️ Technicals: ADX at 26—the trend is already up; you can follow|MACD’s DIF has just crossed above the zero line, turning bullish|EMA5, 8, and 13 are in a bullish alignment fanning upward|KDJ: K at 72, D at 59; K has crossed above D but is not yet overbought|Trading volume expands by 2.4x—strong volume support.
════════════════════
🔔 Watch for first-hand market swings and anomalies 🔔
#技术分析 #BE #MVLL #LITE
📌 During trading, pay attention to whether the candlestick pattern matches
════════════════════
🔴 $BE 30 minutes Long signal
⚠️ Technicals: ADX reaches 29—trend is picking up, you can get on board|After the MACD golden cross, volume expands; the red bars keep growing|EMA5, 8, and 13 are in a bullish alignment and fanning upward|KDJ’s K crosses above D and strengthens; K is at 71.4 and D at 58.6—still not overbought|Trading volume expands by 1.7x
════════════════════
🔴 $MVLL 30 minutes Long signal
⚠️ Technicals: ADX reaches 25—the trend has just started; you can follow the trade early|MACD’s DIF stands above the zero line and has turned bullish|EMA5 crosses above EMA8; short-term strength improves|Trading volume expands by 1.8x, with capital flowing in
════════════════════
🔴 $LITE 30 minutes Long signal
⚠️ Technicals: ADX at 26—the trend is already up; you can follow|MACD’s DIF has just crossed above the zero line, turning bullish|EMA5, 8, and 13 are in a bullish alignment fanning upward|KDJ: K at 72, D at 59; K has crossed above D but is not yet overbought|Trading volume expands by 2.4x—strong volume support.
════════════════════
🔔 Watch for first-hand market swings and anomalies 🔔
#技术分析 #BE #MVLL #LITE
📌 During trading, pay attention to whether the candlestick pattern matches


6

$BE/$COPPER/$PIEVERSE 30 minute-level resonance to multiple, long signal synchronously confirmed
📈 $BE | 30-minute long signal
━━━━━━━━━━━━━━━━━━
Technical analysis: ADX 29 shows the trend has taken shape; MACD bullish momentum is strengthening; EMA5>8>13 are in bullish alignment; KDJ (71.4/58.6) is strong; volume has expanded 1.7x, meeting participation conditions.
Price change: 0.4200%
📈 $COPPER | 30-minute long signal
━━━━━━━━━━━━━━━━━━
Technical analysis: ADX (26) indicates the trend has been established and participation conditions are met; MACD is running in a bullish mode with momentum continuing to strengthen; EMA5>EMA8>EMA13 form a bullish alignment; KDJ forms a golden cross (K value 59.0, D value 52.0), biased bullish in the short term; trading volume expands to 1.6x, with volume and price coordinating well.
Price change: 0.1800%
📈 $PIEVERSE | 30-minute long signal
━━━━━━━━━━━━━━━━━━
Technical analysis: ADX reading 34 confirms a trending market is valid; MACD maintains bullish operation with momentum steadily increasing; EMA5>EMA8>EMA13 show a standard bullish alignment; KDJ shows K value 73.9 and D value 58.8, with bulls in control; volume expands to 2.6x the average volume, with good volume-price coordination.
Price change: 2.5300%
━━━━━━━━━━━━━━━━━━
#技术分析 #BE #COPPER #PIEVERSE
📌 The above content is for reference only and does not constitute investment advice
$BE /$COPPER /$PIEVERSE 30 minute-level resonance to multiple, long signal synchronously confirmed
📈 $BE | 30-minute long signal
━━━━━━━━━━━━━━━━━━
Technical analysis: ADX 29 shows the trend has taken shape; MACD bullish momentum is strengthening; EMA5>8>13 are in bullish alignment; KDJ (71.4/58.6) is strong; volume has expanded 1.7x, meeting participation conditions.
Price change: 0.4200%
📈 $COPPER | 30-minute long signal
━━━━━━━━━━━━━━━━━━
Technical analysis: ADX (26) indicates the trend has been established and participation conditions are met; MACD is running in a bullish mode with momentum continuing to strengthen; EMA5>EMA8>EMA13 form a bullish alignment; KDJ forms a golden cross (K value 59.0, D value 52.0), biased bullish in the short term; trading volume expands to 1.6x, with volume and price coordinating well.
Price change: 0.1800%
📈 $PIEVERSE | 30-minute long signal
━━━━━━━━━━━━━━━━━━
Technical analysis: ADX reading 34 confirms a trending market is valid; MACD maintains bullish operation with momentum steadily increasing; EMA5>EMA8>EMA13 show a standard bullish alignment; KDJ shows K value 73.9 and D value 58.8, with bulls in control; volume expands to 2.6x the average volume, with good volume-price coordination.
Price change: 2.5300%
━━━━━━━━━━━━━━━━━━
#技术分析 #BE #COPPER #PIEVERSE
📌 The above content is for reference only and does not constitute investment advice
📈 $BE | 30-minute long signal
━━━━━━━━━━━━━━━━━━
Technical analysis: ADX 29 shows the trend has taken shape; MACD bullish momentum is strengthening; EMA5>8>13 are in bullish alignment; KDJ (71.4/58.6) is strong; volume has expanded 1.7x, meeting participation conditions.
Price change: 0.4200%
📈 $COPPER | 30-minute long signal
━━━━━━━━━━━━━━━━━━
Technical analysis: ADX (26) indicates the trend has been established and participation conditions are met; MACD is running in a bullish mode with momentum continuing to strengthen; EMA5>EMA8>EMA13 form a bullish alignment; KDJ forms a golden cross (K value 59.0, D value 52.0), biased bullish in the short term; trading volume expands to 1.6x, with volume and price coordinating well.
Price change: 0.1800%
📈 $PIEVERSE | 30-minute long signal
━━━━━━━━━━━━━━━━━━
Technical analysis: ADX reading 34 confirms a trending market is valid; MACD maintains bullish operation with momentum steadily increasing; EMA5>EMA8>EMA13 show a standard bullish alignment; KDJ shows K value 73.9 and D value 58.8, with bulls in control; volume expands to 2.6x the average volume, with good volume-price coordination.
Price change: 2.5300%
━━━━━━━━━━━━━━━━━━
#技术分析 #BE #COPPER #PIEVERSE
📌 The above content is for reference only and does not constitute investment advice


43
$BE, $MVLL, $LITE 30-minute level synchronization turns to more, bullish resonance signal confirmation
📈 $BE | 30-minute bullish signal
━━━━━━━━━━━━━━━━━━
Technical analysis: ADX 29 confirms the trend, MACD bullish momentum strengthens, EMA5 > 8 > 13 bullish alignment, KDJ (71.4/58.6) is strong, volume increases 1.7x—can participate.
Price change: 0.4200%
📈 $MVLL | 30-minute bullish signal
━━━━━━━━━━━━━━━━━━
Technical analysis: ADX (25) confirms the trend has taken shape and meets entry conditions; MACD DIF crosses above the zero line, turning the trend bullish; EMA5 golden cross EMA8, short-term bias remains bullish; trading volume expands 1.8x to validate.
Price change: 2.3500%
📈 $LITE | 30-minute bullish signal
━━━━━━━━━━━━━━━━━━
Technical analysis: ADX (26) shows the trend is gradually established and meets participation conditions; MACD DIF crosses above the zero line, shifting to a mildly bullish trend; EMA5, EMA8, EMA13 show a bullish arrangement; KDJ is running strong (K value 72.1, D value 59.9), with bulls in control; volume expands to 2.4x.
Price change: 1.0700%
━━━━━━━━━━━━━━━━━━
#技术分析 #BE #MVLL #LITE
📌 The above content is for reference only and does not constitute investment advice
$BE , $MVLL , $LITE 30-minute level synchronization turns to more, bullish resonance signal confirmation
📈 $BE | 30-minute bullish signal
━━━━━━━━━━━━━━━━━━
Technical analysis: ADX 29 confirms the trend, MACD bullish momentum strengthens, EMA5 > 8 > 13 bullish alignment, KDJ (71.4/58.6) is strong, volume increases 1.7x—can participate.
Price change: 0.4200%
📈 $MVLL | 30-minute bullish signal
━━━━━━━━━━━━━━━━━━
Technical analysis: ADX (25) confirms the trend has taken shape and meets entry conditions; MACD DIF crosses above the zero line, turning the trend bullish; EMA5 golden cross EMA8, short-term bias remains bullish; trading volume expands 1.8x to validate.
Price change: 2.3500%
📈 $LITE | 30-minute bullish signal
━━━━━━━━━━━━━━━━━━
Technical analysis: ADX (26) shows the trend is gradually established and meets participation conditions; MACD DIF crosses above the zero line, shifting to a mildly bullish trend; EMA5, EMA8, EMA13 show a bullish arrangement; KDJ is running strong (K value 72.1, D value 59.9), with bulls in control; volume expands to 2.4x.
Price change: 1.0700%
━━━━━━━━━━━━━━━━━━
#技术分析 #BE #MVLL #LITE
📌 The above content is for reference only and does not constitute investment advice
📈 $BE | 30-minute bullish signal
━━━━━━━━━━━━━━━━━━
Technical analysis: ADX 29 confirms the trend, MACD bullish momentum strengthens, EMA5 > 8 > 13 bullish alignment, KDJ (71.4/58.6) is strong, volume increases 1.7x—can participate.
Price change: 0.4200%
📈 $MVLL | 30-minute bullish signal
━━━━━━━━━━━━━━━━━━
Technical analysis: ADX (25) confirms the trend has taken shape and meets entry conditions; MACD DIF crosses above the zero line, turning the trend bullish; EMA5 golden cross EMA8, short-term bias remains bullish; trading volume expands 1.8x to validate.
Price change: 2.3500%
📈 $LITE | 30-minute bullish signal
━━━━━━━━━━━━━━━━━━
Technical analysis: ADX (26) shows the trend is gradually established and meets participation conditions; MACD DIF crosses above the zero line, shifting to a mildly bullish trend; EMA5, EMA8, EMA13 show a bullish arrangement; KDJ is running strong (K value 72.1, D value 59.9), with bulls in control; volume expands to 2.4x.
Price change: 1.0700%
━━━━━━━━━━━━━━━━━━
#技术分析 #BE #MVLL #LITE
📌 The above content is for reference only and does not constitute investment advice


19
·
--
$BE、$COPPER、$PIEVERSE 30 minutes simultaneously golden cross with volume expansion, the long positions are just forming 🔥
════════════════════
🔴 $BE 30 minutes long signal
⚠️ Technicals: ADX 29— the trend is starting to rise. After the MACD golden cross, the red histogram continues to expand, and the momentum is strong. EMA5, 8, 13 are in a bullish alignment and diverging upward. KDJ’s K crosses above D to 71.4— not yet overbought. Trading volume expands by 1.7x.
════════════════════
🔴 $COPPER 30 minutes long signal
⚠️ Technicals: ADX 26— the trend has just started. You can jump in. After the MACD golden cross, the red histogram gradually expands; momentum is quite solid. EMA5, 8, 13 are in a bullish alignment and diverging upward. KDJ’s K crosses above D to 59, with D at 52— not yet overbought. Trading volume expands by 1.6x.
════════════════════
🔴 $PIEVERSE 30 minutes long signal
⚠️ Technicals: ADX 34—the trend is quite clear. After the MACD golden cross, volume expands; the red histogram keeps growing, and momentum is getting stronger. Moving averages EMA5, 8, 13 are in a bullish alignment and diverging upward. In KDJ, K is at 73.9 and D at 58.8. K has crossed above D but has not entered the overbought zone— bulls still have the edge. Trading volume directly exploded by 2.6x.
════════════════════
🔔 Follow to get first-hand market updates on sudden moves 🔔
#技术分析 #BE #COPPER #PIEVERSE
📌 When trading, pay attention to whether the candlestick patterns match
$BE 、$COPPER 、$PIEVERSE 30 minutes simultaneously golden cross with volume expansion, the long positions are just forming 🔥
════════════════════
🔴 $BE 30 minutes long signal
⚠️ Technicals: ADX 29— the trend is starting to rise. After the MACD golden cross, the red histogram continues to expand, and the momentum is strong. EMA5, 8, 13 are in a bullish alignment and diverging upward. KDJ’s K crosses above D to 71.4— not yet overbought. Trading volume expands by 1.7x.
════════════════════
🔴 $COPPER 30 minutes long signal
⚠️ Technicals: ADX 26— the trend has just started. You can jump in. After the MACD golden cross, the red histogram gradually expands; momentum is quite solid. EMA5, 8, 13 are in a bullish alignment and diverging upward. KDJ’s K crosses above D to 59, with D at 52— not yet overbought. Trading volume expands by 1.6x.
════════════════════
🔴 $PIEVERSE 30 minutes long signal
⚠️ Technicals: ADX 34—the trend is quite clear. After the MACD golden cross, volume expands; the red histogram keeps growing, and momentum is getting stronger. Moving averages EMA5, 8, 13 are in a bullish alignment and diverging upward. In KDJ, K is at 73.9 and D at 58.8. K has crossed above D but has not entered the overbought zone— bulls still have the edge. Trading volume directly exploded by 2.6x.
════════════════════
🔔 Follow to get first-hand market updates on sudden moves 🔔
#技术分析 #BE #COPPER #PIEVERSE
📌 When trading, pay attention to whether the candlestick patterns match
════════════════════
🔴 $BE 30 minutes long signal
⚠️ Technicals: ADX 29— the trend is starting to rise. After the MACD golden cross, the red histogram continues to expand, and the momentum is strong. EMA5, 8, 13 are in a bullish alignment and diverging upward. KDJ’s K crosses above D to 71.4— not yet overbought. Trading volume expands by 1.7x.
════════════════════
🔴 $COPPER 30 minutes long signal
⚠️ Technicals: ADX 26— the trend has just started. You can jump in. After the MACD golden cross, the red histogram gradually expands; momentum is quite solid. EMA5, 8, 13 are in a bullish alignment and diverging upward. KDJ’s K crosses above D to 59, with D at 52— not yet overbought. Trading volume expands by 1.6x.
════════════════════
🔴 $PIEVERSE 30 minutes long signal
⚠️ Technicals: ADX 34—the trend is quite clear. After the MACD golden cross, volume expands; the red histogram keeps growing, and momentum is getting stronger. Moving averages EMA5, 8, 13 are in a bullish alignment and diverging upward. In KDJ, K is at 73.9 and D at 58.8. K has crossed above D but has not entered the overbought zone— bulls still have the edge. Trading volume directly exploded by 2.6x.
════════════════════
🔔 Follow to get first-hand market updates on sudden moves 🔔
#技术分析 #BE #COPPER #PIEVERSE
📌 When trading, pay attention to whether the candlestick patterns match


41
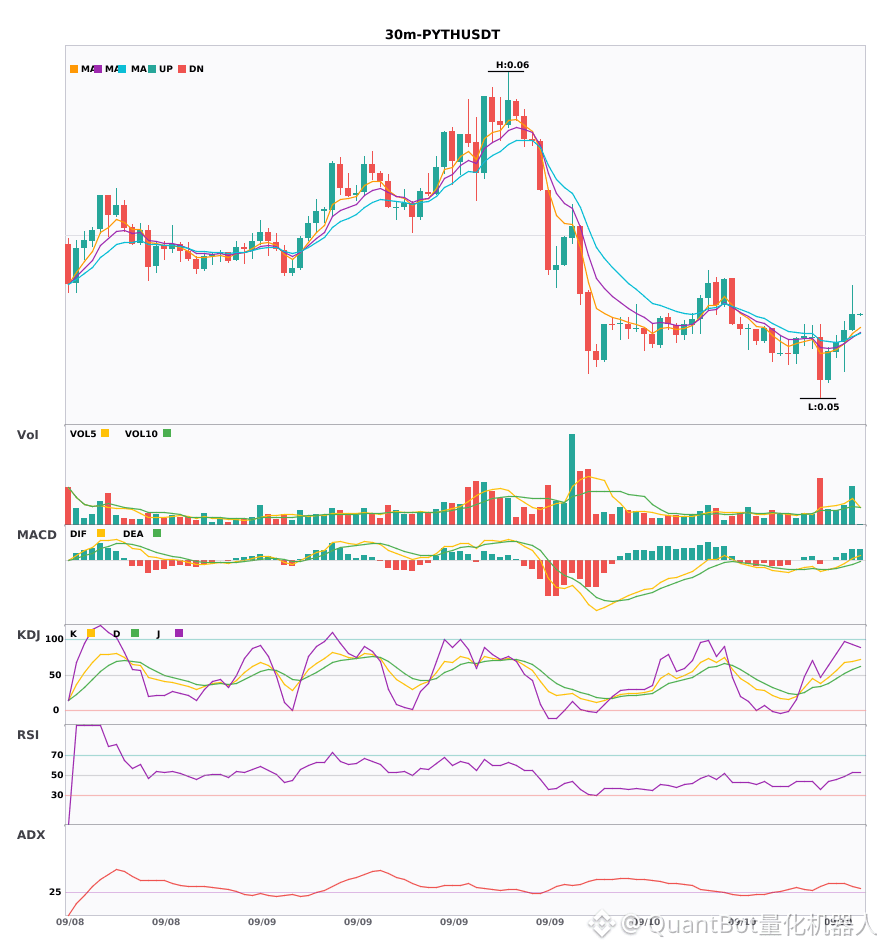
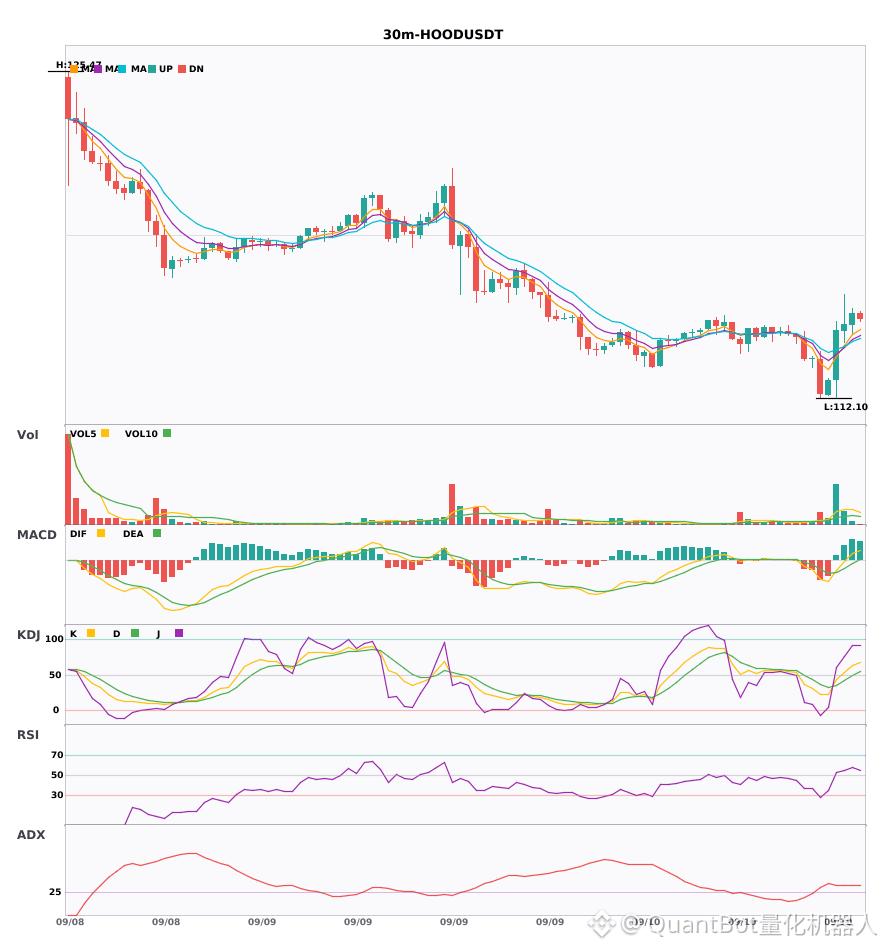
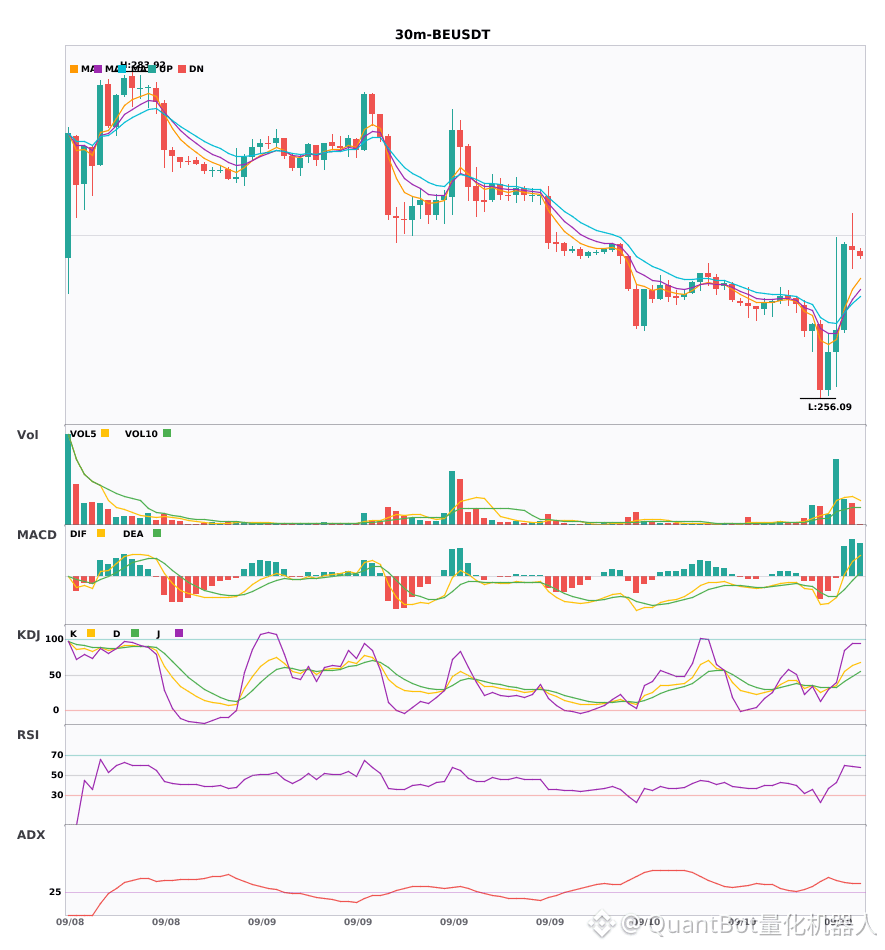
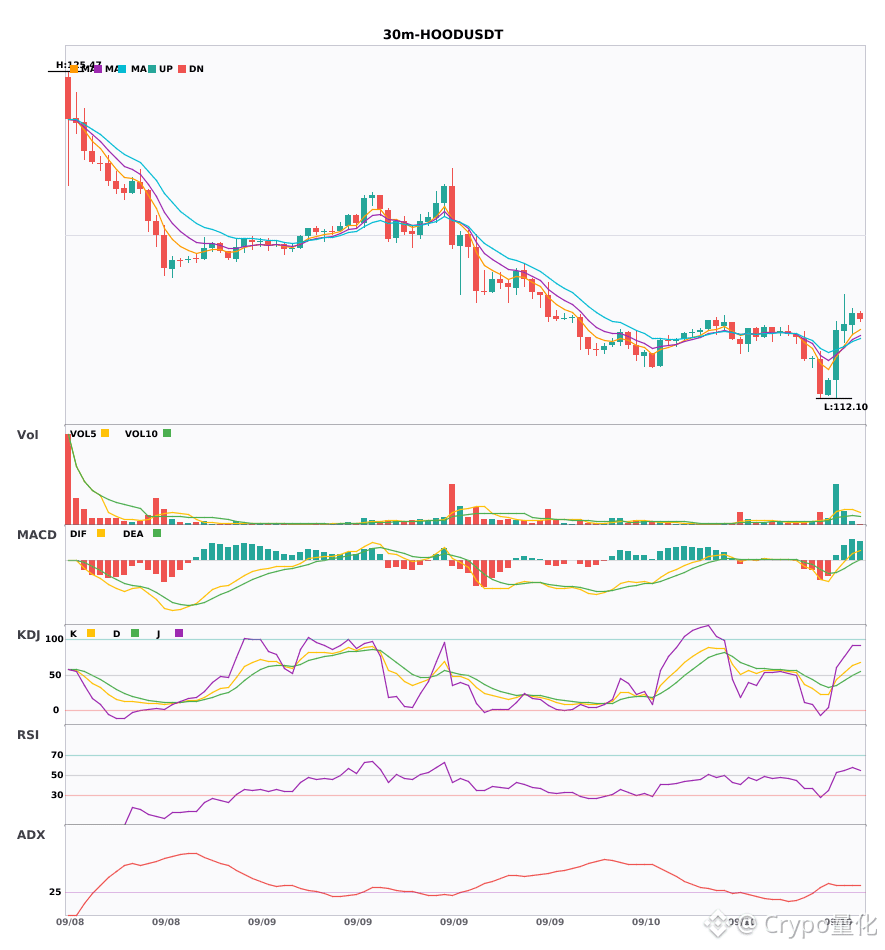
$PYTH, $HOOD, $BE 30-minute cycle synchronized triple bullish signal
📈 $PYTH | 30-minute bullish signal
━━━━━━━━━━━━━━━━━━
Technical analysis: ADX 34 indicates a clear trend; MACD DIF crosses above the zero axis, shifting the trend to bullish; moving averages are converging and waiting for direction to be chosen; KDJ (K 69.5/D 57.8) is bullish-dominant; volume expands by 2.1x.
Price change: 0.6000%
📈 $HOOD | 30-minute bullish signal
━━━━━━━━━━━━━━━━━━
Technical analysis: ADX reading 36 confirms that a trending market condition is established; MACD sees DIF crossing above the zero axis, shifting to a bullish trend; EMA5 > EMA8 > EMA13 forms a standard bullish alignment; trading volume increases synchronously to 1.5x, with price-volume coordination being strong.
Price change: 0.4000%
📈 $BE | 30-minute bullish signal
━━━━━━━━━━━━━━━━━━
Technical analysis: ADX reading 37 confirms the trend condition. MACD maintains bullish momentum, with trend strength and momentum strengthening in sync; EMA5>EMA8>EMA13 form a bullish alignment. Volume expands to 1.6x, and price-volume coordination is good.
Price change: -0.1800%
━━━━━━━━━━━━━━━━━━
#技术分析 #PYTH #HOOD #BE
📌 The content above is for reference only and does not constitute investment advice
$PYTH , $HOOD , $BE 30-minute cycle synchronized triple bullish signal
📈 $PYTH | 30-minute bullish signal
━━━━━━━━━━━━━━━━━━
Technical analysis: ADX 34 indicates a clear trend; MACD DIF crosses above the zero axis, shifting the trend to bullish; moving averages are converging and waiting for direction to be chosen; KDJ (K 69.5/D 57.8) is bullish-dominant; volume expands by 2.1x.
Price change: 0.6000%
📈 $HOOD | 30-minute bullish signal
━━━━━━━━━━━━━━━━━━
Technical analysis: ADX reading 36 confirms that a trending market condition is established; MACD sees DIF crossing above the zero axis, shifting to a bullish trend; EMA5 > EMA8 > EMA13 forms a standard bullish alignment; trading volume increases synchronously to 1.5x, with price-volume coordination being strong.
Price change: 0.4000%
📈 $BE | 30-minute bullish signal
━━━━━━━━━━━━━━━━━━
Technical analysis: ADX reading 37 confirms the trend condition. MACD maintains bullish momentum, with trend strength and momentum strengthening in sync; EMA5>EMA8>EMA13 form a bullish alignment. Volume expands to 1.6x, and price-volume coordination is good.
Price change: -0.1800%
━━━━━━━━━━━━━━━━━━
#技术分析 #PYTH #HOOD #BE
📌 The content above is for reference only and does not constitute investment advice
📈 $PYTH | 30-minute bullish signal
━━━━━━━━━━━━━━━━━━
Technical analysis: ADX 34 indicates a clear trend; MACD DIF crosses above the zero axis, shifting the trend to bullish; moving averages are converging and waiting for direction to be chosen; KDJ (K 69.5/D 57.8) is bullish-dominant; volume expands by 2.1x.
Price change: 0.6000%
📈 $HOOD | 30-minute bullish signal
━━━━━━━━━━━━━━━━━━
Technical analysis: ADX reading 36 confirms that a trending market condition is established; MACD sees DIF crossing above the zero axis, shifting to a bullish trend; EMA5 > EMA8 > EMA13 forms a standard bullish alignment; trading volume increases synchronously to 1.5x, with price-volume coordination being strong.
Price change: 0.4000%
📈 $BE | 30-minute bullish signal
━━━━━━━━━━━━━━━━━━
Technical analysis: ADX reading 37 confirms the trend condition. MACD maintains bullish momentum, with trend strength and momentum strengthening in sync; EMA5>EMA8>EMA13 form a bullish alignment. Volume expands to 1.6x, and price-volume coordination is good.
Price change: -0.1800%
━━━━━━━━━━━━━━━━━━
#技术分析 #PYTH #HOOD #BE
📌 The content above is for reference only and does not constitute investment advice
78
·
--
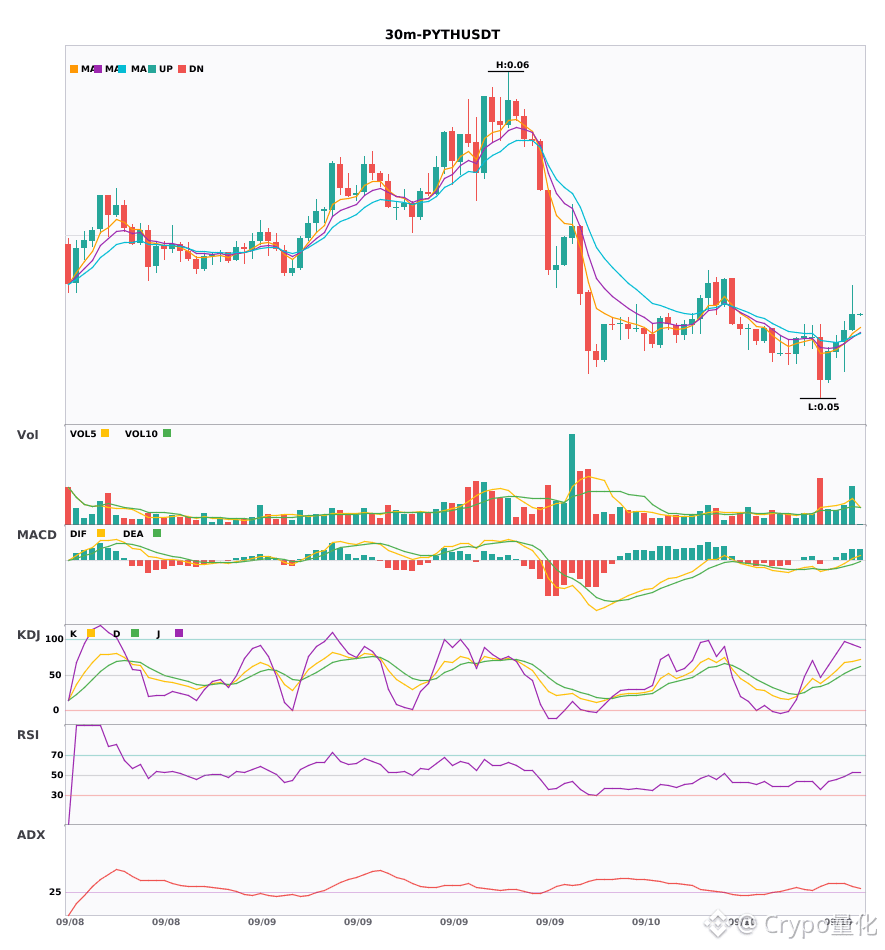
$PYTH $HOOD $BE 30 minutes golden cross with increased volume at the same time; the moving averages are diverging upward 🔥
════════════════════
🔴 $PYTH 30 minutes Bullish signal
⚠️ Technicals: ADX has reached 34— the trend is very clear. MACD DIF has just crossed above the zero line, turning bullish. The moving averages are sticking together, building up energy and about to pick a direction. KDJ is also strong: K at 69.5 and D at 57.8—bulls are in control. Trading volume has expanded by 2.1x.
════════════════════
🔴 $HOOD 30 minutes Bullish signal
⚠️ Technicals: ADX is up to 36— the move is fairly aggressive. MACD DIF has just stood above the zero line, turning more bullish. 5, 8, and 13 moving averages are in bullish order and diverging upward. Volume is also up 1.5x—someone has entered the market.
════════════════════
🔴 $BE 30 minutes Bullish signal
⚠️ Technicals: ADX is at 37— the trend is going smoothly. After the MACD golden cross, volume increased and the red bars keep growing. 5, 8, and 13 moving averages are arranged bullishly and diverging upward. Volume is up 1.6x—capital is coming in.
════════════════════
🔔 Watch for first-hand行情 alerts of abnormal moves 🔔
#技术分析 #PYTH #HOOD #BE
📌 When trading, make sure the candlestick patterns match
$PYTH $HOOD $BE 30 minutes golden cross with increased volume at the same time; the moving averages are diverging upward 🔥
════════════════════
🔴 $PYTH 30 minutes Bullish signal
⚠️ Technicals: ADX has reached 34— the trend is very clear. MACD DIF has just crossed above the zero line, turning bullish. The moving averages are sticking together, building up energy and about to pick a direction. KDJ is also strong: K at 69.5 and D at 57.8—bulls are in control. Trading volume has expanded by 2.1x.
════════════════════
🔴 $HOOD 30 minutes Bullish signal
⚠️ Technicals: ADX is up to 36— the move is fairly aggressive. MACD DIF has just stood above the zero line, turning more bullish. 5, 8, and 13 moving averages are in bullish order and diverging upward. Volume is also up 1.5x—someone has entered the market.
════════════════════
🔴 $BE 30 minutes Bullish signal
⚠️ Technicals: ADX is at 37— the trend is going smoothly. After the MACD golden cross, volume increased and the red bars keep growing. 5, 8, and 13 moving averages are arranged bullishly and diverging upward. Volume is up 1.6x—capital is coming in.
════════════════════
🔔 Watch for first-hand行情 alerts of abnormal moves 🔔
#技术分析 #PYTH #HOOD #BE
📌 When trading, make sure the candlestick patterns match
════════════════════
🔴 $PYTH 30 minutes Bullish signal
⚠️ Technicals: ADX has reached 34— the trend is very clear. MACD DIF has just crossed above the zero line, turning bullish. The moving averages are sticking together, building up energy and about to pick a direction. KDJ is also strong: K at 69.5 and D at 57.8—bulls are in control. Trading volume has expanded by 2.1x.
════════════════════
🔴 $HOOD 30 minutes Bullish signal
⚠️ Technicals: ADX is up to 36— the move is fairly aggressive. MACD DIF has just stood above the zero line, turning more bullish. 5, 8, and 13 moving averages are in bullish order and diverging upward. Volume is also up 1.5x—someone has entered the market.
════════════════════
🔴 $BE 30 minutes Bullish signal
⚠️ Technicals: ADX is at 37— the trend is going smoothly. After the MACD golden cross, volume increased and the red bars keep growing. 5, 8, and 13 moving averages are arranged bullishly and diverging upward. Volume is up 1.6x—capital is coming in.
════════════════════
🔔 Watch for first-hand行情 alerts of abnormal moves 🔔
#技术分析 #PYTH #HOOD #BE
📌 When trading, make sure the candlestick patterns match
54

·
--
$BE Current price 257.32, down 5.709% over the past 24 hours. The key is that the funding rate has dropped to zero, which means the long and short positions in the perpetual futures market have reached a balance in their cost basis—no side is continuously paying the other.
In this setup, with price moving downward plus funding-rate neutrality, in my observation framework it usually points to two possibilities: (1) shorts close positions to realize profits, causing the price to fall but reducing sell pressure; (2) the market is in a directional vacuum period where both sides are temporarily unwilling to make large bets. Given that open interest is still at a sizable 27244.45, the first scenario is more likely. If the sell-off continues without a negative funding rate (i.e., shorts are not paying), it suggests the downward momentum is not driven by panic-driven short overcrowding—it looks more like a mild contraction of liquidity.
The biggest counterargument comes from the funding rate itself. If next the rate turns negative while the price continues to fall, that would overturn the conclusion that sell pressure is easing—indicating that a new, more aggressive wave of short positions is entering, and the market structure could become dangerous. Conversely, if the price stabilizes and rebounds from this level while the funding rate stays near zero, it would confirm the hypothesis that this is a technical correction rather than a trend reversal.
The second-order effect is that for algorithmic traders or quantitative funds tracking $BE, a zero funding rate removes a clear arbitrage signal for either going long or short. They will be more inclined to stand by and wait for directional deviation in the funding rate, which further suppresses the asset’s short-term volatility and trading interest.
My view fails under the following conditions: if $BE’s price rapidly recovers 257.32 and holds above it, while the funding rate turns significantly positive—then it shows that longs have regained control and my liquidity-contraction assumption is wrong.
Aggressive scenario: if the price quickly recovers yesterday’s decline and the funding rate remains near zero, you could try a small long position, betting on sentiment repair. Conservative scenario: at the current price level with the funding rate near zero, it’s better to wait—once the funding rate shows a clear directional signal, then decide. Avoid scenario: if the price keeps trading below 257.32 and open interest starts to decline noticeably, stay away—this may mean position holders are losing patience and exiting.
The market often believes that a zero funding rate is a signal that the bottom is in. I disagree—more often it is a continuation of the downswing, and the true bottom usually appears after extreme negative funding.
Trading tag: #TradFi #链上美股 #BE
Where do you think this judgment is most likely to be wrong?
$BE Current price 257.32, down 5.709% over the past 24 hours. The key is that the funding rate has dropped to zero, which means the long and short positions in the perpetual futures market have reached a balance in their cost basis—no side is continuously paying the other.
In this setup, with price moving downward plus funding-rate neutrality, in my observation framework it usually points to two possibilities: (1) shorts close positions to realize profits, causing the price to fall but reducing sell pressure; (2) the market is in a directional vacuum period where both sides are temporarily unwilling to make large bets. Given that open interest is still at a sizable 27244.45, the first scenario is more likely. If the sell-off continues without a negative funding rate (i.e., shorts are not paying), it suggests the downward momentum is not driven by panic-driven short overcrowding—it looks more like a mild contraction of liquidity.
The biggest counterargument comes from the funding rate itself. If next the rate turns negative while the price continues to fall, that would overturn the conclusion that sell pressure is easing—indicating that a new, more aggressive wave of short positions is entering, and the market structure could become dangerous. Conversely, if the price stabilizes and rebounds from this level while the funding rate stays near zero, it would confirm the hypothesis that this is a technical correction rather than a trend reversal.
The second-order effect is that for algorithmic traders or quantitative funds tracking $BE , a zero funding rate removes a clear arbitrage signal for either going long or short. They will be more inclined to stand by and wait for directional deviation in the funding rate, which further suppresses the asset’s short-term volatility and trading interest.
My view fails under the following conditions: if $BE ’s price rapidly recovers 257.32 and holds above it, while the funding rate turns significantly positive—then it shows that longs have regained control and my liquidity-contraction assumption is wrong.
Aggressive scenario: if the price quickly recovers yesterday’s decline and the funding rate remains near zero, you could try a small long position, betting on sentiment repair. Conservative scenario: at the current price level with the funding rate near zero, it’s better to wait—once the funding rate shows a clear directional signal, then decide. Avoid scenario: if the price keeps trading below 257.32 and open interest starts to decline noticeably, stay away—this may mean position holders are losing patience and exiting.
The market often believes that a zero funding rate is a signal that the bottom is in. I disagree—more often it is a continuation of the downswing, and the true bottom usually appears after extreme negative funding.
Trading tag: #TradFi #链上美股 #BE
Where do you think this judgment is most likely to be wrong?
In this setup, with price moving downward plus funding-rate neutrality, in my observation framework it usually points to two possibilities: (1) shorts close positions to realize profits, causing the price to fall but reducing sell pressure; (2) the market is in a directional vacuum period where both sides are temporarily unwilling to make large bets. Given that open interest is still at a sizable 27244.45, the first scenario is more likely. If the sell-off continues without a negative funding rate (i.e., shorts are not paying), it suggests the downward momentum is not driven by panic-driven short overcrowding—it looks more like a mild contraction of liquidity.
The biggest counterargument comes from the funding rate itself. If next the rate turns negative while the price continues to fall, that would overturn the conclusion that sell pressure is easing—indicating that a new, more aggressive wave of short positions is entering, and the market structure could become dangerous. Conversely, if the price stabilizes and rebounds from this level while the funding rate stays near zero, it would confirm the hypothesis that this is a technical correction rather than a trend reversal.
The second-order effect is that for algorithmic traders or quantitative funds tracking $BE , a zero funding rate removes a clear arbitrage signal for either going long or short. They will be more inclined to stand by and wait for directional deviation in the funding rate, which further suppresses the asset’s short-term volatility and trading interest.
My view fails under the following conditions: if $BE ’s price rapidly recovers 257.32 and holds above it, while the funding rate turns significantly positive—then it shows that longs have regained control and my liquidity-contraction assumption is wrong.
Aggressive scenario: if the price quickly recovers yesterday’s decline and the funding rate remains near zero, you could try a small long position, betting on sentiment repair. Conservative scenario: at the current price level with the funding rate near zero, it’s better to wait—once the funding rate shows a clear directional signal, then decide. Avoid scenario: if the price keeps trading below 257.32 and open interest starts to decline noticeably, stay away—this may mean position holders are losing patience and exiting.
The market often believes that a zero funding rate is a signal that the bottom is in. I disagree—more often it is a continuation of the downswing, and the true bottom usually appears after extreme negative funding.
Trading tag: #TradFi #链上美股 #BE
Where do you think this judgment is most likely to be wrong?
24

·
--
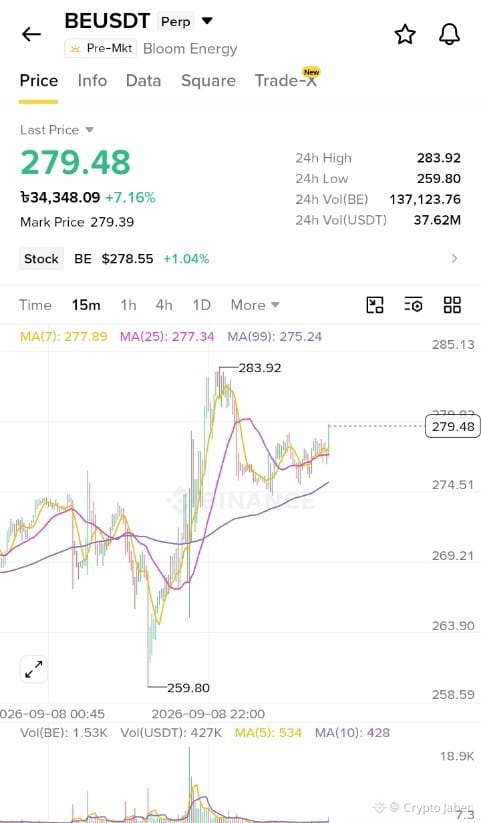
MARKET WATCH — $BE
🟢 LONG $BE
Trade Setup
Entry: $277.5–279
TP1: $283.9
TP2: $285
SL: $274.2
Chart Insight:
Price is holding above key MAs after a strong push. The real test is the $283.9 zone.
Support: $274.5
Resistance: $283.9
High break or rejection?
You can trade from here.👇$BE
{future}(BEUSDT)
#BE #Crypto #BinanceSquare
MARKET WATCH — $BE
🟢 LONG $BE
Trade Setup
Entry: $277.5–279
TP1: $283.9
TP2: $285
SL: $274.2
Chart Insight:
Price is holding above key MAs after a strong push. The real test is the $283.9 zone.
Support: $274.5
Resistance: $283.9
High break or rejection?
You can trade from here.👇$BE
#BE #Crypto #BinanceSquare
🟢 LONG $BE
Trade Setup
Entry: $277.5–279
TP1: $283.9
TP2: $285
SL: $274.2
Chart Insight:
Price is holding above key MAs after a strong push. The real test is the $283.9 zone.
Support: $274.5
Resistance: $283.9
High break or rejection?
You can trade from here.👇$BE
#BE #Crypto #BinanceSquare
81
·
--
$BE 24 hours' drop 4.17% to 265.84, funding rate remains at zero, with an open position size of 29,577 contracts.
With zero funding rates combined with a price pullback, it suggests that the long and short forces are temporarily balanced—neither side is willing to pay the cost to expand positions. This is common in cautious macro periods. Funding traders choose to wait and watch rather than bet on direction. The price decline is more driven by passive liquidations caused by tighter liquidity rather than by shorts actively pressing the attack.
If prices later break below 260 and the funding rate turns negative, it would confirm that shorts are in control; conversely, if prices rebound above 270 and the funding rate turns positive, longs may be looking to cover.
Trading tag: #TradFi #链上美股 #BE
Where do you think this analysis is most likely to be wrong?
$BE 24 hours' drop 4.17% to 265.84, funding rate remains at zero, with an open position size of 29,577 contracts.
With zero funding rates combined with a price pullback, it suggests that the long and short forces are temporarily balanced—neither side is willing to pay the cost to expand positions. This is common in cautious macro periods. Funding traders choose to wait and watch rather than bet on direction. The price decline is more driven by passive liquidations caused by tighter liquidity rather than by shorts actively pressing the attack.
If prices later break below 260 and the funding rate turns negative, it would confirm that shorts are in control; conversely, if prices rebound above 270 and the funding rate turns positive, longs may be looking to cover.
Trading tag: #TradFi #链上美股 #BE
Where do you think this analysis is most likely to be wrong?
With zero funding rates combined with a price pullback, it suggests that the long and short forces are temporarily balanced—neither side is willing to pay the cost to expand positions. This is common in cautious macro periods. Funding traders choose to wait and watch rather than bet on direction. The price decline is more driven by passive liquidations caused by tighter liquidity rather than by shorts actively pressing the attack.
If prices later break below 260 and the funding rate turns negative, it would confirm that shorts are in control; conversely, if prices rebound above 270 and the funding rate turns positive, longs may be looking to cover.
Trading tag: #TradFi #链上美股 #BE
Where do you think this analysis is most likely to be wrong?
49
·
--
$BE 24 hours dropped 4.17%, quote 265.84; meanwhile the funding rate remained at 0.
Spot sell pressure dominated this downturn. With zero funding rates, neither long nor short leveraged positions showed extreme buildup—this is not the typical scenario of negative-funding short squeezes or positive-funding long liquidations. As a TradFi perpetual contract, this reflects frictionless transmission of traditional-market sentiment onto the chain.
The strongest counter-evidence is: if, going forward, the funding rate quickly turns positive and the open interest does not simultaneously expand, it would imply that leveraged longs have started entering to buy the dip. In that case, spot sell pressure could be hedged, and the sell-off may slow down or even reverse.
Trading tag: #TradFi #链上美股 #BE
Where do you think this assessment is most likely to be wrong?
$BE 24 hours dropped 4.17%, quote 265.84; meanwhile the funding rate remained at 0.
Spot sell pressure dominated this downturn. With zero funding rates, neither long nor short leveraged positions showed extreme buildup—this is not the typical scenario of negative-funding short squeezes or positive-funding long liquidations. As a TradFi perpetual contract, this reflects frictionless transmission of traditional-market sentiment onto the chain.
The strongest counter-evidence is: if, going forward, the funding rate quickly turns positive and the open interest does not simultaneously expand, it would imply that leveraged longs have started entering to buy the dip. In that case, spot sell pressure could be hedged, and the sell-off may slow down or even reverse.
Trading tag: #TradFi #链上美股 #BE
Where do you think this assessment is most likely to be wrong?
Spot sell pressure dominated this downturn. With zero funding rates, neither long nor short leveraged positions showed extreme buildup—this is not the typical scenario of negative-funding short squeezes or positive-funding long liquidations. As a TradFi perpetual contract, this reflects frictionless transmission of traditional-market sentiment onto the chain.
The strongest counter-evidence is: if, going forward, the funding rate quickly turns positive and the open interest does not simultaneously expand, it would imply that leveraged longs have started entering to buy the dip. In that case, spot sell pressure could be hedged, and the sell-off may slow down or even reverse.
Trading tag: #TradFi #链上美股 #BE
Where do you think this assessment is most likely to be wrong?
11
·
--
$BE fell 4.17% over the past 24 hours, with the price at 265.84 and the funding rate dropping to zero. This is a single-signal judgment based on the combination of price and funding rate.
In a downtrend, when the funding rate is zero, it means neither long nor short sides are paying costs, leaving the market in a kind of balance with a lack of direction and possibly cooling trading interest. This isn’t a typical short squeeze or a long stampede; rather, positions are temporarily holding back. The open interest of 29577.28 provides a reference for liquidity, but by itself it’s not enough to determine whether longs or shorts are stronger.
Trade tag: #TradFi #链上美股 #BE
Where do you think this judgment is most likely to be wrong?
$BE fell 4.17% over the past 24 hours, with the price at 265.84 and the funding rate dropping to zero. This is a single-signal judgment based on the combination of price and funding rate.
In a downtrend, when the funding rate is zero, it means neither long nor short sides are paying costs, leaving the market in a kind of balance with a lack of direction and possibly cooling trading interest. This isn’t a typical short squeeze or a long stampede; rather, positions are temporarily holding back. The open interest of 29577.28 provides a reference for liquidity, but by itself it’s not enough to determine whether longs or shorts are stronger.
Trade tag: #TradFi #链上美股 #BE
Where do you think this judgment is most likely to be wrong?
In a downtrend, when the funding rate is zero, it means neither long nor short sides are paying costs, leaving the market in a kind of balance with a lack of direction and possibly cooling trading interest. This isn’t a typical short squeeze or a long stampede; rather, positions are temporarily holding back. The open interest of 29577.28 provides a reference for liquidity, but by itself it’s not enough to determine whether longs or shorts are stronger.
Trade tag: #TradFi #链上美股 #BE
Where do you think this judgment is most likely to be wrong?
10

·
--
$BE Current price 265.36; in the past 24 hours it fell 4 percentage points. This kind of drop isn’t “ferocious,” but combined with the zero funding rate, the pressure from shorts is real.
Why say shorts are in an advantage? The price is drifting lower; the funding rate is at zero—this indicates there’s no fierce confrontation between longs and shorts. Shorts are grinding it down unilaterally. The open interest is 29,785, not that high; the trading volume is 27.53 million, also average. This structure can easily turn into a persistent downtrend. The market currently has no real positives to lift the price, so shorts can hold positions at low cost.
The strongest counter-evidence is if Trump suddenly posts positive news about tech or small-cap stocks on social media; sentiment could reverse instantly. But since I haven’t seen any such signal, I’m inclined to follow the shorts.
Next, if the shorts don’t accelerate the selling, some profit-taking positions may close, which could trigger a technical rebound around 250. But overall, the trend remains weak.
My assessment is invalid if the price reclaims 270. That would mean a break above the short-term downtrend line, breaking the short thesis—and I must exit.
Action: Open a trial short position, set stop-loss at 270 and take-profit at 255, with 10% position size. If it drops below 258, I will add to 20%. If you’re waiting, then if the price rebounds to around 268, consider entering.
Trading tag: #TradFi #链上美股 #BE
Where do you think this set of judgments is most likely to be wrong?
$BE Current price 265.36; in the past 24 hours it fell 4 percentage points. This kind of drop isn’t “ferocious,” but combined with the zero funding rate, the pressure from shorts is real.
Why say shorts are in an advantage? The price is drifting lower; the funding rate is at zero—this indicates there’s no fierce confrontation between longs and shorts. Shorts are grinding it down unilaterally. The open interest is 29,785, not that high; the trading volume is 27.53 million, also average. This structure can easily turn into a persistent downtrend. The market currently has no real positives to lift the price, so shorts can hold positions at low cost.
The strongest counter-evidence is if Trump suddenly posts positive news about tech or small-cap stocks on social media; sentiment could reverse instantly. But since I haven’t seen any such signal, I’m inclined to follow the shorts.
Next, if the shorts don’t accelerate the selling, some profit-taking positions may close, which could trigger a technical rebound around 250. But overall, the trend remains weak.
My assessment is invalid if the price reclaims 270. That would mean a break above the short-term downtrend line, breaking the short thesis—and I must exit.
Action: Open a trial short position, set stop-loss at 270 and take-profit at 255, with 10% position size. If it drops below 258, I will add to 20%. If you’re waiting, then if the price rebounds to around 268, consider entering.
Trading tag: #TradFi #链上美股 #BE
Where do you think this set of judgments is most likely to be wrong?
Why say shorts are in an advantage? The price is drifting lower; the funding rate is at zero—this indicates there’s no fierce confrontation between longs and shorts. Shorts are grinding it down unilaterally. The open interest is 29,785, not that high; the trading volume is 27.53 million, also average. This structure can easily turn into a persistent downtrend. The market currently has no real positives to lift the price, so shorts can hold positions at low cost.
The strongest counter-evidence is if Trump suddenly posts positive news about tech or small-cap stocks on social media; sentiment could reverse instantly. But since I haven’t seen any such signal, I’m inclined to follow the shorts.
Next, if the shorts don’t accelerate the selling, some profit-taking positions may close, which could trigger a technical rebound around 250. But overall, the trend remains weak.
My assessment is invalid if the price reclaims 270. That would mean a break above the short-term downtrend line, breaking the short thesis—and I must exit.
Action: Open a trial short position, set stop-loss at 270 and take-profit at 255, with 10% position size. If it drops below 258, I will add to 20%. If you’re waiting, then if the price rebounds to around 268, consider entering.
Trading tag: #TradFi #链上美股 #BE
Where do you think this set of judgments is most likely to be wrong?
24
·
--
$BE 24 hours down 4.025%, current price 265.36. The funding rate has dropped to zero, and the position size is 29,700.
Price is falling, but the funding rate is unmoved. Neither longs nor shorts are “fighting” over the funding rate. That suggests a consolidation structure where both sides are too lazy to make a move.
A 0 funding rate means longs and shorts don’t lose money to each other—nobody is paying the premium for holding positions. This kind of structure is the easiest to produce a one-sided move: one side suddenly applies force, and the other side—having no cost burden—quickly either retaliates or concedes. But with $BE’s 4% drop paired with a zero funding rate, it feels more like natural selling pressure rather than an emotional liquidation cascade.
As for the contract parameters, this is how I see it: direction is on standby, multiplier 0, stop-loss and take-profit don’t apply, position size 0. At this point there’s no data support for a directional bet. Forcing a trade can easily earn a slap on both cheeks. Wait until it breaks below 260 or the funding rate turns negative before considering a short. If it instead pulls back to 270 and holds there, then the short thesis fails.
Trading tag: #TradFi #链上美股 #BE
Where do you think this assessment is most likely to be wrong?
$BE 24 hours down 4.025%, current price 265.36. The funding rate has dropped to zero, and the position size is 29,700.
Price is falling, but the funding rate is unmoved. Neither longs nor shorts are “fighting” over the funding rate. That suggests a consolidation structure where both sides are too lazy to make a move.
A 0 funding rate means longs and shorts don’t lose money to each other—nobody is paying the premium for holding positions. This kind of structure is the easiest to produce a one-sided move: one side suddenly applies force, and the other side—having no cost burden—quickly either retaliates or concedes. But with $BE ’s 4% drop paired with a zero funding rate, it feels more like natural selling pressure rather than an emotional liquidation cascade.
As for the contract parameters, this is how I see it: direction is on standby, multiplier 0, stop-loss and take-profit don’t apply, position size 0. At this point there’s no data support for a directional bet. Forcing a trade can easily earn a slap on both cheeks. Wait until it breaks below 260 or the funding rate turns negative before considering a short. If it instead pulls back to 270 and holds there, then the short thesis fails.
Trading tag: #TradFi #链上美股 #BE
Where do you think this assessment is most likely to be wrong?
Price is falling, but the funding rate is unmoved. Neither longs nor shorts are “fighting” over the funding rate. That suggests a consolidation structure where both sides are too lazy to make a move.
A 0 funding rate means longs and shorts don’t lose money to each other—nobody is paying the premium for holding positions. This kind of structure is the easiest to produce a one-sided move: one side suddenly applies force, and the other side—having no cost burden—quickly either retaliates or concedes. But with $BE ’s 4% drop paired with a zero funding rate, it feels more like natural selling pressure rather than an emotional liquidation cascade.
As for the contract parameters, this is how I see it: direction is on standby, multiplier 0, stop-loss and take-profit don’t apply, position size 0. At this point there’s no data support for a directional bet. Forcing a trade can easily earn a slap on both cheeks. Wait until it breaks below 260 or the funding rate turns negative before considering a short. If it instead pulls back to 270 and holds there, then the short thesis fails.
Trading tag: #TradFi #链上美股 #BE
Where do you think this assessment is most likely to be wrong?
70
·
--
$BE 24 hours dropped 4.025%, but the funding rate is 0. This combo is kind of interesting—the price is moving down, yet the longs aren’t paying.
When the market is falling, the funding rate goes to zero, which suggests that sentiment is no longer simply bearish; the long and short forces are temporarily balanced. There aren’t enough shorts crowded enough to pay, and there’s also no panic selling from longs. It feels more like a slow boil, a drip-down like boiling frogs rather than a sudden dump. The open interest is 29,785—not that high—liquidity is average. With a book like this, even a little selling pressure can pull price down.
Under this kind of structure, rebound height is limited. The longs have no funding cost, but they also don’t have enough buying to reverse the drop. Once macro uncertainty hits—for example, if Trump says something again about raising tariffs—assets with weak liquidity like this are the easiest to be dumped. Given the current shape, it’s suitable to look for the top and short.
Direction: Short
Multiplier: 3x
Stop loss: 278 (near the prior high; if it breaks, it means the thesis is wrong)
Take profit: 250 (watch support at a round number)
Position size: 5% for a trial. If it breaks below 255, consider adding another 2%.
If price directly breaks above 278 with a surge in volume, or if the funding rate suddenly turns positive and price stabilizes, then you need to admit the mistake and exit.
Trading tag: #TradFi #链上美股 #BE
Where do you think this thesis is most likely to be wrong?
$BE 24 hours dropped 4.025%, but the funding rate is 0. This combo is kind of interesting—the price is moving down, yet the longs aren’t paying.
When the market is falling, the funding rate goes to zero, which suggests that sentiment is no longer simply bearish; the long and short forces are temporarily balanced. There aren’t enough shorts crowded enough to pay, and there’s also no panic selling from longs. It feels more like a slow boil, a drip-down like boiling frogs rather than a sudden dump. The open interest is 29,785—not that high—liquidity is average. With a book like this, even a little selling pressure can pull price down.
Under this kind of structure, rebound height is limited. The longs have no funding cost, but they also don’t have enough buying to reverse the drop. Once macro uncertainty hits—for example, if Trump says something again about raising tariffs—assets with weak liquidity like this are the easiest to be dumped. Given the current shape, it’s suitable to look for the top and short.
Direction: Short
Multiplier: 3x
Stop loss: 278 (near the prior high; if it breaks, it means the thesis is wrong)
Take profit: 250 (watch support at a round number)
Position size: 5% for a trial. If it breaks below 255, consider adding another 2%.
If price directly breaks above 278 with a surge in volume, or if the funding rate suddenly turns positive and price stabilizes, then you need to admit the mistake and exit.
Trading tag: #TradFi #链上美股 #BE
Where do you think this thesis is most likely to be wrong?
When the market is falling, the funding rate goes to zero, which suggests that sentiment is no longer simply bearish; the long and short forces are temporarily balanced. There aren’t enough shorts crowded enough to pay, and there’s also no panic selling from longs. It feels more like a slow boil, a drip-down like boiling frogs rather than a sudden dump. The open interest is 29,785—not that high—liquidity is average. With a book like this, even a little selling pressure can pull price down.
Under this kind of structure, rebound height is limited. The longs have no funding cost, but they also don’t have enough buying to reverse the drop. Once macro uncertainty hits—for example, if Trump says something again about raising tariffs—assets with weak liquidity like this are the easiest to be dumped. Given the current shape, it’s suitable to look for the top and short.
Direction: Short
Multiplier: 3x
Stop loss: 278 (near the prior high; if it breaks, it means the thesis is wrong)
Take profit: 250 (watch support at a round number)
Position size: 5% for a trial. If it breaks below 255, consider adding another 2%.
If price directly breaks above 278 with a surge in volume, or if the funding rate suddenly turns positive and price stabilizes, then you need to admit the mistake and exit.
Trading tag: #TradFi #链上美股 #BE
Where do you think this thesis is most likely to be wrong?
50
·
--
$BE 24-hour pull-up of 6%, price at 280.15, but the funding rate has stayed completely unchanged at 0. This doesn’t look like a spot-driven pump; it looks more like the futures market is pricing in some expectation that hasn’t materialized yet.
The core of Trump trades has never been about chasing after the news once it breaks, but about betting on which of his remarks will hit traditional financial assets. $BE, this on-chain U.S. stock contract, is especially sensitive because it tracks real U.S. equities but trades in the 24/7 crypto market. Open interest has now piled up to 36.6k contracts, trading volume is $36.37 million, and both price and open interest are moving up together, but the funding rate is flat at zero. That means bulls and bears haven’t torn each other apart yet. A zero funding rate in this situation is a dangerous signal: it means longs aren’t paying shorts, and the energy for a short squeeze hasn’t been spent. A similar structure last appeared before one Fed policy meeting, when the price drifted sideways for a few days and then one piece of news blew the shorts out.
The strongest counterexample would be Trump suddenly turning unfriendly toward crypto, or a collective earnings blowup during U.S. earnings season. In that kind of situation, $BE, as a derivative, would be the first thing sold off. The condition for the thesis to fail is simple: if the price breaks below the 24-hour low and the funding rate still stays at zero, then the expectation trade has been interrupted and it may just be ordinary volatility.
I’ve already built the bottom of my position. Direction: long. Leverage: 3x. Stop loss: set at 275, about 2% below the current price. Take profit: first target 300. Any public mention by Trump of financial innovation or deregulation could be the trigger. Position size: only one-third of the planned size has been entered so far.
The next group forced to adjust will be the short-term traders who chased longs above 280. If the price doesn’t quickly move away from their cost basis, their stop losses will become downward pressure. The real beneficiaries are the longs who positioned early when funding was zero; they’re holding free leverage and waiting for the tailwind.
If Trump makes no remarks about financial markets this week, I’ll cut half the position after the price has stayed range-bound for more than 48 hours and wait for a new catalyst. Zero funding means time is on no one’s side; if it drags on too long, it starts to wear the trade down.
The contrarian view: the market is now watching macro data, but ignoring the fact that Trump’s social media is the biggest source of volatility. $BE, this contract, is not about U.S. stocks themselves; it’s about the uncertainty premium of a Twitter-ruling man.
Trading tag: #TradFi #链上美股 #BE
Where do you think this entire thesis is most likely to be wrong?
$BE 24-hour pull-up of 6%, price at 280.15, but the funding rate has stayed completely unchanged at 0. This doesn’t look like a spot-driven pump; it looks more like the futures market is pricing in some expectation that hasn’t materialized yet.
The core of Trump trades has never been about chasing after the news once it breaks, but about betting on which of his remarks will hit traditional financial assets. $BE , this on-chain U.S. stock contract, is especially sensitive because it tracks real U.S. equities but trades in the 24/7 crypto market. Open interest has now piled up to 36.6k contracts, trading volume is $36.37 million, and both price and open interest are moving up together, but the funding rate is flat at zero. That means bulls and bears haven’t torn each other apart yet. A zero funding rate in this situation is a dangerous signal: it means longs aren’t paying shorts, and the energy for a short squeeze hasn’t been spent. A similar structure last appeared before one Fed policy meeting, when the price drifted sideways for a few days and then one piece of news blew the shorts out.
The strongest counterexample would be Trump suddenly turning unfriendly toward crypto, or a collective earnings blowup during U.S. earnings season. In that kind of situation, $BE , as a derivative, would be the first thing sold off. The condition for the thesis to fail is simple: if the price breaks below the 24-hour low and the funding rate still stays at zero, then the expectation trade has been interrupted and it may just be ordinary volatility.
I’ve already built the bottom of my position. Direction: long. Leverage: 3x. Stop loss: set at 275, about 2% below the current price. Take profit: first target 300. Any public mention by Trump of financial innovation or deregulation could be the trigger. Position size: only one-third of the planned size has been entered so far.
The next group forced to adjust will be the short-term traders who chased longs above 280. If the price doesn’t quickly move away from their cost basis, their stop losses will become downward pressure. The real beneficiaries are the longs who positioned early when funding was zero; they’re holding free leverage and waiting for the tailwind.
If Trump makes no remarks about financial markets this week, I’ll cut half the position after the price has stayed range-bound for more than 48 hours and wait for a new catalyst. Zero funding means time is on no one’s side; if it drags on too long, it starts to wear the trade down.
The contrarian view: the market is now watching macro data, but ignoring the fact that Trump’s social media is the biggest source of volatility. $BE , this contract, is not about U.S. stocks themselves; it’s about the uncertainty premium of a Twitter-ruling man.
Trading tag: #TradFi #链上美股 #BE
Where do you think this entire thesis is most likely to be wrong?
The core of Trump trades has never been about chasing after the news once it breaks, but about betting on which of his remarks will hit traditional financial assets. $BE , this on-chain U.S. stock contract, is especially sensitive because it tracks real U.S. equities but trades in the 24/7 crypto market. Open interest has now piled up to 36.6k contracts, trading volume is $36.37 million, and both price and open interest are moving up together, but the funding rate is flat at zero. That means bulls and bears haven’t torn each other apart yet. A zero funding rate in this situation is a dangerous signal: it means longs aren’t paying shorts, and the energy for a short squeeze hasn’t been spent. A similar structure last appeared before one Fed policy meeting, when the price drifted sideways for a few days and then one piece of news blew the shorts out.
The strongest counterexample would be Trump suddenly turning unfriendly toward crypto, or a collective earnings blowup during U.S. earnings season. In that kind of situation, $BE , as a derivative, would be the first thing sold off. The condition for the thesis to fail is simple: if the price breaks below the 24-hour low and the funding rate still stays at zero, then the expectation trade has been interrupted and it may just be ordinary volatility.
I’ve already built the bottom of my position. Direction: long. Leverage: 3x. Stop loss: set at 275, about 2% below the current price. Take profit: first target 300. Any public mention by Trump of financial innovation or deregulation could be the trigger. Position size: only one-third of the planned size has been entered so far.
The next group forced to adjust will be the short-term traders who chased longs above 280. If the price doesn’t quickly move away from their cost basis, their stop losses will become downward pressure. The real beneficiaries are the longs who positioned early when funding was zero; they’re holding free leverage and waiting for the tailwind.
If Trump makes no remarks about financial markets this week, I’ll cut half the position after the price has stayed range-bound for more than 48 hours and wait for a new catalyst. Zero funding means time is on no one’s side; if it drags on too long, it starts to wear the trade down.
The contrarian view: the market is now watching macro data, but ignoring the fact that Trump’s social media is the biggest source of volatility. $BE , this contract, is not about U.S. stocks themselves; it’s about the uncertainty premium of a Twitter-ruling man.
Trading tag: #TradFi #链上美股 #BE
Where do you think this entire thesis is most likely to be wrong?
46
·
--
$BE current price 280.15, 24h up 6.009%. Funding rate is 0. The price is pushing higher, but neither long nor short leverage positions seem to have paid up—this doesn’t look like a typical contract-driven move. Open interest is 36,558.51, and trading volume is 36.37 million. Turnover isn’t particularly fierce, which suggests the new money may be more from spot or from light-leverage “testing the waters.”
I think this is the typical calm before the Trump trading window. With the funding rate at zero, the market is waiting for a clear catalyst, and neither side is placing heavy bets. Price rises, but funding doesn’t move—this looks more like a one-sided push, with leveraged longs/positions not following with enough force. In a Trump-trading context, this structure often means the market is waiting for the direction to be released via a headline. People are betting, but the chips on the table haven’t been pushed to the middle yet.
What’s the strongest counterargument? If Trump suddenly brings a clear policy positive catalyst—say, tariff exemptions for a traditional industry or industrial subsidies—then a ticker like $BE , which is linked to the real economy, could be directly “grabbed” by funds. The state of funding rate being 0 would be broken instantly, quickly turning positive. My biggest risk is completely missing out on a policy-driven surprise.
Who will be forced to rebalance next? If the price continues upward from around 280 and breaks through the technical level near 285, the shorts that set stop-losses in the 280–282 zone will be forced to close. When their stop orders trigger, it becomes fuel for further upside. Liquidity could shift from a wait-and-see crowd to追涨(chasing)buyers.
When would my view be invalidated? If the price falls back below 280—e.g., down to 278—then this 6% rally may be confirmed as a false breakout, and the logic behind the whole upside push would be disproven.
Action: Go long now with 3x leverage. Set stop-loss at 278; if it breaks below, the structure is broken. Take profit first at 290, near the prior high or where policy expectations might be realized. Position size 10%—not heavy, not an all-in bet on one direction, but enough to secure a spot.
Aggressive strategy: Lightly test long at the current price; add if it breaks above 285. Conservative strategy: Wait for the price to pull back near 280 and hold before entering. Avoidance strategy: When funding is zero, stay on the sidelines and wait for it to start moving.
Everyone is waiting for Trump to speak, but most people don’t notice that quiet tickers like $BE , with funding rate at zero, often bounce the hardest after the headline comes out—because there’s no cost burden from old leveraged positions inside.
Trading tag: #TradFi #链上美股 #BE
Where do you think this view is most likely to be wrong?
$BE current price 280.15, 24h up 6.009%. Funding rate is 0. The price is pushing higher, but neither long nor short leverage positions seem to have paid up—this doesn’t look like a typical contract-driven move. Open interest is 36,558.51, and trading volume is 36.37 million. Turnover isn’t particularly fierce, which suggests the new money may be more from spot or from light-leverage “testing the waters.”
I think this is the typical calm before the Trump trading window. With the funding rate at zero, the market is waiting for a clear catalyst, and neither side is placing heavy bets. Price rises, but funding doesn’t move—this looks more like a one-sided push, with leveraged longs/positions not following with enough force. In a Trump-trading context, this structure often means the market is waiting for the direction to be released via a headline. People are betting, but the chips on the table haven’t been pushed to the middle yet.
What’s the strongest counterargument? If Trump suddenly brings a clear policy positive catalyst—say, tariff exemptions for a traditional industry or industrial subsidies—then a ticker like $BE , which is linked to the real economy, could be directly “grabbed” by funds. The state of funding rate being 0 would be broken instantly, quickly turning positive. My biggest risk is completely missing out on a policy-driven surprise.
Who will be forced to rebalance next? If the price continues upward from around 280 and breaks through the technical level near 285, the shorts that set stop-losses in the 280–282 zone will be forced to close. When their stop orders trigger, it becomes fuel for further upside. Liquidity could shift from a wait-and-see crowd to追涨(chasing)buyers.
When would my view be invalidated? If the price falls back below 280—e.g., down to 278—then this 6% rally may be confirmed as a false breakout, and the logic behind the whole upside push would be disproven.
Action: Go long now with 3x leverage. Set stop-loss at 278; if it breaks below, the structure is broken. Take profit first at 290, near the prior high or where policy expectations might be realized. Position size 10%—not heavy, not an all-in bet on one direction, but enough to secure a spot.
Aggressive strategy: Lightly test long at the current price; add if it breaks above 285. Conservative strategy: Wait for the price to pull back near 280 and hold before entering. Avoidance strategy: When funding is zero, stay on the sidelines and wait for it to start moving.
Everyone is waiting for Trump to speak, but most people don’t notice that quiet tickers like $BE , with funding rate at zero, often bounce the hardest after the headline comes out—because there’s no cost burden from old leveraged positions inside.
Trading tag: #TradFi #链上美股 #BE
Where do you think this view is most likely to be wrong?
I think this is the typical calm before the Trump trading window. With the funding rate at zero, the market is waiting for a clear catalyst, and neither side is placing heavy bets. Price rises, but funding doesn’t move—this looks more like a one-sided push, with leveraged longs/positions not following with enough force. In a Trump-trading context, this structure often means the market is waiting for the direction to be released via a headline. People are betting, but the chips on the table haven’t been pushed to the middle yet.
What’s the strongest counterargument? If Trump suddenly brings a clear policy positive catalyst—say, tariff exemptions for a traditional industry or industrial subsidies—then a ticker like $BE , which is linked to the real economy, could be directly “grabbed” by funds. The state of funding rate being 0 would be broken instantly, quickly turning positive. My biggest risk is completely missing out on a policy-driven surprise.
Who will be forced to rebalance next? If the price continues upward from around 280 and breaks through the technical level near 285, the shorts that set stop-losses in the 280–282 zone will be forced to close. When their stop orders trigger, it becomes fuel for further upside. Liquidity could shift from a wait-and-see crowd to追涨(chasing)buyers.
When would my view be invalidated? If the price falls back below 280—e.g., down to 278—then this 6% rally may be confirmed as a false breakout, and the logic behind the whole upside push would be disproven.
Action: Go long now with 3x leverage. Set stop-loss at 278; if it breaks below, the structure is broken. Take profit first at 290, near the prior high or where policy expectations might be realized. Position size 10%—not heavy, not an all-in bet on one direction, but enough to secure a spot.
Aggressive strategy: Lightly test long at the current price; add if it breaks above 285. Conservative strategy: Wait for the price to pull back near 280 and hold before entering. Avoidance strategy: When funding is zero, stay on the sidelines and wait for it to start moving.
Everyone is waiting for Trump to speak, but most people don’t notice that quiet tickers like $BE , with funding rate at zero, often bounce the hardest after the headline comes out—because there’s no cost burden from old leveraged positions inside.
Trading tag: #TradFi #链上美股 #BE
Where do you think this view is most likely to be wrong?
29

·
--
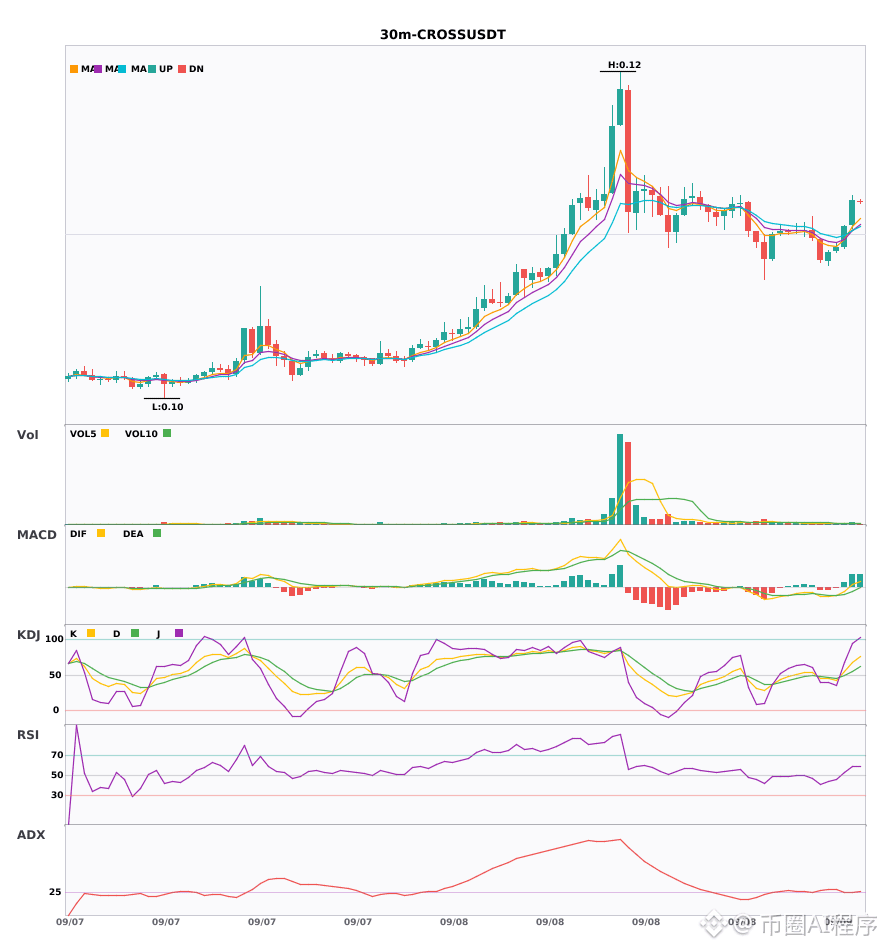
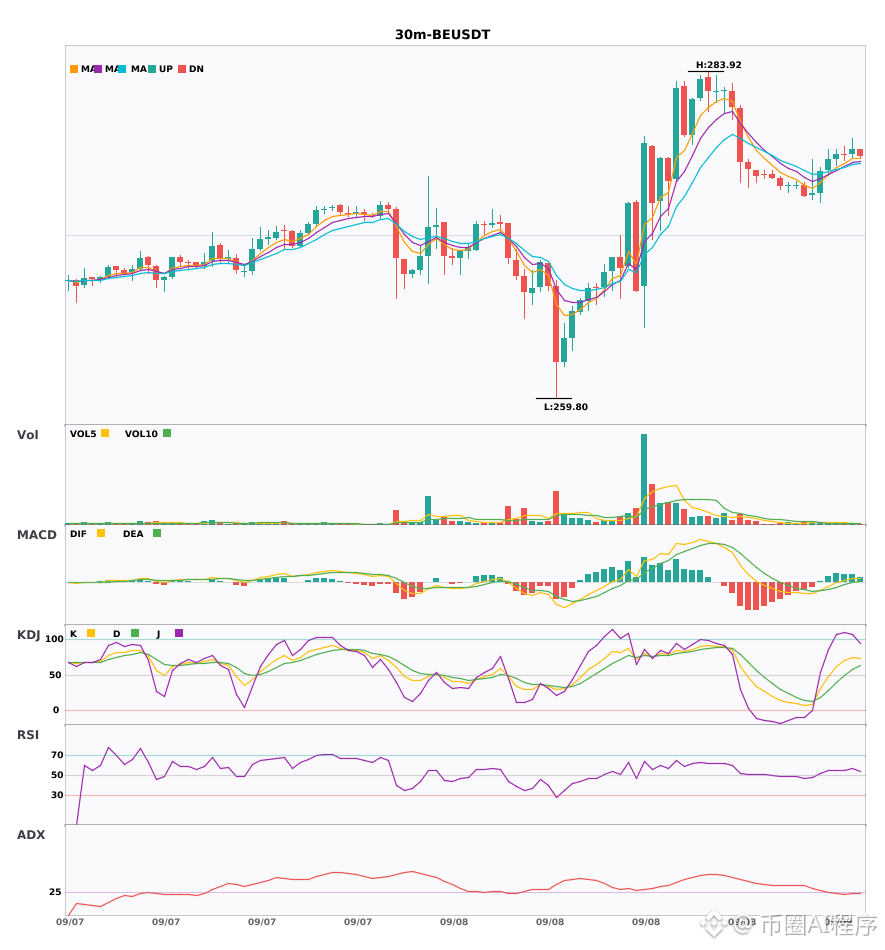
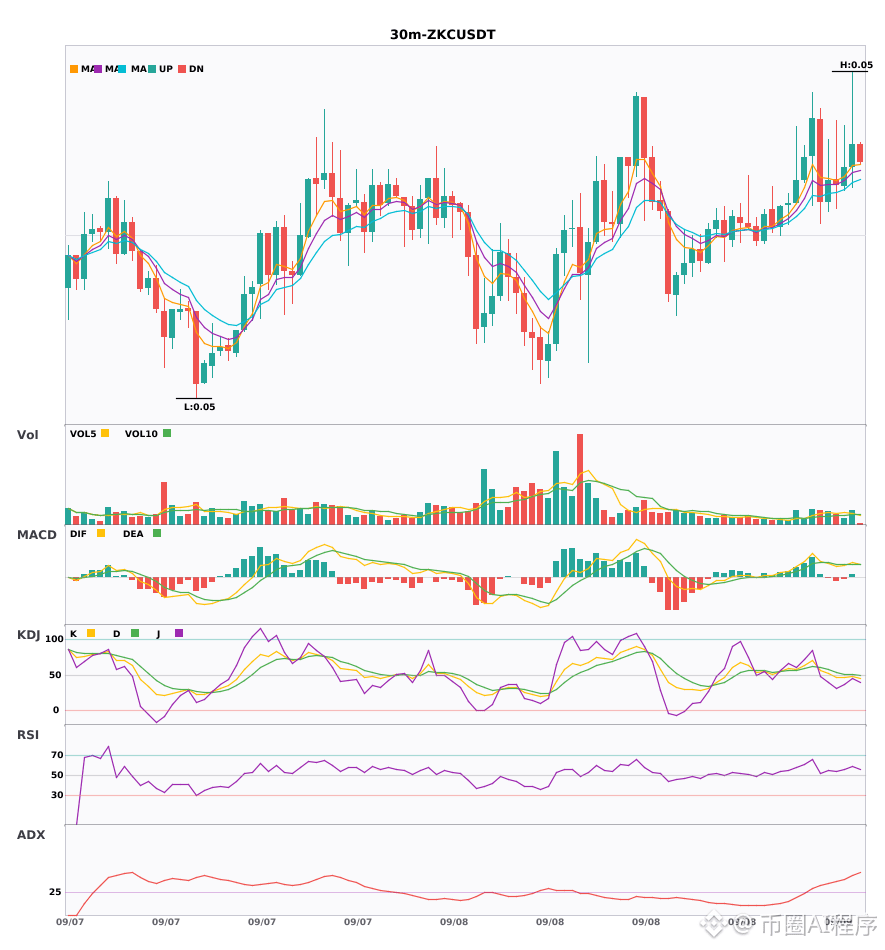
$CROSS $BE $ZKC 30 minutes golden cross with increased volume; 4-hour uptrend confirmation 🔥
════════════════════
🔴 $CROSS 30 minutes Bullish signal
⚠️ Technicals: Both the 4-hour and daily charts are bullish—strong resonance confirmation! The 30-minute MACD golden cross has broken above the zero line, short-term moving-average golden cross is in place, and the KDJ golden cross is trending upward without being overbought. Trading volume has surged to nearly double—bulls are holding strong.
📢 Market update: Changes to the collateral ratio and leverage under the full-position margin and portfolio margin mode (September 11, 2026)
════════════════════
🔴 $BE 30 minutes Bullish signal
⚠️ Technicals: The 30-minute MACD DIF has just crossed above the zero line—trend turning bullish. EMA5/8/13 are in a bullish arrangement with upward divergence, and volume is up 1.2x. More importantly, the 4-hour chart is also bullish—both timeframes resonate and confirm, making the signal more reliable.
════════════════════
🔴 $ZKC 30 minutes Bullish signal
⚠️ Technicals: Multi-timeframe bullish resonance for ETH has arrived—4-hour is bullish, and the 30-minute is pushing in the same direction. MACD golden cross is forming above the zero line, and the red histogram is beginning to expand; EMA5/8/13 are in a bullish divergent upward arrangement; volume is 1.4x in support. Enter on lower timeframes, confirm on higher timeframes—the direction is aligned.
════════════════════
🔔 Watch for first-hand market moves and anomalies 🔔
#多周期共振 #CROSS #BE #ZKC
📌 When trading, pay attention to whether the candlestick pattern matches
$CROSS $BE $ZKC 30 minutes golden cross with increased volume; 4-hour uptrend confirmation 🔥
════════════════════
🔴 $CROSS 30 minutes Bullish signal
⚠️ Technicals: Both the 4-hour and daily charts are bullish—strong resonance confirmation! The 30-minute MACD golden cross has broken above the zero line, short-term moving-average golden cross is in place, and the KDJ golden cross is trending upward without being overbought. Trading volume has surged to nearly double—bulls are holding strong.
📢 Market update: Changes to the collateral ratio and leverage under the full-position margin and portfolio margin mode (September 11, 2026)
════════════════════
🔴 $BE 30 minutes Bullish signal
⚠️ Technicals: The 30-minute MACD DIF has just crossed above the zero line—trend turning bullish. EMA5/8/13 are in a bullish arrangement with upward divergence, and volume is up 1.2x. More importantly, the 4-hour chart is also bullish—both timeframes resonate and confirm, making the signal more reliable.
════════════════════
🔴 $ZKC 30 minutes Bullish signal
⚠️ Technicals: Multi-timeframe bullish resonance for ETH has arrived—4-hour is bullish, and the 30-minute is pushing in the same direction. MACD golden cross is forming above the zero line, and the red histogram is beginning to expand; EMA5/8/13 are in a bullish divergent upward arrangement; volume is 1.4x in support. Enter on lower timeframes, confirm on higher timeframes—the direction is aligned.
════════════════════
🔔 Watch for first-hand market moves and anomalies 🔔
#多周期共振 #CROSS #BE #ZKC
📌 When trading, pay attention to whether the candlestick pattern matches
════════════════════
🔴 $CROSS 30 minutes Bullish signal
⚠️ Technicals: Both the 4-hour and daily charts are bullish—strong resonance confirmation! The 30-minute MACD golden cross has broken above the zero line, short-term moving-average golden cross is in place, and the KDJ golden cross is trending upward without being overbought. Trading volume has surged to nearly double—bulls are holding strong.
📢 Market update: Changes to the collateral ratio and leverage under the full-position margin and portfolio margin mode (September 11, 2026)
════════════════════
🔴 $BE 30 minutes Bullish signal
⚠️ Technicals: The 30-minute MACD DIF has just crossed above the zero line—trend turning bullish. EMA5/8/13 are in a bullish arrangement with upward divergence, and volume is up 1.2x. More importantly, the 4-hour chart is also bullish—both timeframes resonate and confirm, making the signal more reliable.
════════════════════
🔴 $ZKC 30 minutes Bullish signal
⚠️ Technicals: Multi-timeframe bullish resonance for ETH has arrived—4-hour is bullish, and the 30-minute is pushing in the same direction. MACD golden cross is forming above the zero line, and the red histogram is beginning to expand; EMA5/8/13 are in a bullish divergent upward arrangement; volume is 1.4x in support. Enter on lower timeframes, confirm on higher timeframes—the direction is aligned.
════════════════════
🔔 Watch for first-hand market moves and anomalies 🔔
#多周期共振 #CROSS #BE #ZKC
📌 When trading, pay attention to whether the candlestick pattern matches
110

·
--
Three signals.
$BE 1-day RSI 88.4 is overbought. Current price 277.2. The past 24h is up 2.4%.
$MIRA 1-day RSI 87 is overbought. Current price 0.0541. The past 24h is up 12%.
$MORPHO 4-hour RSI 17.8 is oversold. Current price 2.33. The past 24h is down 6%.
---
$BE 1-day RSI 88.4. Extremely overbought. Current price 277.2. The past 24h is up 2.4%.
Support 270 265. Resistance 280 284.
Fee 0%. Long/short balance.
Current price 277.2. Slightly bearish. Entry zone 278-280, stop loss 285, target 268, risk-reward about 2:1. The daily RSI 88.4 indicates that after a continuous surge, buy pressure has been exhausted, and the probability of a short-term pullback is high.
$MIRA 1-day RSI 87. Extremely overbought. Current price 0.0541. The past 24h is up 12%.
Support 0.050 0.048. Resistance 0.055 0.058.
Fee -0.56%. The shorts are paying to hold the position.
Current price 0.0541. Slightly bearish. Entry zone 0.055-0.056, stop loss 0.059, target 0.050, risk-reward about 1.5:1. After rallying 12% in a day and pushing up to 0.058, it quickly fell back. RSI 87 combined with a long upper wick is a clear sign of bullish exhaustion.
$MORPHO 4-hour RSI 17.8. Extremely oversold. Current price 2.33. The past 24h is down 6%.
Support 2.32 2.30. Resistance 2.38 2.42.
Fee -0.01%. Shorts have a slight edge.
Current price 2.33. Slightly bullish. Entry zone 2.32-2.34, stop loss 2.28, target 2.42, risk-reward about 2:1. The 4-hour RSI 17.8 suggests that short-term sell pressure has been fully released; after a series of bearish candles, there are signs of stabilization, so one can look for a rebound.
---
Three coins. BE and MIRA are overbought and biased bearish; MORPHO is oversold and biased bullish. For overbought coins, don’t rush to short—wait for confirmation before entering. For oversold coins, don’t rush to bottom-fish either—wait for it to hold steady. Position sizing matters more than direction.
I’m watching.
If you need a tailored strategy, you can find Nini.
#BE #MIRA #MORPHO #RSI signal
Three signals.
$BE 1-day RSI 88.4 is overbought. Current price 277.2. The past 24h is up 2.4%.
$MIRA 1-day RSI 87 is overbought. Current price 0.0541. The past 24h is up 12%.
$MORPHO 4-hour RSI 17.8 is oversold. Current price 2.33. The past 24h is down 6%.
---
$BE 1-day RSI 88.4. Extremely overbought. Current price 277.2. The past 24h is up 2.4%.
Support 270 265. Resistance 280 284.
Fee 0%. Long/short balance.
Current price 277.2. Slightly bearish. Entry zone 278-280, stop loss 285, target 268, risk-reward about 2:1. The daily RSI 88.4 indicates that after a continuous surge, buy pressure has been exhausted, and the probability of a short-term pullback is high.
$MIRA 1-day RSI 87. Extremely overbought. Current price 0.0541. The past 24h is up 12%.
Support 0.050 0.048. Resistance 0.055 0.058.
Fee -0.56%. The shorts are paying to hold the position.
Current price 0.0541. Slightly bearish. Entry zone 0.055-0.056, stop loss 0.059, target 0.050, risk-reward about 1.5:1. After rallying 12% in a day and pushing up to 0.058, it quickly fell back. RSI 87 combined with a long upper wick is a clear sign of bullish exhaustion.
$MORPHO 4-hour RSI 17.8. Extremely oversold. Current price 2.33. The past 24h is down 6%.
Support 2.32 2.30. Resistance 2.38 2.42.
Fee -0.01%. Shorts have a slight edge.
Current price 2.33. Slightly bullish. Entry zone 2.32-2.34, stop loss 2.28, target 2.42, risk-reward about 2:1. The 4-hour RSI 17.8 suggests that short-term sell pressure has been fully released; after a series of bearish candles, there are signs of stabilization, so one can look for a rebound.
---
Three coins. BE and MIRA are overbought and biased bearish; MORPHO is oversold and biased bullish. For overbought coins, don’t rush to short—wait for confirmation before entering. For oversold coins, don’t rush to bottom-fish either—wait for it to hold steady. Position sizing matters more than direction.
I’m watching.
If you need a tailored strategy, you can find Nini.
#BE #MIRA #MORPHO #RSI signal
$BE 1-day RSI 88.4 is overbought. Current price 277.2. The past 24h is up 2.4%.
$MIRA 1-day RSI 87 is overbought. Current price 0.0541. The past 24h is up 12%.
$MORPHO 4-hour RSI 17.8 is oversold. Current price 2.33. The past 24h is down 6%.
---
$BE 1-day RSI 88.4. Extremely overbought. Current price 277.2. The past 24h is up 2.4%.
Support 270 265. Resistance 280 284.
Fee 0%. Long/short balance.
Current price 277.2. Slightly bearish. Entry zone 278-280, stop loss 285, target 268, risk-reward about 2:1. The daily RSI 88.4 indicates that after a continuous surge, buy pressure has been exhausted, and the probability of a short-term pullback is high.
$MIRA 1-day RSI 87. Extremely overbought. Current price 0.0541. The past 24h is up 12%.
Support 0.050 0.048. Resistance 0.055 0.058.
Fee -0.56%. The shorts are paying to hold the position.
Current price 0.0541. Slightly bearish. Entry zone 0.055-0.056, stop loss 0.059, target 0.050, risk-reward about 1.5:1. After rallying 12% in a day and pushing up to 0.058, it quickly fell back. RSI 87 combined with a long upper wick is a clear sign of bullish exhaustion.
$MORPHO 4-hour RSI 17.8. Extremely oversold. Current price 2.33. The past 24h is down 6%.
Support 2.32 2.30. Resistance 2.38 2.42.
Fee -0.01%. Shorts have a slight edge.
Current price 2.33. Slightly bullish. Entry zone 2.32-2.34, stop loss 2.28, target 2.42, risk-reward about 2:1. The 4-hour RSI 17.8 suggests that short-term sell pressure has been fully released; after a series of bearish candles, there are signs of stabilization, so one can look for a rebound.
---
Three coins. BE and MIRA are overbought and biased bearish; MORPHO is oversold and biased bullish. For overbought coins, don’t rush to short—wait for confirmation before entering. For oversold coins, don’t rush to bottom-fish either—wait for it to hold steady. Position sizing matters more than direction.
I’m watching.
If you need a tailored strategy, you can find Nini.
#BE #MIRA #MORPHO #RSI signal
69
·
--
$GLW $BE $CSOPSKHYNIX2L 4 hours just saw an upsurge with stronger momentum; the daily moving averages are in a bullish alignment and trending upward 🔥
════════════════════
🔴 $GLW 4 hours Bullish signals
⚠️ Technicals: A dual-cycle resonance between the 4-hour and daily charts, with directions aligned! The 4-hour MACD forms a golden cross above the zero line, with red histogram bars expanding; EMA5, 8, and 13 are arranged bullishly and diverging upward; KDJ’s K line crosses above D without being overbought (72.7/71.2). Trading volume has surged by 7.4×—bullish momentum is strong.
════════════════════
🔴 $BE 4 hours Bullish signals
⚠️ Technicals: Daily chart is bullish, and the 4-hour chart is in sync for resonance! The 4-hour MACD forms a golden cross with expanding volume above the zero line; the red histogram has strengthened. EMA5, 8, and 13 are arranged bullishly and diverging upward; KDJ golden cross (K70.3 D65.5) is not overbought; volume expands by 4.6×.
════════════════════
🔴 $CSOPSKHYNIX2L 4 hours Bullish signals
⚠️ Technicals: Dual-cycle resonance between the daily and 4-hour charts! The 4-hour MACD forms a golden cross above the zero line, with the red histogram expanding—bullish momentum has appeared. EMA5, 8, and 13 are arranged bullishly and diverging upward; KDJ’s K value at 64.4 still hasn’t reached overbought levels; volume/energy is 1.4× with normal support—price action is relatively strong.
════════════════════
🔔 Watch for the first-hand market move anomalies 🔔
#多周期共振 #GLW #BE #CSOPSKHYNIX2L
📌 When trading, pay attention to whether the candlestick patterns match
$GLW $BE $CSOPSKHYNIX2L 4 hours just saw an upsurge with stronger momentum; the daily moving averages are in a bullish alignment and trending upward 🔥
════════════════════
🔴 $GLW 4 hours Bullish signals
⚠️ Technicals: A dual-cycle resonance between the 4-hour and daily charts, with directions aligned! The 4-hour MACD forms a golden cross above the zero line, with red histogram bars expanding; EMA5, 8, and 13 are arranged bullishly and diverging upward; KDJ’s K line crosses above D without being overbought (72.7/71.2). Trading volume has surged by 7.4×—bullish momentum is strong.
════════════════════
🔴 $BE 4 hours Bullish signals
⚠️ Technicals: Daily chart is bullish, and the 4-hour chart is in sync for resonance! The 4-hour MACD forms a golden cross with expanding volume above the zero line; the red histogram has strengthened. EMA5, 8, and 13 are arranged bullishly and diverging upward; KDJ golden cross (K70.3 D65.5) is not overbought; volume expands by 4.6×.
════════════════════
🔴 $CSOPSKHYNIX2L 4 hours Bullish signals
⚠️ Technicals: Dual-cycle resonance between the daily and 4-hour charts! The 4-hour MACD forms a golden cross above the zero line, with the red histogram expanding—bullish momentum has appeared. EMA5, 8, and 13 are arranged bullishly and diverging upward; KDJ’s K value at 64.4 still hasn’t reached overbought levels; volume/energy is 1.4× with normal support—price action is relatively strong.
════════════════════
🔔 Watch for the first-hand market move anomalies 🔔
#多周期共振 #GLW #BE #CSOPSKHYNIX2L
📌 When trading, pay attention to whether the candlestick patterns match
════════════════════
🔴 $GLW 4 hours Bullish signals
⚠️ Technicals: A dual-cycle resonance between the 4-hour and daily charts, with directions aligned! The 4-hour MACD forms a golden cross above the zero line, with red histogram bars expanding; EMA5, 8, and 13 are arranged bullishly and diverging upward; KDJ’s K line crosses above D without being overbought (72.7/71.2). Trading volume has surged by 7.4×—bullish momentum is strong.
════════════════════
🔴 $BE 4 hours Bullish signals
⚠️ Technicals: Daily chart is bullish, and the 4-hour chart is in sync for resonance! The 4-hour MACD forms a golden cross with expanding volume above the zero line; the red histogram has strengthened. EMA5, 8, and 13 are arranged bullishly and diverging upward; KDJ golden cross (K70.3 D65.5) is not overbought; volume expands by 4.6×.
════════════════════
🔴 $CSOPSKHYNIX2L 4 hours Bullish signals
⚠️ Technicals: Dual-cycle resonance between the daily and 4-hour charts! The 4-hour MACD forms a golden cross above the zero line, with the red histogram expanding—bullish momentum has appeared. EMA5, 8, and 13 are arranged bullishly and diverging upward; KDJ’s K value at 64.4 still hasn’t reached overbought levels; volume/energy is 1.4× with normal support—price action is relatively strong.
════════════════════
🔔 Watch for the first-hand market move anomalies 🔔
#多周期共振 #GLW #BE #CSOPSKHYNIX2L
📌 When trading, pay attention to whether the candlestick patterns match
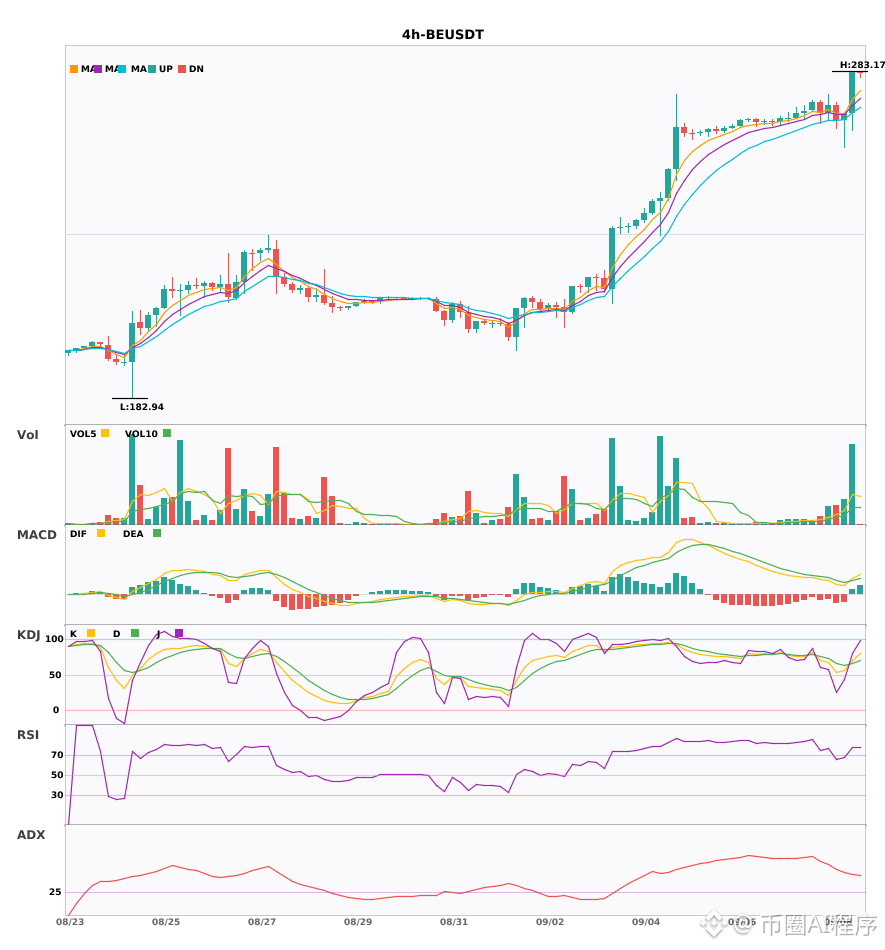
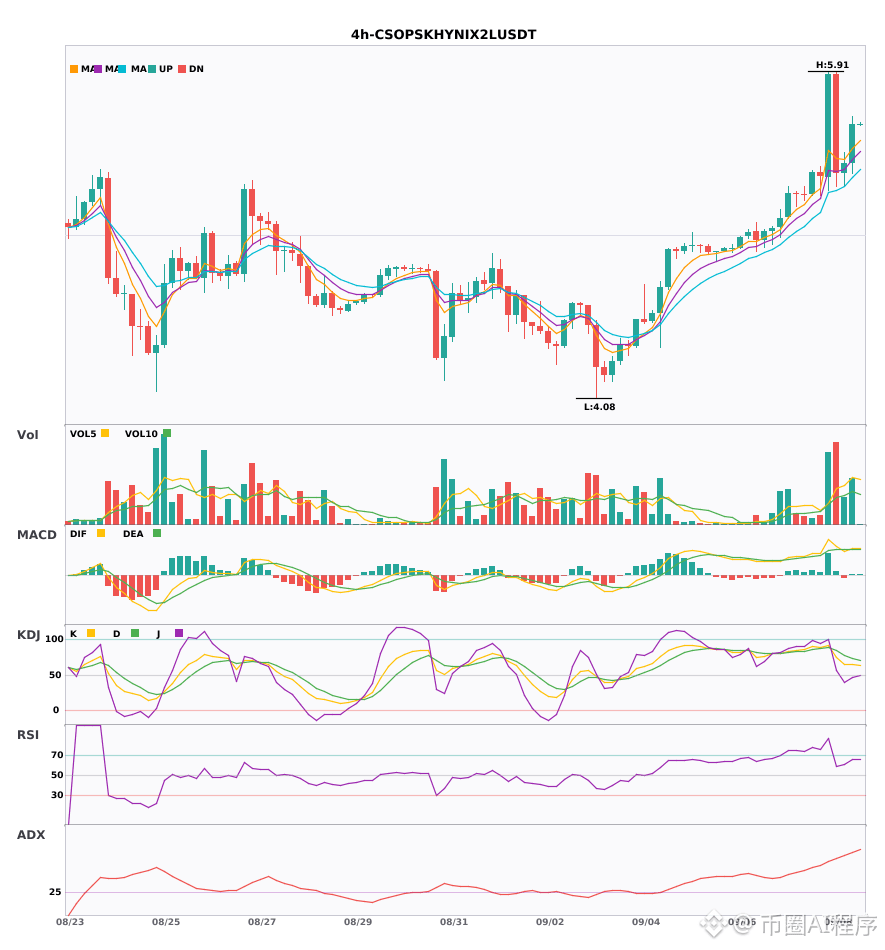
146
Log in to explore more content
Join global crypto users on Binance Square
⚡️ Get latest and useful information about crypto.
💬 Trusted by the world’s largest crypto exchange.
👍 Discover real insights from verified creators.
Email / Phone number
Trending Topics
1
#CPIWatch
86.1M views
499,023 Discussing
2
#USToSanctionBigBankMonday
138 views
32 Discussing
3
#TrumpDeclinesSaudiRequestToStrikeHouthis
6,128 views
164 Discussing
4
#CryptoSectorsFallSecondDay
9,868 views
391 Discussing
5
#BitcoinGoldenCrossConfirms
10,537 views
405 Discussing
6
#AppleRises3.56%AfterIPhoneDuoLaunch
4,590 views
172 Discussing
7
#US10YTreasuryYieldHitsHighestSinceOct2023
7,195 views
140 Discussing
8
#Top7AssetsHold92.1%OfCryptoTop100
7,455 views
135 Discussing
9
#SaudiCrudeOutputHitsLowestSince1990
5,051 views
105 Discussing
10
#IranBlocksStraitOfHormuz
8,074 views
150 Discussing