

#glw
glw
65,814 views
589 Discussing
Hot
Latest


·
--
Bullish
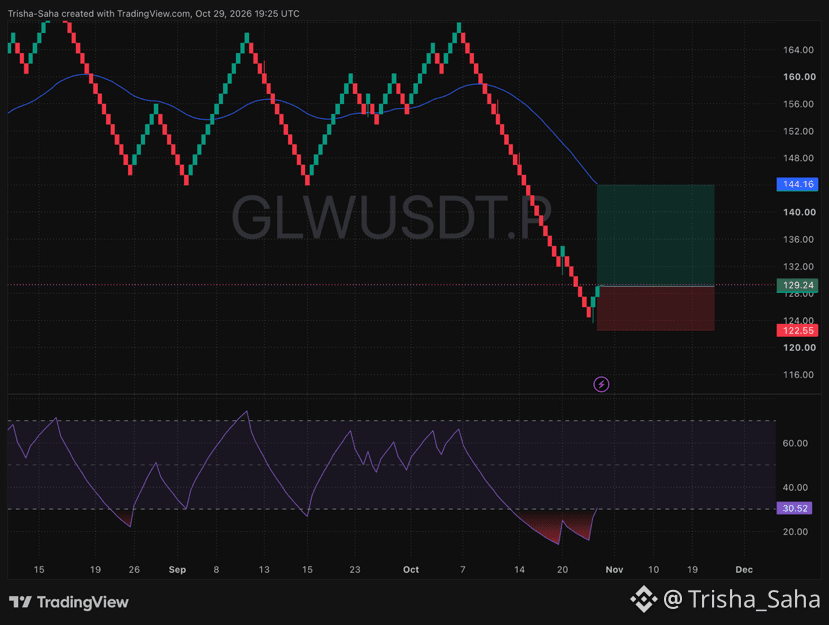
🚨 $GLW is flashing a massive reversal signal right here!
📍 Trade Setup:
• Entry Zone: $127.50 – $129.00
• Stop Loss: $122.55
• Target: $144.16
* Green candle momentum is stepping in hard after that sharp flush, creating a textbook liquidity sweep at the lows.
* Sellers are completely exhausted, leaving a wide-open runway straight toward resistance.
Move your Stop Loss to Break-Even as soon as this trade hits +3% to +4% profit to lock in a risk-free ride.
I'm already in. Are you riding this breakout move with me? Drop a comment below! 👇
#GLW #GLWUSDT #CryptoTrading #BinanceSquare
{future}(GLWUSDT)
🚨 $GLW is flashing a massive reversal signal right here!
📍 Trade Setup:
• Entry Zone: $127.50 – $129.00
• Stop Loss: $122.55
• Target: $144.16
* Green candle momentum is stepping in hard after that sharp flush, creating a textbook liquidity sweep at the lows.
* Sellers are completely exhausted, leaving a wide-open runway straight toward resistance.
Move your Stop Loss to Break-Even as soon as this trade hits +3% to +4% profit to lock in a risk-free ride.
I'm already in. Are you riding this breakout move with me? Drop a comment below! 👇
#GLW #GLWUSDT #CryptoTrading #BinanceSquare
103

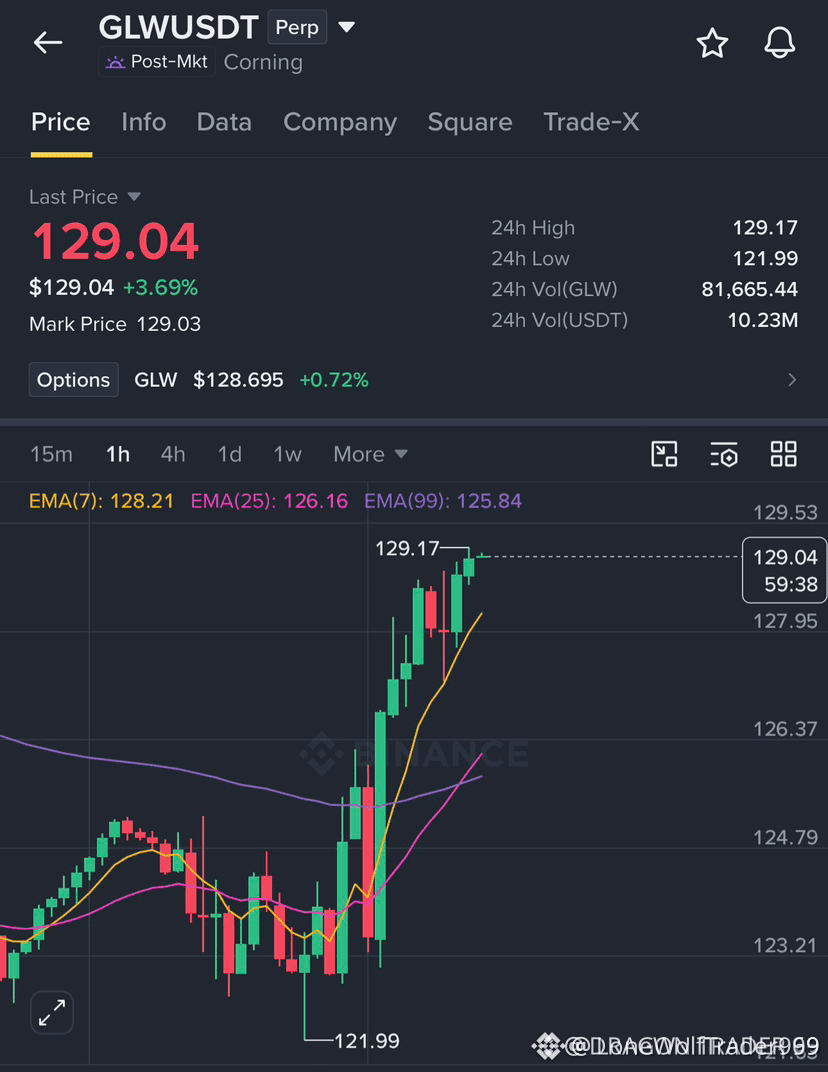
🚀 $GLW CHARGING TOWARD $130 BREAKOUT ZONE! 📈
Entry: 128.80-129.10 ⚡
Target: 130.00 🚀
Stop Loss: 127.80 ⚠️
📊 The $123 support acted as a liquidity sink, swallowing sell pressure and letting buyers flip the script. Now the price is reclaiming the $128‑$129 band with a clean surge, and the order flow shows smart‑money whales stacking at the $130 ceiling. ⚡ Momentum is ticking up on the 4H, and every candle nails a higher close, hinting the next wave could ride straight to the target. 🌊
💬 Are you ready to lock in the upside before the short‑term pullback tests the $127.80 floor? 👇
⚠️ Not financial advice. Always manage your risk. 🛡️
🏷️ #GLW #LongSetup #Bullish #Crypto
🚀 💎
1

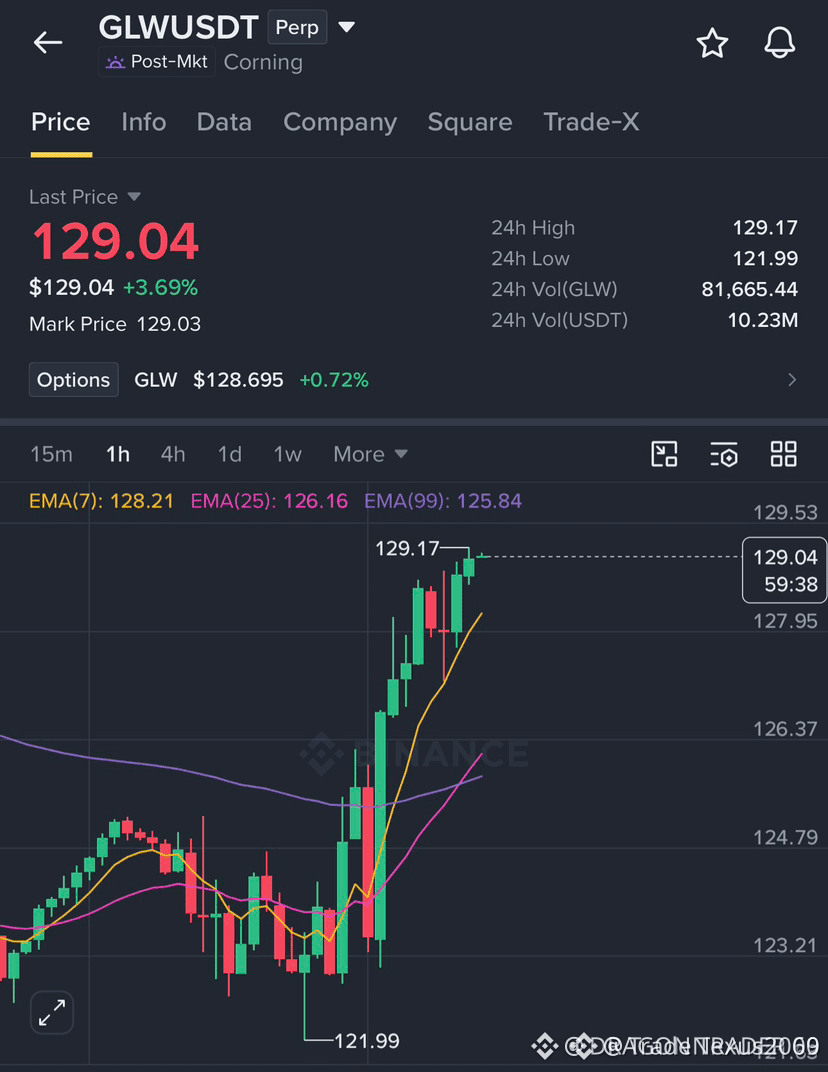
🚀 $GLW BULLS CHASING THE $130 LIQUIDITY ZONE! 🟢
Entry: 128.80‑129.10 ⚡
Target: 130.00 🚀
Stop Loss: 127.80 ⚠️
📊 The price rebounded cleanly off the $123 demand zone, snapping a short‑term pullback and re‑establishing above $128. Institutional liquidity pools sit just above $130, making the next swing a classic smart‑money hunt. 🦈 Volume on the 4H is expanding, confirming buyer aggression as the order block at $128.80‑$129.10 holds. 📈 Risk‑reward sits near 1:2, offering a tight entry for disciplined traders.
💬 How are you positioning for the $130 breakout? 👇
⚠️ Not financial advice. Always manage your risk. 🛡️
🏷️ #GLW #LongSetup #Bullish #Crypto
🔥 💎
6

·
--
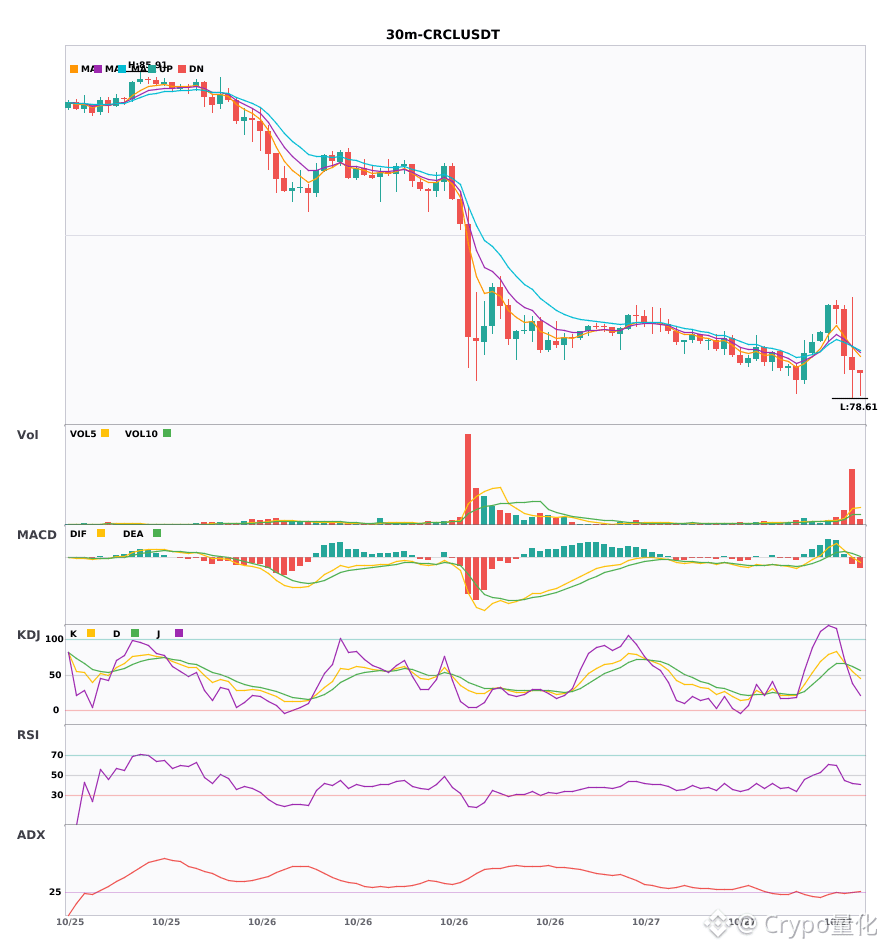
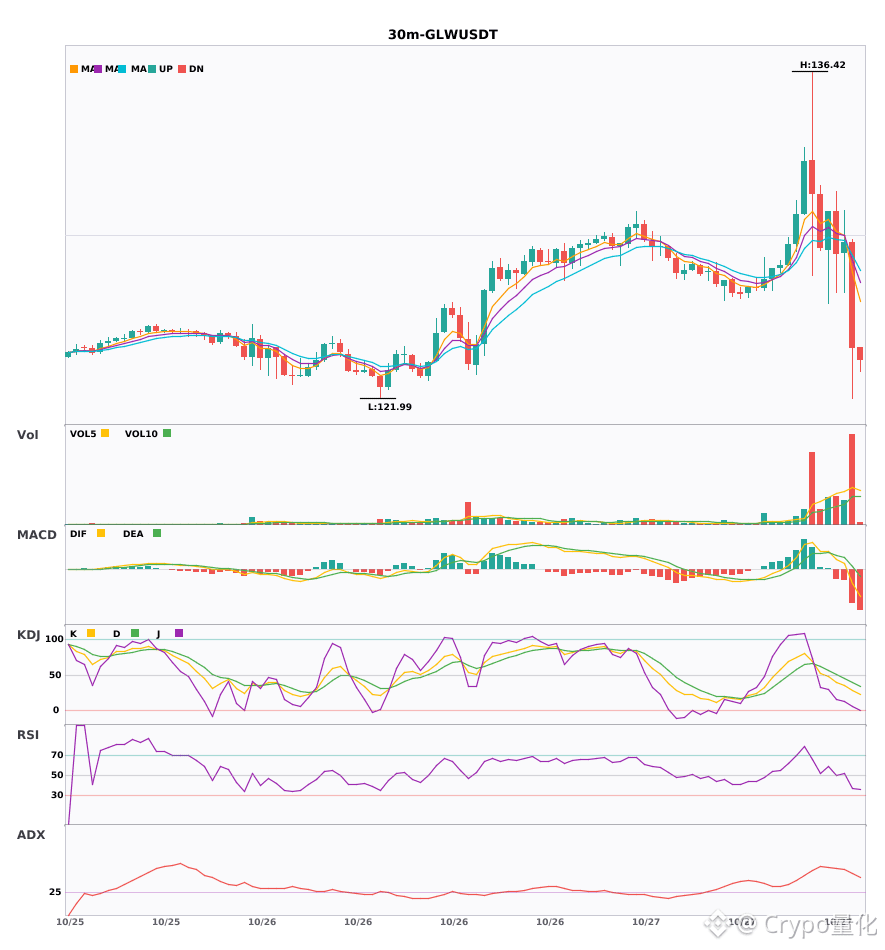
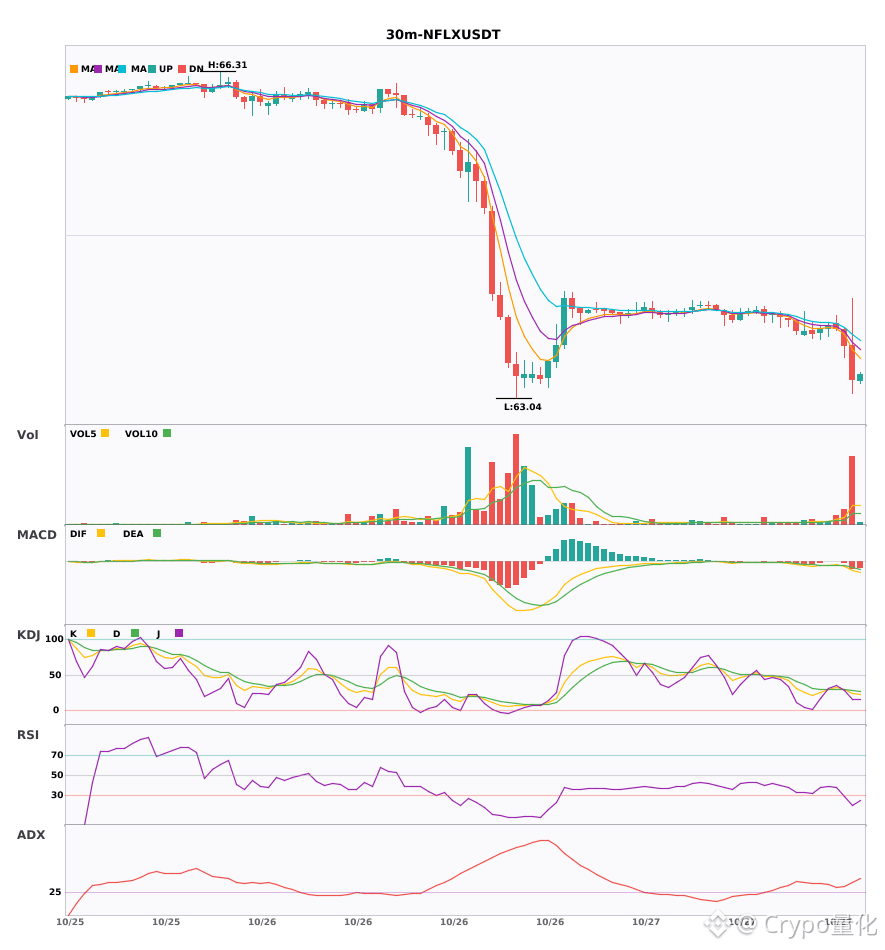
$CRCL / $GLW / $NFLX 30-minute technical indicators are weakening in sync. Beware of risk 🔥
════════════════════
🟢 $CRCL 30-minute bearish signal
⚠️ Technicals: ADX(27): Trend is forming; participation is possible | MACD bearish crossover below zero; bearish momentum accelerating | EMA5 crossed below EMA8; short-term outlook turns bearish | KDJ bearish crossover; short-term outlook bearish (K: 54.5, D: 62.5) | Volume surge (5.4x)
════════════════════
🟢 $GLW 30-minute bearish signal
⚠️ Technicals: ADX(49): Very strong trend (beware of an overbought pullback) | MACD DIF fell below the zero line; trend turns bearish | EMA5 crossed below EMA8; short-term outlook turns bearish | KDJ trending weakly; bears have the upper hand (K: 28.2, D: 39.8) | Volume surge (3.2x)
════════════════════
🟢 $NFLX 30-minute bearish signal
⚠️ Technicals: ADX(34): Clear trending market | MACD bearish crossover below zero; bearish momentum accelerating | EMA5 < EMA8 < EMA13; bearish alignment | KDJ bearish crossover; short-term outlook bearish (K: 29.3, D: 30.0) | Volume surge (3.2x)
════════════════════
🔔 Follow for first-hand market alerts 🔔
#技术分析 #CRCL #GLW #NFLX
📌 When trading, check whether the candlestick pattern confirms the signal.
════════════════════
🟢 $CRCL 30-minute bearish signal
⚠️ Technicals: ADX(27): Trend is forming; participation is possible | MACD bearish crossover below zero; bearish momentum accelerating | EMA5 crossed below EMA8; short-term outlook turns bearish | KDJ bearish crossover; short-term outlook bearish (K: 54.5, D: 62.5) | Volume surge (5.4x)
════════════════════
🟢 $GLW 30-minute bearish signal
⚠️ Technicals: ADX(49): Very strong trend (beware of an overbought pullback) | MACD DIF fell below the zero line; trend turns bearish | EMA5 crossed below EMA8; short-term outlook turns bearish | KDJ trending weakly; bears have the upper hand (K: 28.2, D: 39.8) | Volume surge (3.2x)
════════════════════
🟢 $NFLX 30-minute bearish signal
⚠️ Technicals: ADX(34): Clear trending market | MACD bearish crossover below zero; bearish momentum accelerating | EMA5 < EMA8 < EMA13; bearish alignment | KDJ bearish crossover; short-term outlook bearish (K: 29.3, D: 30.0) | Volume surge (3.2x)
════════════════════
🔔 Follow for first-hand market alerts 🔔
#技术分析 #CRCL #GLW #NFLX
📌 When trading, check whether the candlestick pattern confirms the signal.
14
·
--
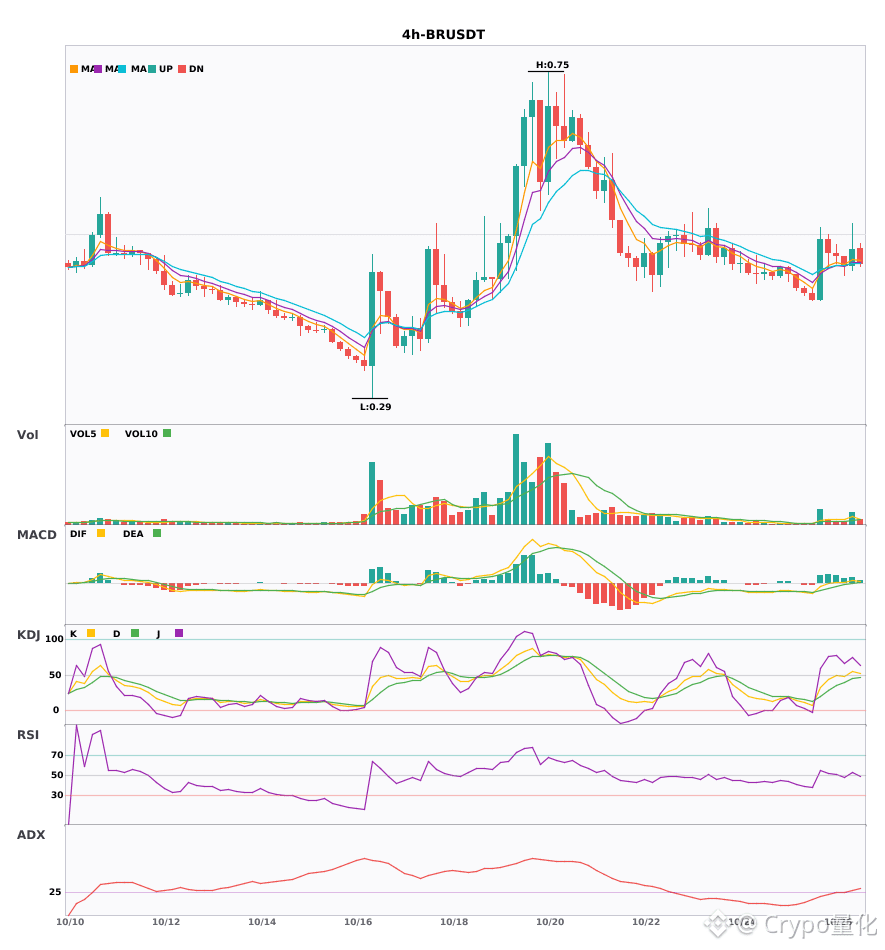
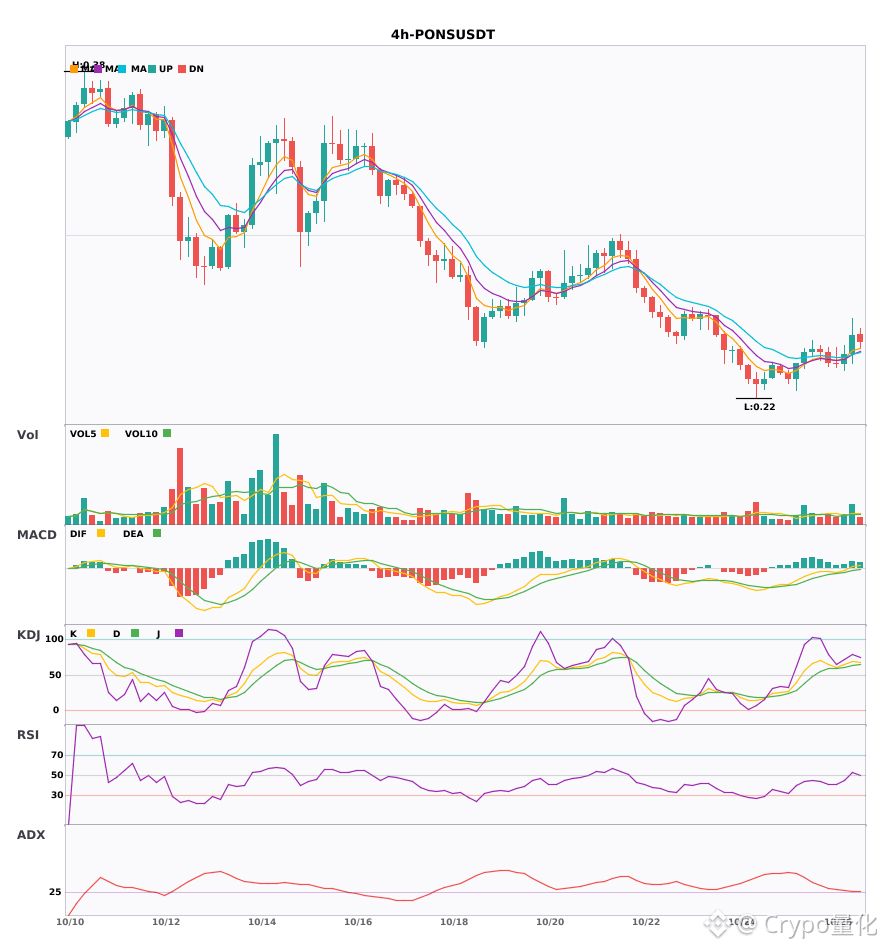
$BR / $GLW / $PONS hourly bullish signals, short-term confluence opportunities 🔥
════════════════════
🔴 $BR 4-hour bullish signal
⚠️Technical analysis: ADX(32): clearly trending market | MACD is bullish, with a relatively strong trend and increasing momentum | EMA5 > EMA8 > EMA13: bullish alignment | Volume surge (2.6x)
════════════════════
🔴 $GLW 4-hour bullish signal
⚠️Technical analysis: ADX(34): clearly trending market | MACD DIF breaks above the zero line, signaling a bullish trend reversal | EMA5 > EMA8 > EMA13: bullish alignment | KDJ golden cross, short-term outlook is bullish (K: 67.8, D: 61.9) | Volume surge (4.3x)
════════════════════
🔴 $PONS 4-hour bullish signal
⚠️Technical analysis: ADX(26): trend is forming, presenting a potential opportunity | MACD DIF breaks above the zero line, signaling a bullish trend reversal | EMA5 > EMA8 > EMA13: bullish alignment | KDJ is strong, with bulls in control (K: 68.7, D: 63.6) | Increased volume (2.0x)
════════════════════
🔔 Follow for the latest market movements 🔔
#技术分析 #BR #GLW #PONS
📌 When trading, watch whether the candlestick patterns align
════════════════════
🔴 $BR 4-hour bullish signal
⚠️Technical analysis: ADX(32): clearly trending market | MACD is bullish, with a relatively strong trend and increasing momentum | EMA5 > EMA8 > EMA13: bullish alignment | Volume surge (2.6x)
════════════════════
🔴 $GLW 4-hour bullish signal
⚠️Technical analysis: ADX(34): clearly trending market | MACD DIF breaks above the zero line, signaling a bullish trend reversal | EMA5 > EMA8 > EMA13: bullish alignment | KDJ golden cross, short-term outlook is bullish (K: 67.8, D: 61.9) | Volume surge (4.3x)
════════════════════
🔴 $PONS 4-hour bullish signal
⚠️Technical analysis: ADX(26): trend is forming, presenting a potential opportunity | MACD DIF breaks above the zero line, signaling a bullish trend reversal | EMA5 > EMA8 > EMA13: bullish alignment | KDJ is strong, with bulls in control (K: 68.7, D: 63.6) | Increased volume (2.0x)
════════════════════
🔔 Follow for the latest market movements 🔔
#技术分析 #BR #GLW #PONS
📌 When trading, watch whether the candlestick patterns align
20

·
--
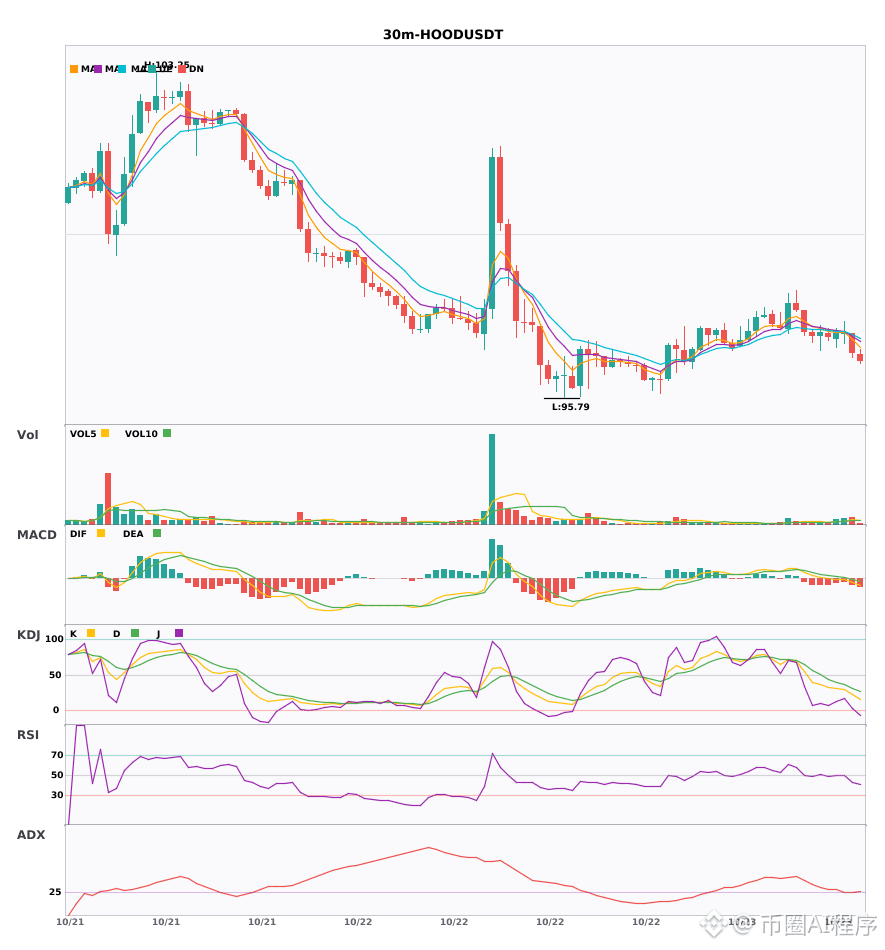
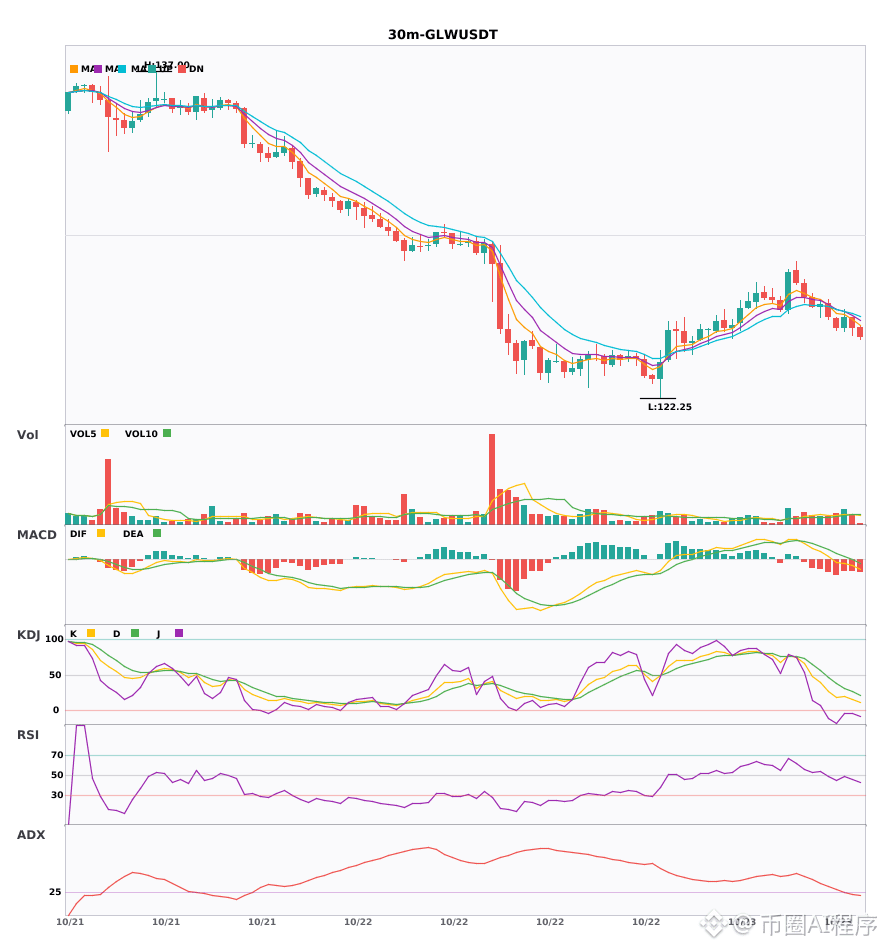
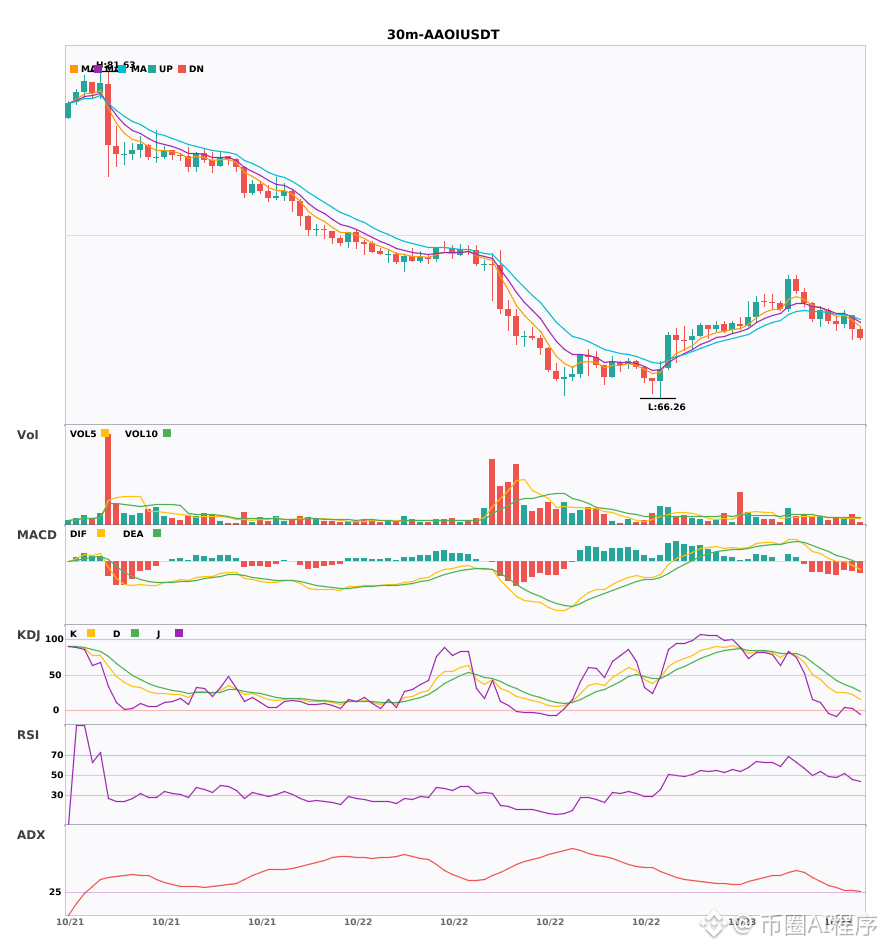
$HOOD / $GLW / $AAOI 30-minute bearish signals, confirmed by the 4-hour bearish trend 🔥
════════════════════
🟢 $HOOD 30-minute bearish signal
⚠️ Technical analysis: 4-hour bearish confluence confirmed | 30-minute entry: MACD bearish, trend weak, momentum strengthening | EMA5 < EMA8 < EMA13, bearish alignment | KDJ weak, bears in control (K: 22.2, D: 31.8) | Volume increased (1.8x)
════════════════════
🟢 $GLW 30-minute bearish signal
⚠️ Technical analysis: 4-hour bearish confluence confirmed | 30-minute entry: MACD bearish, trend weak, momentum weakening | EMA5 < EMA8 < EMA13, bearish alignment | KDJ weak, bears in control (K: 19.5, D: 31.5) | Volume increased (1.6x)
════════════════════
🟢 $AAOI 30-minute bearish signal
⚠️ Technical analysis: 4-hour bearish confluence confirmed | 30-minute entry: MACD bearish, trend weak, momentum strengthening | EMA5 < EMA8 < EMA13, bearish alignment | KDJ weak, bears in control (K: 22.5, D: 31.9) | Volume normal (1.3x)
════════════════════
🔔 Follow for the latest market movements 🔔
#多周期共振 #HOOD #GLW #AAOI
📌 When trading, pay attention to whether the candlestick pattern matches
════════════════════
🟢 $HOOD 30-minute bearish signal
⚠️ Technical analysis: 4-hour bearish confluence confirmed | 30-minute entry: MACD bearish, trend weak, momentum strengthening | EMA5 < EMA8 < EMA13, bearish alignment | KDJ weak, bears in control (K: 22.2, D: 31.8) | Volume increased (1.8x)
════════════════════
🟢 $GLW 30-minute bearish signal
⚠️ Technical analysis: 4-hour bearish confluence confirmed | 30-minute entry: MACD bearish, trend weak, momentum weakening | EMA5 < EMA8 < EMA13, bearish alignment | KDJ weak, bears in control (K: 19.5, D: 31.5) | Volume increased (1.6x)
════════════════════
🟢 $AAOI 30-minute bearish signal
⚠️ Technical analysis: 4-hour bearish confluence confirmed | 30-minute entry: MACD bearish, trend weak, momentum strengthening | EMA5 < EMA8 < EMA13, bearish alignment | KDJ weak, bears in control (K: 22.5, D: 31.9) | Volume normal (1.3x)
════════════════════
🔔 Follow for the latest market movements 🔔
#多周期共振 #HOOD #GLW #AAOI
📌 When trading, pay attention to whether the candlestick pattern matches
2
·
--
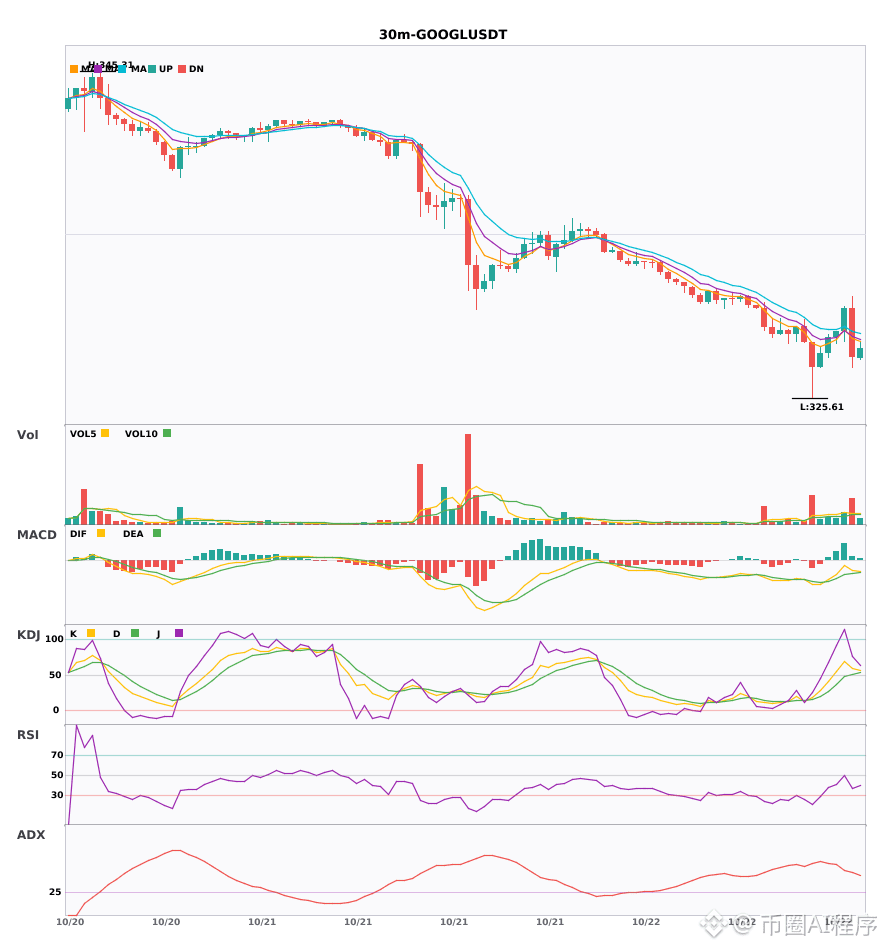
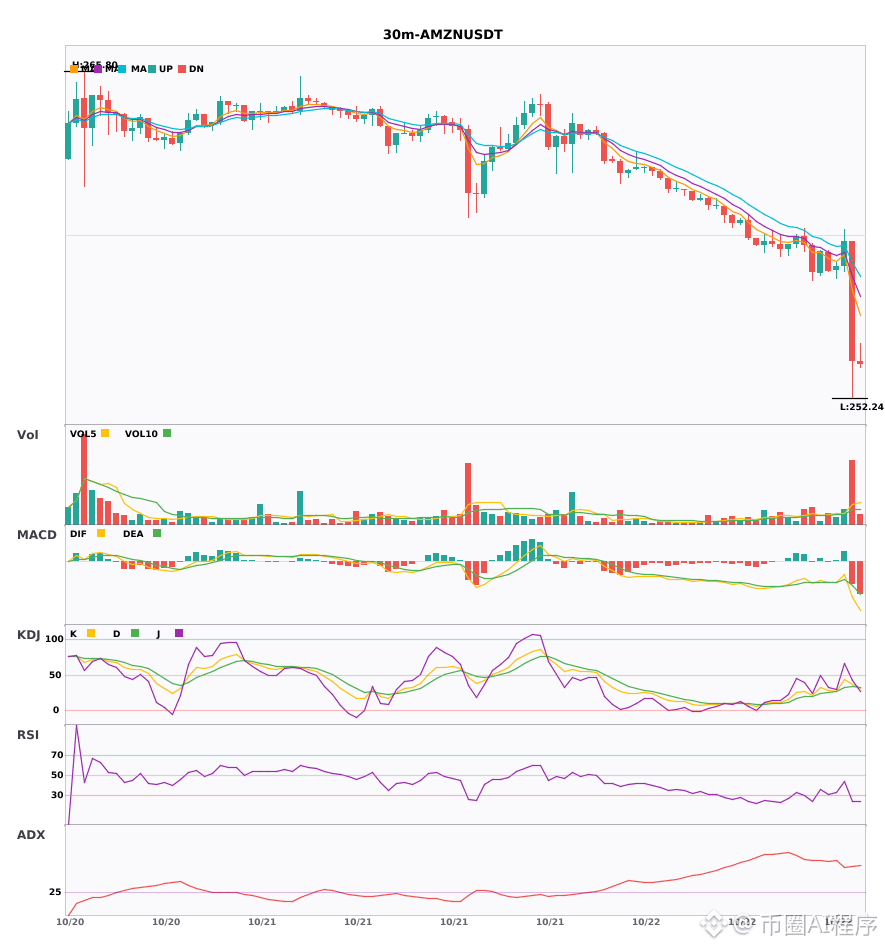
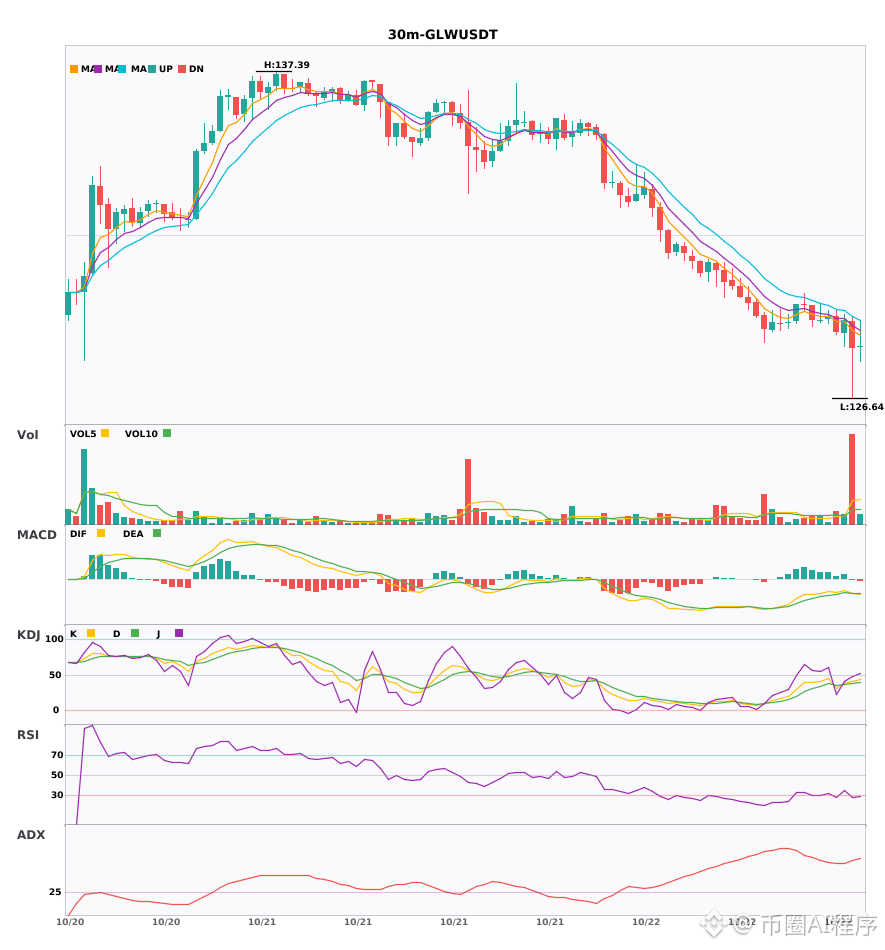
Multi-timeframe resonance: $GOOGL / $AMZN / $GLW weakening on the 30-minute chart; 4-hour bearish trend confirmed 🔥
════════════════════
🟢 $GOOGL 30-minute bearish signal
⚠️Technical analysis: 4-hour bearish resonance confirmed | 30-minute entry: EMA5 crosses below EMA8, turning bearish in the short term | KDJ showing strength, bulls in control (K: 59.5, D: 51.3) | Volume surge (2.5x)
════════════════════
🟢 $AMZN 30-minute bearish signal
⚠️Technical analysis: 4-hour bearish resonance confirmed | 30-minute entry: MACD bearish crossover below zero, bearish momentum accelerating | EMA5 < EMA8 < EMA13, bearish alignment | KDJ showing weakness, bears in control (K: 36.3, D: 33.4) | Volume surge (4.1x)
════════════════════
🟢 $GLW 30-minute bearish signal
⚠️Technical analysis: 4-hour bearish resonance confirmed | 30-minute entry: MACD bearish crossover below zero, bearish momentum accelerating | EMA5 < EMA8 < EMA13, bearish alignment | KDJ showing weakness, bears in control (K: 41.2, D: 38.2) | Volume surge (5.8x)
════════════════════
🔔 Follow for the latest market moves 🔔
#多周期共振 #GOOGL #AMZN #GLW
📌 When trading, pay attention to whether the candlestick pattern meets expectations
════════════════════
🟢 $GOOGL 30-minute bearish signal
⚠️Technical analysis: 4-hour bearish resonance confirmed | 30-minute entry: EMA5 crosses below EMA8, turning bearish in the short term | KDJ showing strength, bulls in control (K: 59.5, D: 51.3) | Volume surge (2.5x)
════════════════════
🟢 $AMZN 30-minute bearish signal
⚠️Technical analysis: 4-hour bearish resonance confirmed | 30-minute entry: MACD bearish crossover below zero, bearish momentum accelerating | EMA5 < EMA8 < EMA13, bearish alignment | KDJ showing weakness, bears in control (K: 36.3, D: 33.4) | Volume surge (4.1x)
════════════════════
🟢 $GLW 30-minute bearish signal
⚠️Technical analysis: 4-hour bearish resonance confirmed | 30-minute entry: MACD bearish crossover below zero, bearish momentum accelerating | EMA5 < EMA8 < EMA13, bearish alignment | KDJ showing weakness, bears in control (K: 41.2, D: 38.2) | Volume surge (5.8x)
════════════════════
🔔 Follow for the latest market moves 🔔
#多周期共振 #GOOGL #AMZN #GLW
📌 When trading, pay attention to whether the candlestick pattern meets expectations
10
·
--
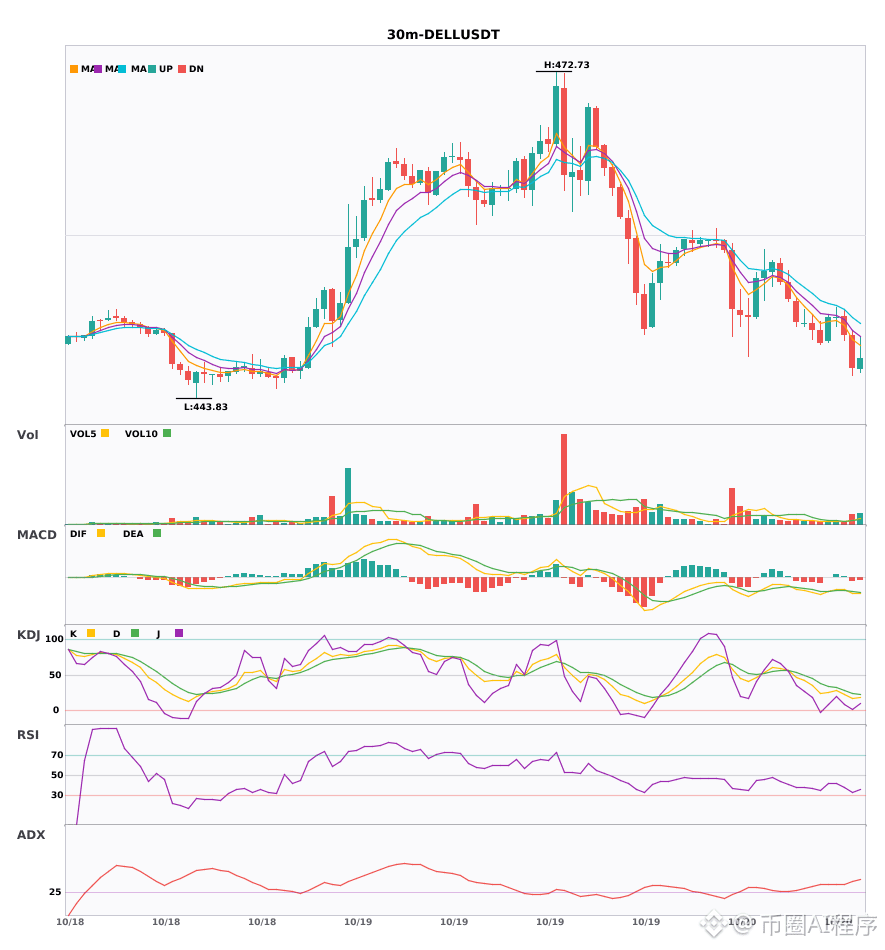
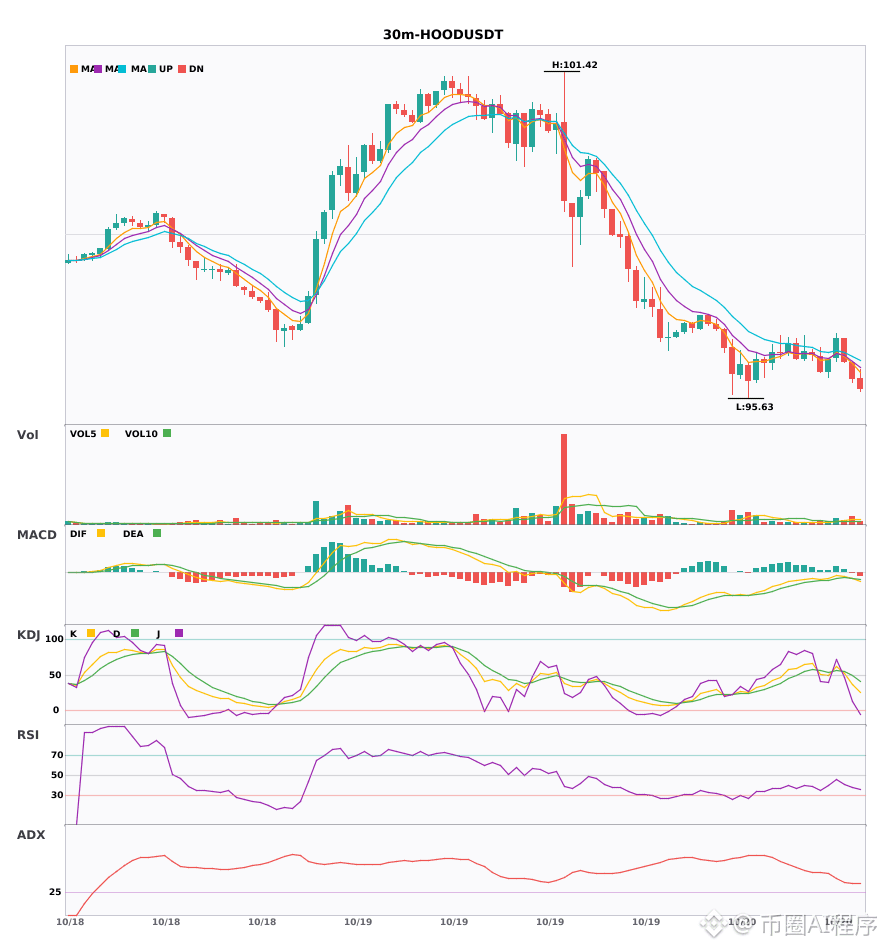
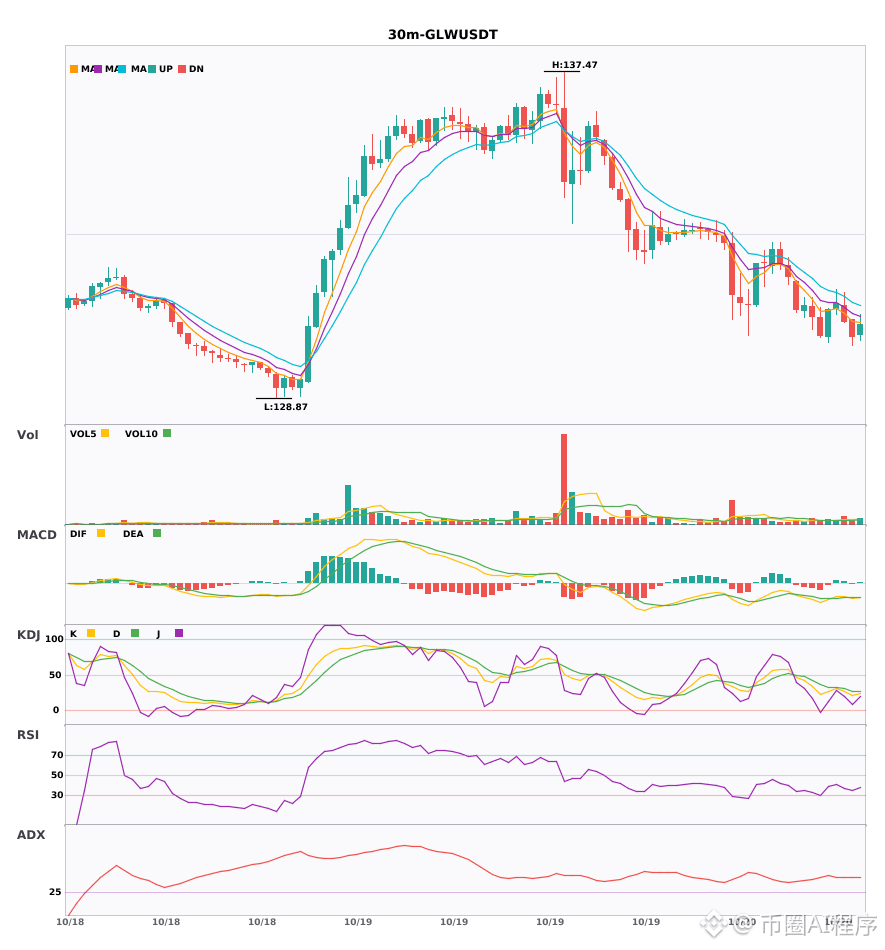
$DELL / $HOOD / $GLW 30-minute shorts + 4-hour shorts aligned; multi-timeframe confluence turns bearish 🔥
════════════════════
🟢 $DELL 30-minute Short Signal
⚠️Technical Analysis: 4-hour bearish confluence confirmed | 30-minute entry: MACD bearish crossover below zero, bearish momentum accelerating | EMA5 < EMA8 < EMA13 bearish alignment | KDJ weakening, bears in control (K=16.9, D=24.7) | Increased volume (2.4x)
📢Market Update: Binance Will Support Dell Technologies (DELL) Cash Dividend Distribution via bStocks
════════════════════
🟢 $HOOD 30-minute Short Signal
⚠️Technical Analysis: 4-hour bearish confluence confirmed | 30-minute entry: MACD bearish crossover below zero, bearish momentum accelerating | EMA5 < EMA8 < EMA13 bearish alignment | KDJ weakening, bears in control (K=36.6, D=48.7) | Increased volume (2.2x)
════════════════════
🟢 $GLW 30-minute Short Signal
⚠️Technical Analysis: 4-hour bearish confluence confirmed | 30-minute entry: MACD bearish crossover below zero, bearish momentum accelerating | EMA5 < EMA8 < EMA13 bearish alignment | KDJ weakening, bears in control (K=21.2, D=27.5) | Increased volume (1.8x)
════════════════════
🔔 Follow for real-time market movements 🔔
#多周期共振 #DELL #HOOD #GLW
📌 When trading, pay attention to whether the candlestick pattern confirms the signal
════════════════════
🟢 $DELL 30-minute Short Signal
⚠️Technical Analysis: 4-hour bearish confluence confirmed | 30-minute entry: MACD bearish crossover below zero, bearish momentum accelerating | EMA5 < EMA8 < EMA13 bearish alignment | KDJ weakening, bears in control (K=16.9, D=24.7) | Increased volume (2.4x)
📢Market Update: Binance Will Support Dell Technologies (DELL) Cash Dividend Distribution via bStocks
════════════════════
🟢 $HOOD 30-minute Short Signal
⚠️Technical Analysis: 4-hour bearish confluence confirmed | 30-minute entry: MACD bearish crossover below zero, bearish momentum accelerating | EMA5 < EMA8 < EMA13 bearish alignment | KDJ weakening, bears in control (K=36.6, D=48.7) | Increased volume (2.2x)
════════════════════
🟢 $GLW 30-minute Short Signal
⚠️Technical Analysis: 4-hour bearish confluence confirmed | 30-minute entry: MACD bearish crossover below zero, bearish momentum accelerating | EMA5 < EMA8 < EMA13 bearish alignment | KDJ weakening, bears in control (K=21.2, D=27.5) | Increased volume (1.8x)
════════════════════
🔔 Follow for real-time market movements 🔔
#多周期共振 #DELL #HOOD #GLW
📌 When trading, pay attention to whether the candlestick pattern confirms the signal
9
·
--
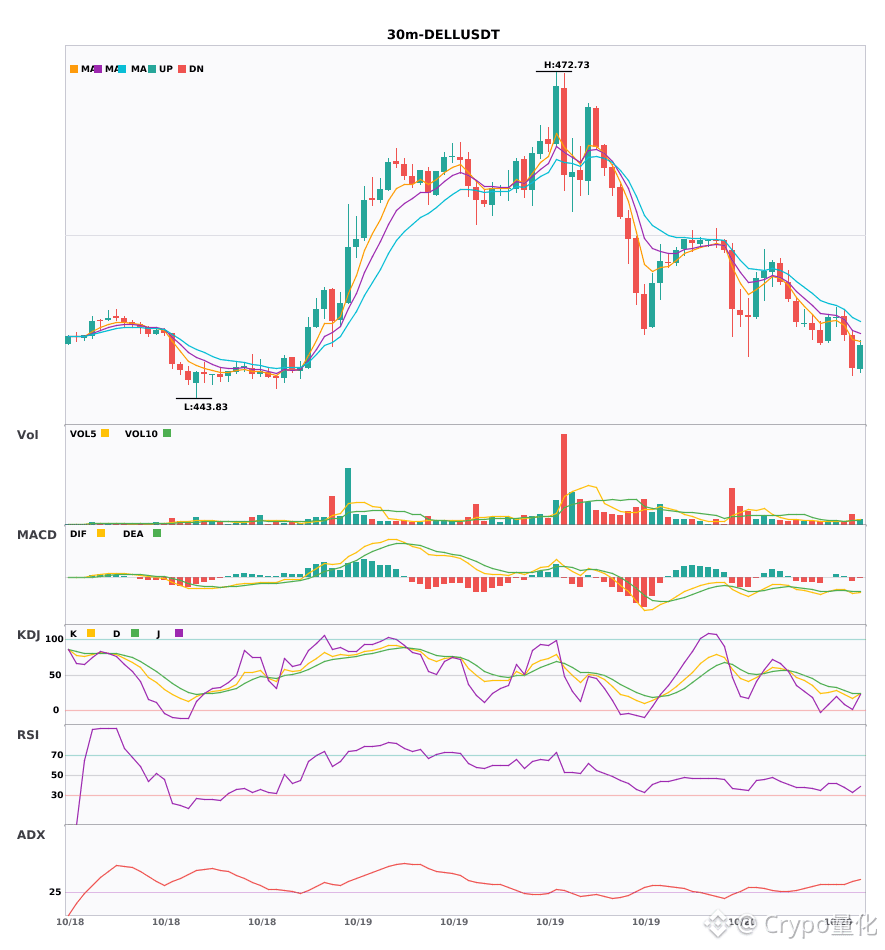
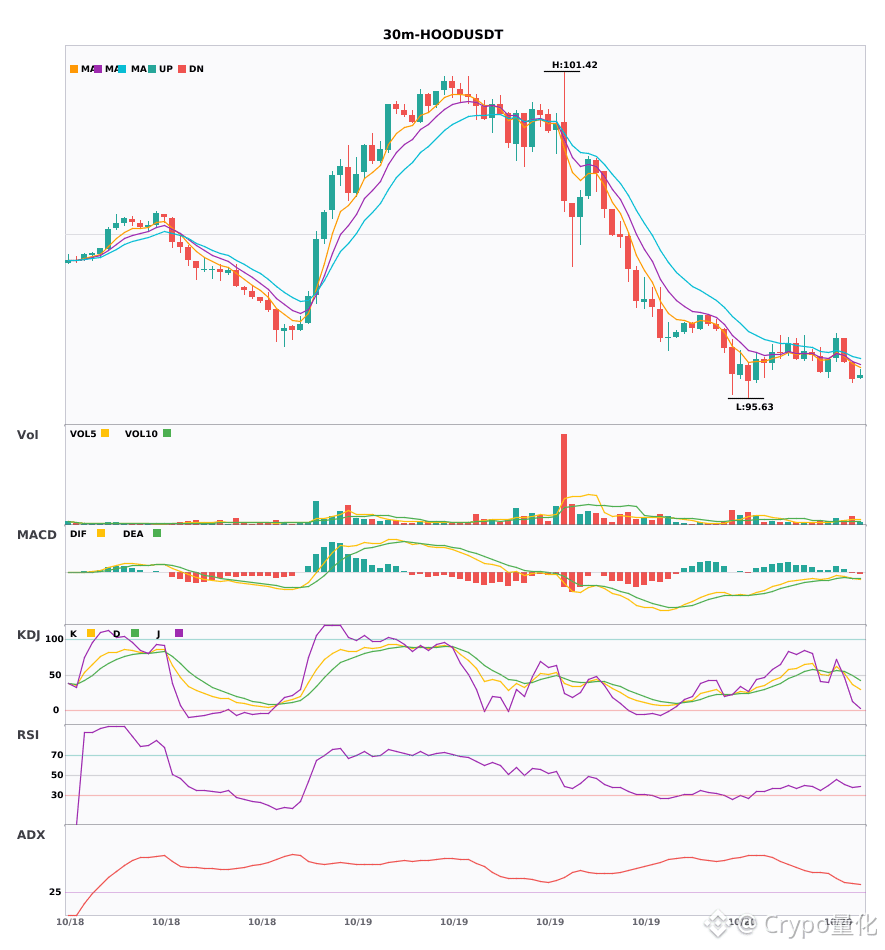
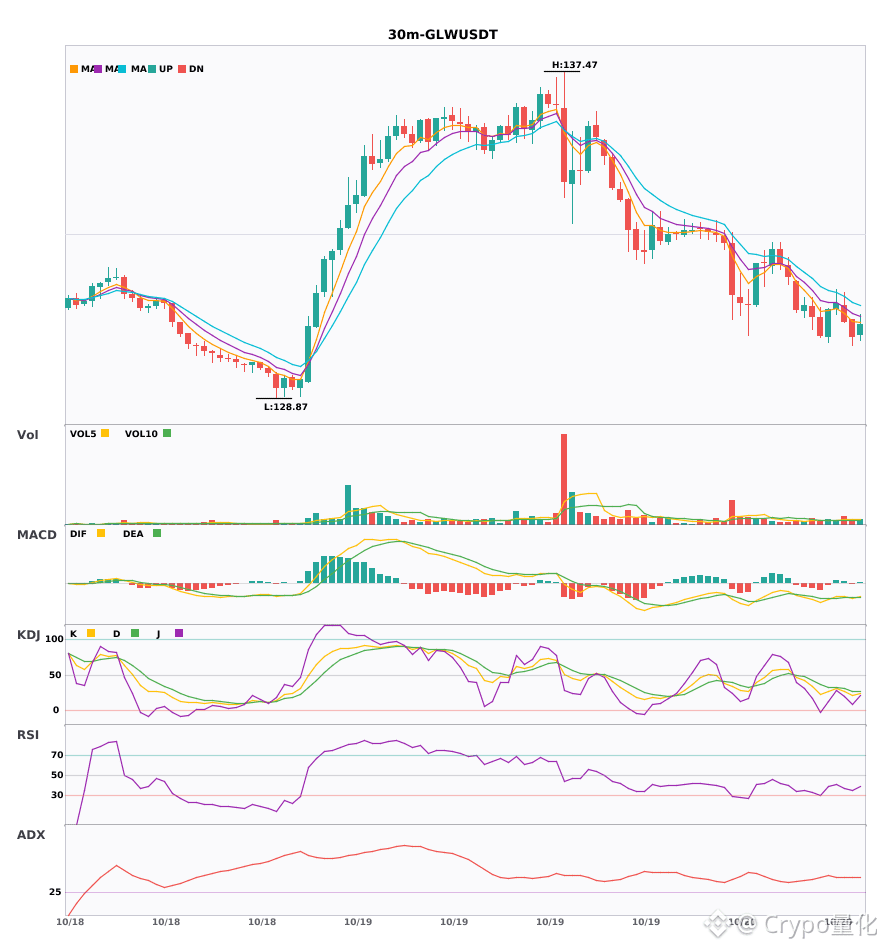
$DELL / $HOOD / $GLW 30-minute signals converge bearish, with short signals appearing simultaneously 🔥
════════════════════
🟢 $DELL 30-minute bearish signal
⚠️Technical analysis: ADX (39): clear trending market | MACD bearish cross below zero, bearish momentum accelerating | EMA5 < EMA8 < EMA13: bearish alignment | KDJ trending weakly, bears in control (K: 16.9, D: 24.7) | Volume increased (2.4x)
📢Market update: Binance Will Support Dell Technologies (DELL) Cash Dividend Distribution via bStocks
════════════════════
🟢 $HOOD 30-minute bearish signal
⚠️Technical analysis: ADX (31): clear trending market | MACD bearish cross below zero, bearish momentum accelerating | EMA5 < EMA8 < EMA13: bearish alignment | KDJ trending weakly, bears in control (K: 36.6, D: 48.7) | Volume increased (2.2x)
════════════════════
🟢 $GLW 30-minute bearish signal
⚠️Technical analysis: ADX (42): clear trending market | MACD bearish cross below zero, bearish momentum accelerating | EMA5 < EMA8 < EMA13: bearish alignment | KDJ trending weakly, bears in control (K: 21.2, D: 27.5) | Volume increased (1.8x)
════════════════════
🔔 Follow for breaking market updates 🔔
#技术分析 #DELL #HOOD #GLW
📌 When trading, pay attention to whether the candlestick pattern confirms the signal
════════════════════
🟢 $DELL 30-minute bearish signal
⚠️Technical analysis: ADX (39): clear trending market | MACD bearish cross below zero, bearish momentum accelerating | EMA5 < EMA8 < EMA13: bearish alignment | KDJ trending weakly, bears in control (K: 16.9, D: 24.7) | Volume increased (2.4x)
📢Market update: Binance Will Support Dell Technologies (DELL) Cash Dividend Distribution via bStocks
════════════════════
🟢 $HOOD 30-minute bearish signal
⚠️Technical analysis: ADX (31): clear trending market | MACD bearish cross below zero, bearish momentum accelerating | EMA5 < EMA8 < EMA13: bearish alignment | KDJ trending weakly, bears in control (K: 36.6, D: 48.7) | Volume increased (2.2x)
════════════════════
🟢 $GLW 30-minute bearish signal
⚠️Technical analysis: ADX (42): clear trending market | MACD bearish cross below zero, bearish momentum accelerating | EMA5 < EMA8 < EMA13: bearish alignment | KDJ trending weakly, bears in control (K: 21.2, D: 27.5) | Volume increased (1.8x)
════════════════════
🔔 Follow for breaking market updates 🔔
#技术分析 #DELL #HOOD #GLW
📌 When trading, pay attention to whether the candlestick pattern confirms the signal
7

·
--
Bullish
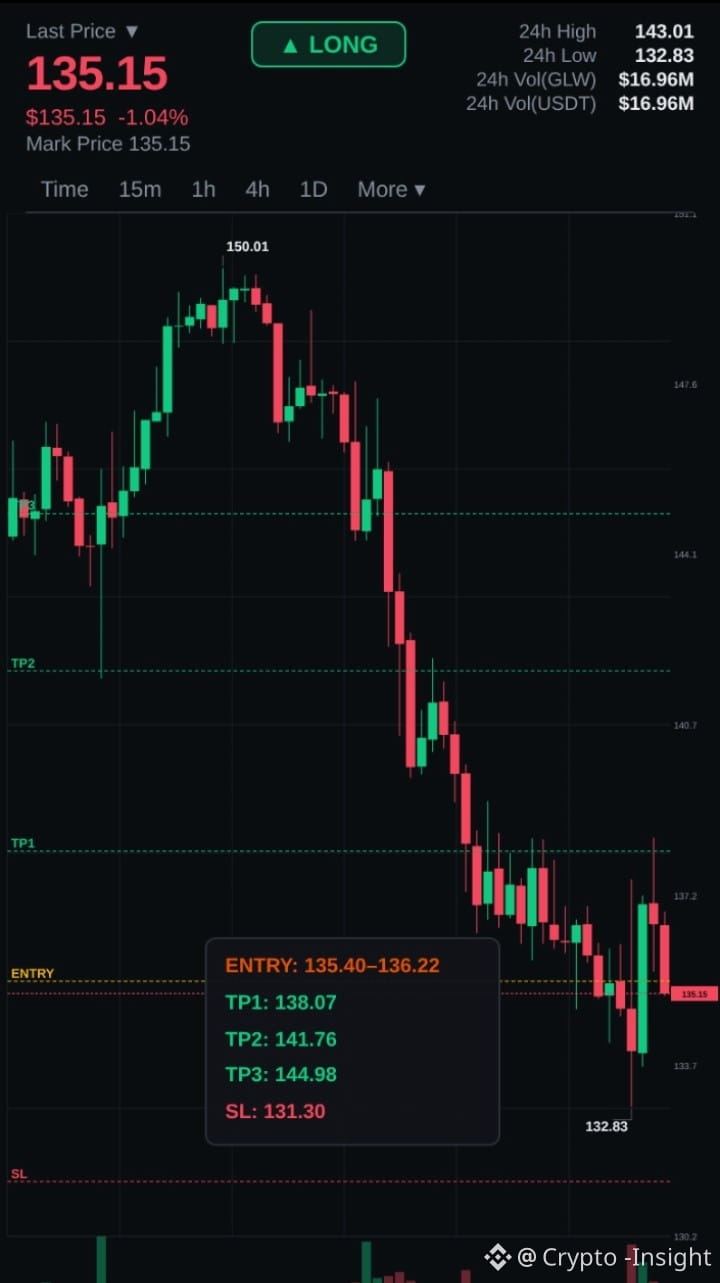
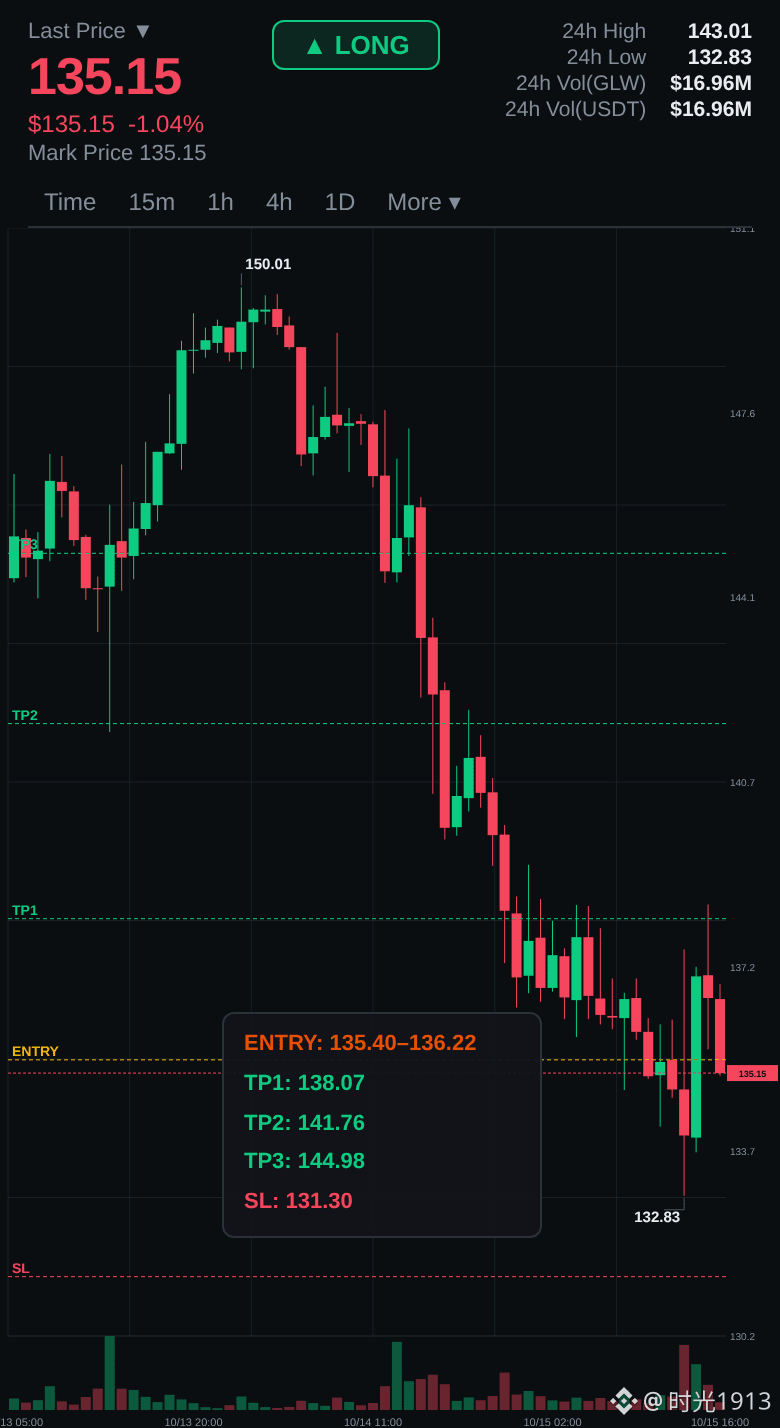
$GLW is staging a powerful bullish bounce off local support, gearing up for an#GLW aggressive continuation rally as buyers reclaim momentum. The market structure is setting up perfectly for a fast push toward upper resistance targets.
Entry: 135.40–136.22
TP1: 138.07
TP2: 141.76
TP3: 144.98
SL: 131.30
Buy and trade
{future}(GLWUSDT)
$GLW is staging a powerful bullish bounce off local support, gearing up for an#GLW aggressive continuation rally as buyers reclaim momentum. The market structure is setting up perfectly for a fast push toward upper resistance targets.
Entry: 135.40–136.22
TP1: 138.07
TP2: 141.76
TP3: 144.98
SL: 131.30
Buy and trade
Entry: 135.40–136.22
TP1: 138.07
TP2: 141.76
TP3: 144.98
SL: 131.30
Buy and trade
1
139


·
--
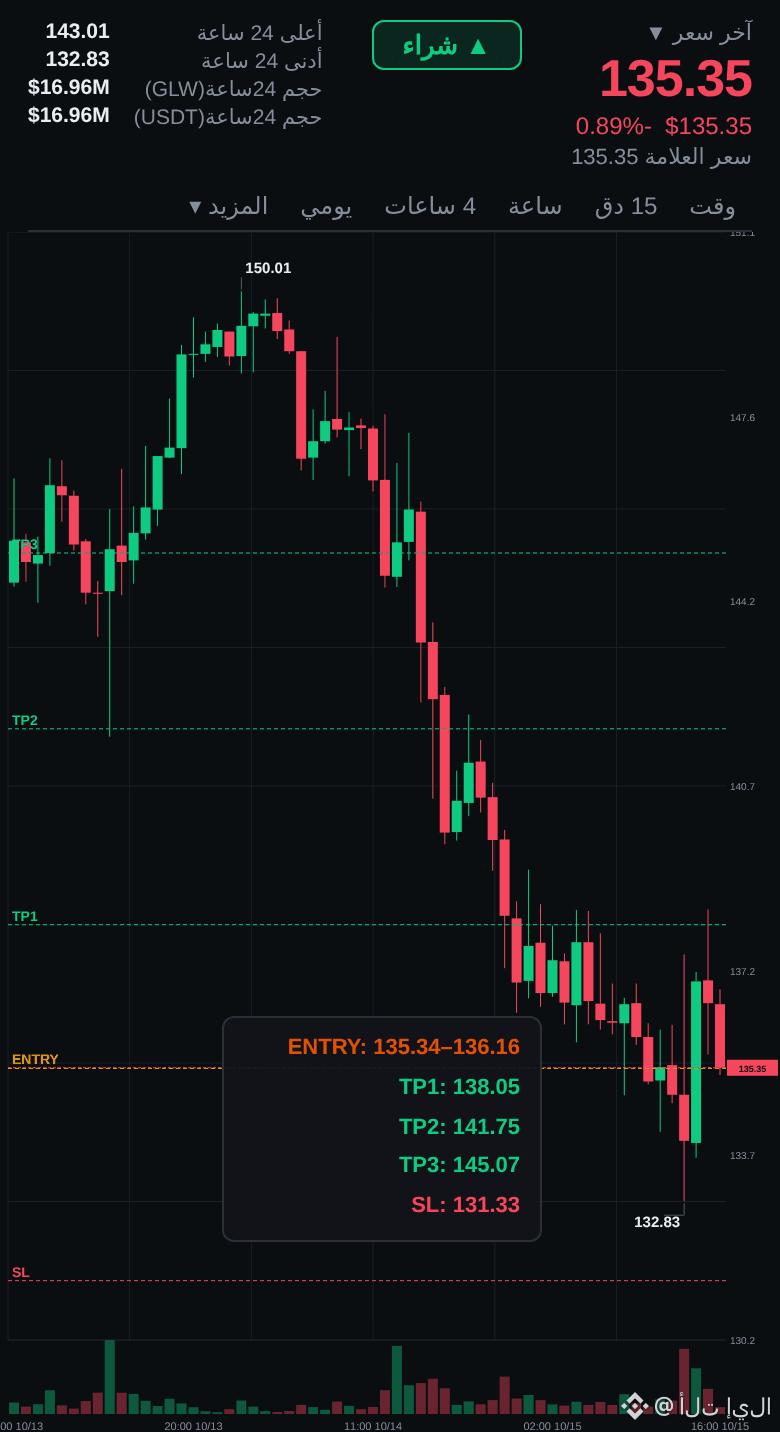
🚨 HEAVY SELLER POSITIONING EMERGES AS $GLW FACES REJECTION AT OVERHEAD RESISTANCE! 📉
Entry: 158.20 - 159.00 ⚡
Target: 156.10 🎯
Stop Loss: 160.20 🛑
Seller absorption is getting obvious around the 159 range as momentum stalls out following a sharp exhaustion rally. 📊 Order flow indicates institutional bids pulling back while supply builds heavily above 158.20.
📌 With buyers failing to defend local structure, this short vector offers a tight risk curve back down toward the target zones. 💡 If sellers maintain pressure, structural support at 156.10 stands directly in the crosshairs. 💭 Are you riding this short down to target or watching for a reclaim of 160? 👇
⚠️ Not financial advice. Always manage your risk. 🛡️
🏷️ #GLW #ShortSetup #Crypto #OrderFlow
📉 🎯
14


·
--
Bullish
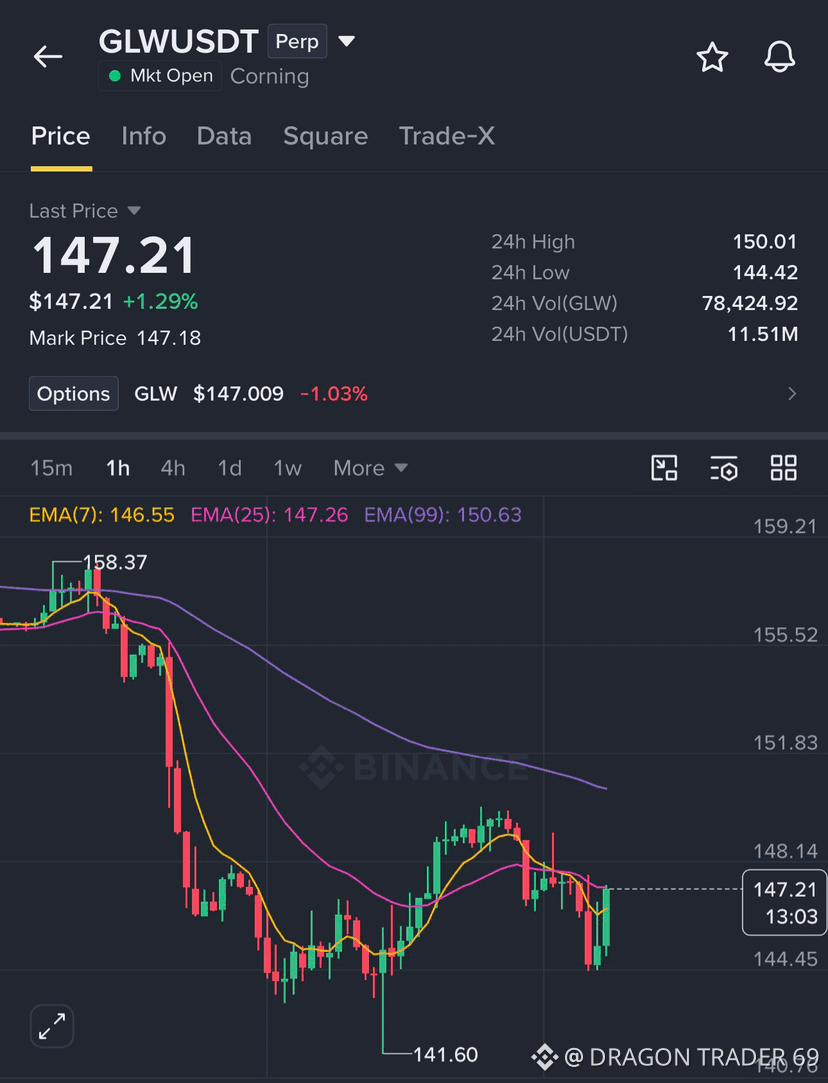
🚀 $GLW LONG SETUP — BULLISH MOVE IN FOCUS! 🔥
Dear followers, #GLW is presenting a fresh long opportunity! Buyers are looking to push the price toward higher levels. 📈
🟢 Entry Zone: $146.49 – $147.22
🎯 TP1: $147.50
🎯 TP2: $148.20
🎯 TP3: $149.00
🛑 Stop Loss: $144.88
🔥 Stay focused, follow your entry plan, and manage your risk!
LONG TRADE HERE👉🏻 $GLW NOW! 🚀
{future}(GLWUSDT)
🚀 $GLW LONG SETUP — BULLISH MOVE IN FOCUS! 🔥
Dear followers, #GLW is presenting a fresh long opportunity! Buyers are looking to push the price toward higher levels. 📈
🟢 Entry Zone: $146.49 – $147.22
🎯 TP1: $147.50
🎯 TP2: $148.20
🎯 TP3: $149.00
🛑 Stop Loss: $144.88
🔥 Stay focused, follow your entry plan, and manage your risk!
LONG TRADE HERE👉🏻 $GLW NOW! 🚀
17

·
--
Two overbought signals.
$GLW 5-minute RSI surged to 91.1, indicating overbought conditions. Current price: 147.73. Up 0.6% over 24h.
$AERO weekly RSI is 81, indicating overbought conditions. Current price: 0.9. Up 0.4% over 24h.
---
$GLW 5-minute RSI: 91.1. Extremely overbought. Current price: 147.73. Up 0.6% over 24h.
Support: 145, 141. Resistance: 150, 153.
Funding rate: 0. The market has no directional bias priced in. Bulls and bears are battling fiercely.
Current price: 147.73. Bearish bias. Entry range: 148–150; stop-loss: 153; target: 142. Risk/reward ratio: about 2:1. An RSI of 91.1 suggests short-term buying is overheated, making a pullback from overbought levels on the 5-minute chart likely.
$AERO weekly RSI: 81. Overbought. Current price: 0.9. Up 0.4% over 24h.
Support: 0.875, 0.855. Resistance: 0.95, 0.99.
Funding rate: +0.002%. Bulls have a slight, but not decisive, edge.
Current price: 0.9. Bearish bias. Entry range: 0.91–0.93; stop-loss: 0.96; target: 0.86. Risk/reward ratio: about 2:1. A weekly RSI of 81 suggests strong momentum on the higher timeframe, but it is stretched, and pullback pressure is building.
---
Both coins are overbought. GLW is overheated after a sharp short-term rally, while AERO is showing a prolonged overbought reading near the highs on the higher timeframe. The setups differ, but the logic is the same: after a big run-up, a pullback is due. Position sizing matters more than direction.
I’m keeping an eye on them.
For a tailored strategy, reach out to Nini.
#GLW #AERO #超买回调 #RSI Signal
56
·
--
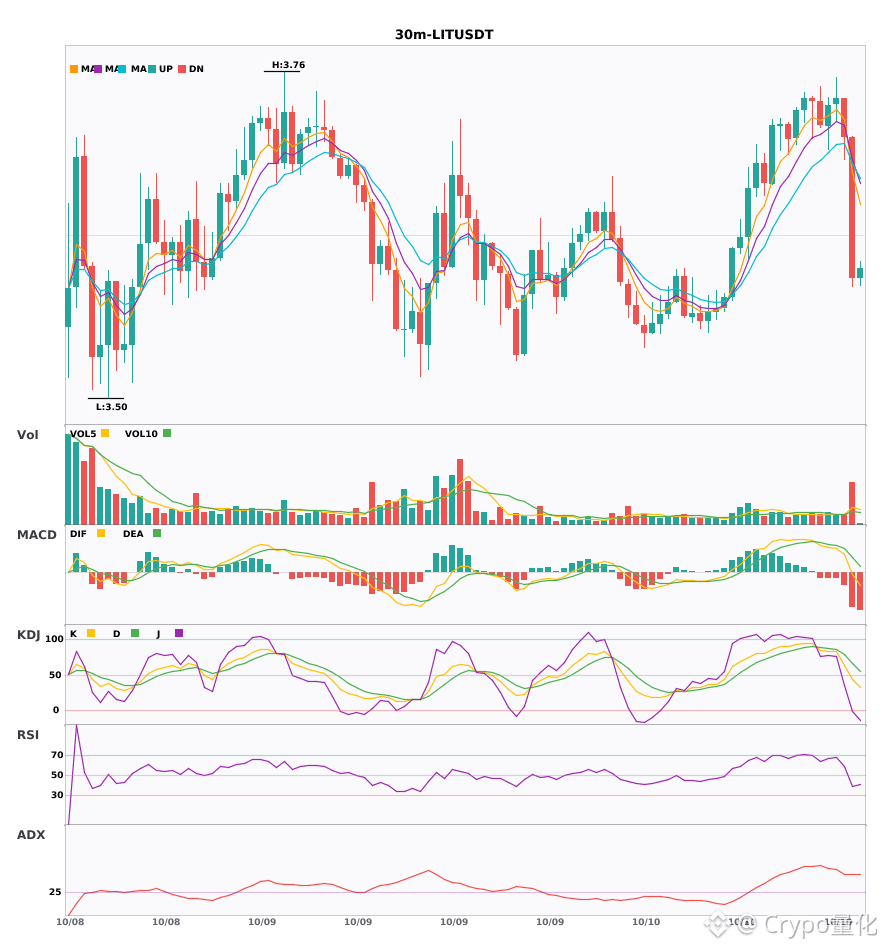
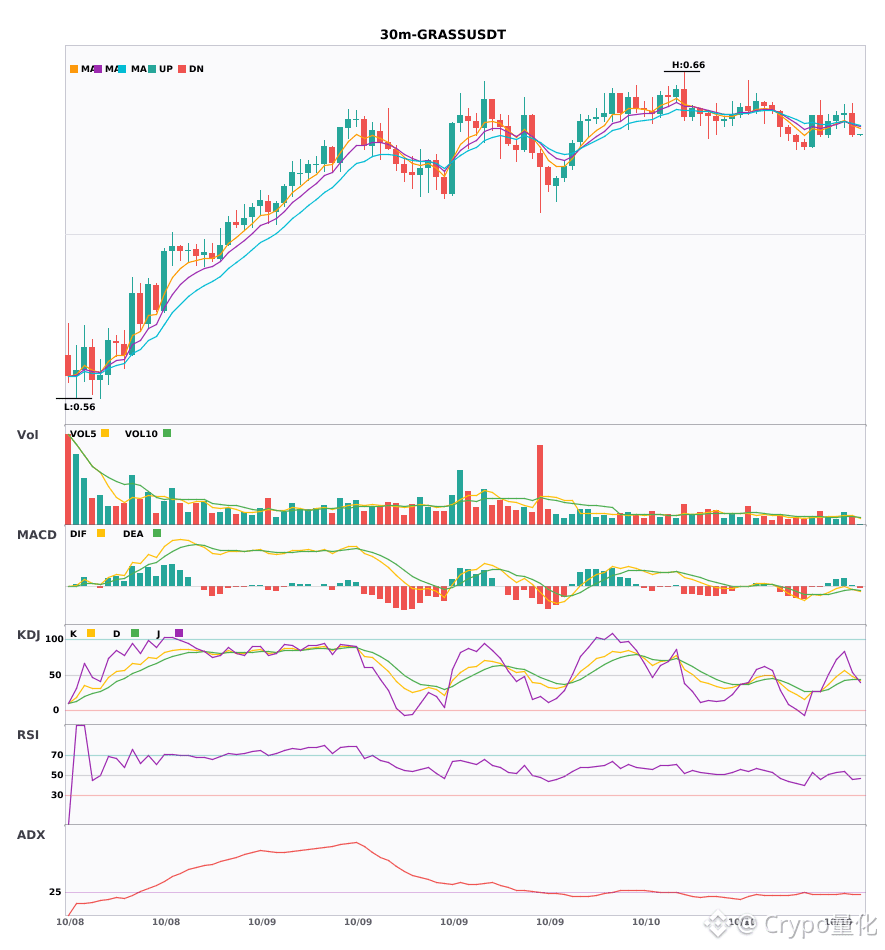
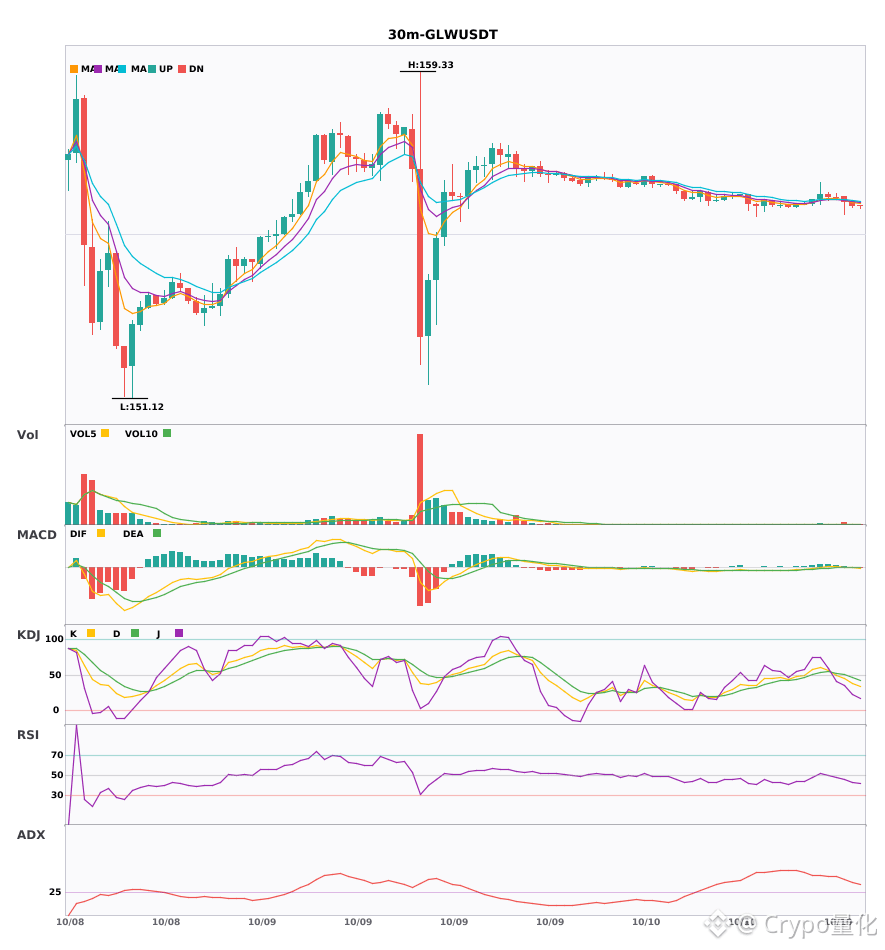
$LIT $GRASS $GLW 30-minute candlesticks are weakening in tandem; beware of pullback risk 🔥
════════════════════
🟢 $LIT 30-minute bearish signal
⚠️ Technical: ADX surged to 46, indicating an extremely strong trend, but beware of overheating; MACD DIF fell below zero and turned bearish; EMA5 crossed below EMA8, signaling short-term weakness; volume surged 3.1x.
════════════════════
🟢 $GRASS 30-minute bearish signal
⚠️ Technical: ADX confirms the trend is established and could be traded; MACD DIF crossed below zero and turned bearish; EMA5 crossed below EMA8; KDJ favors the bears; volume increased 1.6x.
════════════════════
🟢 $GLW 30-minute bearish signal
⚠️ Technical: ADX has reached 38, and the trend is now very clear. MACD formed a death cross below zero, with bearish momentum accelerating. The moving averages have just turned into a bearish alignment. KDJ is weak, favoring the bears. Trading volume increased 4.8x.
════════════════════
🔔 Follow for first-hand market alerts 🔔
#技术分析 #LIT #GRASS #GLW
📌 When trading, check whether the candlestick pattern matches.
════════════════════
🟢 $LIT 30-minute bearish signal
⚠️ Technical: ADX surged to 46, indicating an extremely strong trend, but beware of overheating; MACD DIF fell below zero and turned bearish; EMA5 crossed below EMA8, signaling short-term weakness; volume surged 3.1x.
════════════════════
🟢 $GRASS 30-minute bearish signal
⚠️ Technical: ADX confirms the trend is established and could be traded; MACD DIF crossed below zero and turned bearish; EMA5 crossed below EMA8; KDJ favors the bears; volume increased 1.6x.
════════════════════
🟢 $GLW 30-minute bearish signal
⚠️ Technical: ADX has reached 38, and the trend is now very clear. MACD formed a death cross below zero, with bearish momentum accelerating. The moving averages have just turned into a bearish alignment. KDJ is weak, favoring the bears. Trading volume increased 4.8x.
════════════════════
🔔 Follow for first-hand market alerts 🔔
#技术分析 #LIT #GRASS #GLW
📌 When trading, check whether the candlestick pattern matches.
22
·
--
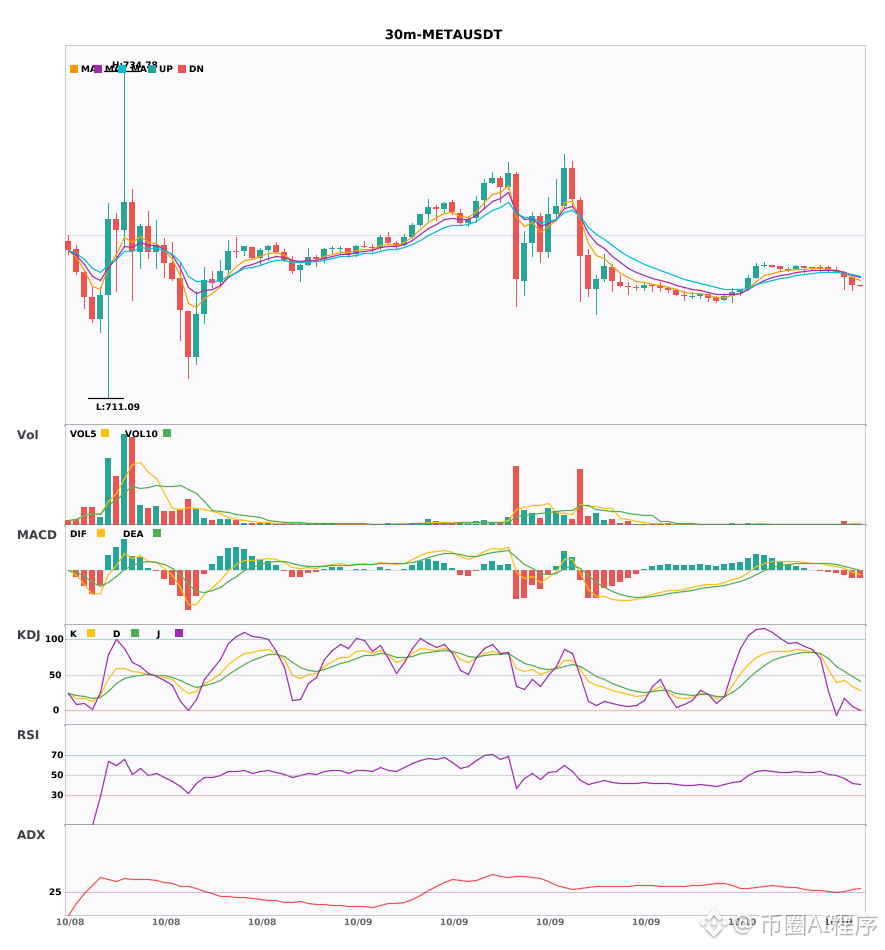
$META/$GLW/$DASH 30-minute and 4-hour charts are weakening in sync; bearish trend confirmed 🔥
════════════════════
🟢 $META 30-minute bearish signal
⚠️ Technical analysis: On the 30-minute chart, the MACD has formed a bearish crossover on rising volume and broken below the zero line. The moving averages are bearishly aligned and diverging downward, while the KDJ is showing weakness. The 4-hour chart confirms the bearish confluence; multiple timeframes point in the same direction, favoring shorts.
════════════════════
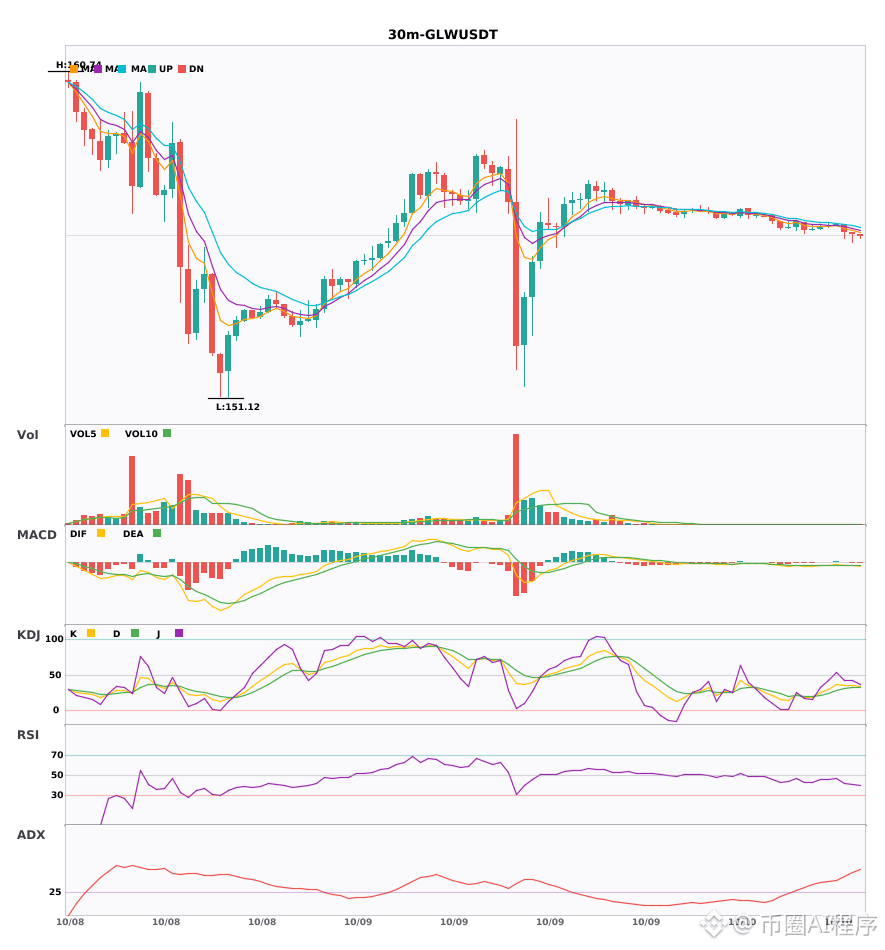
🟢 $GLW 30-minute bearish signal
⚠️ Technical analysis: 30-minute entry signal, confirmed by bearish confluence on the 4-hour chart. Following a bearish MACD crossover below zero, the green histogram bars continue to grow, indicating accelerating bearish momentum. The moving averages are bearishly aligned and diverging downward; the KDJ is weak, and volume is up 1.9x.
════════════════════
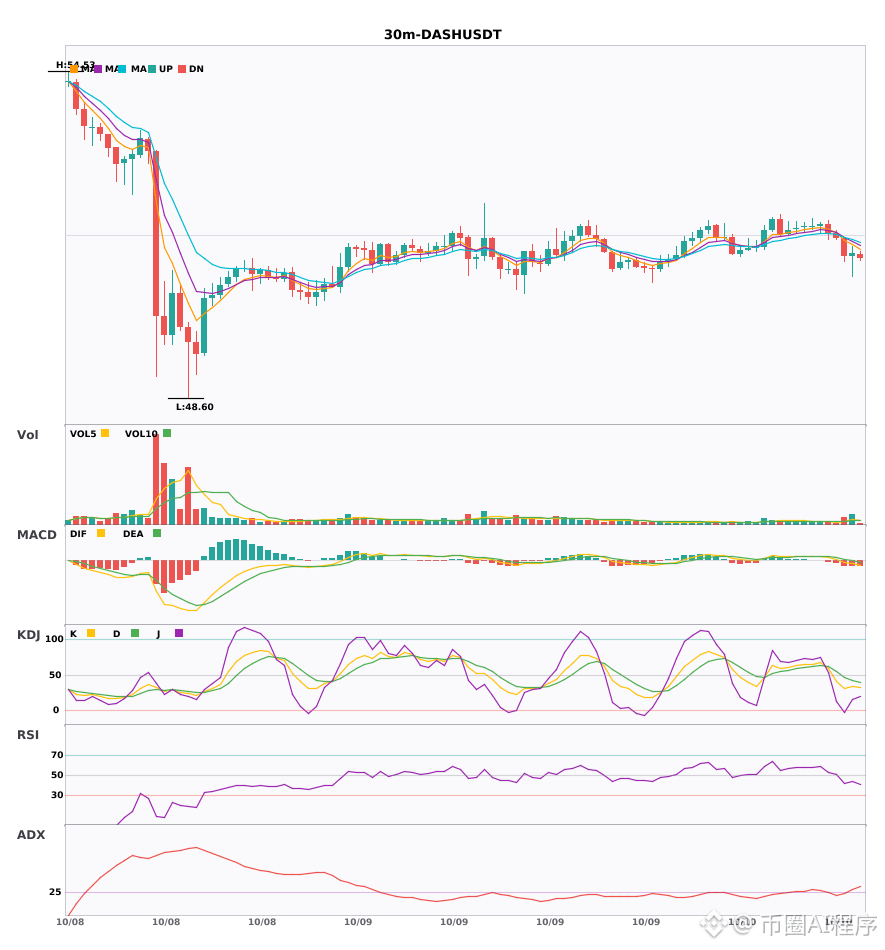
🟢 $DASH 30-minute bearish signal
⚠️ Technical analysis: Bearish confluence on the 30-minute and 4-hour charts! The MACD has broken below the zero line, with the green histogram bars growing. The moving averages are bearishly aligned and diverging downward. The K line has crossed below the D line on the KDJ and is not yet oversold. Volume is up 1.9x; bears are in control.
════════════════════
🔔 Follow for the latest market moves 🔔
#多周期共振 #META #GLW #DASH
📌 When trading, watch whether the candlestick patterns align
$META /$GLW /$DASH 30-minute and 4-hour charts are weakening in sync; bearish trend confirmed 🔥
════════════════════
🟢 $META 30-minute bearish signal
⚠️ Technical analysis: On the 30-minute chart, the MACD has formed a bearish crossover on rising volume and broken below the zero line. The moving averages are bearishly aligned and diverging downward, while the KDJ is showing weakness. The 4-hour chart confirms the bearish confluence; multiple timeframes point in the same direction, favoring shorts.
════════════════════
🟢 $GLW 30-minute bearish signal
⚠️ Technical analysis: 30-minute entry signal, confirmed by bearish confluence on the 4-hour chart. Following a bearish MACD crossover below zero, the green histogram bars continue to grow, indicating accelerating bearish momentum. The moving averages are bearishly aligned and diverging downward; the KDJ is weak, and volume is up 1.9x.
════════════════════
🟢 $DASH 30-minute bearish signal
⚠️ Technical analysis: Bearish confluence on the 30-minute and 4-hour charts! The MACD has broken below the zero line, with the green histogram bars growing. The moving averages are bearishly aligned and diverging downward. The K line has crossed below the D line on the KDJ and is not yet oversold. Volume is up 1.9x; bears are in control.
════════════════════
🔔 Follow for the latest market moves 🔔
#多周期共振 #META #GLW #DASH
📌 When trading, watch whether the candlestick patterns align
════════════════════
🟢 $META 30-minute bearish signal
⚠️ Technical analysis: On the 30-minute chart, the MACD has formed a bearish crossover on rising volume and broken below the zero line. The moving averages are bearishly aligned and diverging downward, while the KDJ is showing weakness. The 4-hour chart confirms the bearish confluence; multiple timeframes point in the same direction, favoring shorts.
════════════════════
🟢 $GLW 30-minute bearish signal
⚠️ Technical analysis: 30-minute entry signal, confirmed by bearish confluence on the 4-hour chart. Following a bearish MACD crossover below zero, the green histogram bars continue to grow, indicating accelerating bearish momentum. The moving averages are bearishly aligned and diverging downward; the KDJ is weak, and volume is up 1.9x.
════════════════════
🟢 $DASH 30-minute bearish signal
⚠️ Technical analysis: Bearish confluence on the 30-minute and 4-hour charts! The MACD has broken below the zero line, with the green histogram bars growing. The moving averages are bearishly aligned and diverging downward. The K line has crossed below the D line on the KDJ and is not yet oversold. Volume is up 1.9x; bears are in control.
════════════════════
🔔 Follow for the latest market moves 🔔
#多周期共振 #META #GLW #DASH
📌 When trading, watch whether the candlestick patterns align
16
·
--
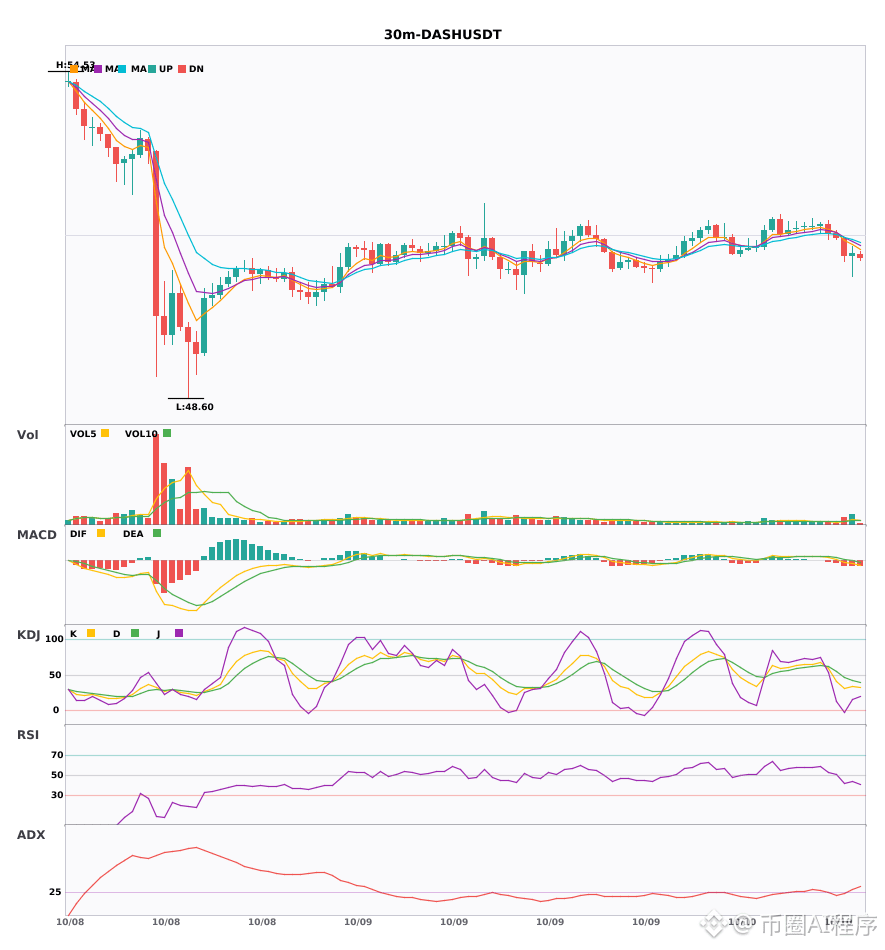
$META $GLW $DASH 30-minute weakness; 4-hour bearish trend confirmed 🔥
════════════════════
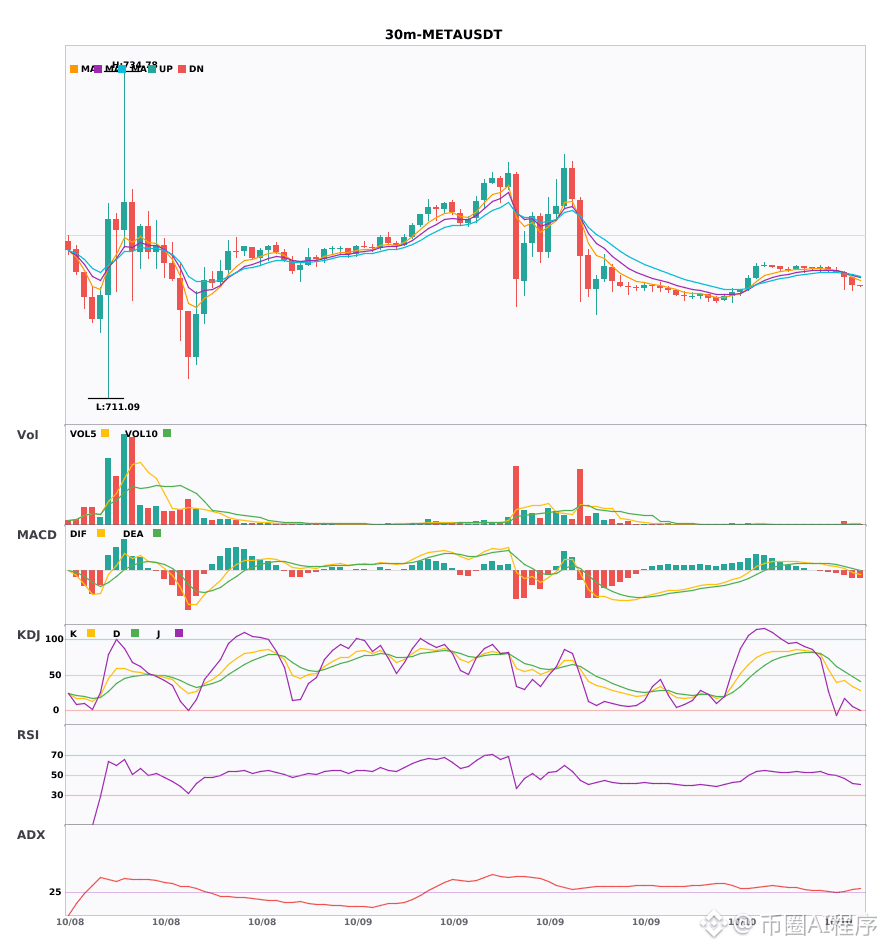
🟢 $META 30-minute bearish signal
⚠️Technical analysis: The 4-hour and 30-minute bearish trends are confirmed in confluence! The 30-minute MACD DIF has fallen below the zero line, turning bearish. The moving averages are bearishly aligned and trending downward. KDJ’s K line has crossed below D but is not yet oversold. Volume has increased 4.9 times, with bears in control.
════════════════════
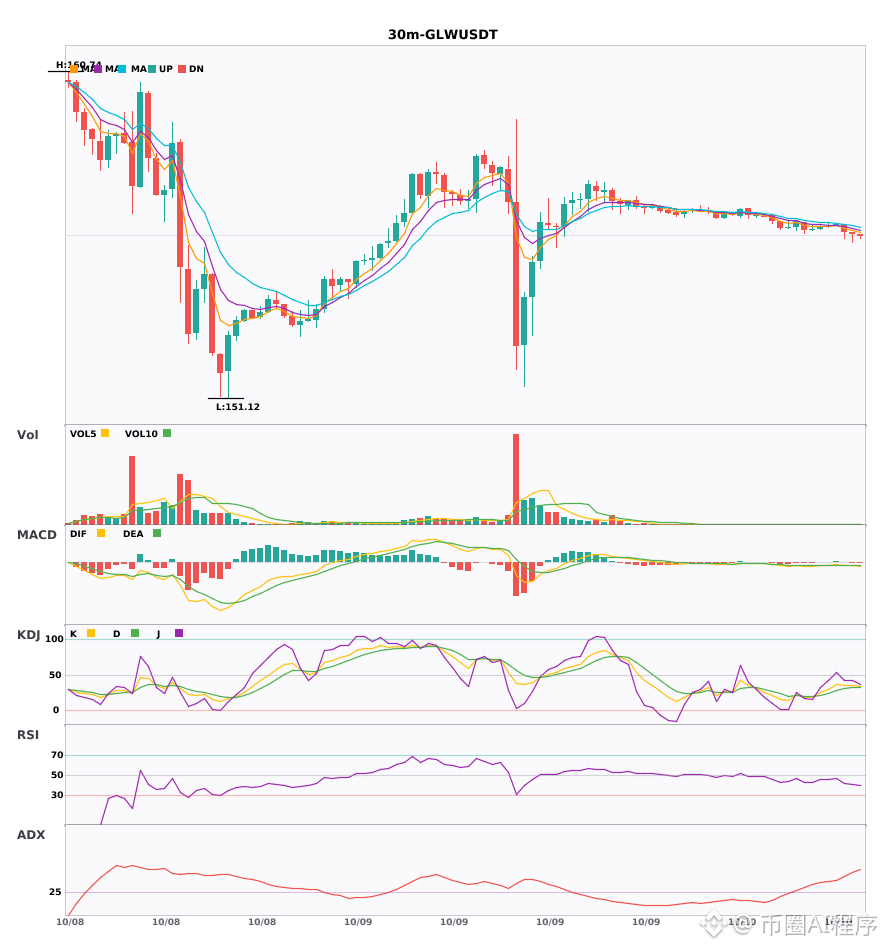
🟢 $GLW 30-minute bearish signal
⚠️Technical analysis: A 15-minute bearish entry is confirmed in confluence with the 4-hour bearish trend. The MACD death cross below zero continues to widen the green bars. The moving averages have just formed a bearish alignment and are fanning downward. KDJ remains weak but is not oversold. Volume has increased 1.9 times.
════════════════════
🟢 $DASH 30-minute bearish signal
⚠️Technical analysis: The 4-hour and 30-minute bearish trends are confirmed in confluence! The MACD death cross continues to widen the green bars, and DIF has fallen below the zero line. The moving averages are bearishly aligned and spreading downward. KDJ is weak, with K crossing below D, giving bears the advantage. Volume has increased 1.9 times.
════════════════════
🔔 Follow for first-hand updates on unusual market movements 🔔
#多周期共振 #META #GLW #DASH
📌 When trading, watch whether the candlestick patterns align.
════════════════════
🟢 $META 30-minute bearish signal
⚠️Technical analysis: The 4-hour and 30-minute bearish trends are confirmed in confluence! The 30-minute MACD DIF has fallen below the zero line, turning bearish. The moving averages are bearishly aligned and trending downward. KDJ’s K line has crossed below D but is not yet oversold. Volume has increased 4.9 times, with bears in control.
════════════════════
🟢 $GLW 30-minute bearish signal
⚠️Technical analysis: A 15-minute bearish entry is confirmed in confluence with the 4-hour bearish trend. The MACD death cross below zero continues to widen the green bars. The moving averages have just formed a bearish alignment and are fanning downward. KDJ remains weak but is not oversold. Volume has increased 1.9 times.
════════════════════
🟢 $DASH 30-minute bearish signal
⚠️Technical analysis: The 4-hour and 30-minute bearish trends are confirmed in confluence! The MACD death cross continues to widen the green bars, and DIF has fallen below the zero line. The moving averages are bearishly aligned and spreading downward. KDJ is weak, with K crossing below D, giving bears the advantage. Volume has increased 1.9 times.
════════════════════
🔔 Follow for first-hand updates on unusual market movements 🔔
#多周期共振 #META #GLW #DASH
📌 When trading, watch whether the candlestick patterns align.
17
·
--
Three oversold signals, collectively breaking through the 4-hour level.
$GLW 4-hour RSI 10.1. Current price 151.6. 24h down 7.4%.
$NBIS 4-hour RSI 12.5. Current price 219. 24h down 7.3%.
$BE 4-hour RSI 12.9. Current price 269. 24h down 7%.
---
$GLW 4-hour RSI 10.1. Extremely oversold. Current price 151.6. 24h down 7.4%.
Support 148, 145. Resistance 158, 165.
Fee rate 0%. The shorts aren’t charging, and the longs aren’t catching the knife.
Current price 151.6. Bias: bullish. Entry range 148–152, stop loss 143, target 158, reward-to-risk about 2:1. RSI 10.1 on the 4-hour timeframe is at an extreme oversold level; the near-term selling pressure has likely been released for the most part.
$NBIS 4-hour RSI 12.5. Extremely oversold. Current price 219. 24h down 7.3%.
Support 210, 200. Resistance 230, 240.
Fee rate 0%. Market is in a wait-and-see mood.
Current price 219. Bias: bullish. Entry range 210–219, stop loss 198, target 232, reward-to-risk about 2:1. RSI 12.5 aligned with the 4-hour timeframe suggests there’s still decent room for a rebound.
$BE 4-hour RSI 12.9. Extremely oversold. Current price 269. 24h down 7%.
Support 260, 250. Resistance 280, 293.
Fee rate 0%. Neither bulls nor bears have added positions.
Current price 269. Bias: bullish. Entry range 260–269, stop loss 248, target 282, reward-to-risk about 2:1. RSI 12.9 is also extreme oversold on the 4-hour timeframe, and the logic matches the first two.
---
All three coins are oversold on the 4-hour timeframe, with the direction consistently leaning bullish. But the fact that all fees are zero indicates the market has low confidence, so the rebound strength may be limited. Don’t bet everything on a single trade—keep positions diversified.
I’m watching.
If you need a custom strategy, you can look for Nini.
#GLW #NBIS #BE #超卖反弹 #RSI signal
4

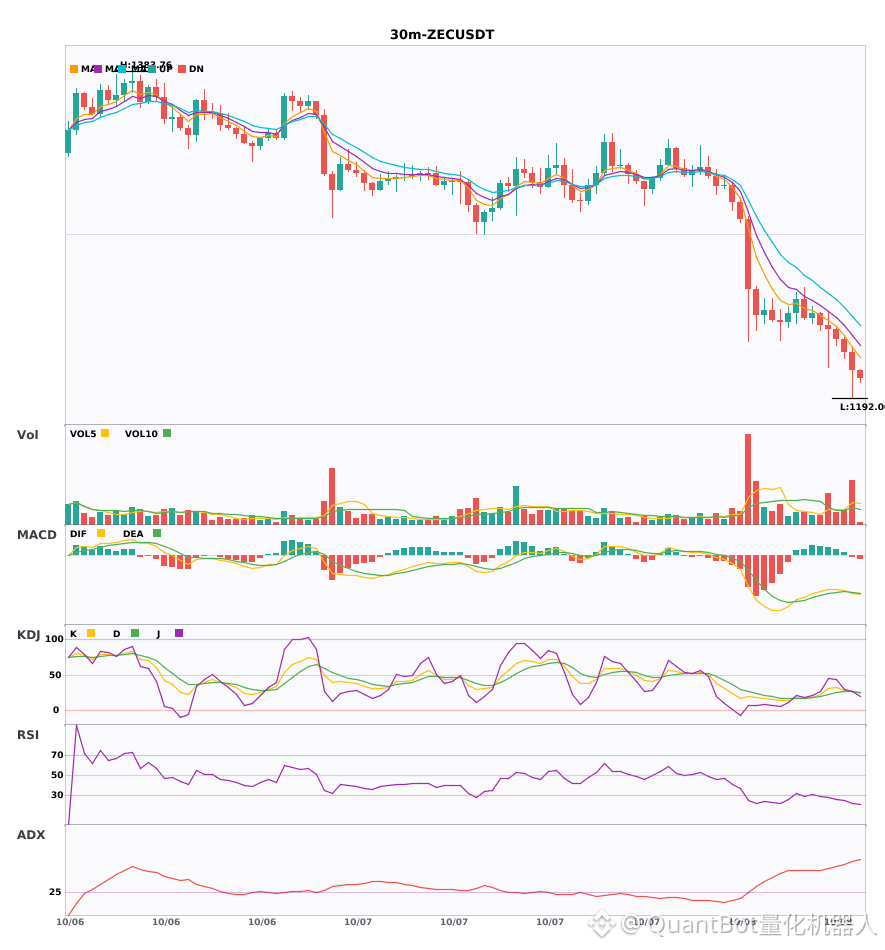
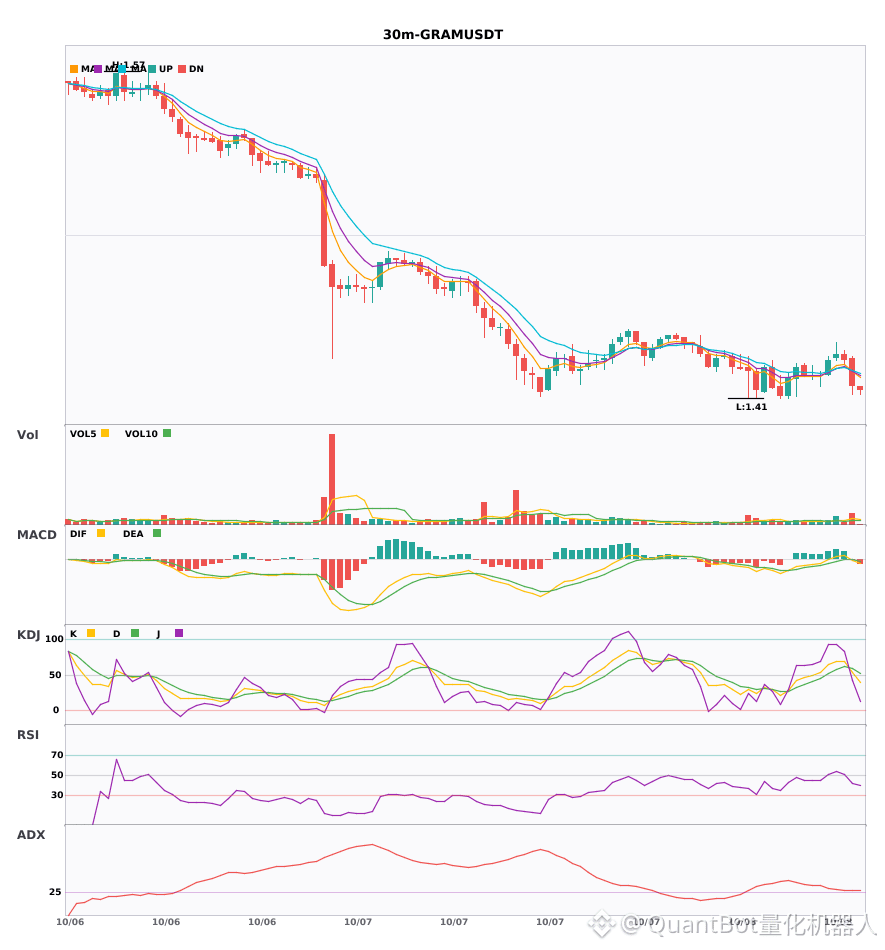
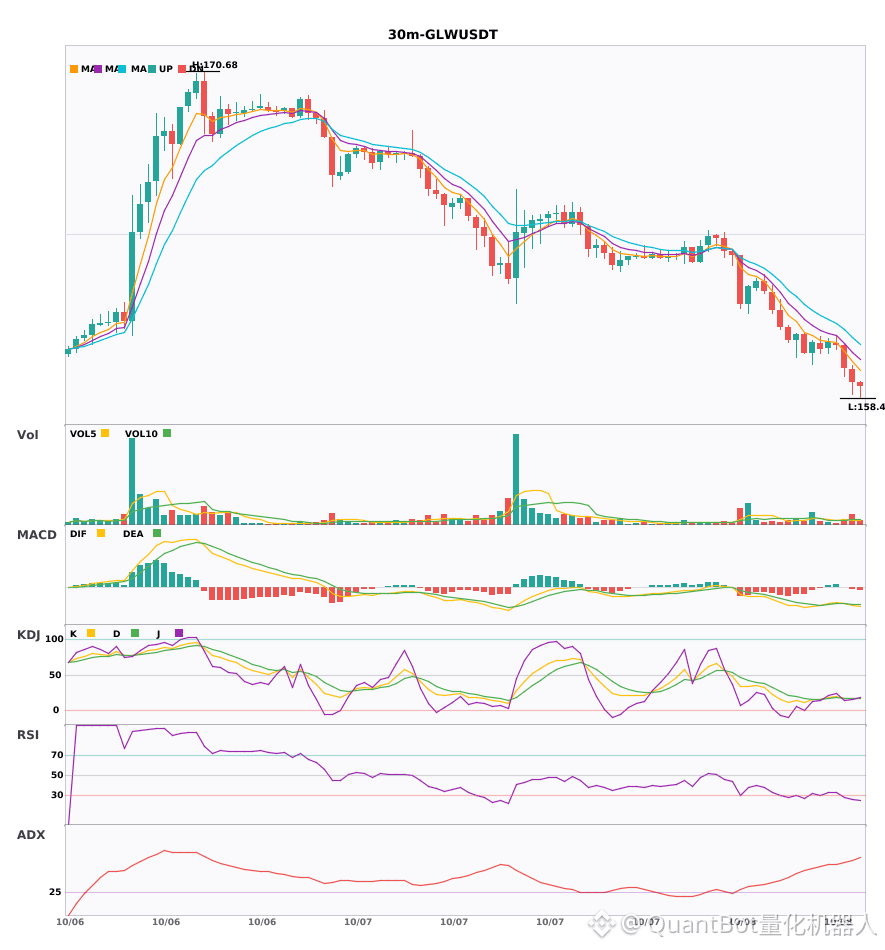
$ZEC, $GRAM, $GLW: 30-minute bearish alert
📉 $ZEC | 30-minute bearish signal
━━━━━━━━━━━━━━━━━━
Technical analysis: ADX (62) indicates a strong trend; beware of an overbought pullback. MACD bearish cross below zero, with bearish momentum accelerating. EMA5/8/13 in bearish alignment. KDJ is weak (K26.9/D26.7). Trading volume up 2.5x.
Price change: -0.9000%
📉 $GRAM | 30-minute bearish signal
━━━━━━━━━━━━━━━━━━
Technical analysis: ADX (28) indicates an established trend that may be traded. MACD bearish cross below zero. EMA5 crossed below EMA8. KDJ bearish cross (53.1/58.6). Volume up 2.5x.
Price change: -0.8400%
📉 $GLW | 30-minute bearish signal
━━━━━━━━━━━━━━━━━━
Technical analysis: ADX (65) indicates an extremely strong trend; beware of a pullback. MACD bearish cross below the zero line, with bearish momentum accelerating. EMA5/8/13 in bearish alignment. KDJ is oversold (K16.8, D17.3); watch for a rebound. Trading volume up 2x.
Price change: -0.3300%
━━━━━━━━━━━━━━━━━━
#技术分析 #ZEC #GRAM #GLW
📌 The above content is for reference only and does not constitute investment advice
$ZEC , $GRAM , $GLW : 30-minute bearish alert
📉 $ZEC | 30-minute bearish signal
━━━━━━━━━━━━━━━━━━
Technical analysis: ADX (62) indicates a strong trend; beware of an overbought pullback. MACD bearish cross below zero, with bearish momentum accelerating. EMA5/8/13 in bearish alignment. KDJ is weak (K26.9/D26.7). Trading volume up 2.5x.
Price change: -0.9000%
📉 $GRAM | 30-minute bearish signal
━━━━━━━━━━━━━━━━━━
Technical analysis: ADX (28) indicates an established trend that may be traded. MACD bearish cross below zero. EMA5 crossed below EMA8. KDJ bearish cross (53.1/58.6). Volume up 2.5x.
Price change: -0.8400%
📉 $GLW | 30-minute bearish signal
━━━━━━━━━━━━━━━━━━
Technical analysis: ADX (65) indicates an extremely strong trend; beware of a pullback. MACD bearish cross below the zero line, with bearish momentum accelerating. EMA5/8/13 in bearish alignment. KDJ is oversold (K16.8, D17.3); watch for a rebound. Trading volume up 2x.
Price change: -0.3300%
━━━━━━━━━━━━━━━━━━
#技术分析 #ZEC #GRAM #GLW
📌 The above content is for reference only and does not constitute investment advice
196
Log in to explore more content
Join global crypto users on Binance Square
⚡️ Get latest and useful information about crypto.
💬 Trusted by the world’s largest crypto exchange.
👍 Discover real insights from verified creators.
Email / Phone number
Trending Topics
1
#FedWatch
16.3M views
39,174 Discussing
2
#EarningsSeason
6.4M views
31,894 Discussing
3
#USMidtermElections
24,218 views
516 Discussing
4
#BitcoinDropsBelow$80K
18,386 views
83 Discussing
5
#BoEOpensConsultationOnTokenizedCollateralForClearing
219 views
16 Discussing
6
#BrazilCryptoExchangesMustApplyForLicensesByFriday
18,268 views
442 Discussing
7
#ICEPartnersWithTradeXYZToBringPerpetualContractsToUS
650 views
14 Discussing
8
#SolidusLabsReportsSuspected$170MSpoofingOnHyperliquidOilContracts
1,407 views
24 Discussing
9
#StanDruckenmillerBecomesInvestorInTradeXYZ
14,929 views
401 Discussing
10
#RussiaProposedNonCustodialWalletLimitsExcludeIntlSettlements
1,751 views
38 Discussing