
CryptoChan
1.8k Posts

CryptoChan
 Square Verified
Bitcoin on-chain & cycle analysis,比特币链上行情分析 || 不收费,无投资理财建议 || X:@0xCryptoChan

Excellence Award (OnChain)

原创之星

Level 1 Creator
15 Following
22.2K+ Followers
41.8K+ Liked
3 Badges
Posts
All
Quotes
PINNED
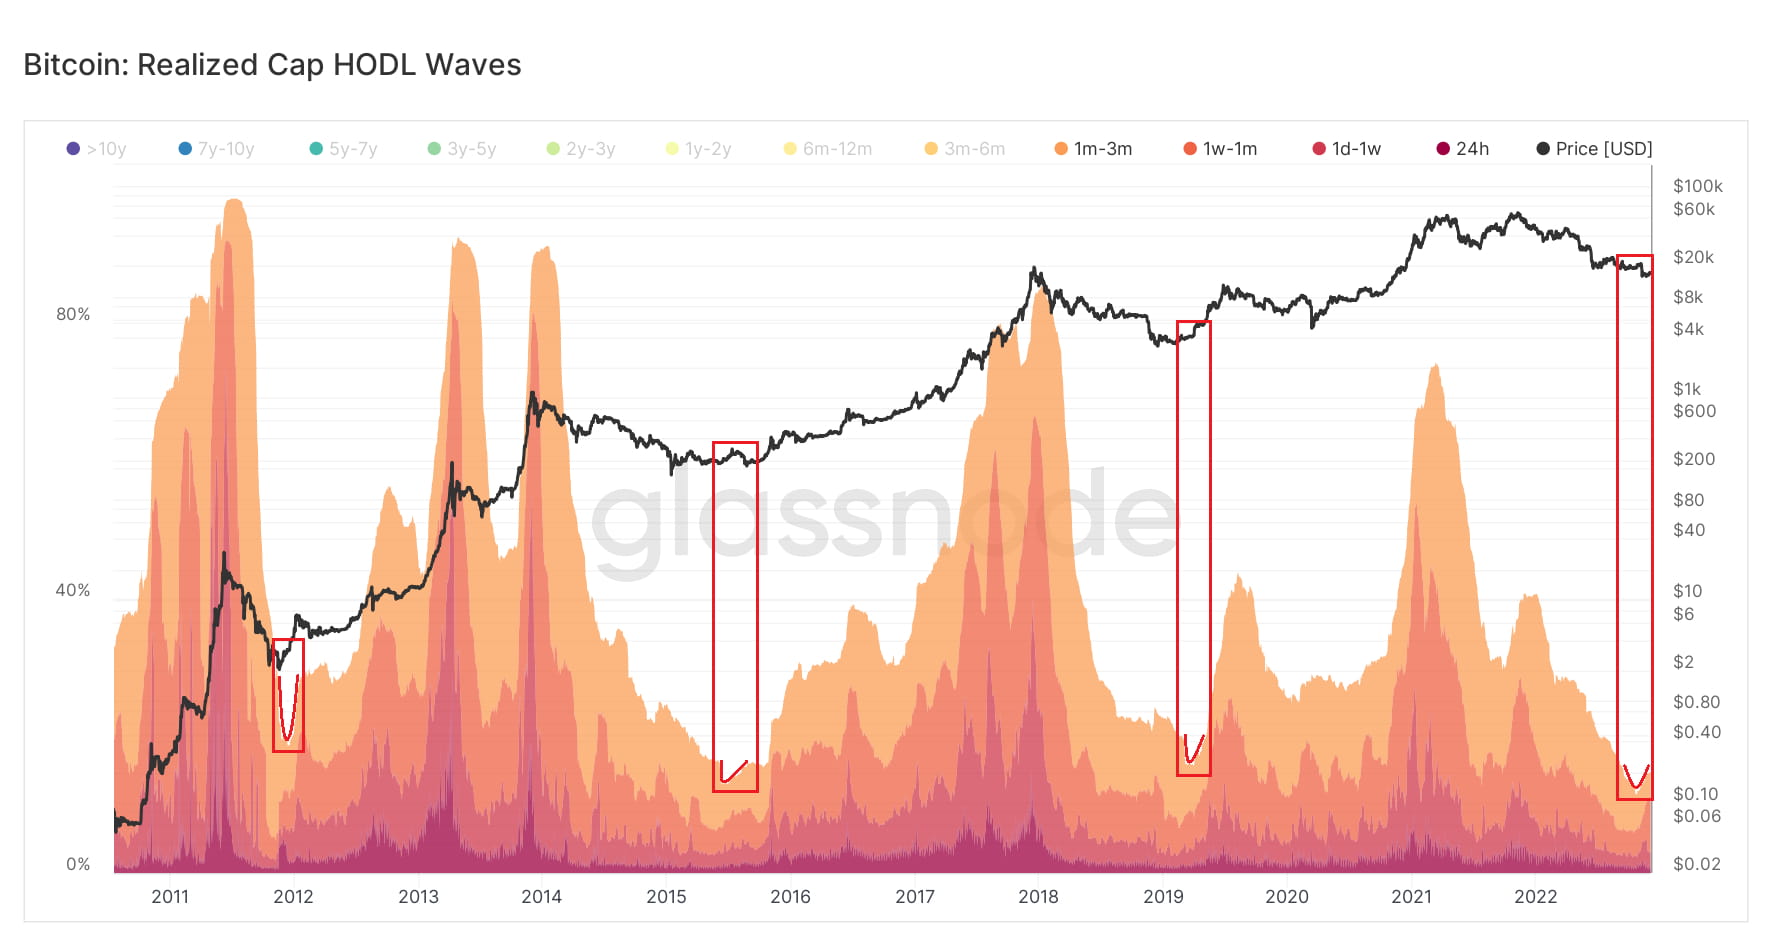
The indicator in the figure is the percentage of the number of Bitcoins that have been on the chain for less than 3 months after the weighted market capitalization of Bitcoin to the total over-the-counter circulation of Bitcoin.
This wave is stable
This wave is stable
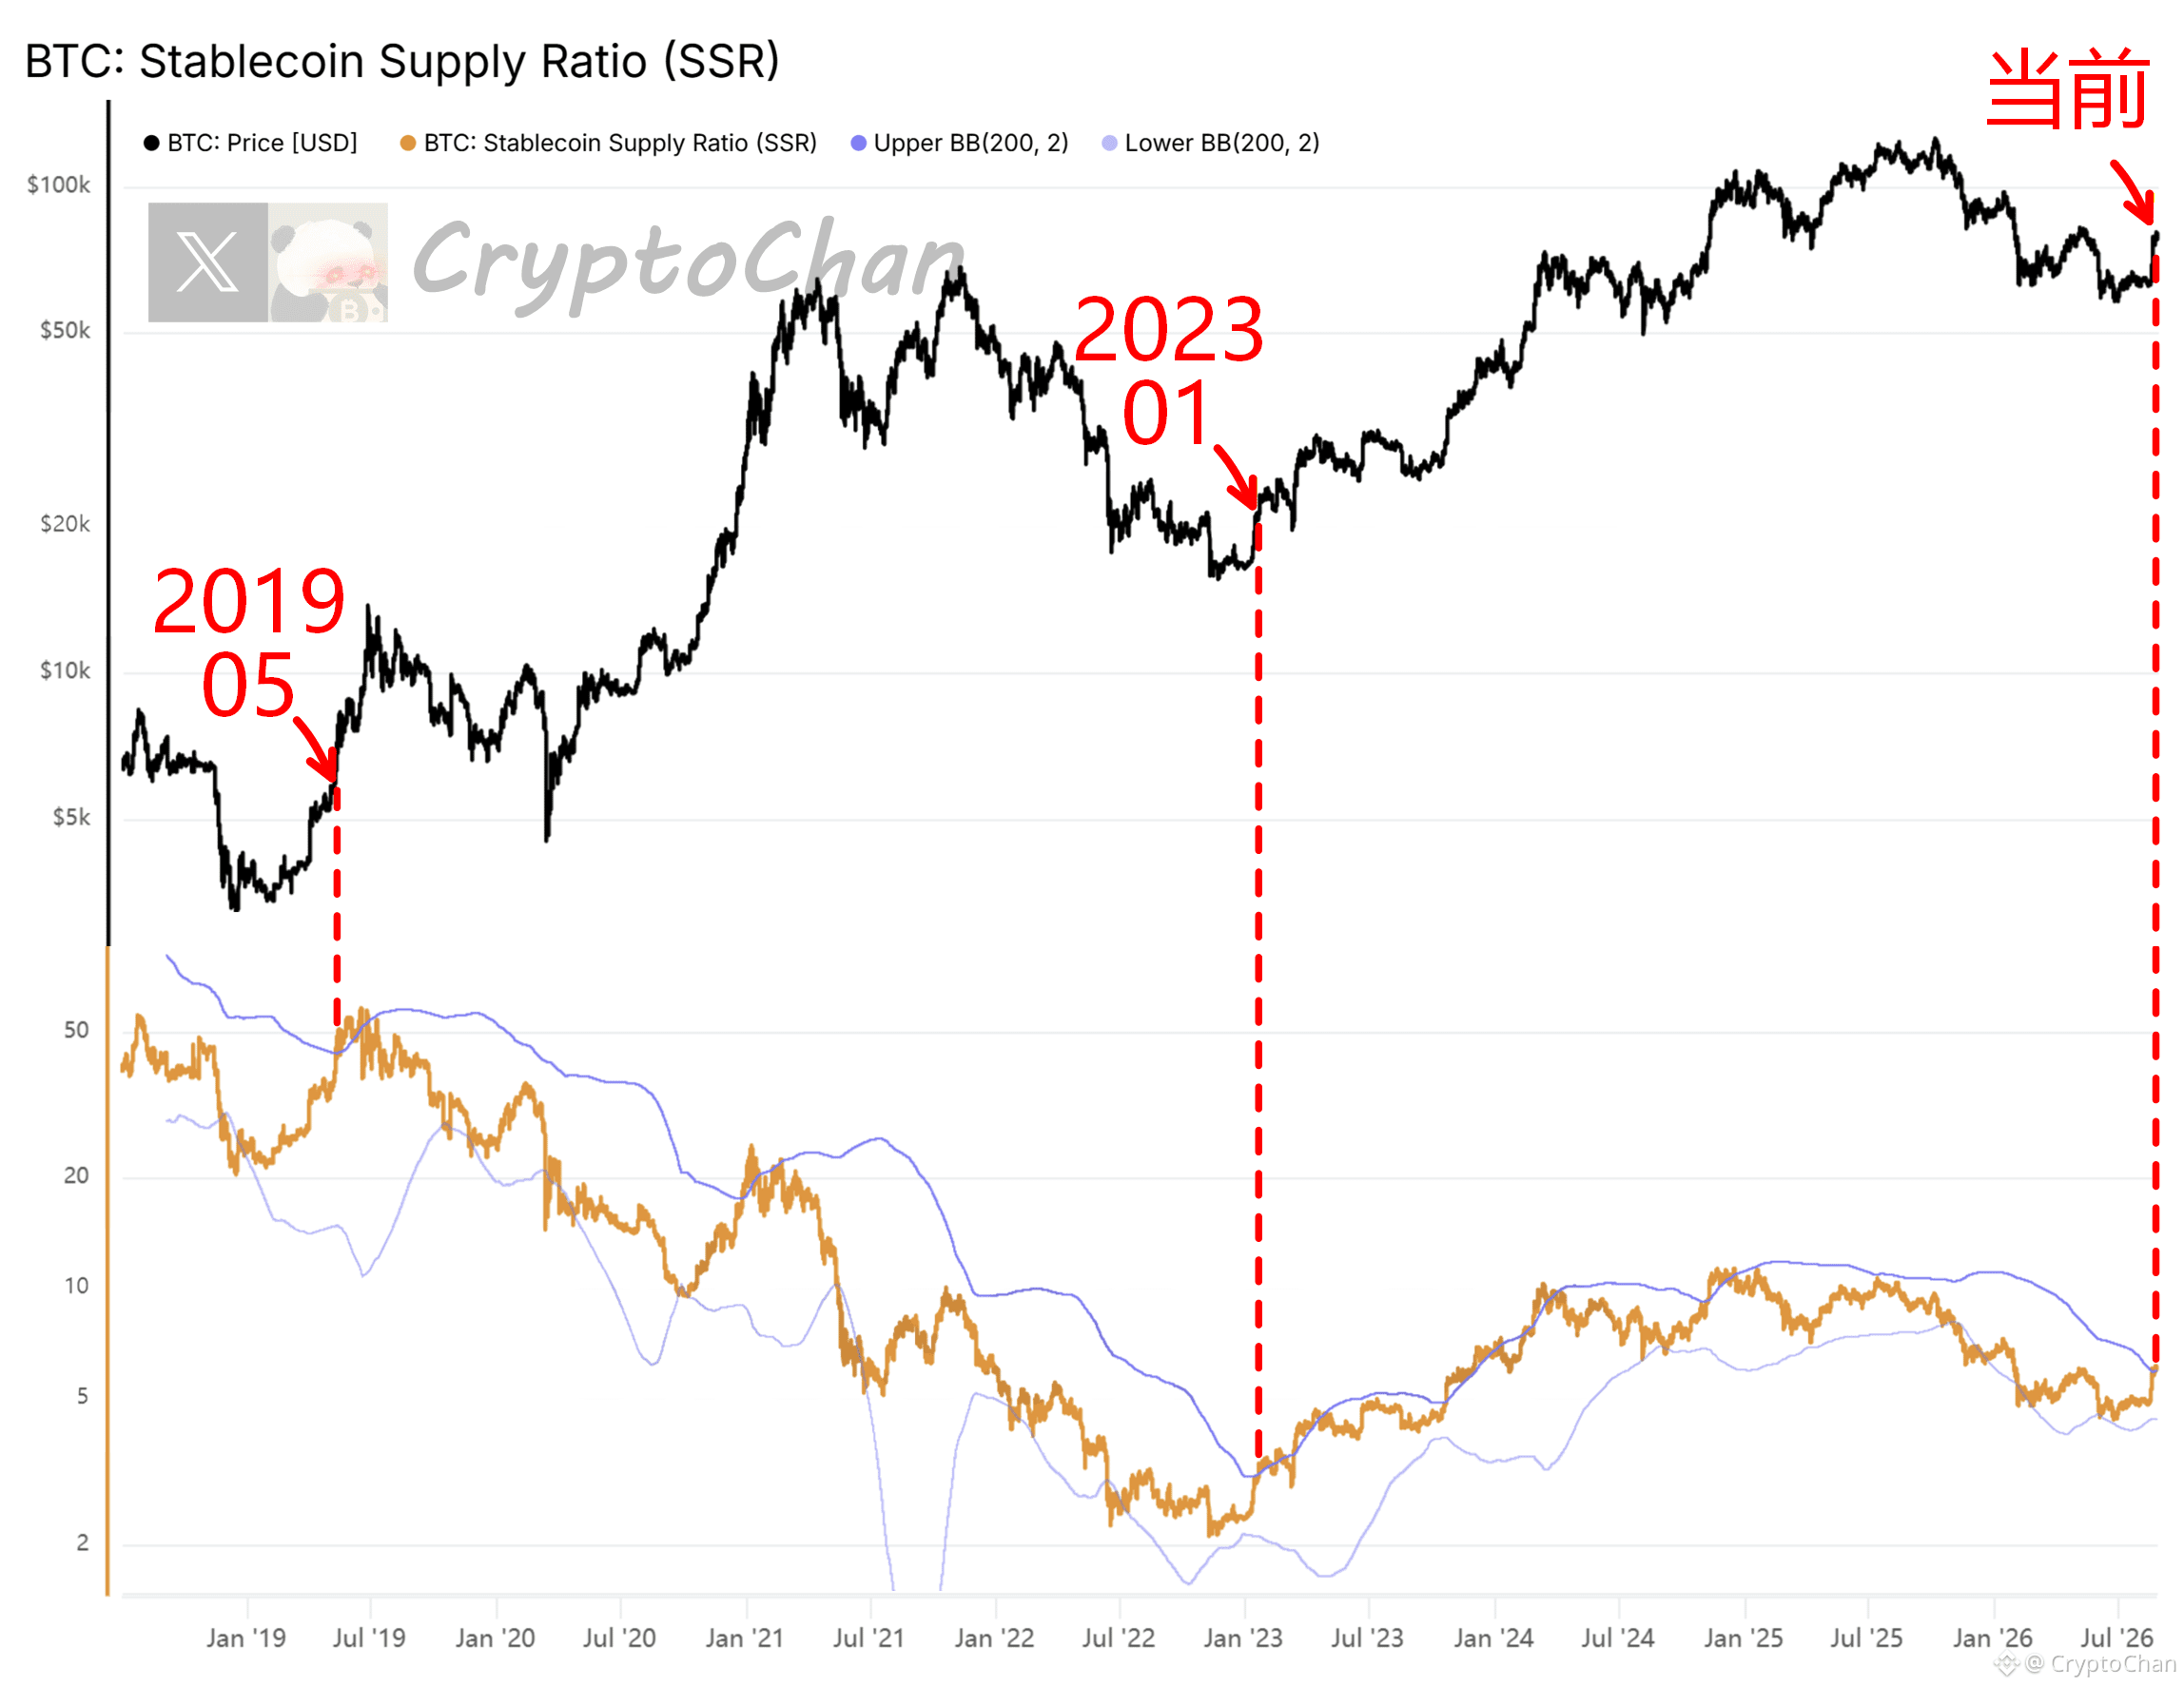
【 $BTC 4-Year Cycle Total Mark Series 53】
The current orange line has broken above the upper band. 🗡️ Below: May 2019 & January 2023
┌── 🐼 On-Chain Data Details ──┐
The orange line indicator at the bottom of the chart is SSR (Stablecoin Supply Ratio). The calculation formula is: Bitcoin total market cap ➗ total stablecoin market cap
SSR upper band = 200-day moving average + 2× standard deviation. Breaking above the upper band indicates SSR is in an extremely high range.
SSR lower band = 200-day moving average − 2× standard deviation. Dropping below the lower band indicates SSR is in an extremely low range.
The current orange line has broken above the upper band. 🗡️ Below: May 2019 & January 2023
┌── 🐼 On-Chain Data Details ──┐
The orange line indicator at the bottom of the chart is SSR (Stablecoin Supply Ratio). The calculation formula is: Bitcoin total market cap ➗ total stablecoin market cap
SSR upper band = 200-day moving average + 2× standard deviation. Breaking above the upper band indicates SSR is in an extremely high range.
SSR lower band = 200-day moving average − 2× standard deviation. Dropping below the lower band indicates SSR is in an extremely low range.
CryptoChan
·
--
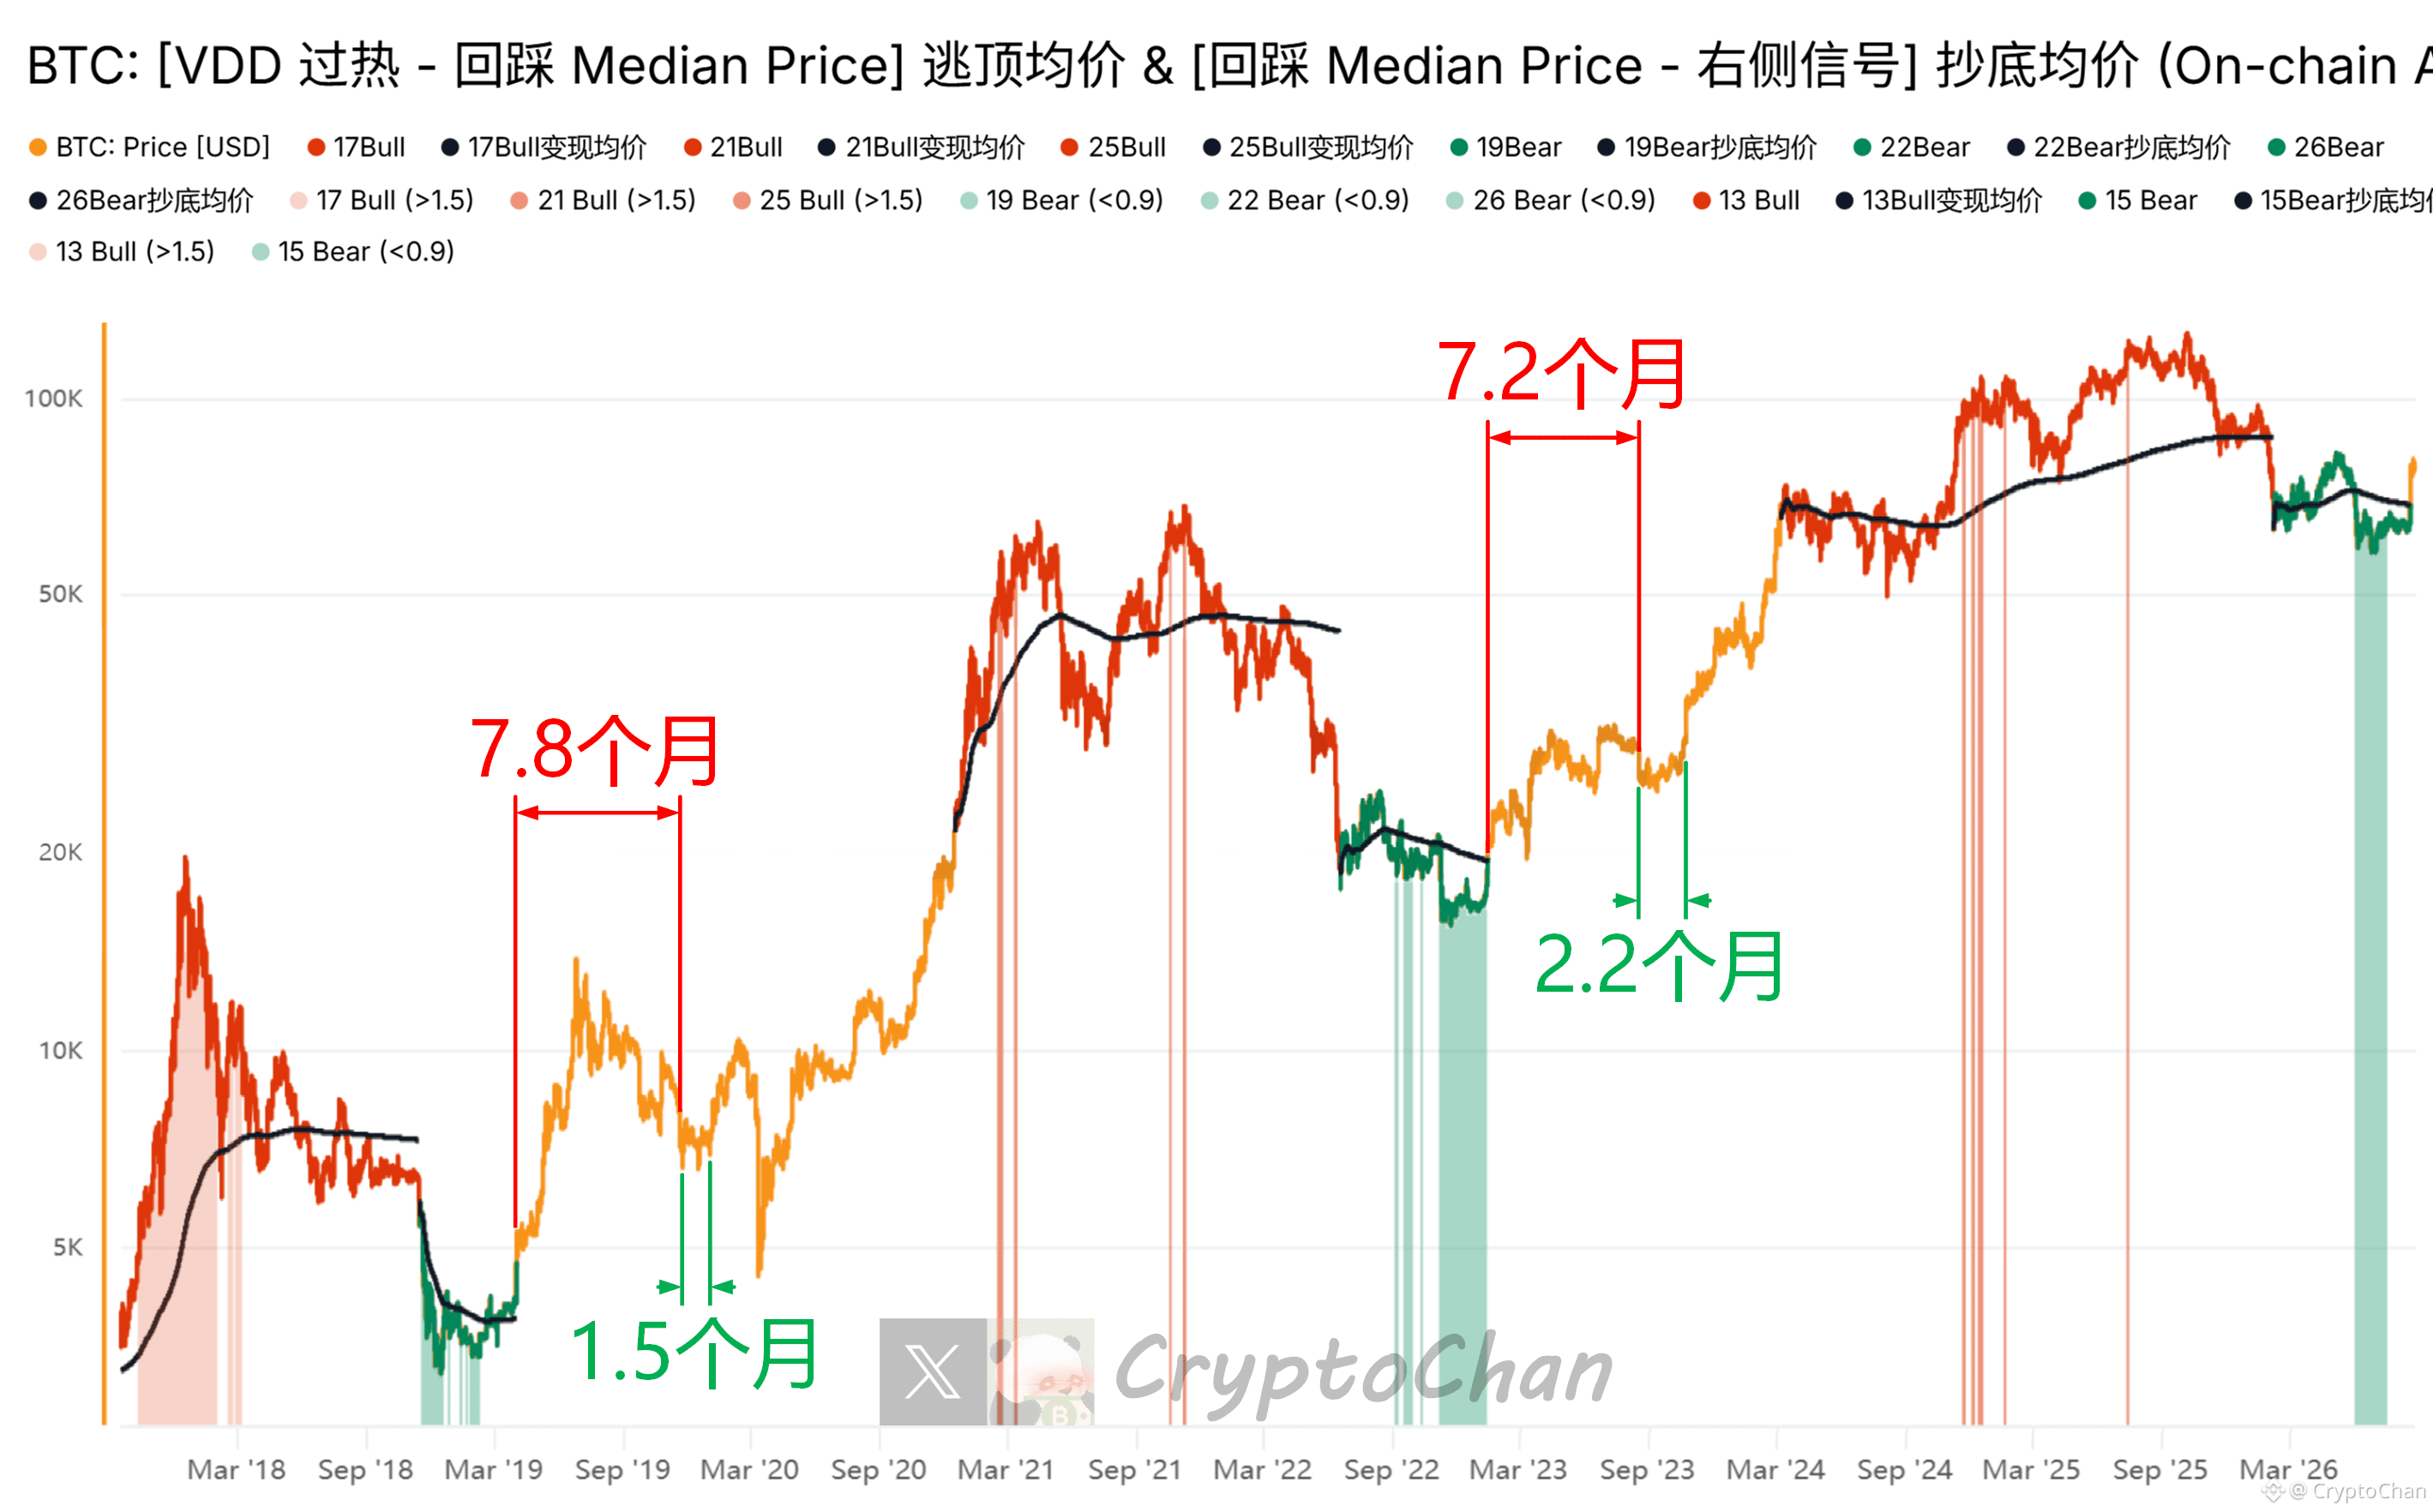
【 $BTC Four-Year Cycle Total Slice Series 52】
After breaking away from the bear base in 2019, 7.8 months later: the bull market recovery phase comes to a close. The market entered the last pullback-and-base range before the main upmove, creating an excellent 1.5-month trading window (ignore the 312 Black Swan)
After breaking away from the bear base in 2023, 7.2 months later: the bull market recovery phase comes to a close. The market entered the last pullback-and-base range before the main upmove, creating an excellent 2.2-month trading window
This round has already been 0.25 months since breaking away from the bear base
┌── 🐼 Indicator Details ──┐
The indicators shown in the chart are developed based on a bull-market top-escape & bear-market bottom-catch model built from Bitcoin VDD, Median Price, and multiple sets of confirmed indicators on the right side of bear bases
After breaking away from the bear base in 2019, 7.8 months later: the bull market recovery phase comes to a close. The market entered the last pullback-and-base range before the main upmove, creating an excellent 1.5-month trading window (ignore the 312 Black Swan)
After breaking away from the bear base in 2023, 7.2 months later: the bull market recovery phase comes to a close. The market entered the last pullback-and-base range before the main upmove, creating an excellent 2.2-month trading window
This round has already been 0.25 months since breaking away from the bear base
┌── 🐼 Indicator Details ──┐
The indicators shown in the chart are developed based on a bull-market top-escape & bear-market bottom-catch model built from Bitcoin VDD, Median Price, and multiple sets of confirmed indicators on the right side of bear bases
【 $BTC Four-Year Cycle Total Slice Series 52】
After breaking away from the bear base in 2019, 7.8 months later: the bull market recovery phase comes to a close. The market entered the last pullback-and-base range before the main upmove, creating an excellent 1.5-month trading window (ignore the 312 Black Swan)
After breaking away from the bear base in 2023, 7.2 months later: the bull market recovery phase comes to a close. The market entered the last pullback-and-base range before the main upmove, creating an excellent 2.2-month trading window
This round has already been 0.25 months since breaking away from the bear base
┌── 🐼 Indicator Details ──┐
The indicators shown in the chart are developed based on a bull-market top-escape & bear-market bottom-catch model built from Bitcoin VDD, Median Price, and multiple sets of confirmed indicators on the right side of bear bases
After breaking away from the bear base in 2019, 7.8 months later: the bull market recovery phase comes to a close. The market entered the last pullback-and-base range before the main upmove, creating an excellent 1.5-month trading window (ignore the 312 Black Swan)
After breaking away from the bear base in 2023, 7.2 months later: the bull market recovery phase comes to a close. The market entered the last pullback-and-base range before the main upmove, creating an excellent 2.2-month trading window
This round has already been 0.25 months since breaking away from the bear base
┌── 🐼 Indicator Details ──┐
The indicators shown in the chart are developed based on a bull-market top-escape & bear-market bottom-catch model built from Bitcoin VDD, Median Price, and multiple sets of confirmed indicators on the right side of bear bases
CryptoChan
·
--
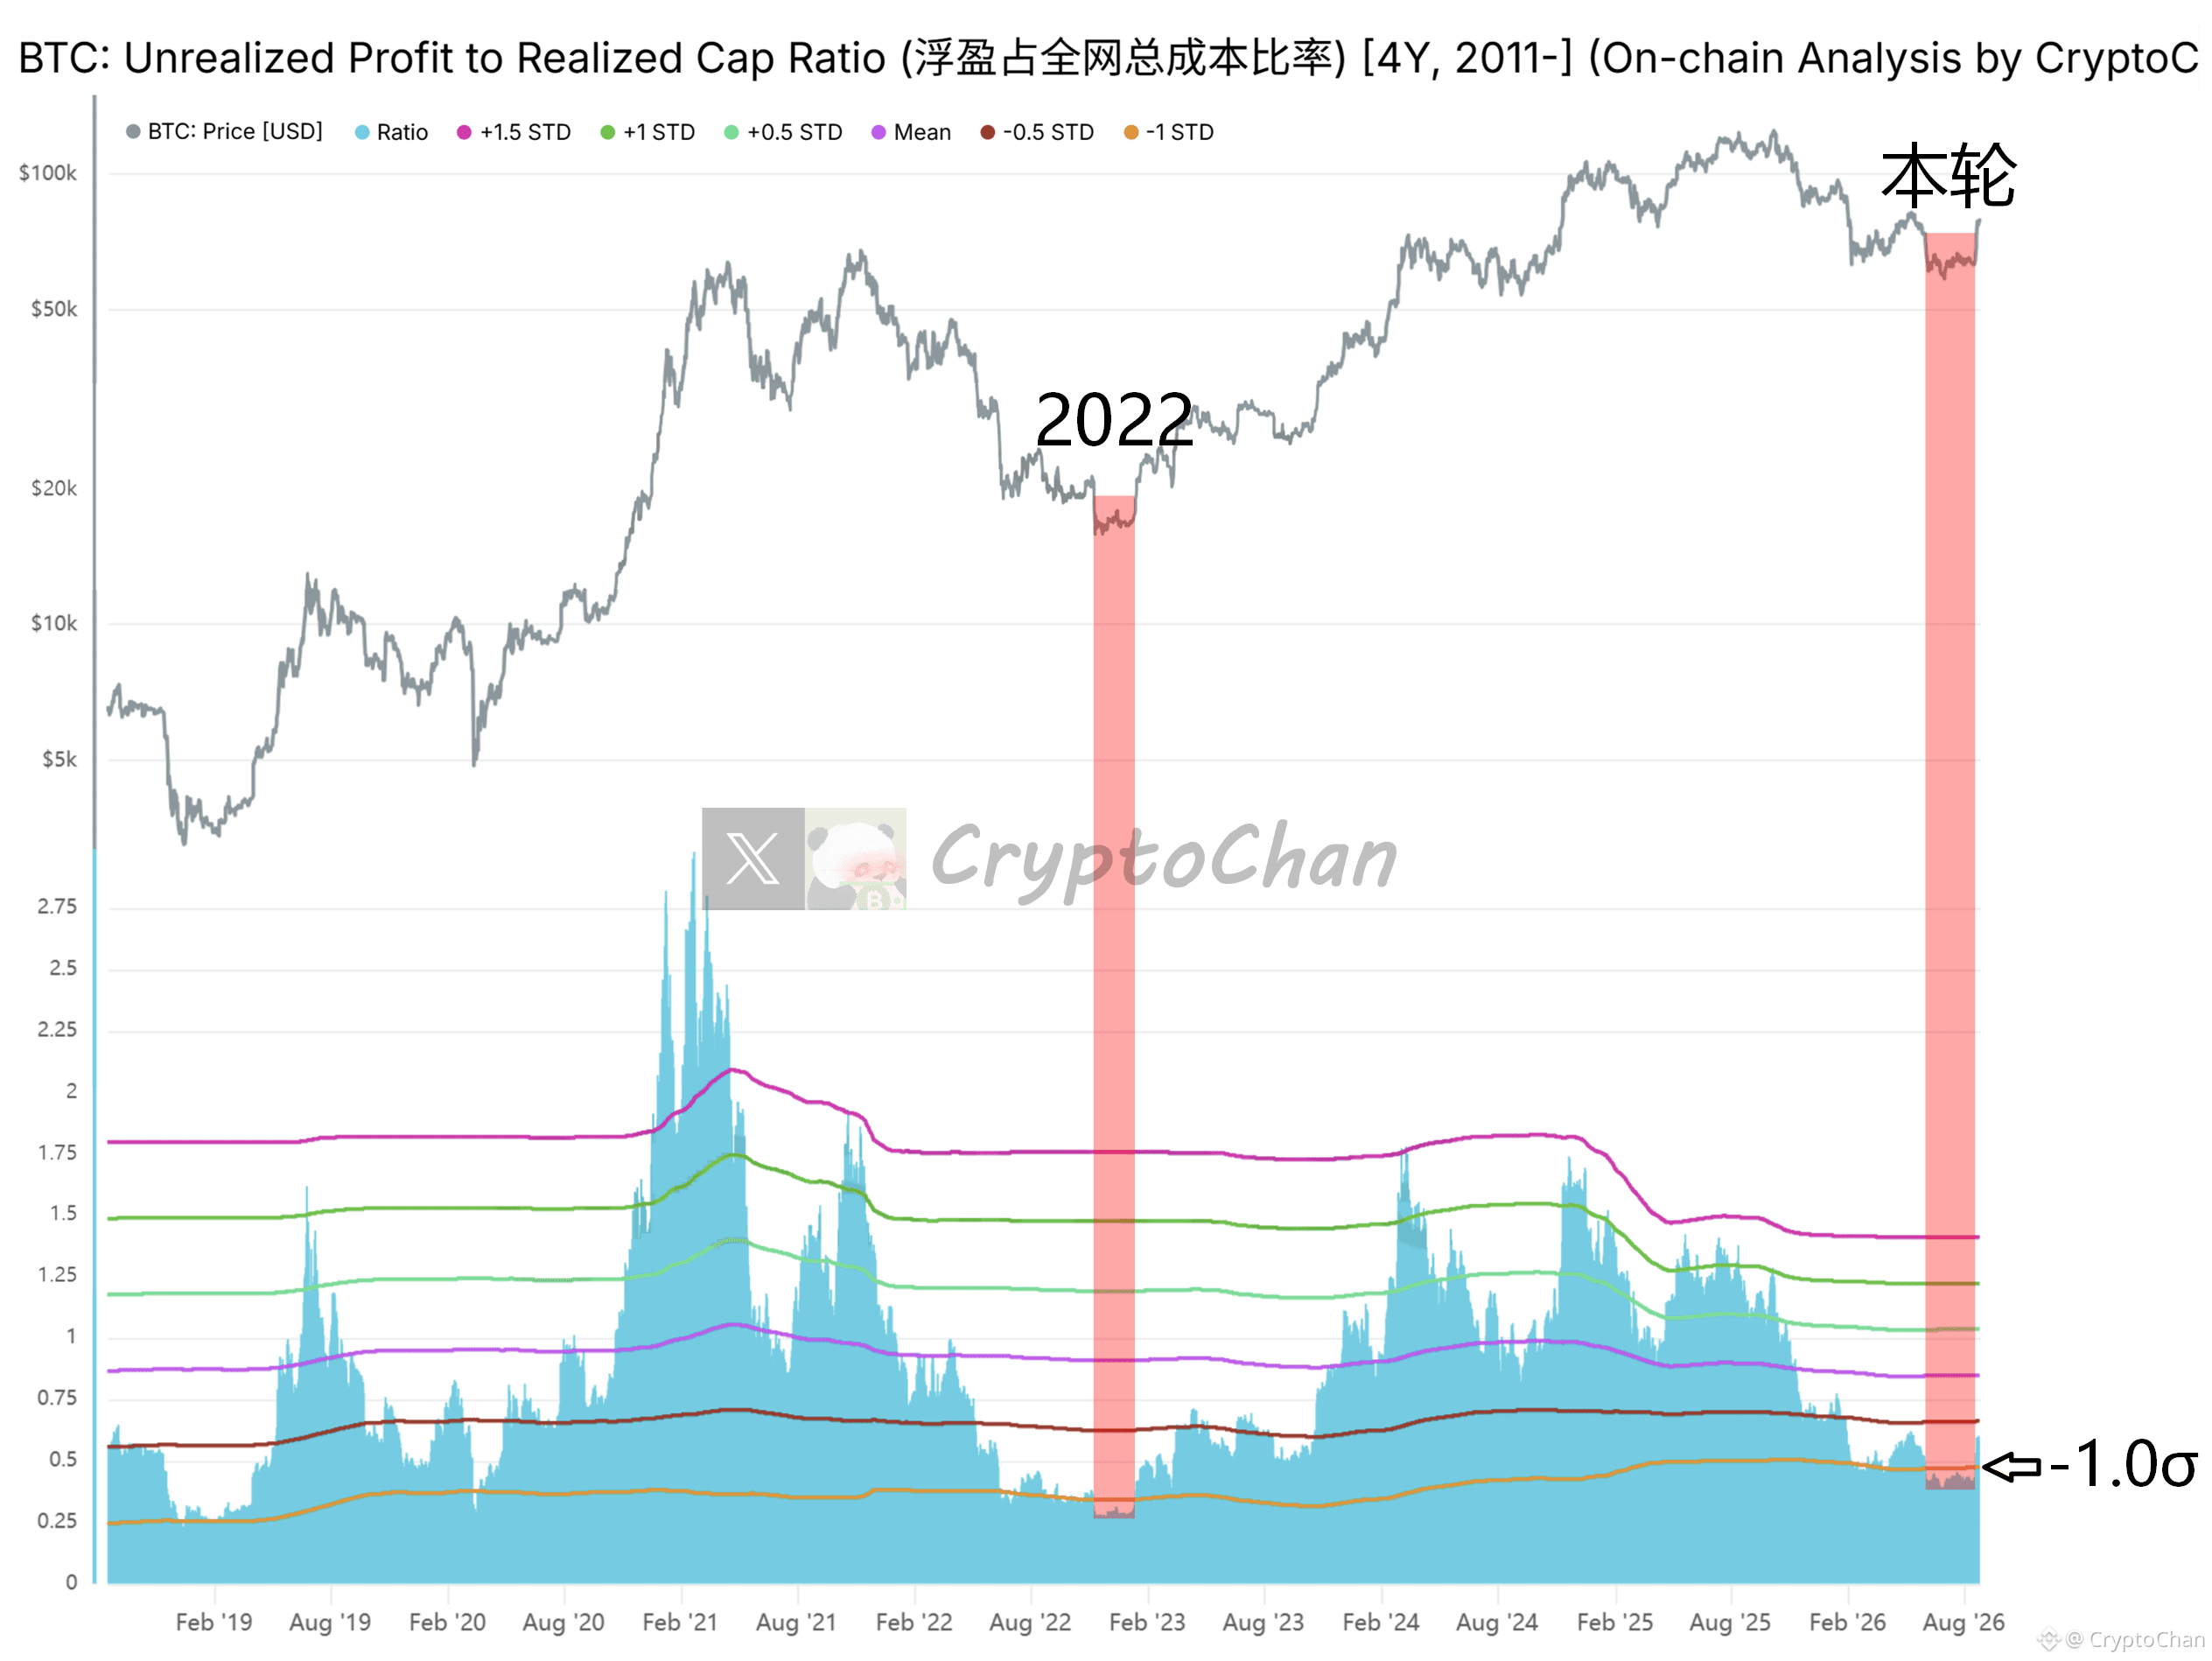
【 $BTC Four-year cycle total engraving series 51】
Bear-bottom in 2022: this indicator dropped below the orange line for 65 days
This bear-bottom: this indicator dropped below the orange line for 78 days
That is, in both of these past bear-bottom cycles, there was more than a two-month, ample bottom-picking window
┌── 🐼 On-chain data details ──┐
The indicator at the bottom of the chart is the ratio of “Bitcoin’s total net unrealized profit amount from all on-chain holdings” to “Bitcoin’s total purchase cost from all on-chain holdings.” The orange line is the “-1 standard deviation” line for this ratio
Bear-bottom in 2022: this indicator dropped below the orange line for 65 days
This bear-bottom: this indicator dropped below the orange line for 78 days
That is, in both of these past bear-bottom cycles, there was more than a two-month, ample bottom-picking window
┌── 🐼 On-chain data details ──┐
The indicator at the bottom of the chart is the ratio of “Bitcoin’s total net unrealized profit amount from all on-chain holdings” to “Bitcoin’s total purchase cost from all on-chain holdings.” The orange line is the “-1 standard deviation” line for this ratio
【 $BTC Four-year cycle total engraving series 51】
Bear-bottom in 2022: this indicator dropped below the orange line for 65 days
This bear-bottom: this indicator dropped below the orange line for 78 days
That is, in both of these past bear-bottom cycles, there was more than a two-month, ample bottom-picking window
┌── 🐼 On-chain data details ──┐
The indicator at the bottom of the chart is the ratio of “Bitcoin’s total net unrealized profit amount from all on-chain holdings” to “Bitcoin’s total purchase cost from all on-chain holdings.” The orange line is the “-1 standard deviation” line for this ratio
Bear-bottom in 2022: this indicator dropped below the orange line for 65 days
This bear-bottom: this indicator dropped below the orange line for 78 days
That is, in both of these past bear-bottom cycles, there was more than a two-month, ample bottom-picking window
┌── 🐼 On-chain data details ──┐
The indicator at the bottom of the chart is the ratio of “Bitcoin’s total net unrealized profit amount from all on-chain holdings” to “Bitcoin’s total purchase cost from all on-chain holdings.” The orange line is the “-1 standard deviation” line for this ratio
CryptoChan
·
--
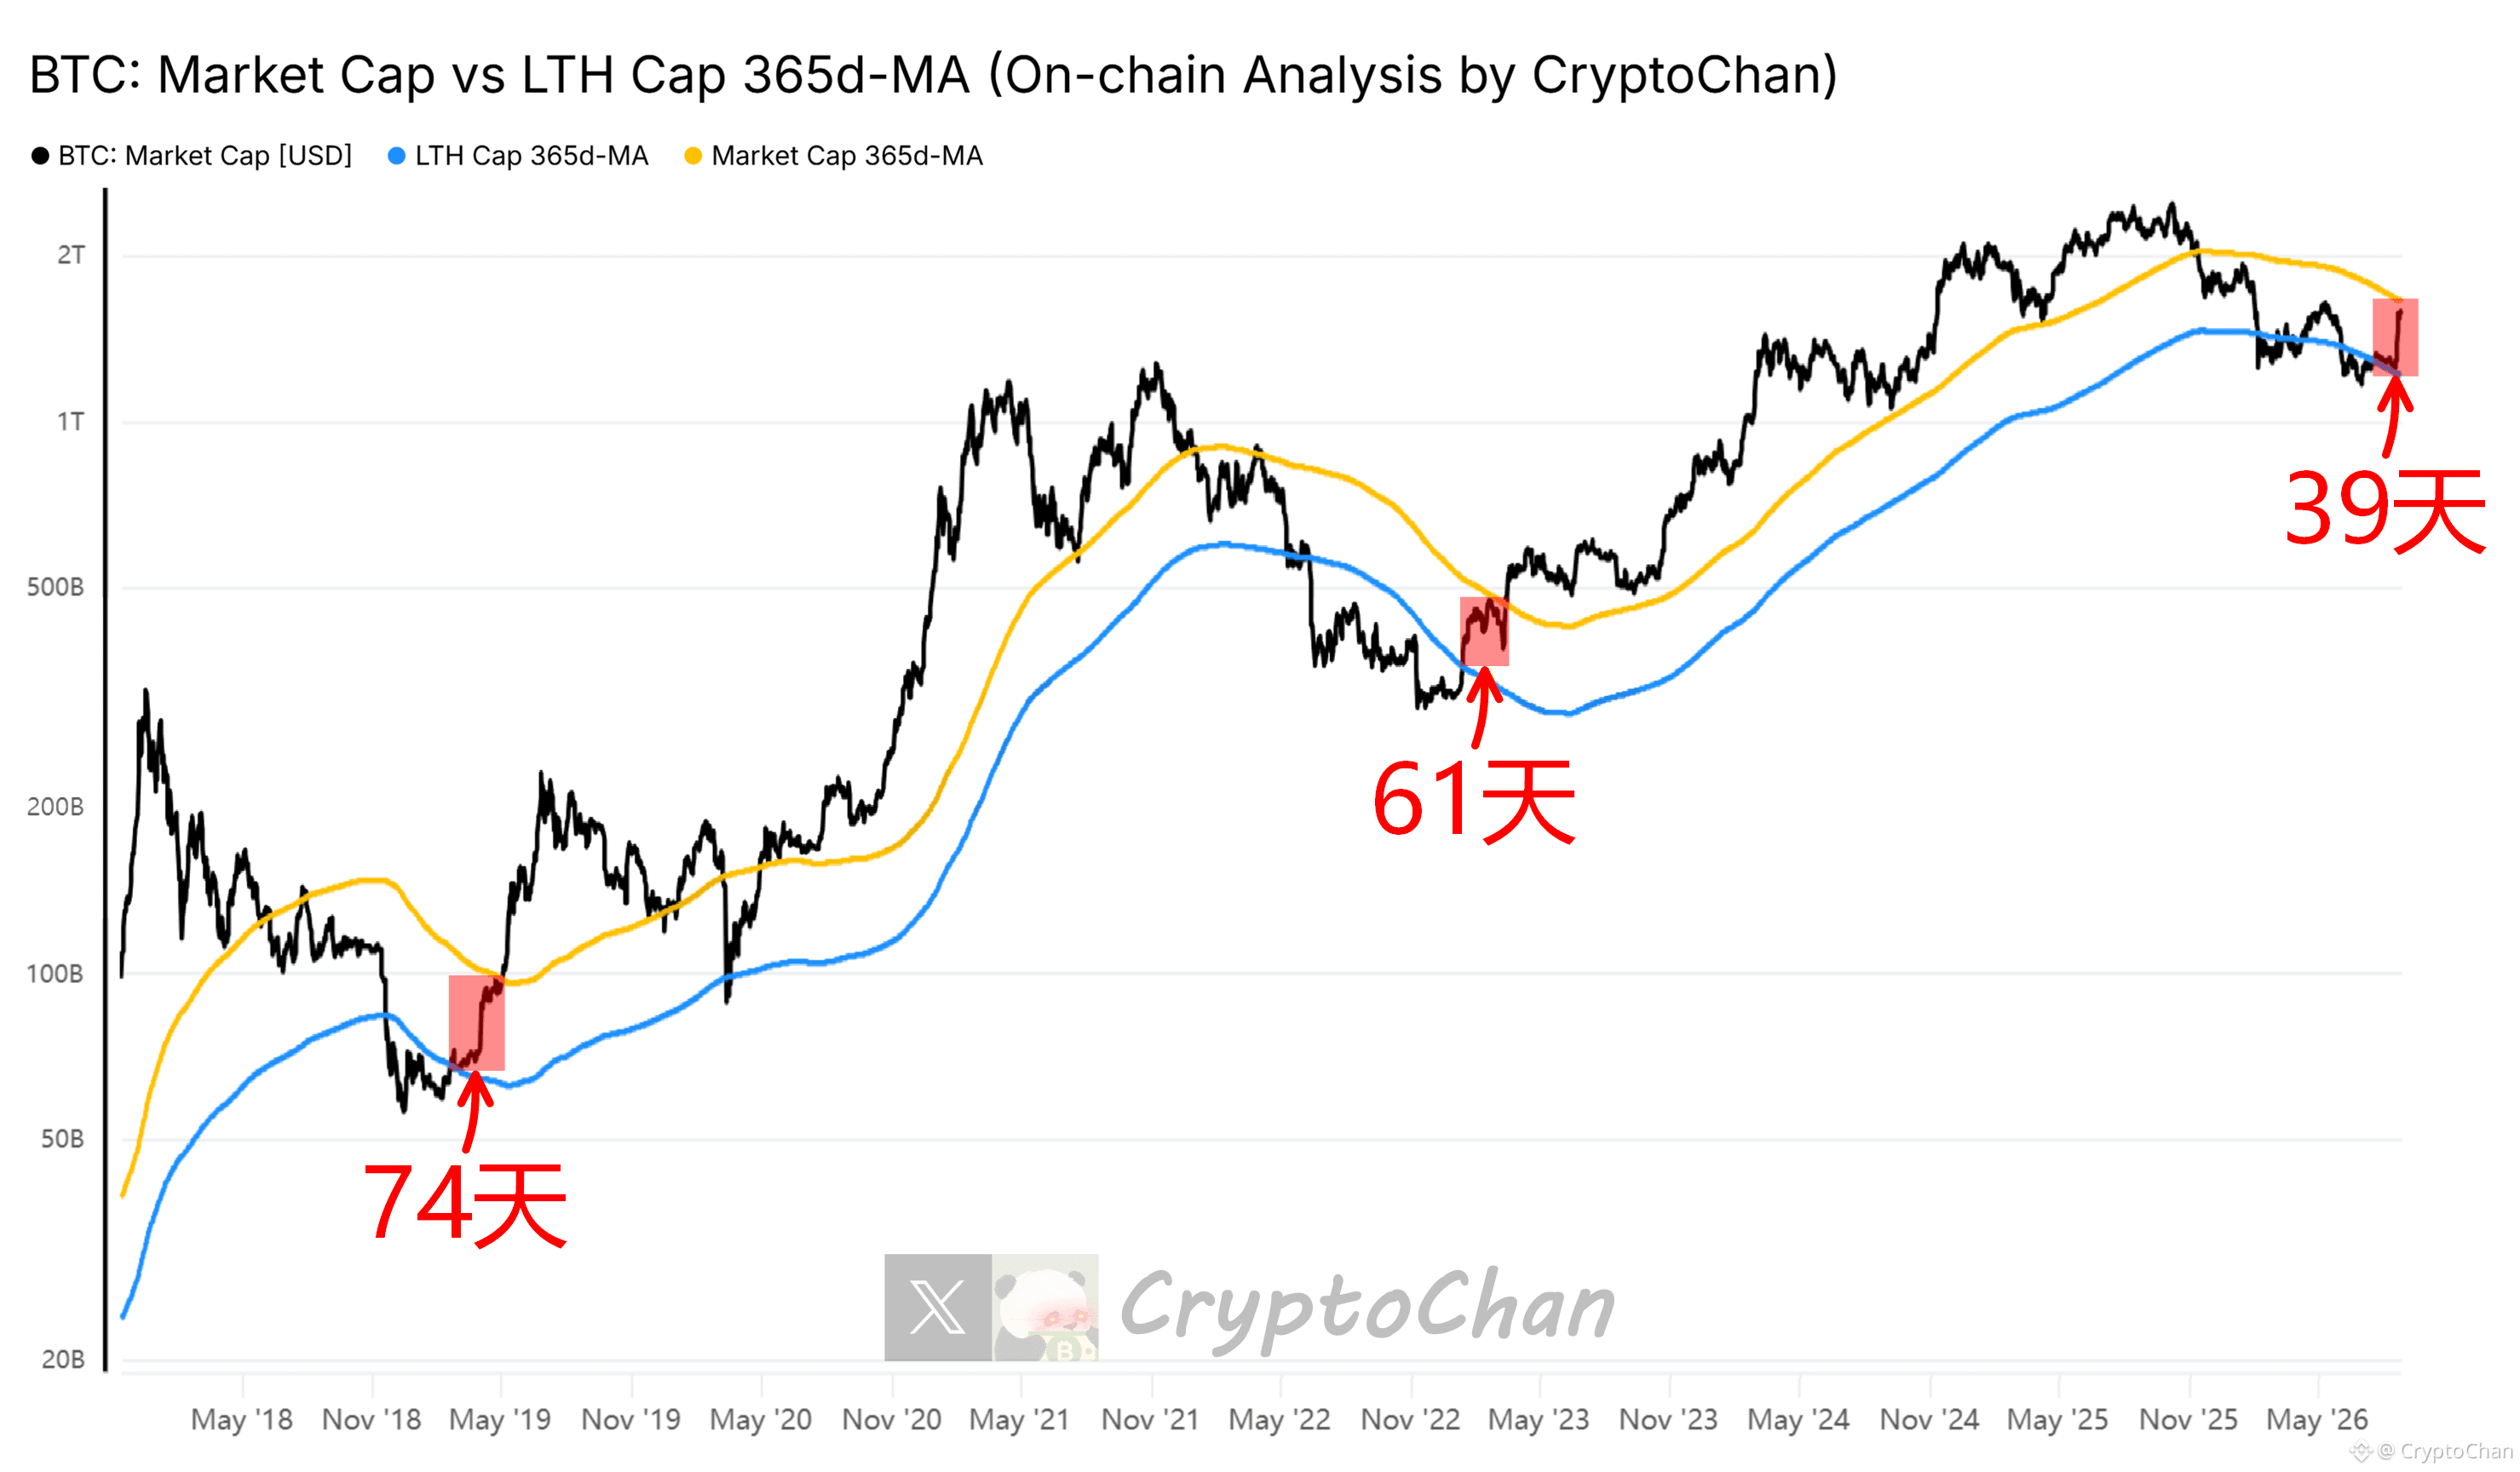
【 $BTC four-year cycle total engraving series 50】
2019 “turn to bull” phase lasted 74 days
2023 “turn to bull” phase lasted 61 days
The current “turn to bull” phase has already lasted 39 days
┌── 🐼 KPI Details ──┐
Black line: Bitcoin market cap
Orange line: Bitcoin market cap 365-day MA
Blue line: Bitcoin on-chain long-term holder cohort total market cap 365-day MA
2019 “turn to bull” phase lasted 74 days
2023 “turn to bull” phase lasted 61 days
The current “turn to bull” phase has already lasted 39 days
┌── 🐼 KPI Details ──┐
Black line: Bitcoin market cap
Orange line: Bitcoin market cap 365-day MA
Blue line: Bitcoin on-chain long-term holder cohort total market cap 365-day MA
【 $BTC four-year cycle total engraving series 50】
2019 “turn to bull” phase lasted 74 days
2023 “turn to bull” phase lasted 61 days
The current “turn to bull” phase has already lasted 39 days
┌── 🐼 KPI Details ──┐
Black line: Bitcoin market cap
Orange line: Bitcoin market cap 365-day MA
Blue line: Bitcoin on-chain long-term holder cohort total market cap 365-day MA
2019 “turn to bull” phase lasted 74 days
2023 “turn to bull” phase lasted 61 days
The current “turn to bull” phase has already lasted 39 days
┌── 🐼 KPI Details ──┐
Black line: Bitcoin market cap
Orange line: Bitcoin market cap 365-day MA
Blue line: Bitcoin on-chain long-term holder cohort total market cap 365-day MA
CryptoChan
·
--
Cow's coming!!️【$BTC four-year cycle total engraving series 49】
March 2012: Blue-Orange crossover
July 2015: Blue-Orange crossover
April 2019: Blue-Orange crossover
January 2023: Blue-Orange crossover
Current: Blue and Orange have crossed
┌─ 🐼 On-chain data details ─┐
The blue line is the ratio of “average purchase cost of long-term on-chain holders” to “average purchase cost of short-term on-chain holders”; the orange line is the blue line’s 60-day MA.
Historically, Blue-Orange crossovers often correspond to the end of a bear market and the start of a bull market
March 2012: Blue-Orange crossover
July 2015: Blue-Orange crossover
April 2019: Blue-Orange crossover
January 2023: Blue-Orange crossover
Current: Blue and Orange have crossed
┌─ 🐼 On-chain data details ─┐
The blue line is the ratio of “average purchase cost of long-term on-chain holders” to “average purchase cost of short-term on-chain holders”; the orange line is the blue line’s 60-day MA.
Historically, Blue-Orange crossovers often correspond to the end of a bear market and the start of a bull market
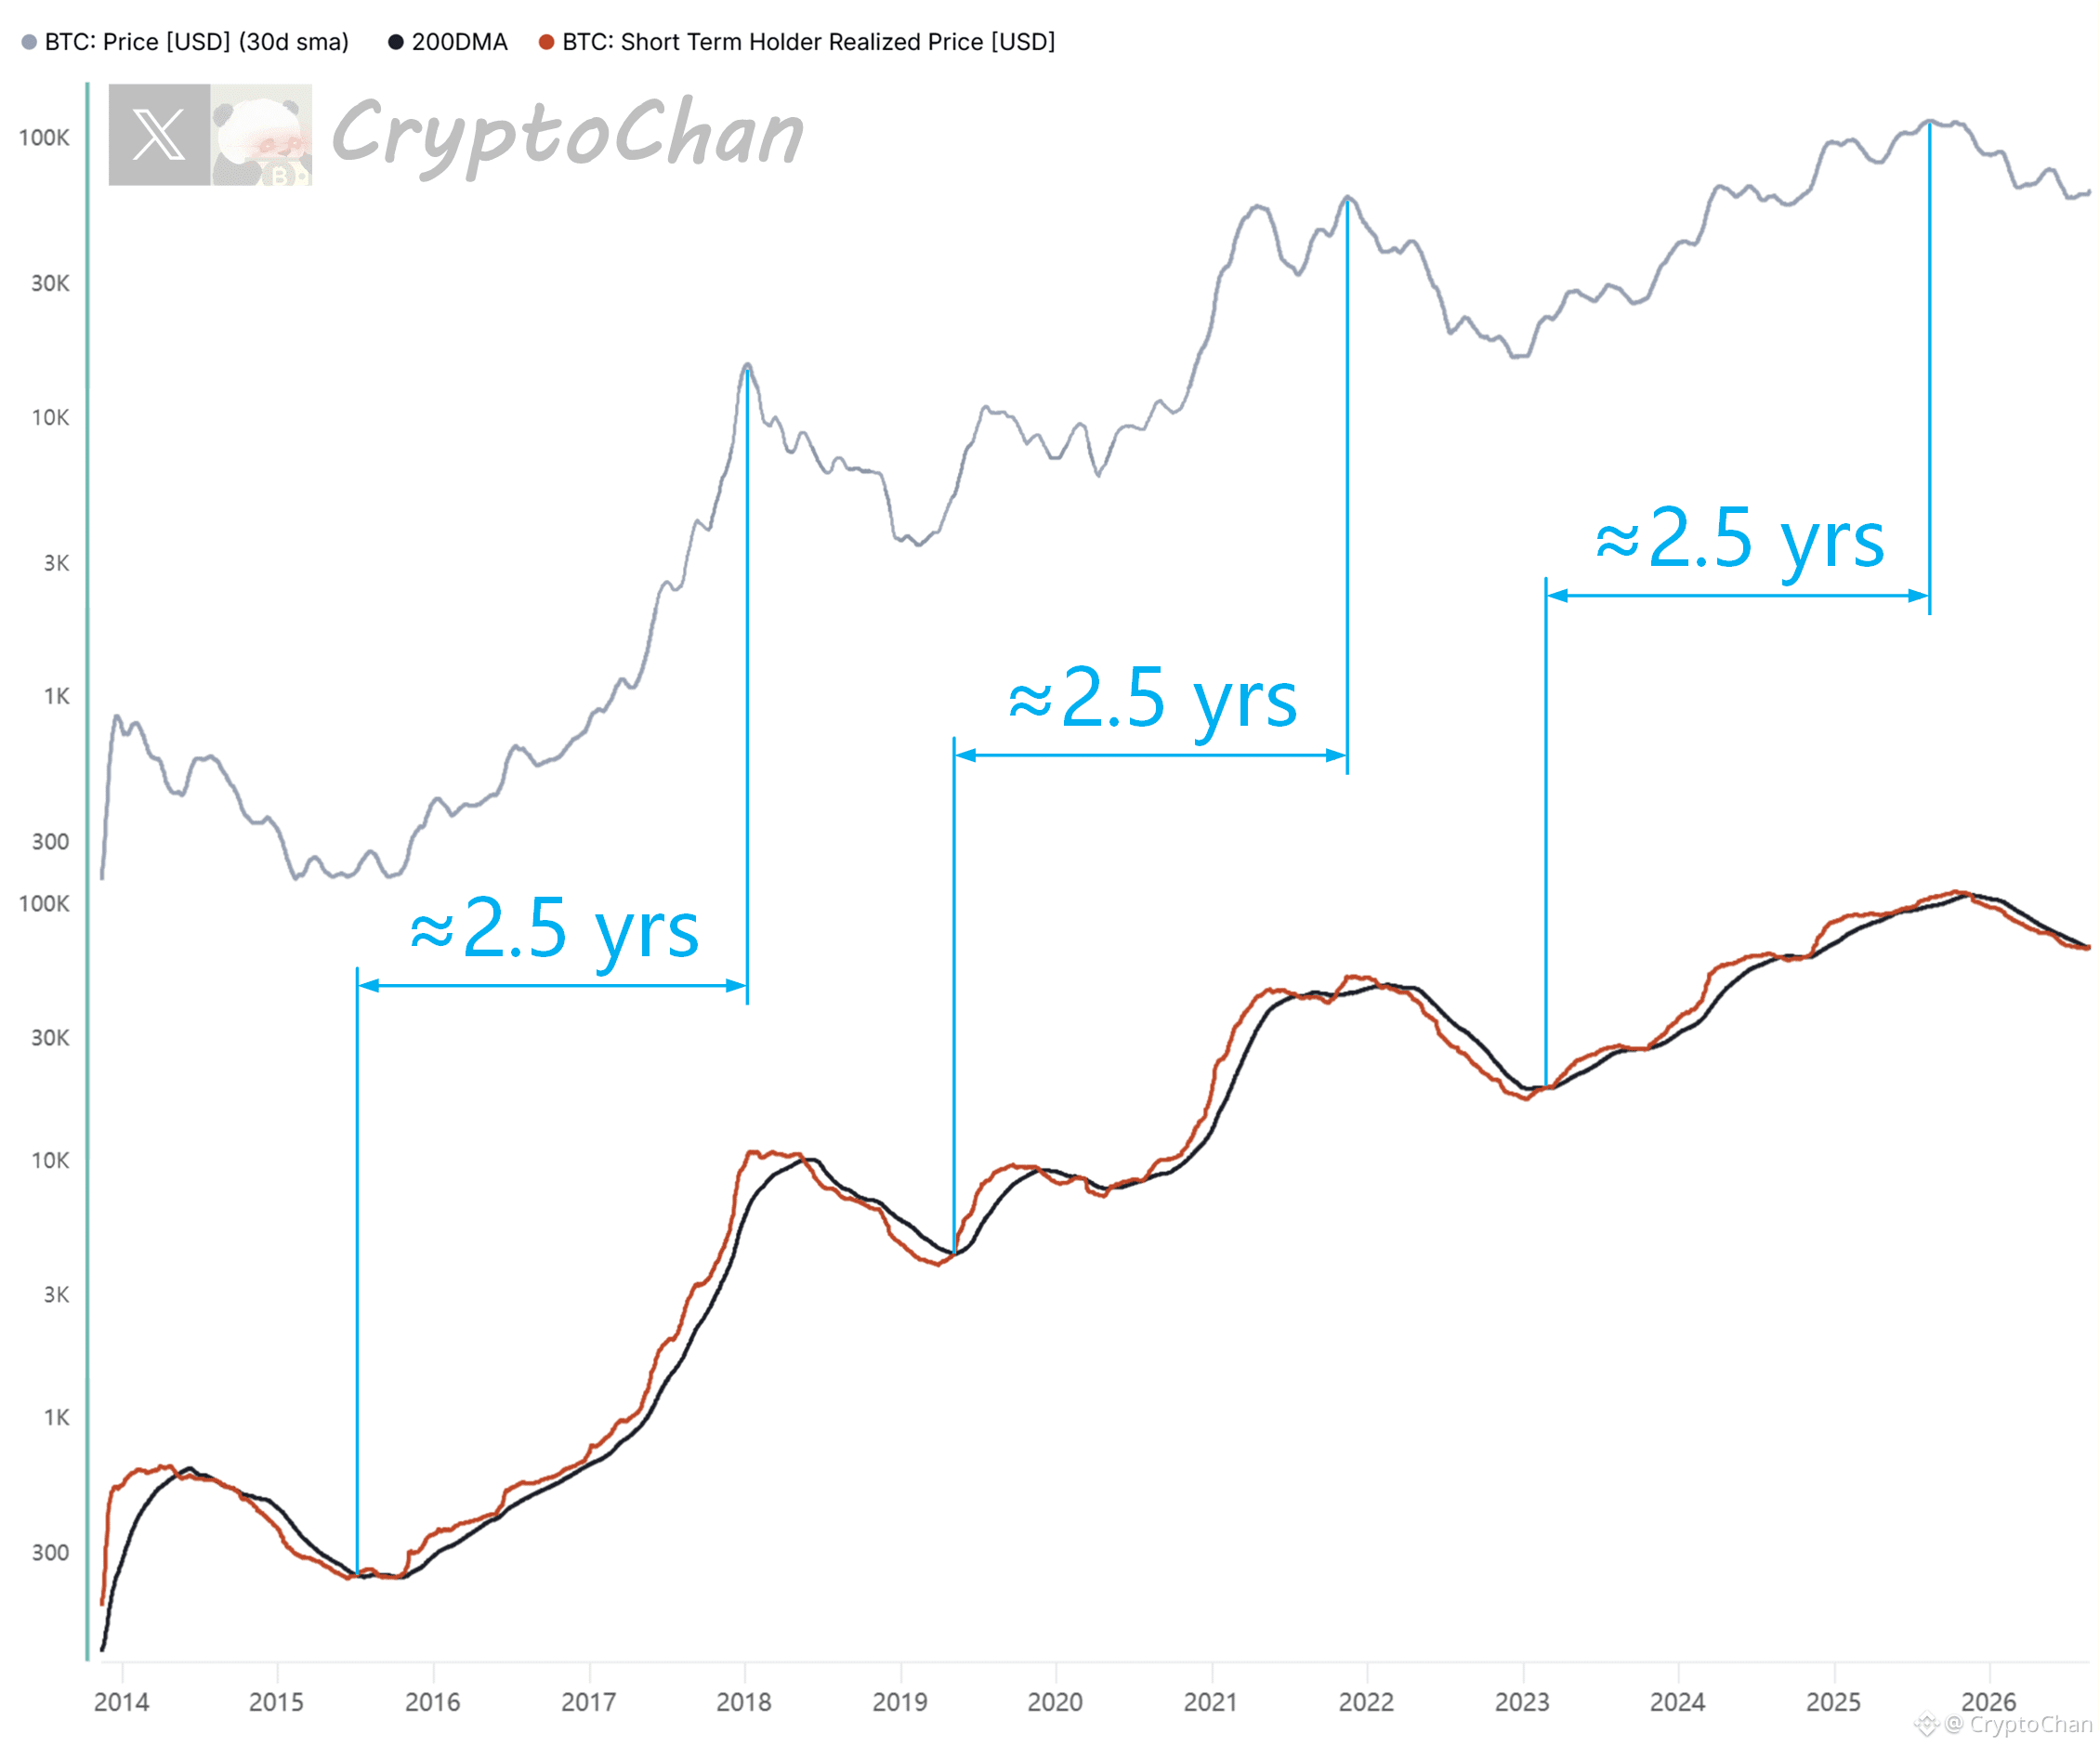
【 $BTC Bull market top-calling countdown series 02】
2015 red-black crossover: about one “kun” year later to the bull market top
2019 red-black crossover: about one “kun” year later to the bull market top
2023 red-black crossover: about one “kun” year later to the bull market top
2026 red-black crossover: 4 days and 5 hours have already passed
┌── 🐼 Indicator details ──┐
Gray line: Bitcoin price 30-day moving average
Red line: Bitcoin on-chain short-term holders’ average buy-in cost (average cost of holdings)
Black line: Bitcoin price 200-day moving average
2015 red-black crossover: about one “kun” year later to the bull market top
2019 red-black crossover: about one “kun” year later to the bull market top
2023 red-black crossover: about one “kun” year later to the bull market top
2026 red-black crossover: 4 days and 5 hours have already passed
┌── 🐼 Indicator details ──┐
Gray line: Bitcoin price 30-day moving average
Red line: Bitcoin on-chain short-term holders’ average buy-in cost (average cost of holdings)
Black line: Bitcoin price 200-day moving average
CryptoChan
·
--
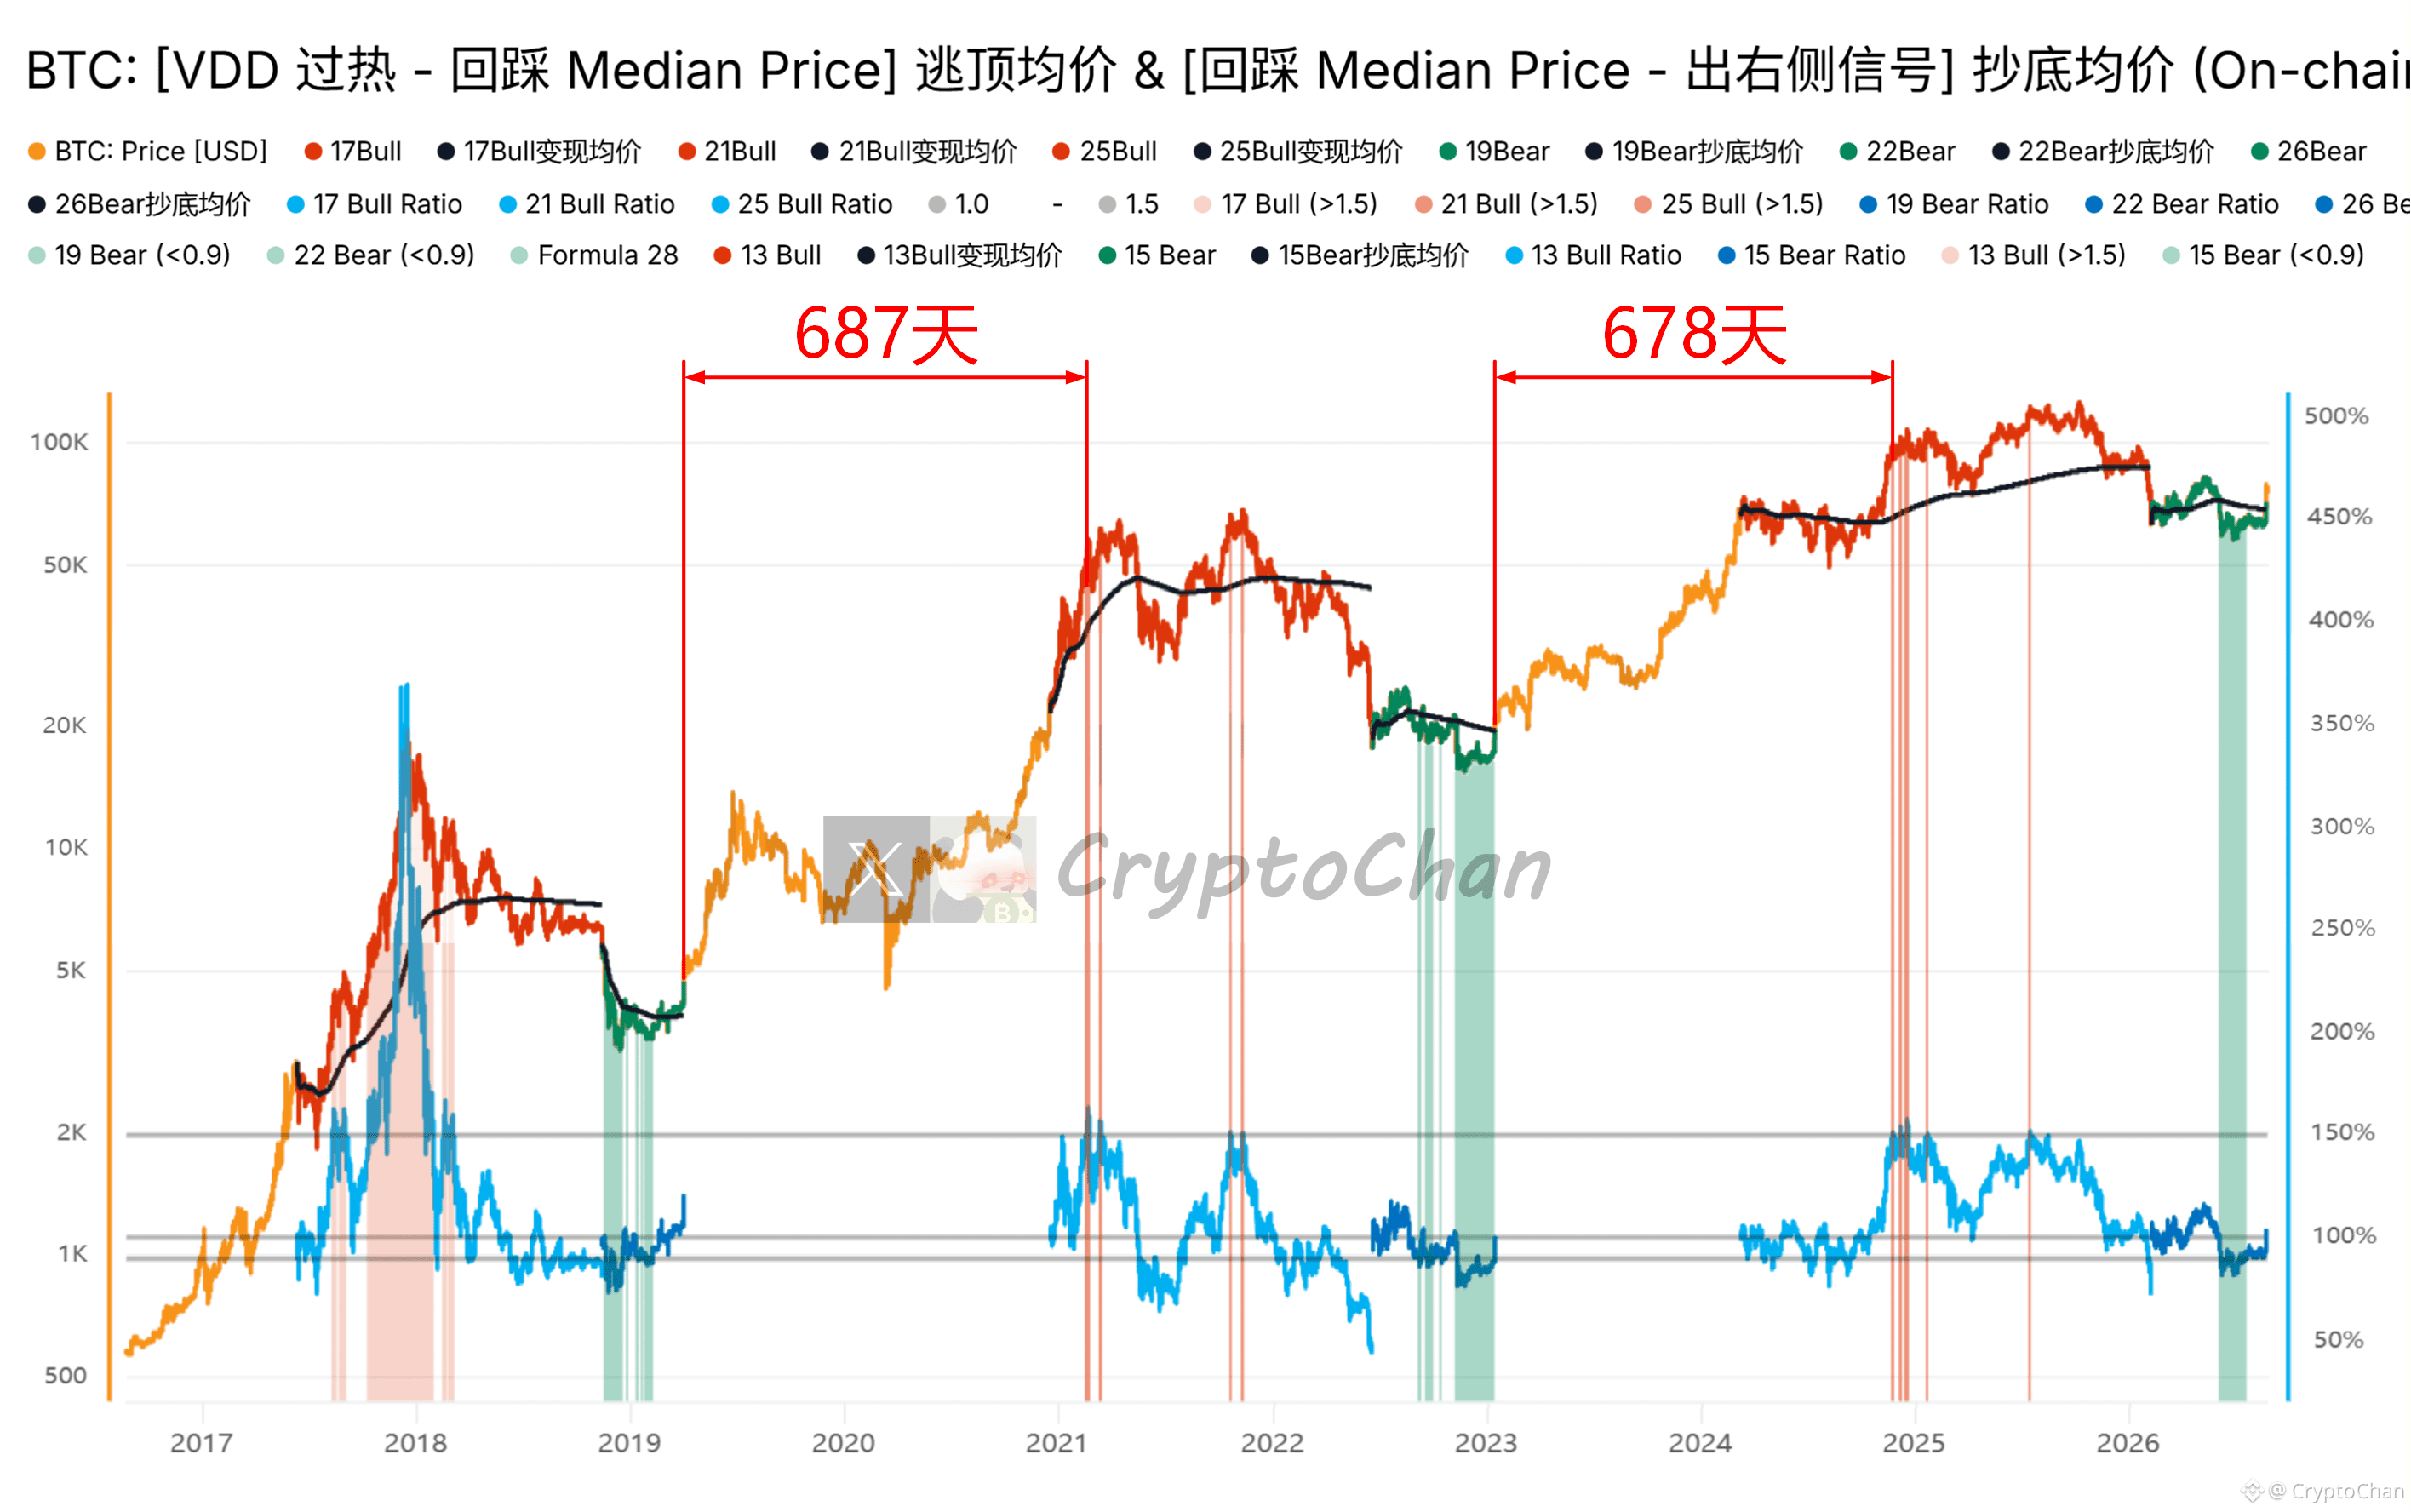
【 $BTC 2028-29 Bull Market Top-Escape Countdown Series 01】
After finishing the 2019 bear-market bottom-buy, 687 days later, the first top-escape red column appeared in 2021
After finishing the 2023 bear-market bottom-buy, 678 days later, the first top-escape red column appeared in 2024
The 2026 bear-market bottom-buy has already passed by 4 days and 2 hours
┌── 🐼 Indicator Details ──┐
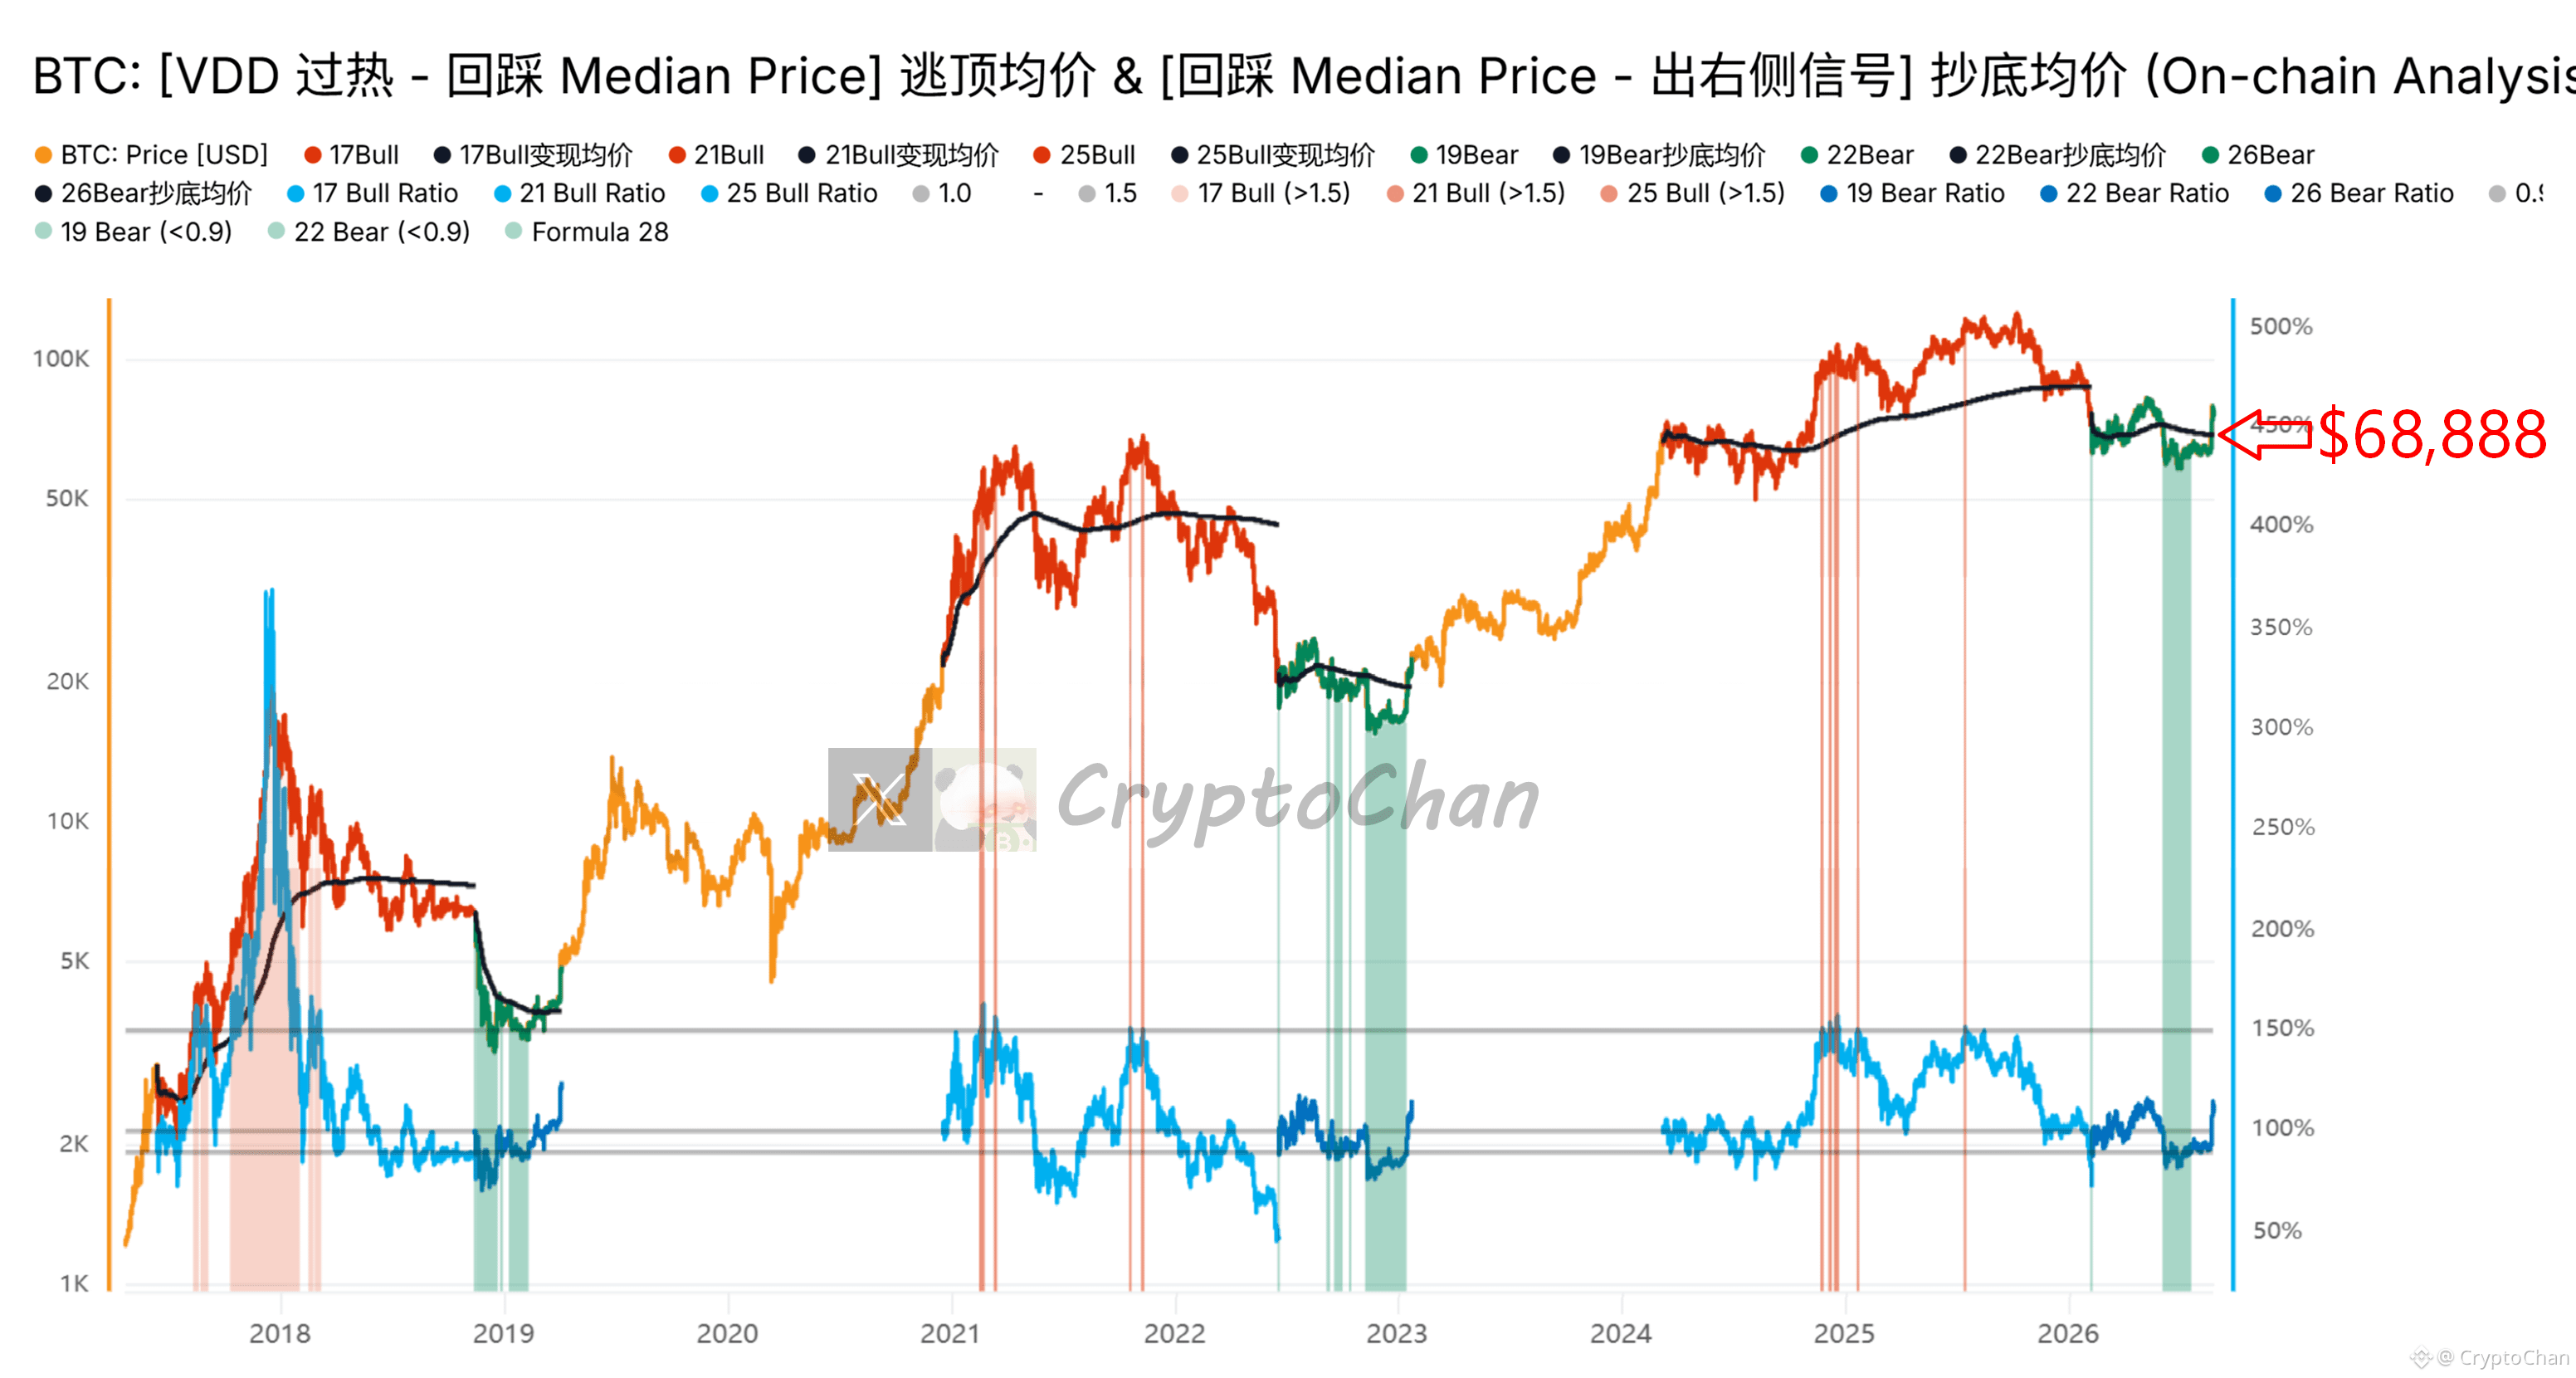
The indicator shown is a bull-market top-escape & bear-market bottom-buy model developed based on Bitcoin VDD, Median Price, and multiple related indicators on the right side of bear-market bottoms
After finishing the 2019 bear-market bottom-buy, 687 days later, the first top-escape red column appeared in 2021
After finishing the 2023 bear-market bottom-buy, 678 days later, the first top-escape red column appeared in 2024
The 2026 bear-market bottom-buy has already passed by 4 days and 2 hours
┌── 🐼 Indicator Details ──┐
The indicator shown is a bull-market top-escape & bear-market bottom-buy model developed based on Bitcoin VDD, Median Price, and multiple related indicators on the right side of bear-market bottoms
【 $BTC 2028-29 Bull Market Top-Escape Countdown Series 01】
After finishing the 2019 bear-market bottom-buy, 687 days later, the first top-escape red column appeared in 2021
After finishing the 2023 bear-market bottom-buy, 678 days later, the first top-escape red column appeared in 2024
The 2026 bear-market bottom-buy has already passed by 4 days and 2 hours
┌── 🐼 Indicator Details ──┐
The indicator shown is a bull-market top-escape & bear-market bottom-buy model developed based on Bitcoin VDD, Median Price, and multiple related indicators on the right side of bear-market bottoms
After finishing the 2019 bear-market bottom-buy, 687 days later, the first top-escape red column appeared in 2021
After finishing the 2023 bear-market bottom-buy, 678 days later, the first top-escape red column appeared in 2024
The 2026 bear-market bottom-buy has already passed by 4 days and 2 hours
┌── 🐼 Indicator Details ──┐
The indicator shown is a bull-market top-escape & bear-market bottom-buy model developed based on Bitcoin VDD, Median Price, and multiple related indicators on the right side of bear-market bottoms
The model’s 2026 bear-bottom batch-buying costs average, developed based on on-chain data from $BTC , is finalized at $68,888
Meaning this round of bear-bottom positioning is completed & the average cost is ≤ $68,888, truly worthy of a top-tier standard
Meaning this round of bear-bottom positioning is completed & the average cost is ≤ $68,888, truly worthy of a top-tier standard
CryptoChan
·
--
$BTC Nearly done with the trip from Qiongdi Green Column 🔫
Verified
The Liquidity Breakthrough for Native BTC: How Trustless Collateral Reshapes DeFi Credit Markets?
In long-term BTC cycle tracking and spot-leveraged strategy building, the absolute safety of underlying collateral is always the first principle. Bitcoin has the largest liquidity across the entire network, but the pain point of traditional BTCFi is this: in pursuit of capital efficiency, BTC holders are often forced to wrap BTC (such as WBTC) or move it via cross-chain bridges. These added third-party trust assumptions and centralized custody risks directly contradict our original intent of holding the “big pie.”
Recent breakthroughs in underlying infrastructure are changing this reality. Babylon Trustless Bitcoin Vaults (TBV) provides a new path that fits the crypto-native logic extremely well.
Its core mechanism is “decentralization without trust.” TBV enables the direct use of native BTC as collateral—no wrapping, no cross-chain transfer, and no interference from multi-sig consortiums. Funds always remain on the Bitcoin mainnet. They are locked via Taproot scripts, and the conditions for redemption and liquidation are cryptographically constrained through zero-knowledge proofs (ZKPs).
From the perspective of data and capital management, what does this mean?
By seamlessly integrating with protocols such as Aave v4, you can directly borrow stablecoins using the highest-quality underlying asset (native BTC) to execute long-term DCA or liquidity management strategies—while maintaining 100% end-to-end self-custody. This eliminates the single point of failure risk of cross-chain bridges. As a result, native BTC not only preserves the safety of “digital gold,” but also truly gains programmable, high-grade credit-collateral attributes.
The evolution of infrastructure is unlocking the liquidity safety of trillions in dormant capital. Embracing trustlessness is the long-term endgame for the BTC ecosystem.
#baby $BABY @BabylonLabs_io
In long-term BTC cycle tracking and spot-leveraged strategy building, the absolute safety of underlying collateral is always the first principle. Bitcoin has the largest liquidity across the entire network, but the pain point of traditional BTCFi is this: in pursuit of capital efficiency, BTC holders are often forced to wrap BTC (such as WBTC) or move it via cross-chain bridges. These added third-party trust assumptions and centralized custody risks directly contradict our original intent of holding the “big pie.”
Recent breakthroughs in underlying infrastructure are changing this reality. Babylon Trustless Bitcoin Vaults (TBV) provides a new path that fits the crypto-native logic extremely well.
Its core mechanism is “decentralization without trust.” TBV enables the direct use of native BTC as collateral—no wrapping, no cross-chain transfer, and no interference from multi-sig consortiums. Funds always remain on the Bitcoin mainnet. They are locked via Taproot scripts, and the conditions for redemption and liquidation are cryptographically constrained through zero-knowledge proofs (ZKPs).
From the perspective of data and capital management, what does this mean?
By seamlessly integrating with protocols such as Aave v4, you can directly borrow stablecoins using the highest-quality underlying asset (native BTC) to execute long-term DCA or liquidity management strategies—while maintaining 100% end-to-end self-custody. This eliminates the single point of failure risk of cross-chain bridges. As a result, native BTC not only preserves the safety of “digital gold,” but also truly gains programmable, high-grade credit-collateral attributes.
The evolution of infrastructure is unlocking the liquidity safety of trillions in dormant capital. Embracing trustlessness is the long-term endgame for the BTC ecosystem.
#baby $BABY @BabylonLabs_io

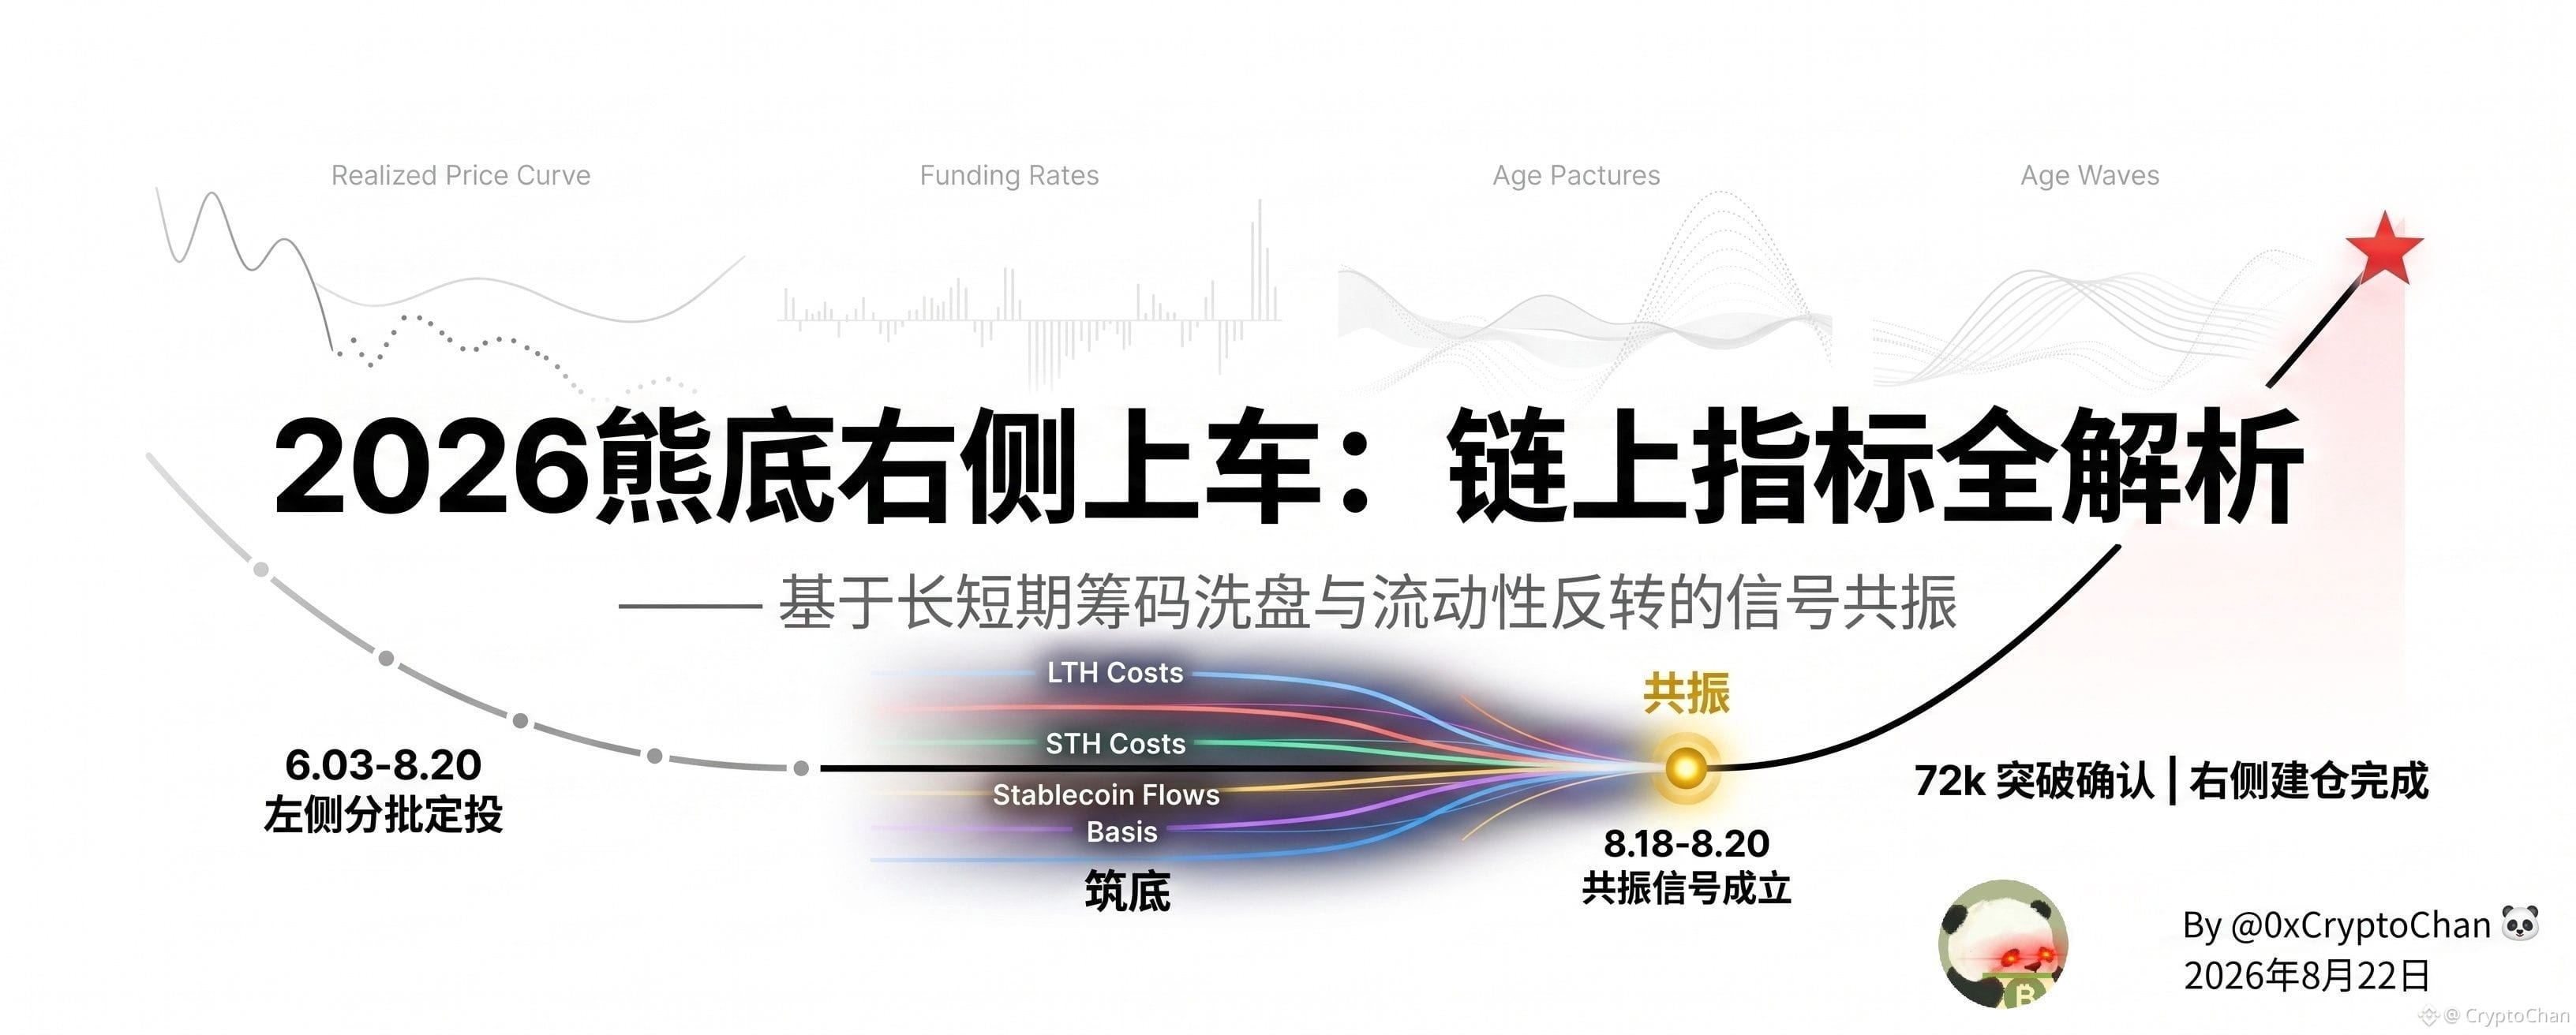
The 《2026 Bear Bottom Right-Side Boarding Logic Full Breakdown》 we agreed on yesterday is finally ready—burned the midnight oil to finish it📑
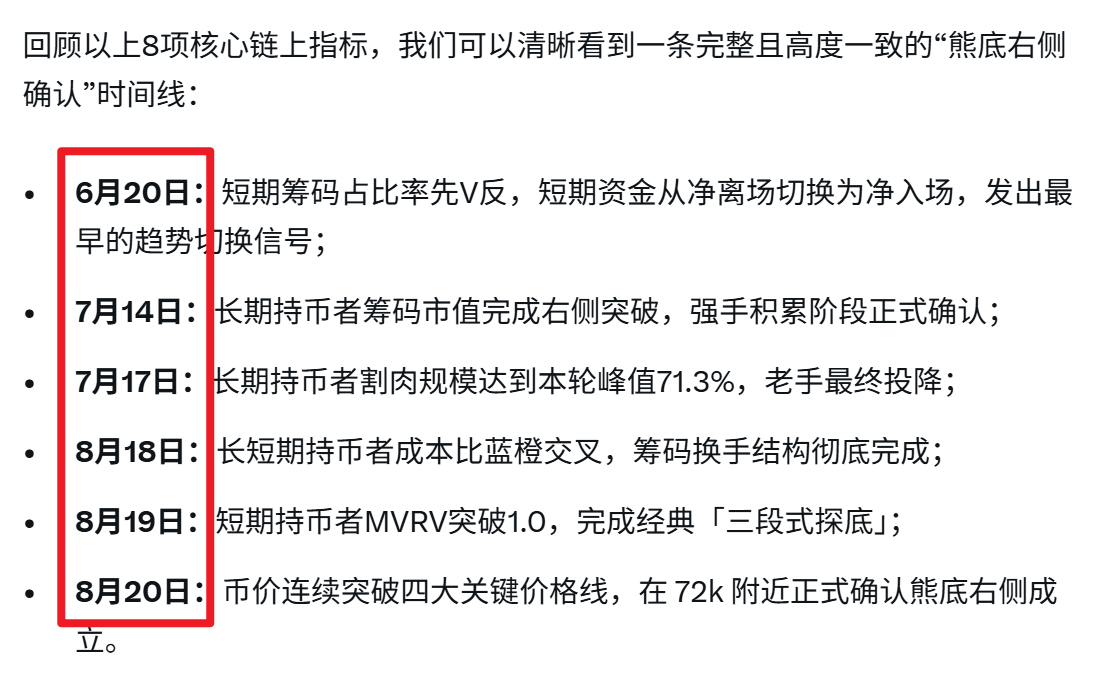
As the coin price surged past the “four key price levels,” the 8 core on-chain indicators we’ve been tracking showed textbook-style synchronized moves. The right-side trend for the 2026 bear-market bottom is officially established.
At this point, the left-side staged DCA “catch-the-bottom” operation spanning “九九八十一 days” has been completed successfully. The reserved right-side spot positions and spot leverage exposure have also been fully executed in line with the trend.
Starting from underlying data, this article fully dissects the intrinsic logic behind this round’s long-/short-term holder shakeout and the liquidity reversal. It also walks through—along a detailed timeline—the entire process of these 8 core indicators triggering synchronized signals.
Give up the vanity of buying at the absolute lowest point—aim for the absolute best odds that come from confirmed trends. The door to the new cycle is already open. Buckle up and stay steady🚀
📊 This long-form article and the complete set of high-definition charts are exclusive for subscribers. Binance can’t host the link—please head over to the X platform. Thanks for your support, bosses🤝 (Our official X account: @0xCryptoChan)
As the coin price surged past the “four key price levels,” the 8 core on-chain indicators we’ve been tracking showed textbook-style synchronized moves. The right-side trend for the 2026 bear-market bottom is officially established.
At this point, the left-side staged DCA “catch-the-bottom” operation spanning “九九八十一 days” has been completed successfully. The reserved right-side spot positions and spot leverage exposure have also been fully executed in line with the trend.
Starting from underlying data, this article fully dissects the intrinsic logic behind this round’s long-/short-term holder shakeout and the liquidity reversal. It also walks through—along a detailed timeline—the entire process of these 8 core indicators triggering synchronized signals.
Give up the vanity of buying at the absolute lowest point—aim for the absolute best odds that come from confirmed trends. The door to the new cycle is already open. Buckle up and stay steady🚀
📊 This long-form article and the complete set of high-definition charts are exclusive for subscribers. Binance can’t host the link—please head over to the X platform. Thanks for your support, bosses🤝 (Our official X account: @0xCryptoChan)

CryptoChan
·
--
The left side is done throwing.
The right side is already all-in.
See you at the bull’s peak.
See you in three years!
P. S. This cat will write the detailed logic for “getting on board from the bottom-right” as soon as possible (exclusive for X platform subscribers; please make sure this cat’s X account is 0xCryptoChan). Stay tuned 🙏 $BTC
The right side is already all-in.
See you at the bull’s peak.
See you in three years!
P. S. This cat will write the detailed logic for “getting on board from the bottom-right” as soon as possible (exclusive for X platform subscribers; please make sure this cat’s X account is 0xCryptoChan). Stay tuned 🙏 $BTC
The left side is done throwing.
The right side is already all-in.
See you at the bull’s peak.
See you in three years!
P. S. This cat will write the detailed logic for “getting on board from the bottom-right” as soon as possible (exclusive for X platform subscribers; please make sure this cat’s X account is 0xCryptoChan). Stay tuned 🙏 $BTC
The right side is already all-in.
See you at the bull’s peak.
See you in three years!
P. S. This cat will write the detailed logic for “getting on board from the bottom-right” as soon as possible (exclusive for X platform subscribers; please make sure this cat’s X account is 0xCryptoChan). Stay tuned 🙏 $BTC
CryptoChan
·
--
【🚨 BTC Bear Bottom Cup! 2026 Bottom Fishing Plan Launched】
Thanks for sticking around for another 4 years! With the cycle rotation, it’s time to build our positions! Starting today, I'm officially launching a dollar-cost averaging strategy to pick the bottom, continuing the steady approach of buying in phases at the bear bottom we saw in 2022👇
📊 Quick Overview of the Bottom Fishing Strategy (Executed in Two Phases):
○ Phase One: Dollar-Cost Averaging in the Bottom Formation Zone (Building 50% Position)
In the current bear bottom, where we’re seeing a secondary bottom formation, I expect to spend 99 days (let’s emphasize this time frame! Don’t rush in and go all-in), systematically completing half of my position. Both spot trading and low-leverage setups can be flexibly utilized.
○ Phase Two: Confirmation of the Right Side Turning Point (Building Remaining 50%)
Keep half your bullets ready and patiently wait for the right side turning point in the bear bottom zone to appear. Strike with the trend to complete the deployment of the remaining half of the position.
Want to dive deeper into the macro analysis and price logic behind this plan?
🔗 I’ll be posting a detailed analysis of the Bottom Fishing Plan on X (subscription exclusive, stay tuned, follow me on X: 0xCryptoChan)
After going through 99 challenges, we finally unlock the true scripture. Keep up the rhythm, and we’ll meet at the peak! 🚀
Thanks for sticking around for another 4 years! With the cycle rotation, it’s time to build our positions! Starting today, I'm officially launching a dollar-cost averaging strategy to pick the bottom, continuing the steady approach of buying in phases at the bear bottom we saw in 2022👇
📊 Quick Overview of the Bottom Fishing Strategy (Executed in Two Phases):
○ Phase One: Dollar-Cost Averaging in the Bottom Formation Zone (Building 50% Position)
In the current bear bottom, where we’re seeing a secondary bottom formation, I expect to spend 99 days (let’s emphasize this time frame! Don’t rush in and go all-in), systematically completing half of my position. Both spot trading and low-leverage setups can be flexibly utilized.
○ Phase Two: Confirmation of the Right Side Turning Point (Building Remaining 50%)
Keep half your bullets ready and patiently wait for the right side turning point in the bear bottom zone to appear. Strike with the trend to complete the deployment of the remaining half of the position.
Want to dive deeper into the macro analysis and price logic behind this plan?
🔗 I’ll be posting a detailed analysis of the Bottom Fishing Plan on X (subscription exclusive, stay tuned, follow me on X: 0xCryptoChan)
After going through 99 challenges, we finally unlock the true scripture. Keep up the rhythm, and we’ll meet at the peak! 🚀

Meet the deadline 😉
CryptoChan
·
--
【 $BTC Four-year cycle total market-bottom series (40) 】
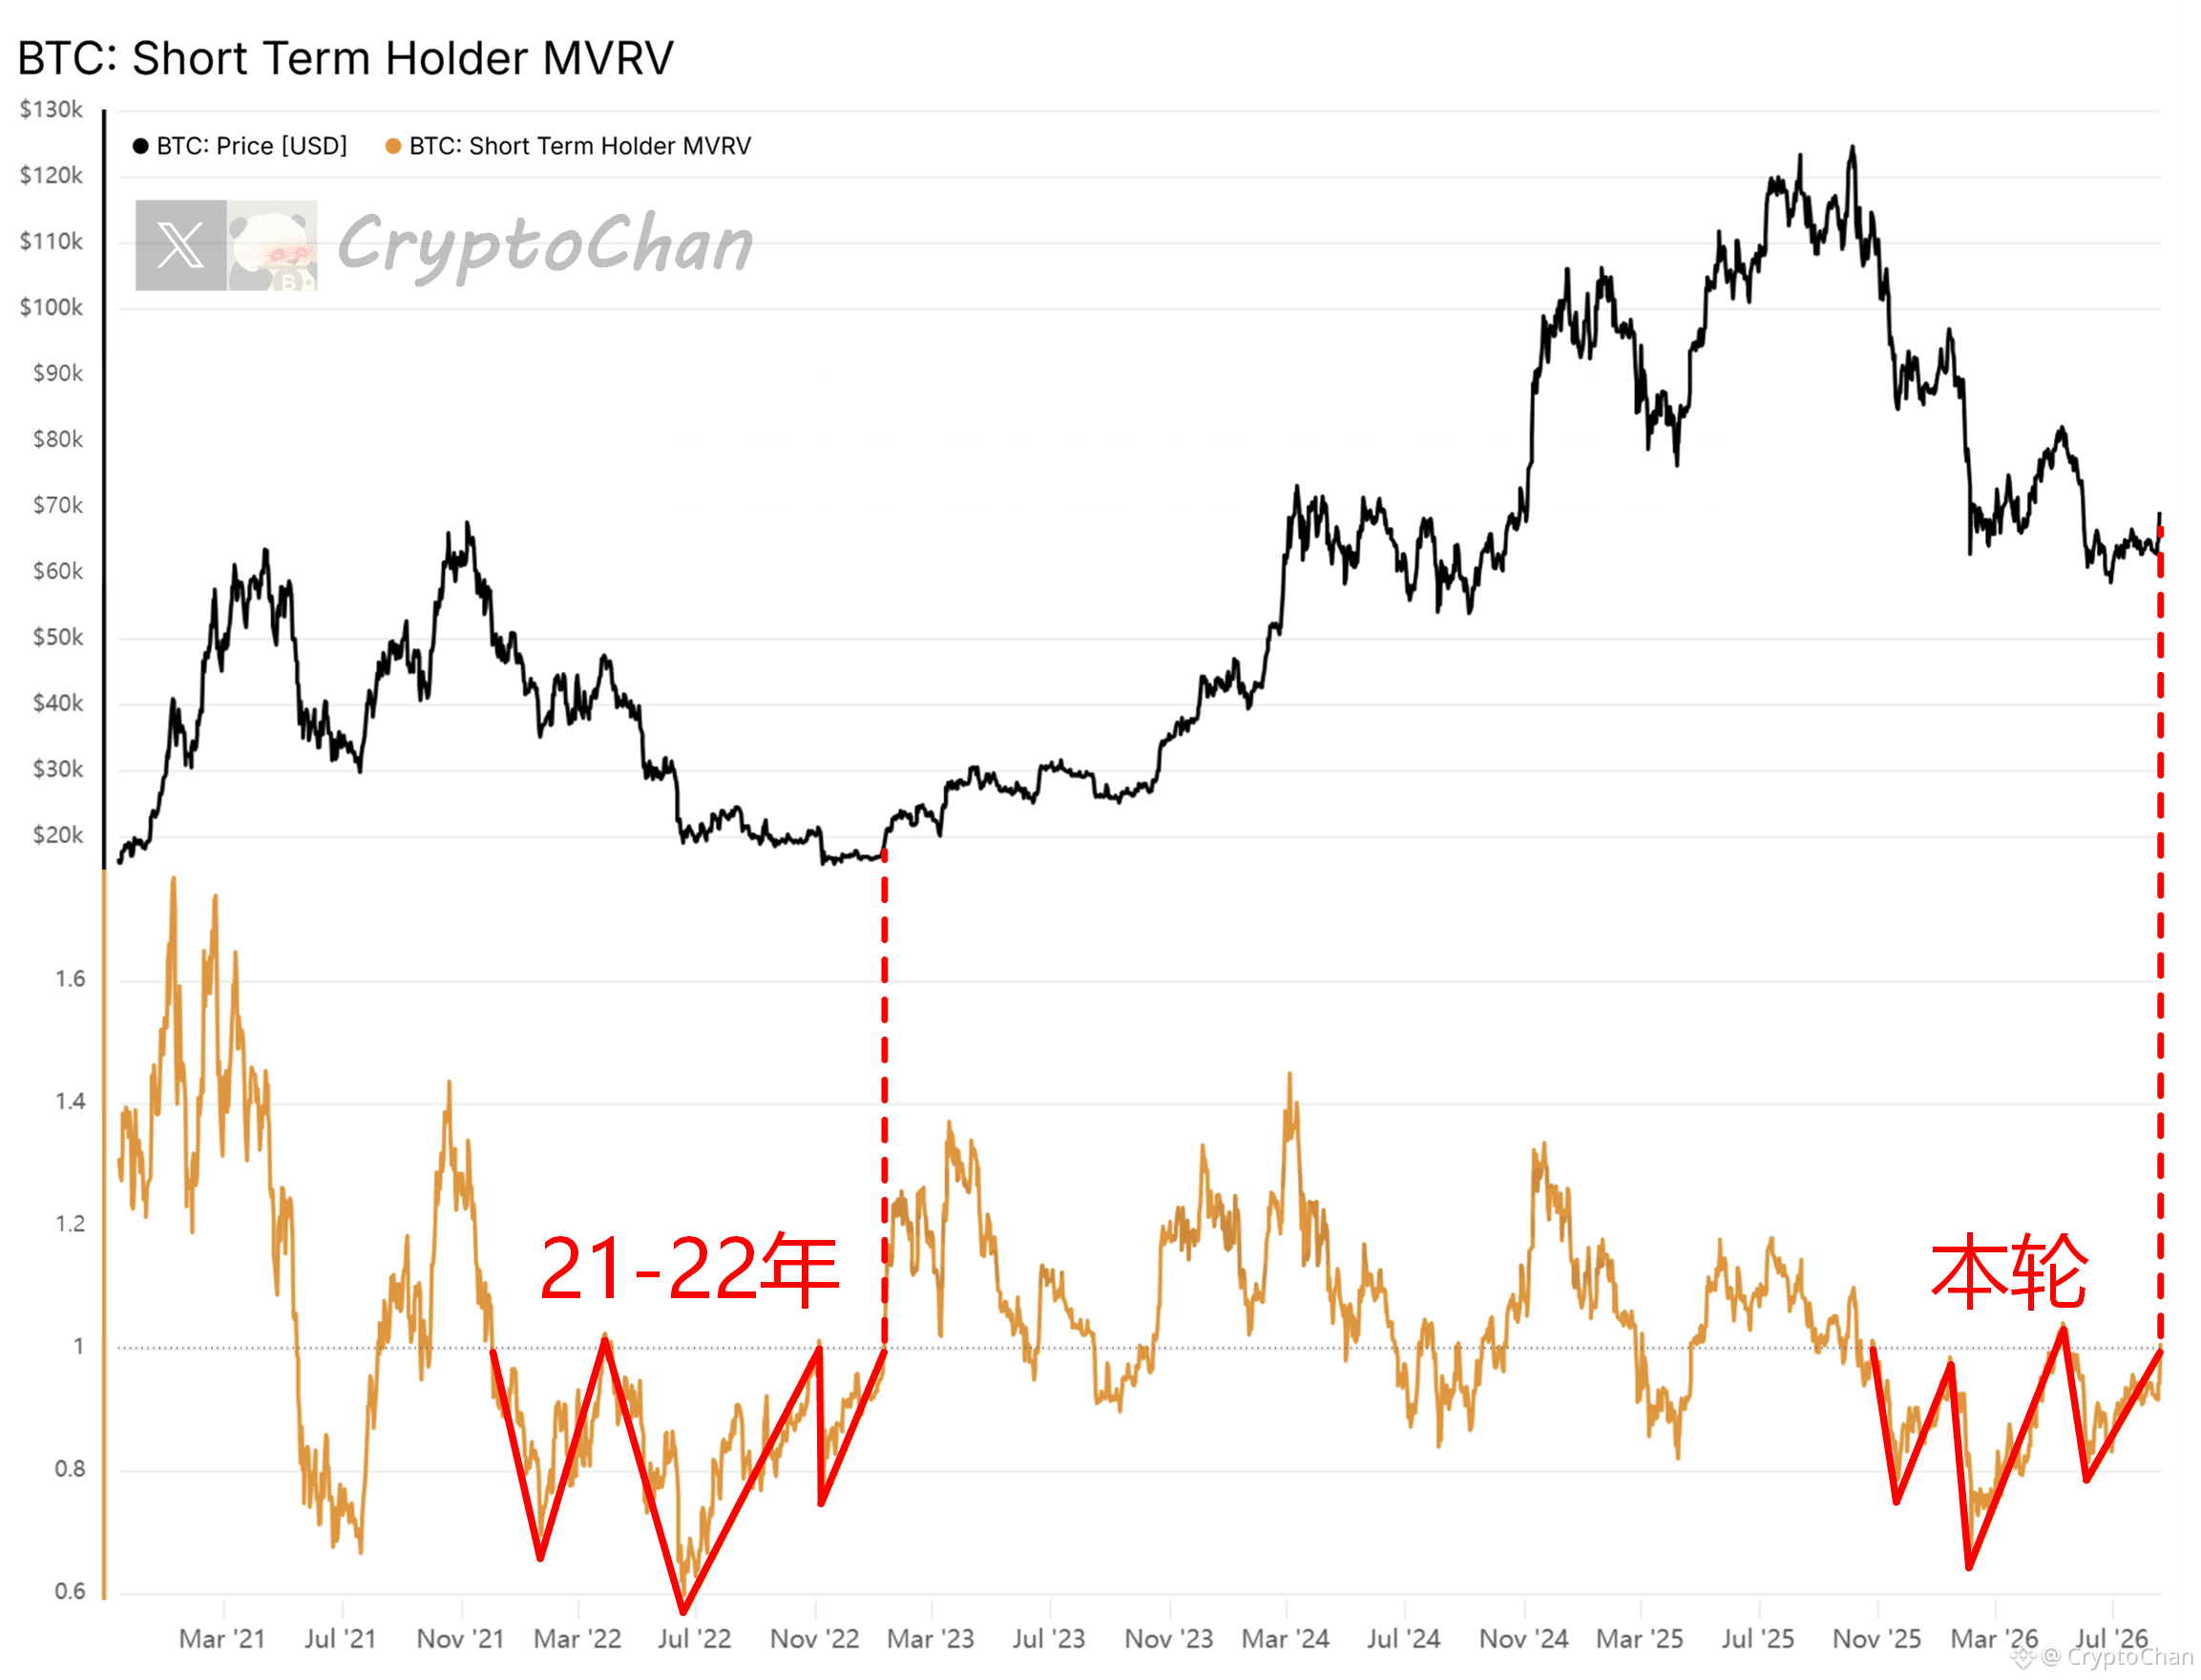
The classic “three-stage bottoming” is concluding as expected 🧘♂️
┌── 🐼 On-chain Data Details ──┐
📊 Bitcoin STH-MVRV is perfectly replaying the bottoming fractal structure from 2021–2022
Observe the red line in the chart. After Bitcoin’s STH-MVRV breaks below 1.0 (the short-term investor breakeven line), it doesn’t immediately reverse; instead, it forms a classic “three-stage bottoming” structure:
1️⃣ First breakdown: A wave of panic selling emerges, dropping below 1.0
2️⃣ Deep washout: After a rebound to 1.0 meets resistance, the largest-magnitude second dip occurs (the deepest spike/bottom in the chart)
3️⃣ Convergence confirmation: We are currently in the late stage of the third bottom of this “round”—the lows begin to rise, forming a local-convergence W-bottom variant
History won’t repeat itself exactly, but it often follows similar rhythms. The previous two deep declines have already completed the cleansing of shaky holdings. Once the indicator turns bullish, breaks through, and holds above 1.0, it means short-term capital has fully shaken off losses—then the trend will enter a true right-side reversal.
💡 Want to catch such on-chain anomalies as they happen? Unlock my X (formerly Twitter) platform exclusive subscription service to receive the complete 【Bear Market Bottoming Signal】 and 【Bull Market Top-Escape Warning】, so you can seize the crucial turning points of every cycle 👇
https://x.com/0xCryptoChan/creator-subscriptions/subscribe
The classic “three-stage bottoming” is concluding as expected 🧘♂️
┌── 🐼 On-chain Data Details ──┐
📊 Bitcoin STH-MVRV is perfectly replaying the bottoming fractal structure from 2021–2022
Observe the red line in the chart. After Bitcoin’s STH-MVRV breaks below 1.0 (the short-term investor breakeven line), it doesn’t immediately reverse; instead, it forms a classic “three-stage bottoming” structure:
1️⃣ First breakdown: A wave of panic selling emerges, dropping below 1.0
2️⃣ Deep washout: After a rebound to 1.0 meets resistance, the largest-magnitude second dip occurs (the deepest spike/bottom in the chart)
3️⃣ Convergence confirmation: We are currently in the late stage of the third bottom of this “round”—the lows begin to rise, forming a local-convergence W-bottom variant
History won’t repeat itself exactly, but it often follows similar rhythms. The previous two deep declines have already completed the cleansing of shaky holdings. Once the indicator turns bullish, breaks through, and holds above 1.0, it means short-term capital has fully shaken off losses—then the trend will enter a true right-side reversal.
💡 Want to catch such on-chain anomalies as they happen? Unlock my X (formerly Twitter) platform exclusive subscription service to receive the complete 【Bear Market Bottoming Signal】 and 【Bull Market Top-Escape Warning】, so you can seize the crucial turning points of every cycle 👇
https://x.com/0xCryptoChan/creator-subscriptions/subscribe
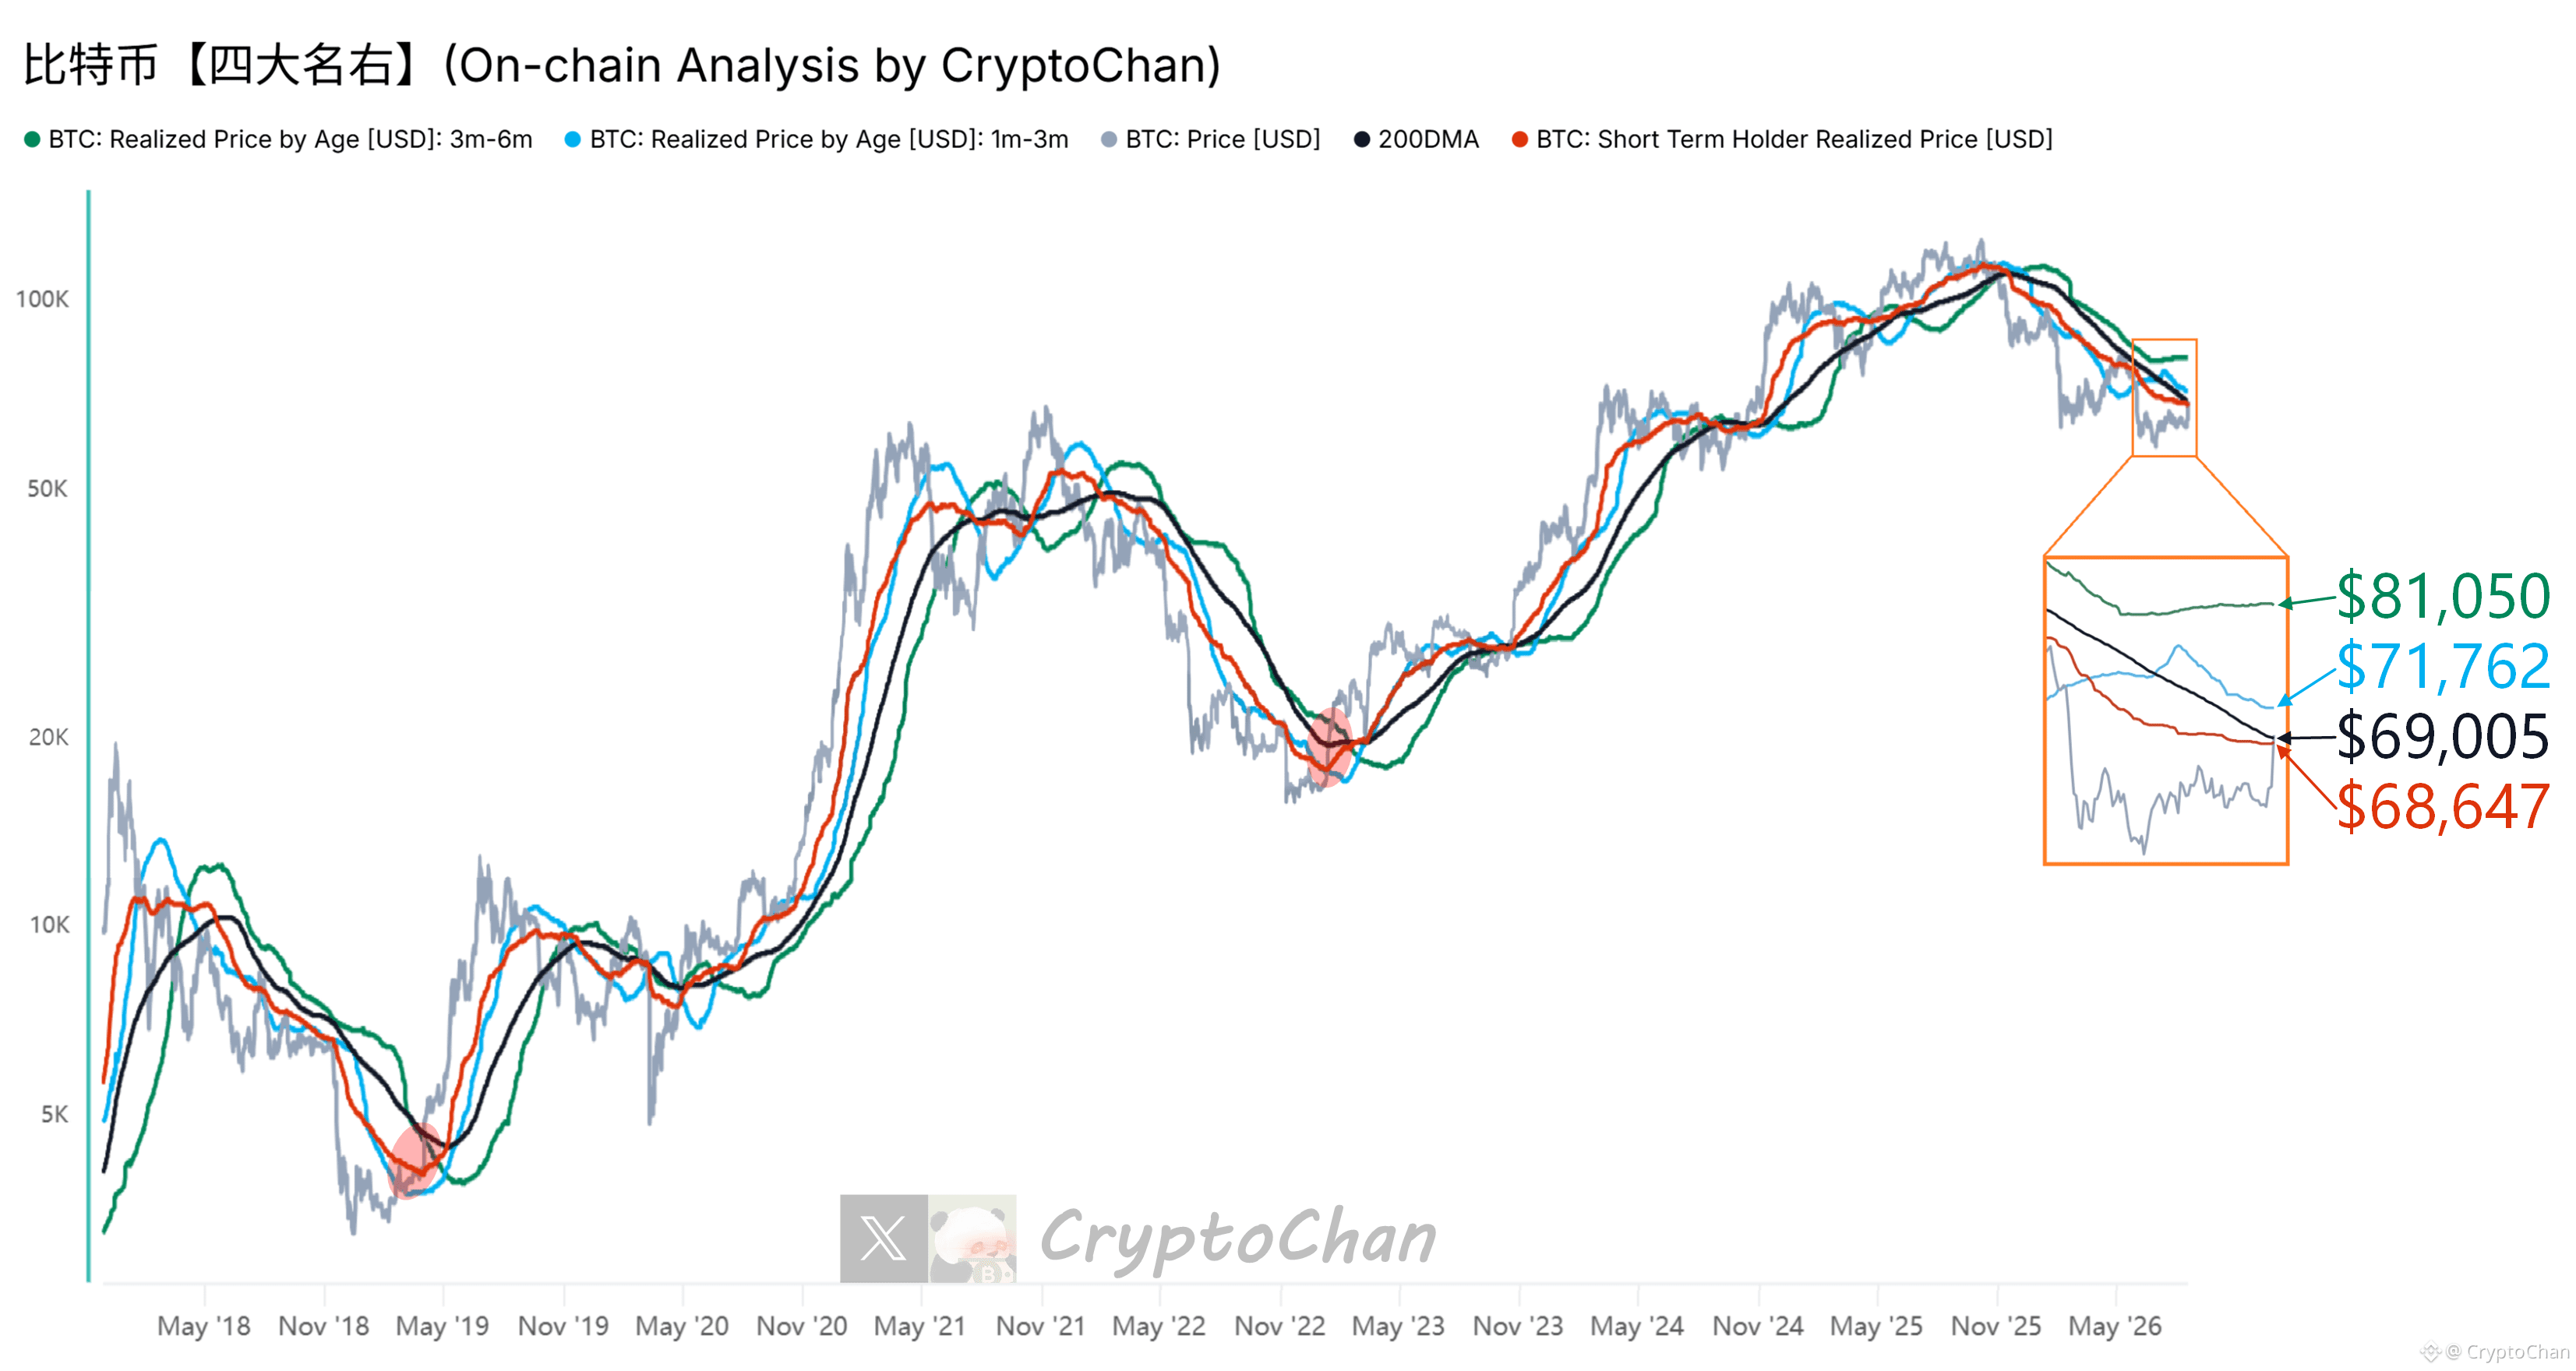
【 $BTC Panda bottom right-side series 01】
Currently, the “Four Great Ming Right” has already surpassed two of them
┌── 🐼 On-chain Data Details ──┐
Green line: The average purchase cost of the chips held on-chain for durations of 3–6 months
Blue line: The average purchase cost of the chips held on-chain for durations of 1–3 months
Black line: Coin price 200-day moving average
Red line: The average purchase cost of chips held by short-term holders on-chain
Currently, the “Four Great Ming Right” has already surpassed two of them
┌── 🐼 On-chain Data Details ──┐
Green line: The average purchase cost of the chips held on-chain for durations of 3–6 months
Blue line: The average purchase cost of the chips held on-chain for durations of 1–3 months
Black line: Coin price 200-day moving average
Red line: The average purchase cost of chips held by short-term holders on-chain
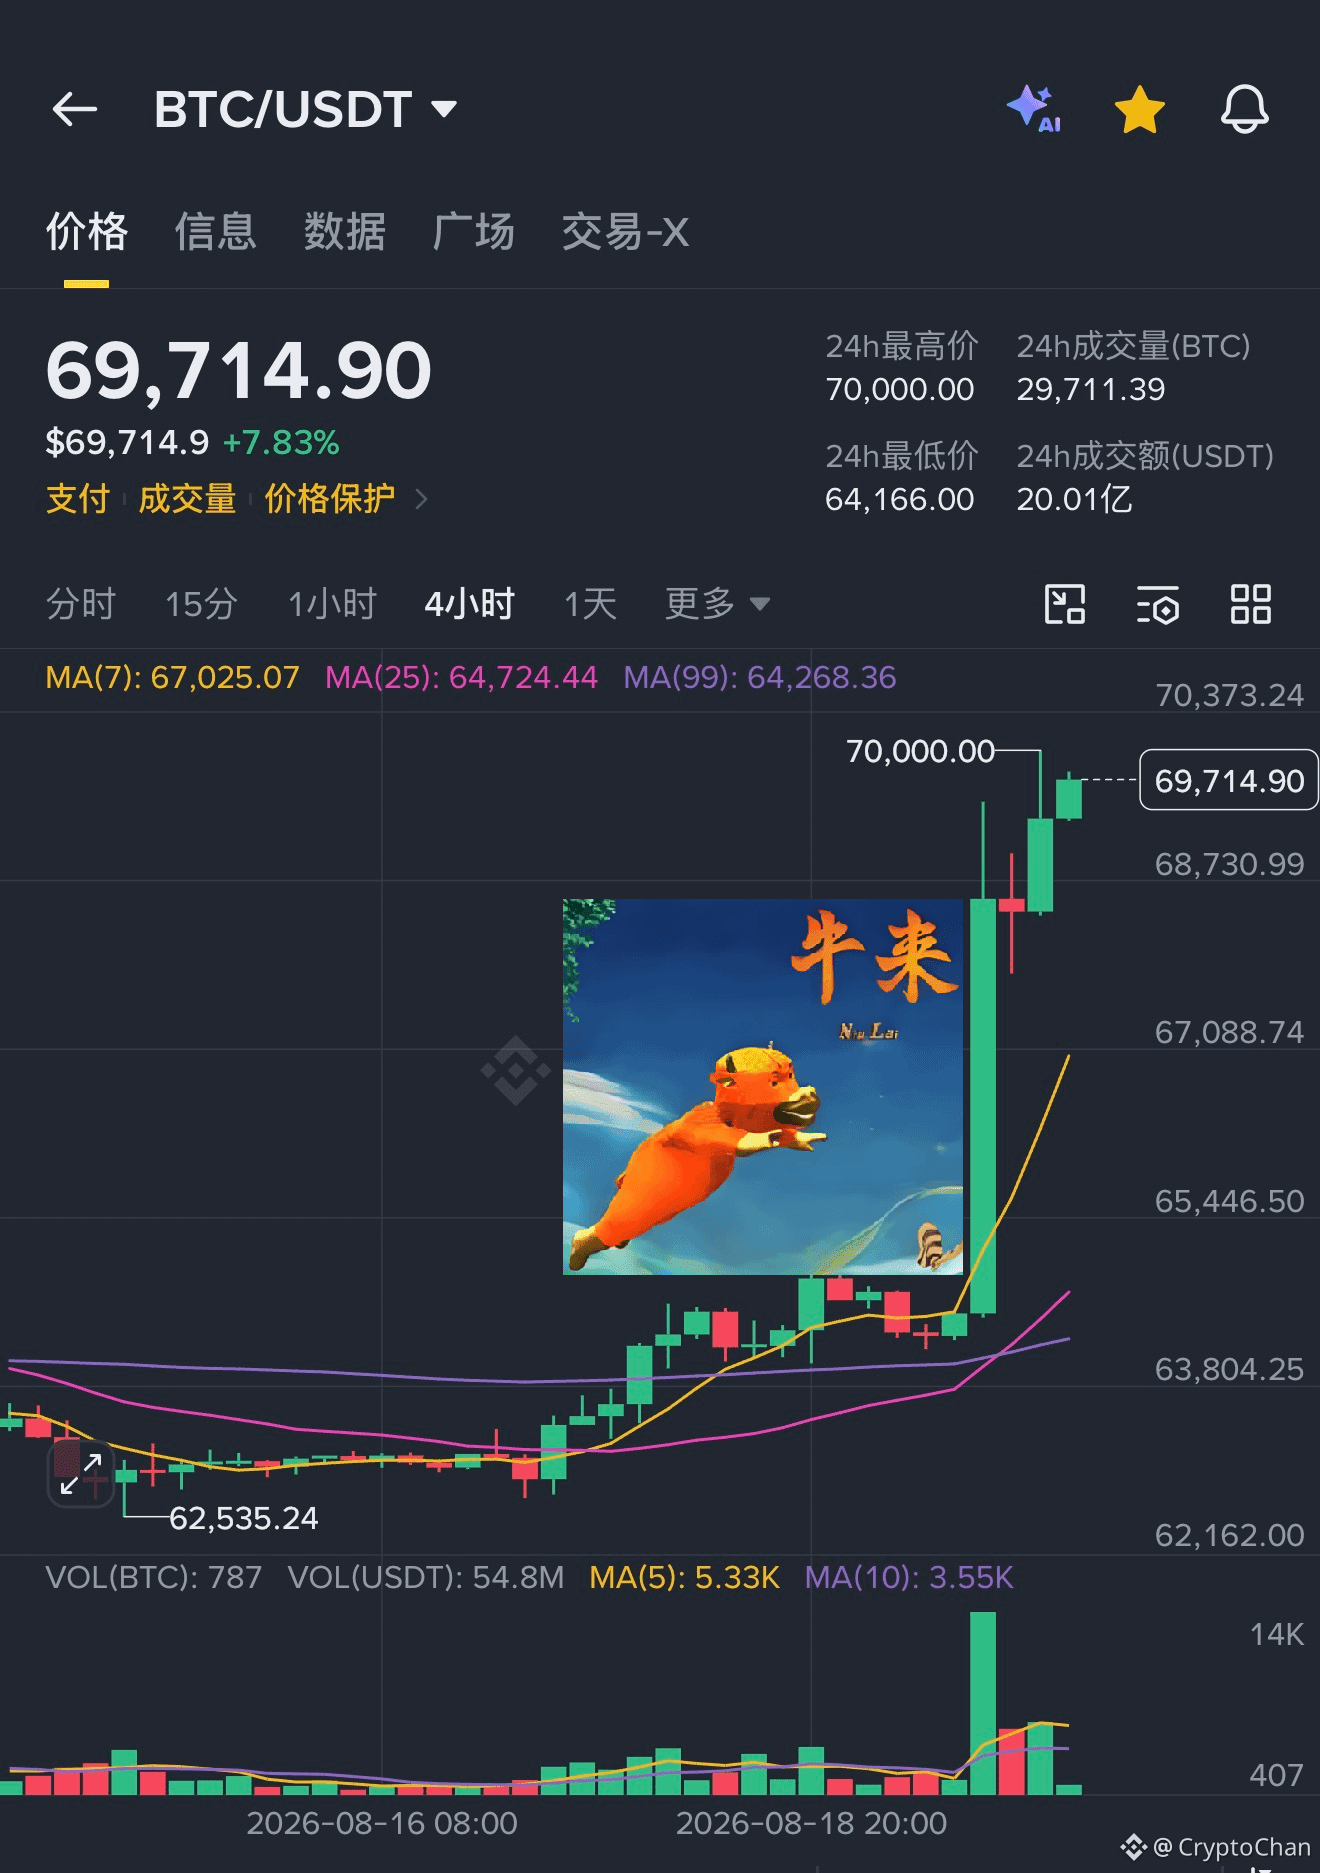
Let me put my hands on my hips for a moment—also, the left side of Xiao Qiong is pretty much done with the subscription so far 😎
CryptoChan
·
--
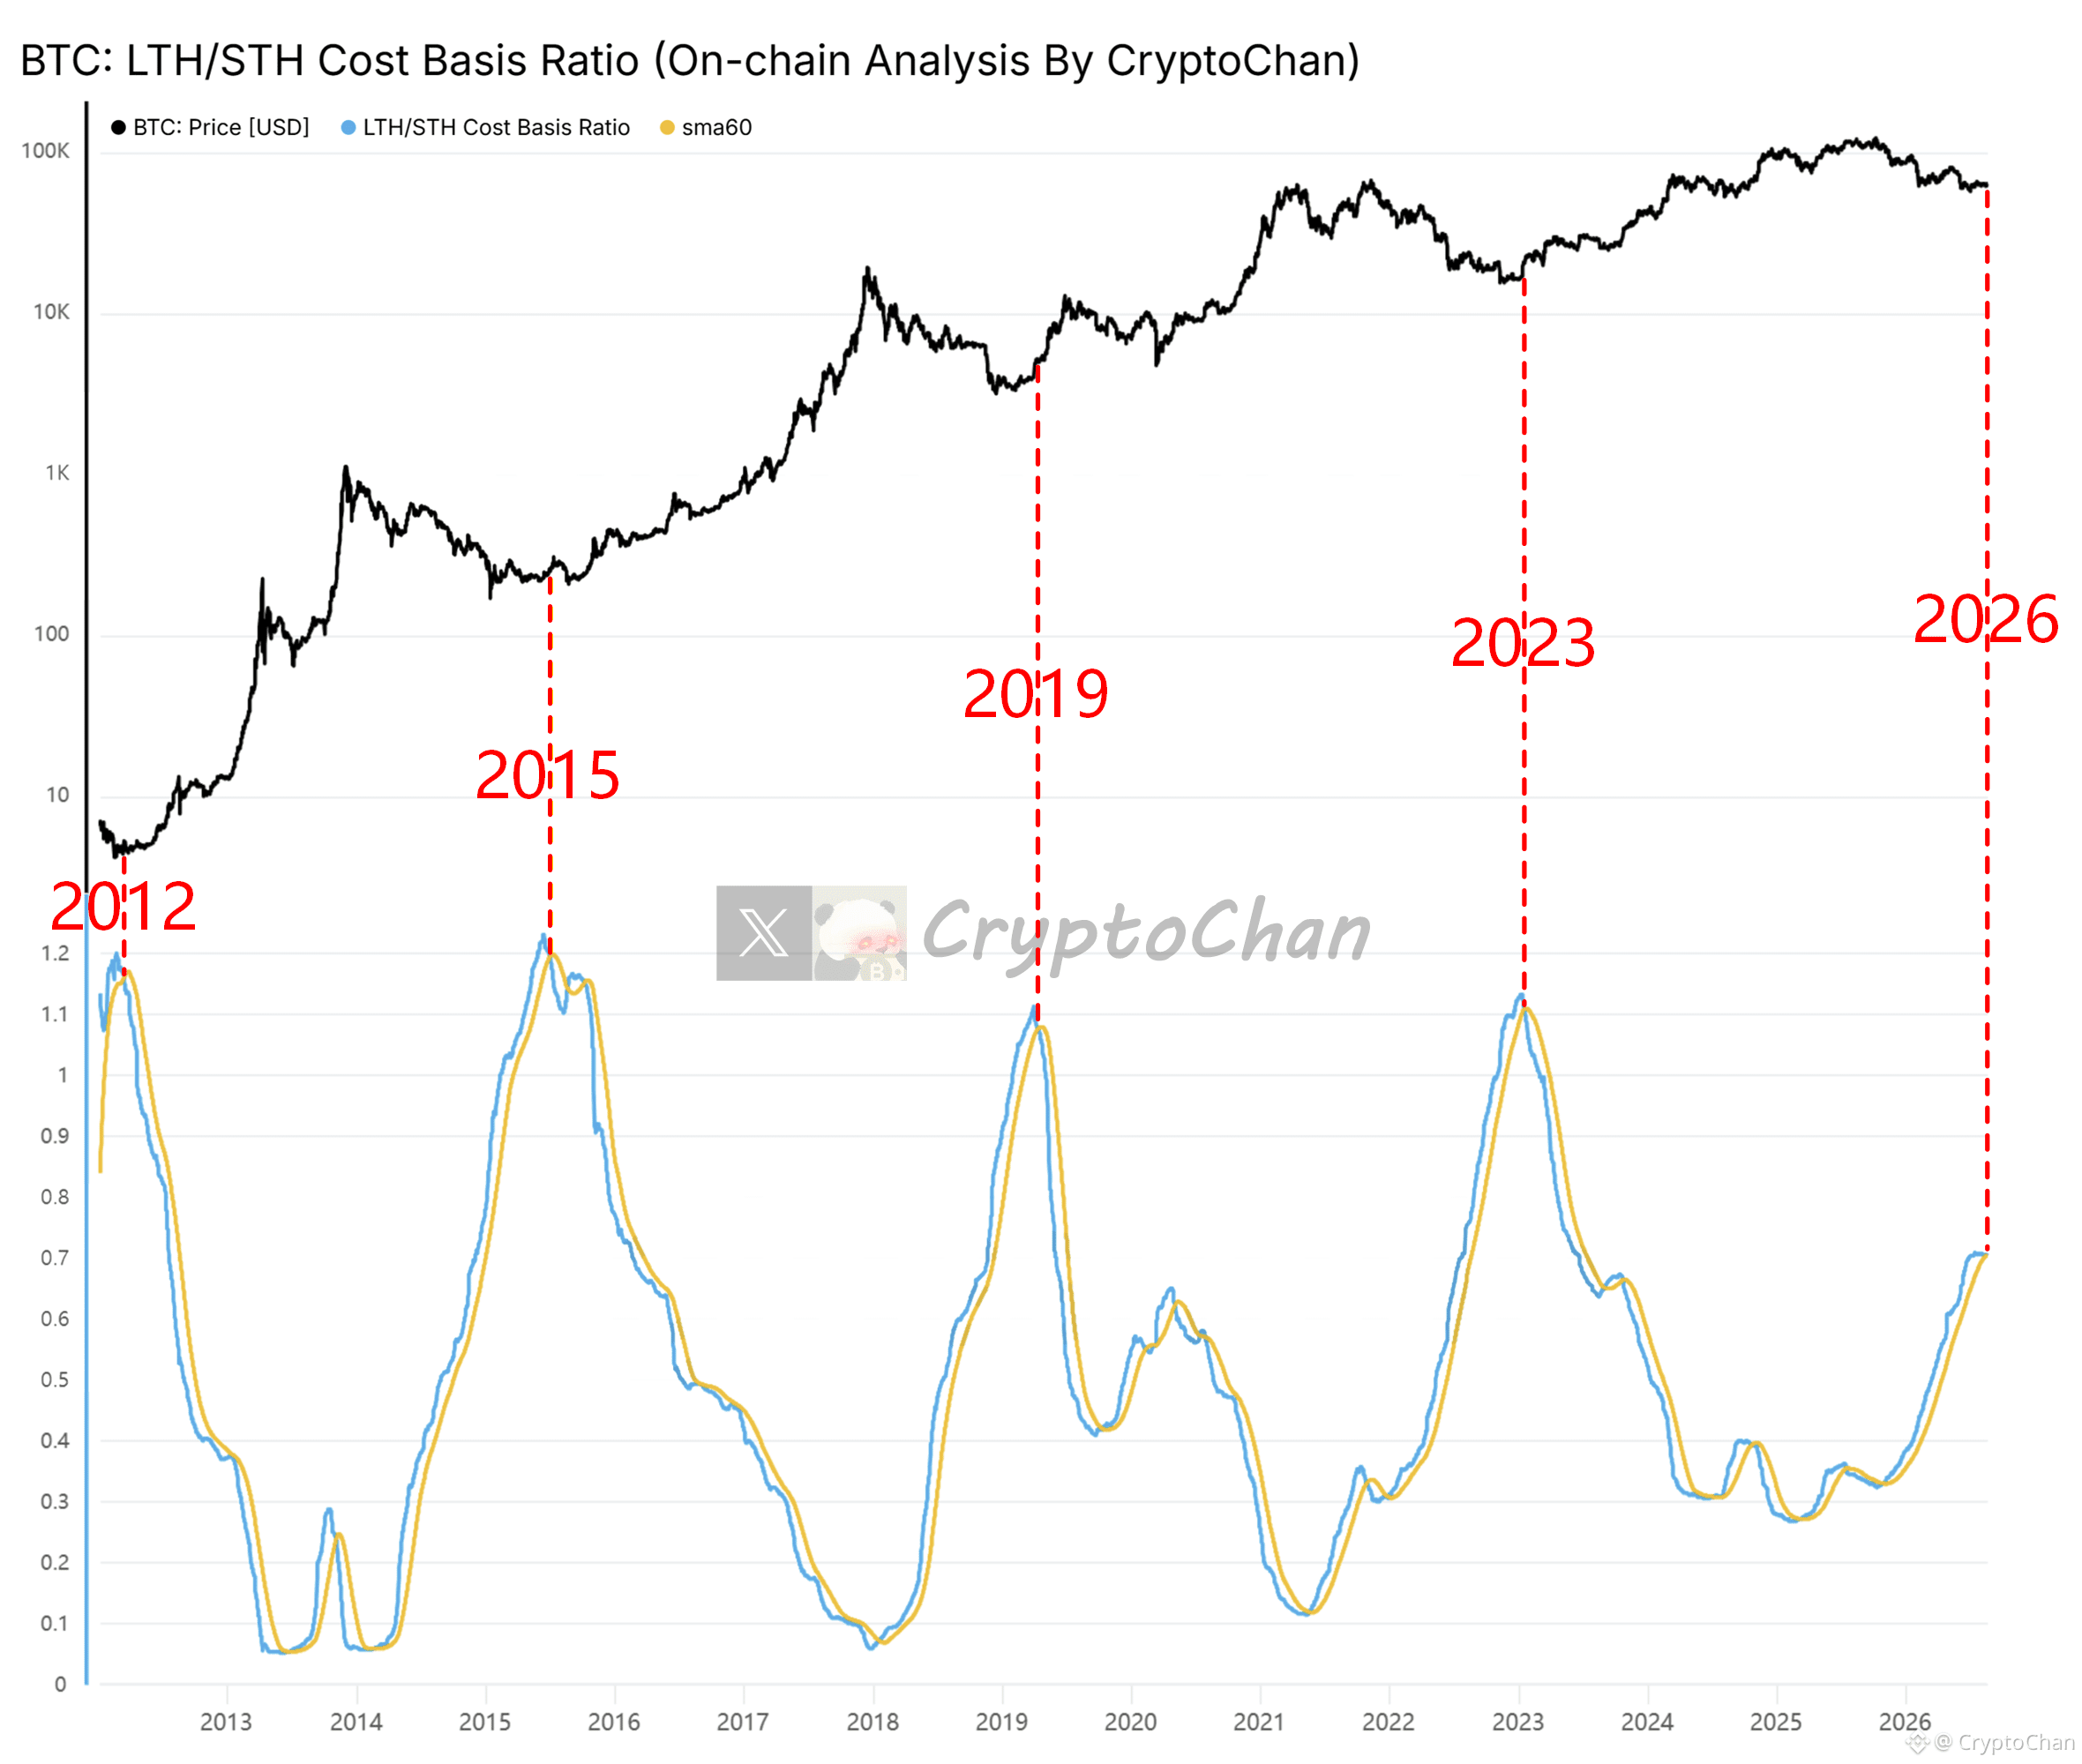
Cow's coming!!️【$BTC four-year cycle total engraving series 49】
March 2012: Blue-Orange crossover
July 2015: Blue-Orange crossover
April 2019: Blue-Orange crossover
January 2023: Blue-Orange crossover
Current: Blue and Orange have crossed
┌─ 🐼 On-chain data details ─┐
The blue line is the ratio of “average purchase cost of long-term on-chain holders” to “average purchase cost of short-term on-chain holders”; the orange line is the blue line’s 60-day MA.
Historically, Blue-Orange crossovers often correspond to the end of a bear market and the start of a bull market
March 2012: Blue-Orange crossover
July 2015: Blue-Orange crossover
April 2019: Blue-Orange crossover
January 2023: Blue-Orange crossover
Current: Blue and Orange have crossed
┌─ 🐼 On-chain data details ─┐
The blue line is the ratio of “average purchase cost of long-term on-chain holders” to “average purchase cost of short-term on-chain holders”; the orange line is the blue line’s 60-day MA.
Historically, Blue-Orange crossovers often correspond to the end of a bear market and the start of a bull market
Cow's coming!!️【$BTC four-year cycle total engraving series 49】
March 2012: Blue-Orange crossover
July 2015: Blue-Orange crossover
April 2019: Blue-Orange crossover
January 2023: Blue-Orange crossover
Current: Blue and Orange have crossed
┌─ 🐼 On-chain data details ─┐
The blue line is the ratio of “average purchase cost of long-term on-chain holders” to “average purchase cost of short-term on-chain holders”; the orange line is the blue line’s 60-day MA.
Historically, Blue-Orange crossovers often correspond to the end of a bear market and the start of a bull market
March 2012: Blue-Orange crossover
July 2015: Blue-Orange crossover
April 2019: Blue-Orange crossover
January 2023: Blue-Orange crossover
Current: Blue and Orange have crossed
┌─ 🐼 On-chain data details ─┐
The blue line is the ratio of “average purchase cost of long-term on-chain holders” to “average purchase cost of short-term on-chain holders”; the orange line is the blue line’s 60-day MA.
Historically, Blue-Orange crossovers often correspond to the end of a bear market and the start of a bull market
CryptoChan
·
--
Everything is ready; all that’s left is X5😏
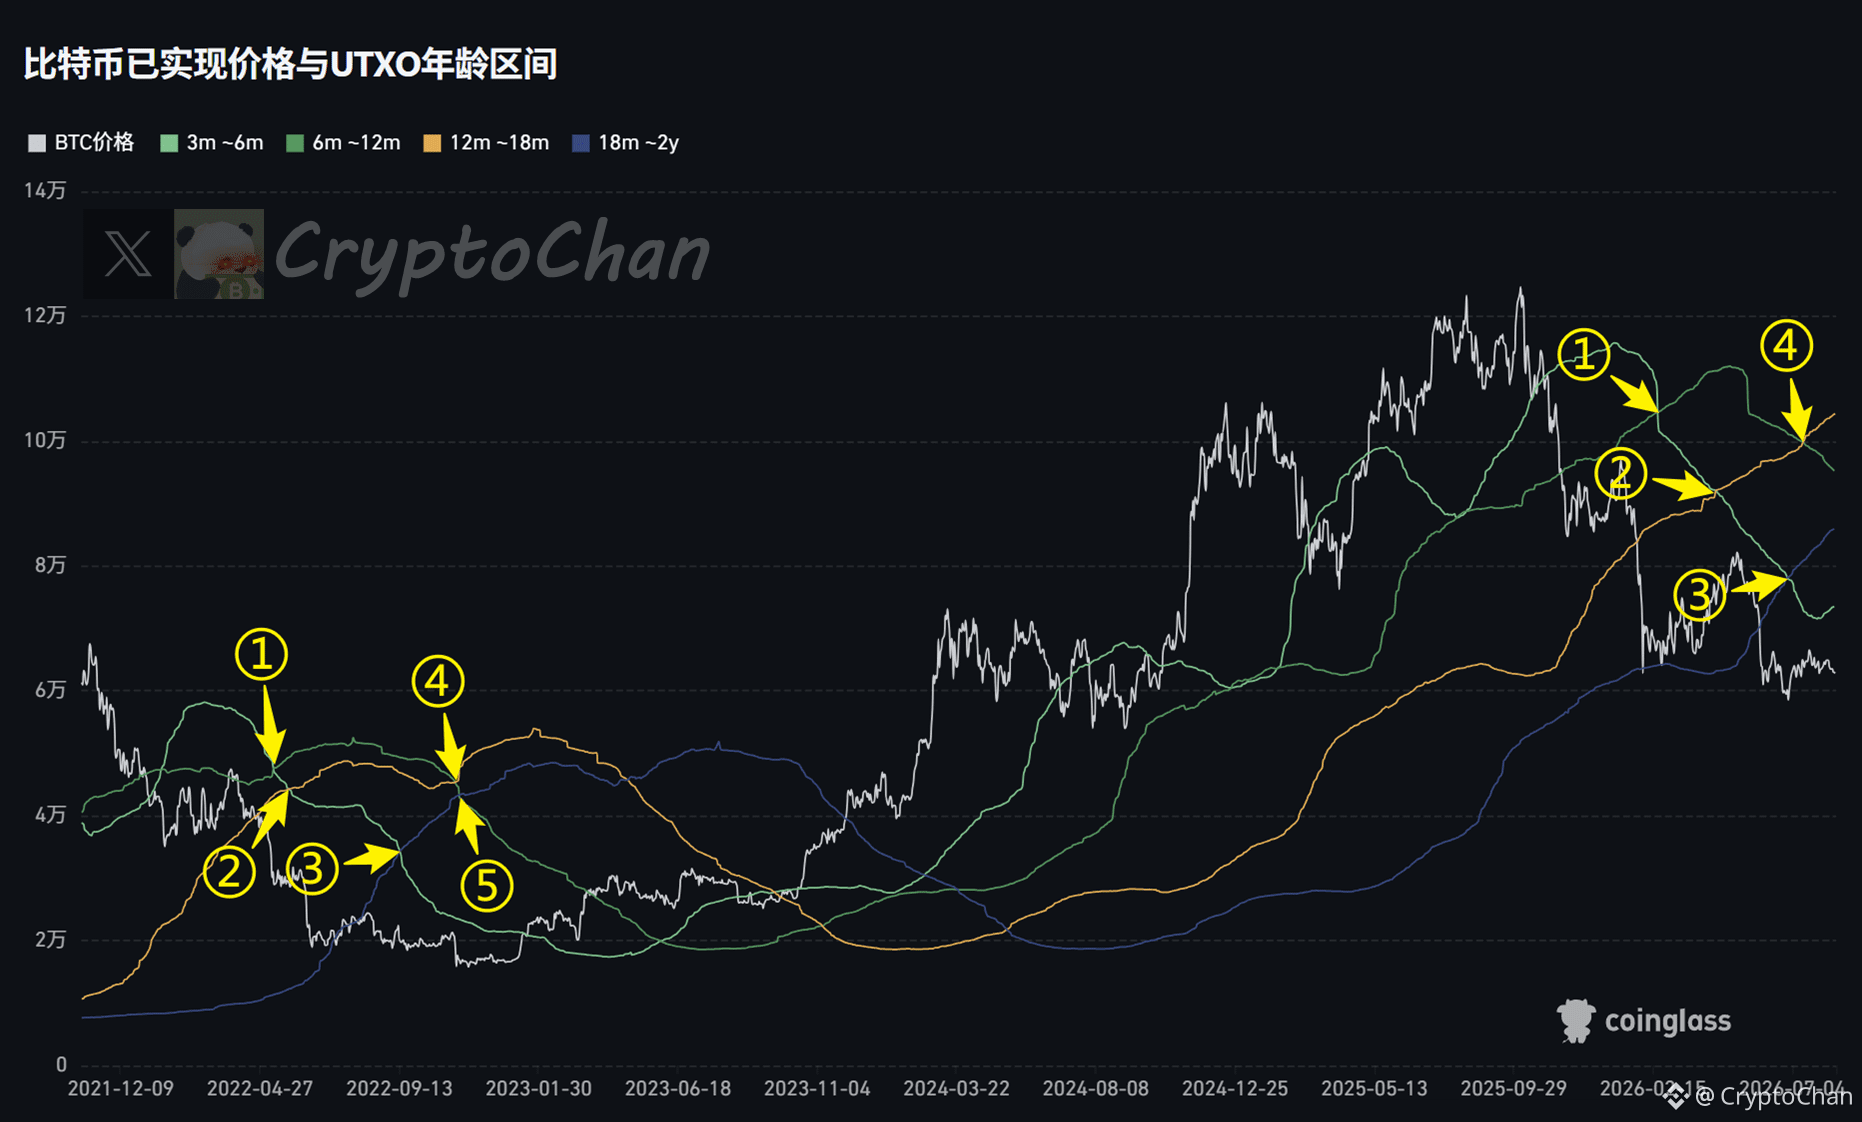
【$BTC Four-Year Cycle Total Engraving Series (48)】
In 2022, Bear Comes, Branch ①: light green line goes below the dark green line
In 2022, Bear Comes, Branch ②: light green line goes below the orange-yellow line
In 2022, Bear Comes, Branch ③: light green line goes below the blue-violet line
In 2022, Bear Comes, Branch ④: dark green line goes below the orange-yellow line
In 2022, Bear Comes, Branch ⑤: dark green line goes below the blue-violet line
In 2026, Bear Comes, Branch ①: light green line goes below the dark green line (achieved)
In 2026, Bear Comes, Branch ②: light green line goes below the orange-yellow line (achieved)
In 2026, Bear Comes, Branch ③: light green line goes below the blue-violet line (achieved)
In 2026, Bear Comes, Branch ④: dark green line goes below the orange-yellow line (achieved)
In 2026, Bear Comes, Branch ⑤: not yet achieved
┌── 🐼 On-chain Data Details ──┐
Gray-white line: Bitcoin price
Light green line: average buy-in cost of on-chain holdings when holding duration is between 3–6 months (current $73,577)
Dark green line: average buy-in cost of on-chain holdings when holding duration is between 6–12 months (current $95,129)
Orange-yellow line: average buy-in cost of on-chain holdings when holding duration is between 12–18 months (current $104,382)
Blue-violet line: average buy-in cost of on-chain holdings when holding duration is between 18–24 months (current $85,994)
【$BTC Four-Year Cycle Total Engraving Series (48)】
In 2022, Bear Comes, Branch ①: light green line goes below the dark green line
In 2022, Bear Comes, Branch ②: light green line goes below the orange-yellow line
In 2022, Bear Comes, Branch ③: light green line goes below the blue-violet line
In 2022, Bear Comes, Branch ④: dark green line goes below the orange-yellow line
In 2022, Bear Comes, Branch ⑤: dark green line goes below the blue-violet line
In 2026, Bear Comes, Branch ①: light green line goes below the dark green line (achieved)
In 2026, Bear Comes, Branch ②: light green line goes below the orange-yellow line (achieved)
In 2026, Bear Comes, Branch ③: light green line goes below the blue-violet line (achieved)
In 2026, Bear Comes, Branch ④: dark green line goes below the orange-yellow line (achieved)
In 2026, Bear Comes, Branch ⑤: not yet achieved
┌── 🐼 On-chain Data Details ──┐
Gray-white line: Bitcoin price
Light green line: average buy-in cost of on-chain holdings when holding duration is between 3–6 months (current $73,577)
Dark green line: average buy-in cost of on-chain holdings when holding duration is between 6–12 months (current $95,129)
Orange-yellow line: average buy-in cost of on-chain holdings when holding duration is between 12–18 months (current $104,382)
Blue-violet line: average buy-in cost of on-chain holdings when holding duration is between 18–24 months (current $85,994)
Everything is ready; all that’s left is X5😏
【$BTC Four-Year Cycle Total Engraving Series (48)】
In 2022, Bear Comes, Branch ①: light green line goes below the dark green line
In 2022, Bear Comes, Branch ②: light green line goes below the orange-yellow line
In 2022, Bear Comes, Branch ③: light green line goes below the blue-violet line
In 2022, Bear Comes, Branch ④: dark green line goes below the orange-yellow line
In 2022, Bear Comes, Branch ⑤: dark green line goes below the blue-violet line
In 2026, Bear Comes, Branch ①: light green line goes below the dark green line (achieved)
In 2026, Bear Comes, Branch ②: light green line goes below the orange-yellow line (achieved)
In 2026, Bear Comes, Branch ③: light green line goes below the blue-violet line (achieved)
In 2026, Bear Comes, Branch ④: dark green line goes below the orange-yellow line (achieved)
In 2026, Bear Comes, Branch ⑤: not yet achieved
┌── 🐼 On-chain Data Details ──┐
Gray-white line: Bitcoin price
Light green line: average buy-in cost of on-chain holdings when holding duration is between 3–6 months (current $73,577)
Dark green line: average buy-in cost of on-chain holdings when holding duration is between 6–12 months (current $95,129)
Orange-yellow line: average buy-in cost of on-chain holdings when holding duration is between 12–18 months (current $104,382)
Blue-violet line: average buy-in cost of on-chain holdings when holding duration is between 18–24 months (current $85,994)
【$BTC Four-Year Cycle Total Engraving Series (48)】
In 2022, Bear Comes, Branch ①: light green line goes below the dark green line
In 2022, Bear Comes, Branch ②: light green line goes below the orange-yellow line
In 2022, Bear Comes, Branch ③: light green line goes below the blue-violet line
In 2022, Bear Comes, Branch ④: dark green line goes below the orange-yellow line
In 2022, Bear Comes, Branch ⑤: dark green line goes below the blue-violet line
In 2026, Bear Comes, Branch ①: light green line goes below the dark green line (achieved)
In 2026, Bear Comes, Branch ②: light green line goes below the orange-yellow line (achieved)
In 2026, Bear Comes, Branch ③: light green line goes below the blue-violet line (achieved)
In 2026, Bear Comes, Branch ④: dark green line goes below the orange-yellow line (achieved)
In 2026, Bear Comes, Branch ⑤: not yet achieved
┌── 🐼 On-chain Data Details ──┐
Gray-white line: Bitcoin price
Light green line: average buy-in cost of on-chain holdings when holding duration is between 3–6 months (current $73,577)
Dark green line: average buy-in cost of on-chain holdings when holding duration is between 6–12 months (current $95,129)
Orange-yellow line: average buy-in cost of on-chain holdings when holding duration is between 12–18 months (current $104,382)
Blue-violet line: average buy-in cost of on-chain holdings when holding duration is between 18–24 months (current $85,994)
CryptoChan
·
--
【 $BTC Four-Year Cycle Total Mark Series (47)】
LTH cut-loss size—one round is tougher than the next 😎
┌── 🐼 On-chain Data Details ──┐
The indicator at the bottom of the chart is for BTC: Relative Long/Short-Term Holder Realized Profit/Loss to Exchanges — specifically the LTH Realized Loss sub-item
LTH Realized Loss (the portion flowing into exchanges) refers to: the total loss amount (typically calculated in USD) that long-term holders (LTH, holding for ≥ about 155 days) realize when transferring BTC into an exchange at a price below their cost basis, expressed as a share
This indicator mainly reflects: the scale of deposits to exchanges and readiness to sell off by long-term holders (“strong hands”) while they are in a losing position. The higher the value, the more it often suggests that stronger capitulation-style sell pressure appears near market bottoms
LTH cut-loss size—one round is tougher than the next 😎
┌── 🐼 On-chain Data Details ──┐
The indicator at the bottom of the chart is for BTC: Relative Long/Short-Term Holder Realized Profit/Loss to Exchanges — specifically the LTH Realized Loss sub-item
LTH Realized Loss (the portion flowing into exchanges) refers to: the total loss amount (typically calculated in USD) that long-term holders (LTH, holding for ≥ about 155 days) realize when transferring BTC into an exchange at a price below their cost basis, expressed as a share
This indicator mainly reflects: the scale of deposits to exchanges and readiness to sell off by long-term holders (“strong hands”) while they are in a losing position. The higher the value, the more it often suggests that stronger capitulation-style sell pressure appears near market bottoms
It’s about time, huh 🧔🏻♂️
CryptoChan
·
--
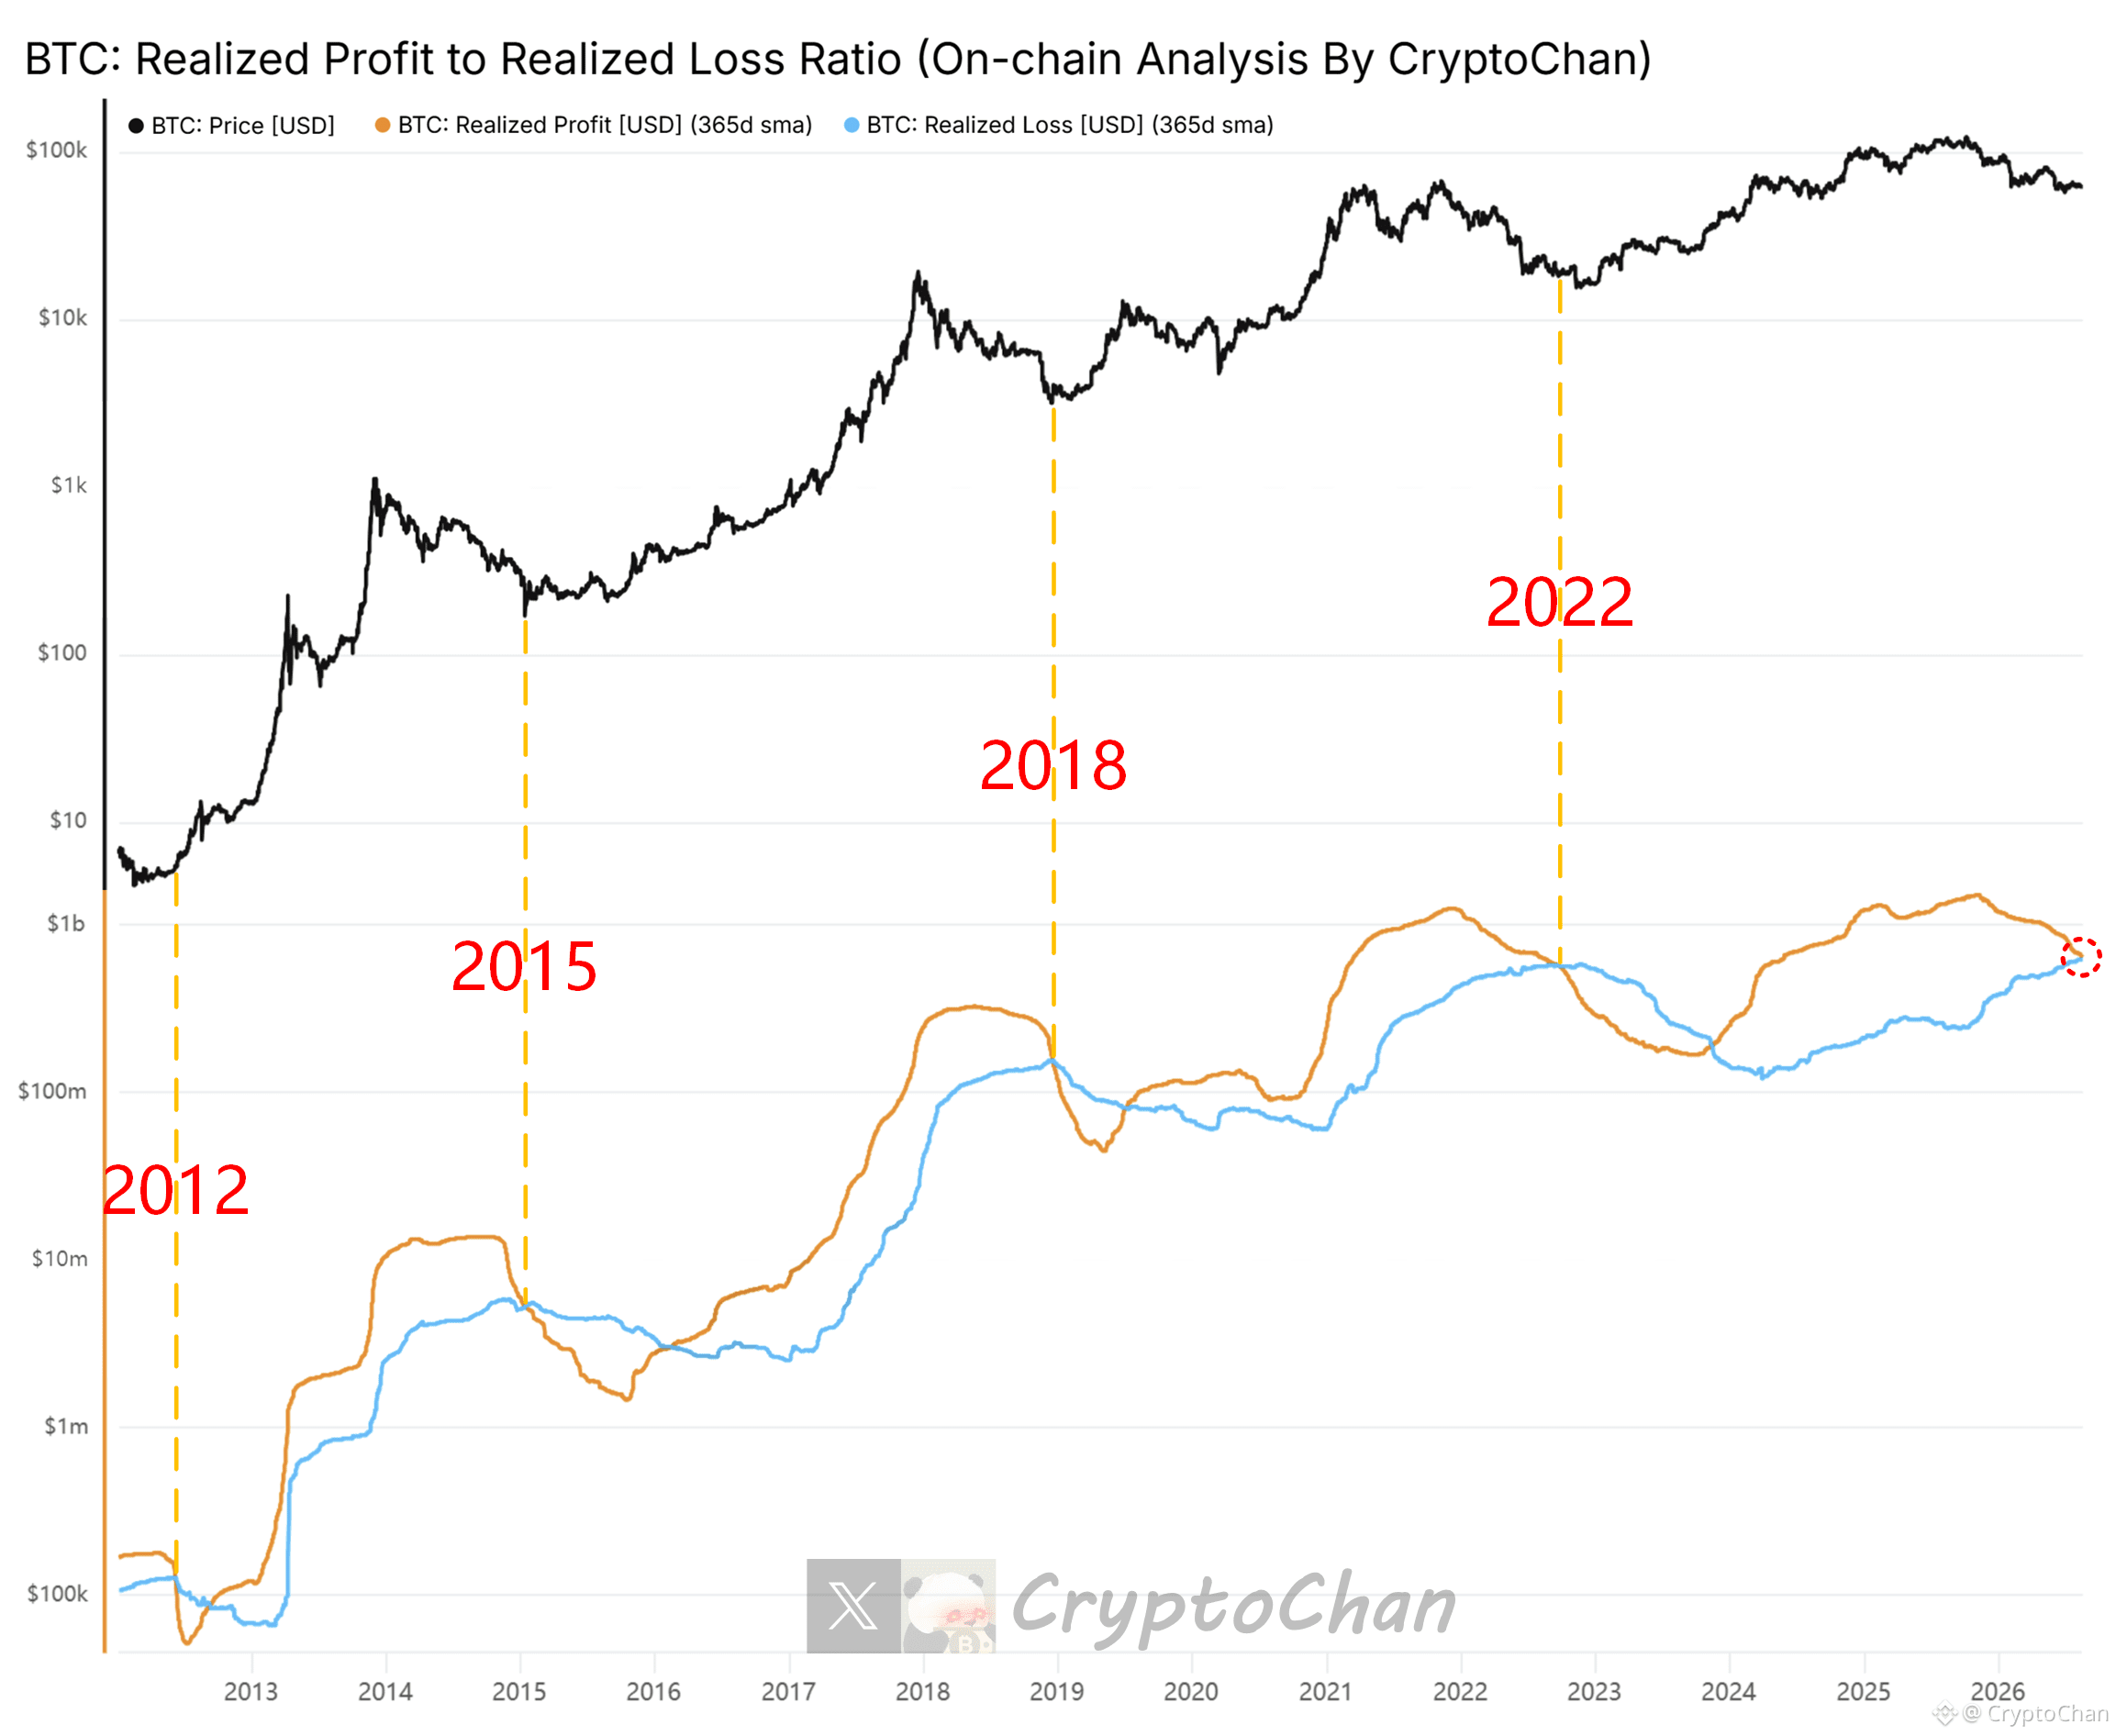
The Death Cross Continues to Close Steadily
┌── 🐼 On-Chain Data Details ──┐
The orange line indicator at the bottom of the chart is the 365-day moving average of Bitcoin realized profits; the blue line indicator is the 365-day moving average of Bitcoin realized losses.
Bitcoin realized profits: Among the Bitcoin spent (transferred) on-chain each day, the portion sold at a price higher than its previous moving (acquisition) price; the total accumulated profit amount (usually denominated in USD).
Bitcoin realized losses: The portion sold at a price lower than its previous moving price; the total accumulated loss amount.
These two are classic on-chain indicators, reflecting the actual scale of locked-in gains and losses by investors and overall market sentiment.
A downward cross of the 365-day MA of realized profits below the 365-day MA of realized losses (a death cross) means that, over the past year, the average realized losses have exceeded profits, and the market has entered a phase of deep capitulation/selling in panic. Historically, this death cross has appeared without exception near the bottom of bear markets—an ultra-high-probability cyclical bottom signal.
┌── 🐼 On-Chain Data Details ──┐
The orange line indicator at the bottom of the chart is the 365-day moving average of Bitcoin realized profits; the blue line indicator is the 365-day moving average of Bitcoin realized losses.
Bitcoin realized profits: Among the Bitcoin spent (transferred) on-chain each day, the portion sold at a price higher than its previous moving (acquisition) price; the total accumulated profit amount (usually denominated in USD).
Bitcoin realized losses: The portion sold at a price lower than its previous moving price; the total accumulated loss amount.
These two are classic on-chain indicators, reflecting the actual scale of locked-in gains and losses by investors and overall market sentiment.
A downward cross of the 365-day MA of realized profits below the 365-day MA of realized losses (a death cross) means that, over the past year, the average realized losses have exceeded profits, and the market has entered a phase of deep capitulation/selling in panic. Historically, this death cross has appeared without exception near the bottom of bear markets—an ultra-high-probability cyclical bottom signal.
🗡️Dec 2022 🐶
CryptoChan
·
--
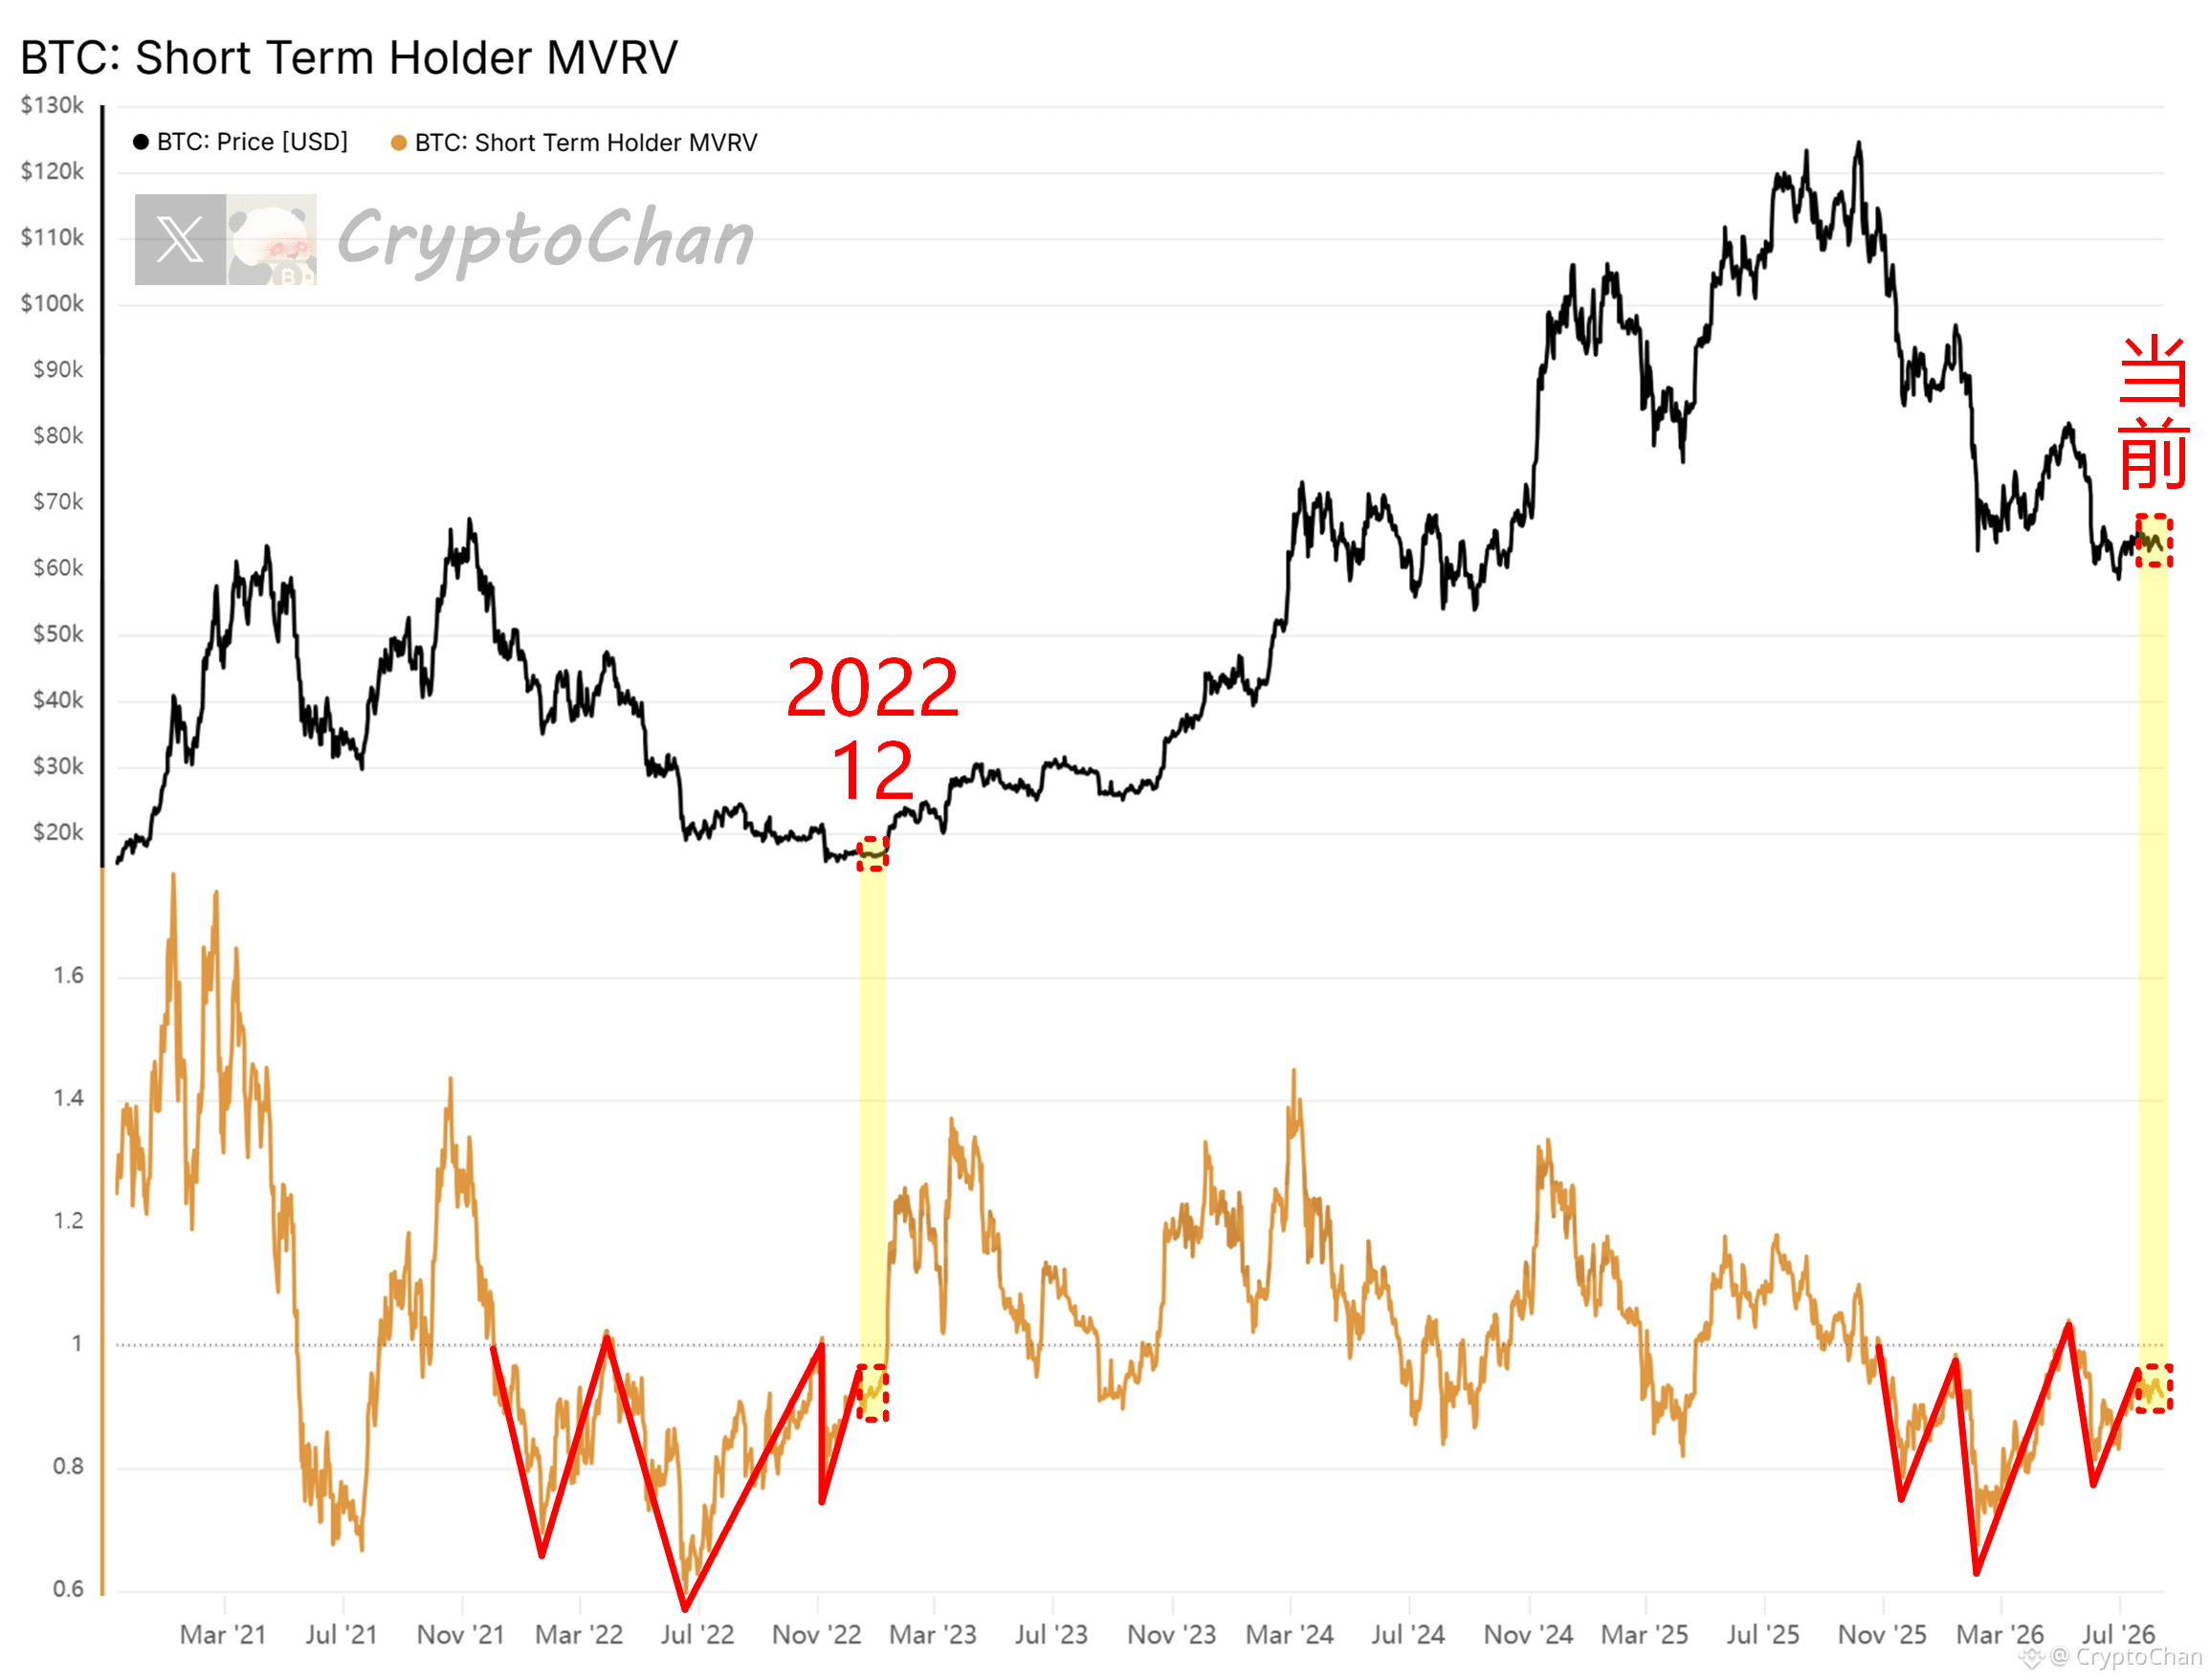
【 $BTC Four-year cycle total market-bottom series (40) 】
The classic “three-stage bottoming” is concluding as expected 🧘♂️
┌── 🐼 On-chain Data Details ──┐
📊 Bitcoin STH-MVRV is perfectly replaying the bottoming fractal structure from 2021–2022
Observe the red line in the chart. After Bitcoin’s STH-MVRV breaks below 1.0 (the short-term investor breakeven line), it doesn’t immediately reverse; instead, it forms a classic “three-stage bottoming” structure:
1️⃣ First breakdown: A wave of panic selling emerges, dropping below 1.0
2️⃣ Deep washout: After a rebound to 1.0 meets resistance, the largest-magnitude second dip occurs (the deepest spike/bottom in the chart)
3️⃣ Convergence confirmation: We are currently in the late stage of the third bottom of this “round”—the lows begin to rise, forming a local-convergence W-bottom variant
History won’t repeat itself exactly, but it often follows similar rhythms. The previous two deep declines have already completed the cleansing of shaky holdings. Once the indicator turns bullish, breaks through, and holds above 1.0, it means short-term capital has fully shaken off losses—then the trend will enter a true right-side reversal.
💡 Want to catch such on-chain anomalies as they happen? Unlock my X (formerly Twitter) platform exclusive subscription service to receive the complete 【Bear Market Bottoming Signal】 and 【Bull Market Top-Escape Warning】, so you can seize the crucial turning points of every cycle 👇
https://x.com/0xCryptoChan/creator-subscriptions/subscribe
The classic “three-stage bottoming” is concluding as expected 🧘♂️
┌── 🐼 On-chain Data Details ──┐
📊 Bitcoin STH-MVRV is perfectly replaying the bottoming fractal structure from 2021–2022
Observe the red line in the chart. After Bitcoin’s STH-MVRV breaks below 1.0 (the short-term investor breakeven line), it doesn’t immediately reverse; instead, it forms a classic “three-stage bottoming” structure:
1️⃣ First breakdown: A wave of panic selling emerges, dropping below 1.0
2️⃣ Deep washout: After a rebound to 1.0 meets resistance, the largest-magnitude second dip occurs (the deepest spike/bottom in the chart)
3️⃣ Convergence confirmation: We are currently in the late stage of the third bottom of this “round”—the lows begin to rise, forming a local-convergence W-bottom variant
History won’t repeat itself exactly, but it often follows similar rhythms. The previous two deep declines have already completed the cleansing of shaky holdings. Once the indicator turns bullish, breaks through, and holds above 1.0, it means short-term capital has fully shaken off losses—then the trend will enter a true right-side reversal.
💡 Want to catch such on-chain anomalies as they happen? Unlock my X (formerly Twitter) platform exclusive subscription service to receive the complete 【Bear Market Bottoming Signal】 and 【Bull Market Top-Escape Warning】, so you can seize the crucial turning points of every cycle 👇
https://x.com/0xCryptoChan/creator-subscriptions/subscribe
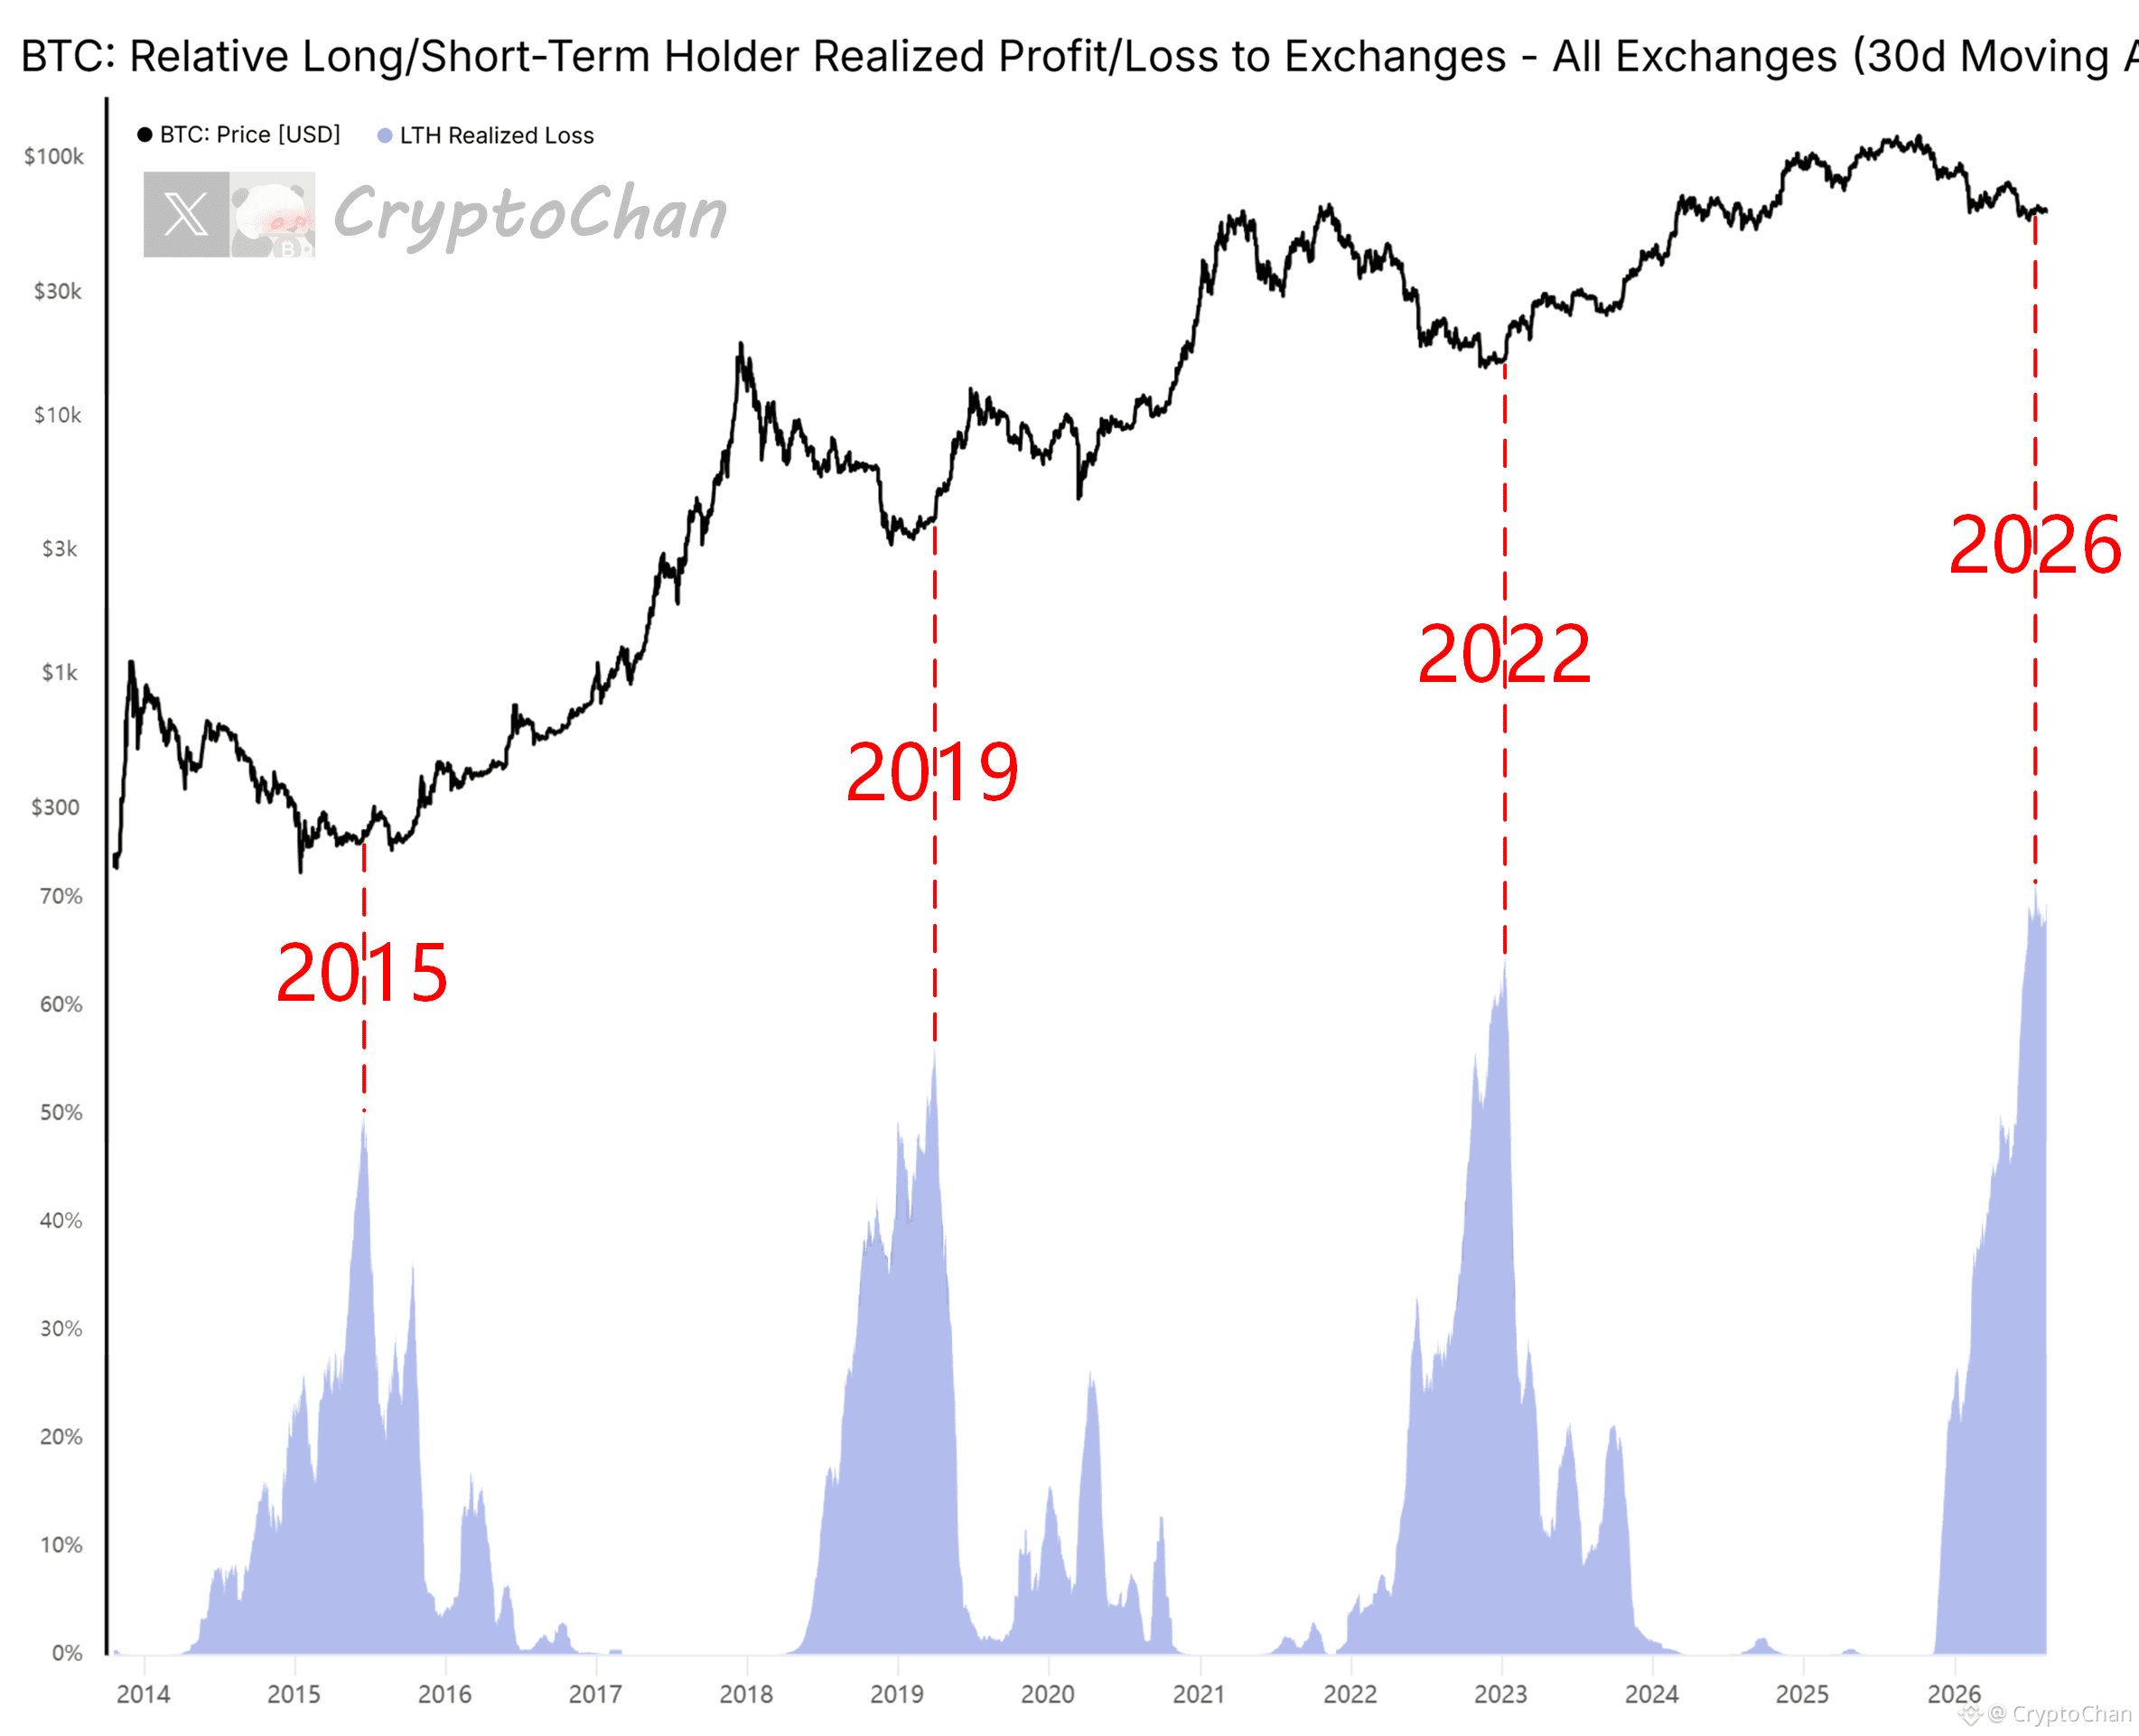
【 $BTC Four-Year Cycle Total Mark Series (47)】
LTH cut-loss size—one round is tougher than the next 😎
┌── 🐼 On-chain Data Details ──┐
The indicator at the bottom of the chart is for BTC: Relative Long/Short-Term Holder Realized Profit/Loss to Exchanges — specifically the LTH Realized Loss sub-item
LTH Realized Loss (the portion flowing into exchanges) refers to: the total loss amount (typically calculated in USD) that long-term holders (LTH, holding for ≥ about 155 days) realize when transferring BTC into an exchange at a price below their cost basis, expressed as a share
This indicator mainly reflects: the scale of deposits to exchanges and readiness to sell off by long-term holders (“strong hands”) while they are in a losing position. The higher the value, the more it often suggests that stronger capitulation-style sell pressure appears near market bottoms
LTH cut-loss size—one round is tougher than the next 😎
┌── 🐼 On-chain Data Details ──┐
The indicator at the bottom of the chart is for BTC: Relative Long/Short-Term Holder Realized Profit/Loss to Exchanges — specifically the LTH Realized Loss sub-item
LTH Realized Loss (the portion flowing into exchanges) refers to: the total loss amount (typically calculated in USD) that long-term holders (LTH, holding for ≥ about 155 days) realize when transferring BTC into an exchange at a price below their cost basis, expressed as a share
This indicator mainly reflects: the scale of deposits to exchanges and readiness to sell off by long-term holders (“strong hands”) while they are in a losing position. The higher the value, the more it often suggests that stronger capitulation-style sell pressure appears near market bottoms
CryptoChan
·
--
【BTC four-year cycle total realized series (46-2)】
Long-term holders are now getting cut deep using the exchange “deep loss” indicator—here we go 🫴
At the bottom of this bear cycle, the indicator is still steadily “underwater” 😏
┌── 🐼 On-chain data details ──┐
The indicator at the bottom of the chart is the realized profit-to-loss ratio of LTHs (long-term holders) sent to exchanges.
Indicator logic: Strip away the original costs of long-term holders (over 155 days). Then only compare the amount of “pure profit” and the amount of “pure loss” from the exchange inflow.
🔴 Bull market top-escape warning: When the ratio shows an exponential surge, it means that almost everything that experienced traders transfer into exchanges is “pure profit.” Large-scale selling driven by huge unrealized gains is a typical top-distribution characteristic.
🟢 Bear market bottom-building signal: When the ratio falls below 1.0 and shrinks dramatically toward 0, it means “pure loss” overwhelmingly dominates. This indicates that even die-hard fans who have endured a long cycle can’t withstand the drawdown and are forced to cut losses deeply on exchanges. Such thorough panic and surrender often suggest that a solid macro bottom has already been formed.
Note: In this article, any ratio <1.0 is referred to as “underwater.”
Long-term holders are now getting cut deep using the exchange “deep loss” indicator—here we go 🫴
At the bottom of this bear cycle, the indicator is still steadily “underwater” 😏
┌── 🐼 On-chain data details ──┐
The indicator at the bottom of the chart is the realized profit-to-loss ratio of LTHs (long-term holders) sent to exchanges.
Indicator logic: Strip away the original costs of long-term holders (over 155 days). Then only compare the amount of “pure profit” and the amount of “pure loss” from the exchange inflow.
🔴 Bull market top-escape warning: When the ratio shows an exponential surge, it means that almost everything that experienced traders transfer into exchanges is “pure profit.” Large-scale selling driven by huge unrealized gains is a typical top-distribution characteristic.
🟢 Bear market bottom-building signal: When the ratio falls below 1.0 and shrinks dramatically toward 0, it means “pure loss” overwhelmingly dominates. This indicates that even die-hard fans who have endured a long cycle can’t withstand the drawdown and are forced to cut losses deeply on exchanges. Such thorough panic and surrender often suggest that a solid macro bottom has already been formed.
Note: In this article, any ratio <1.0 is referred to as “underwater.”
Log in to explore more content