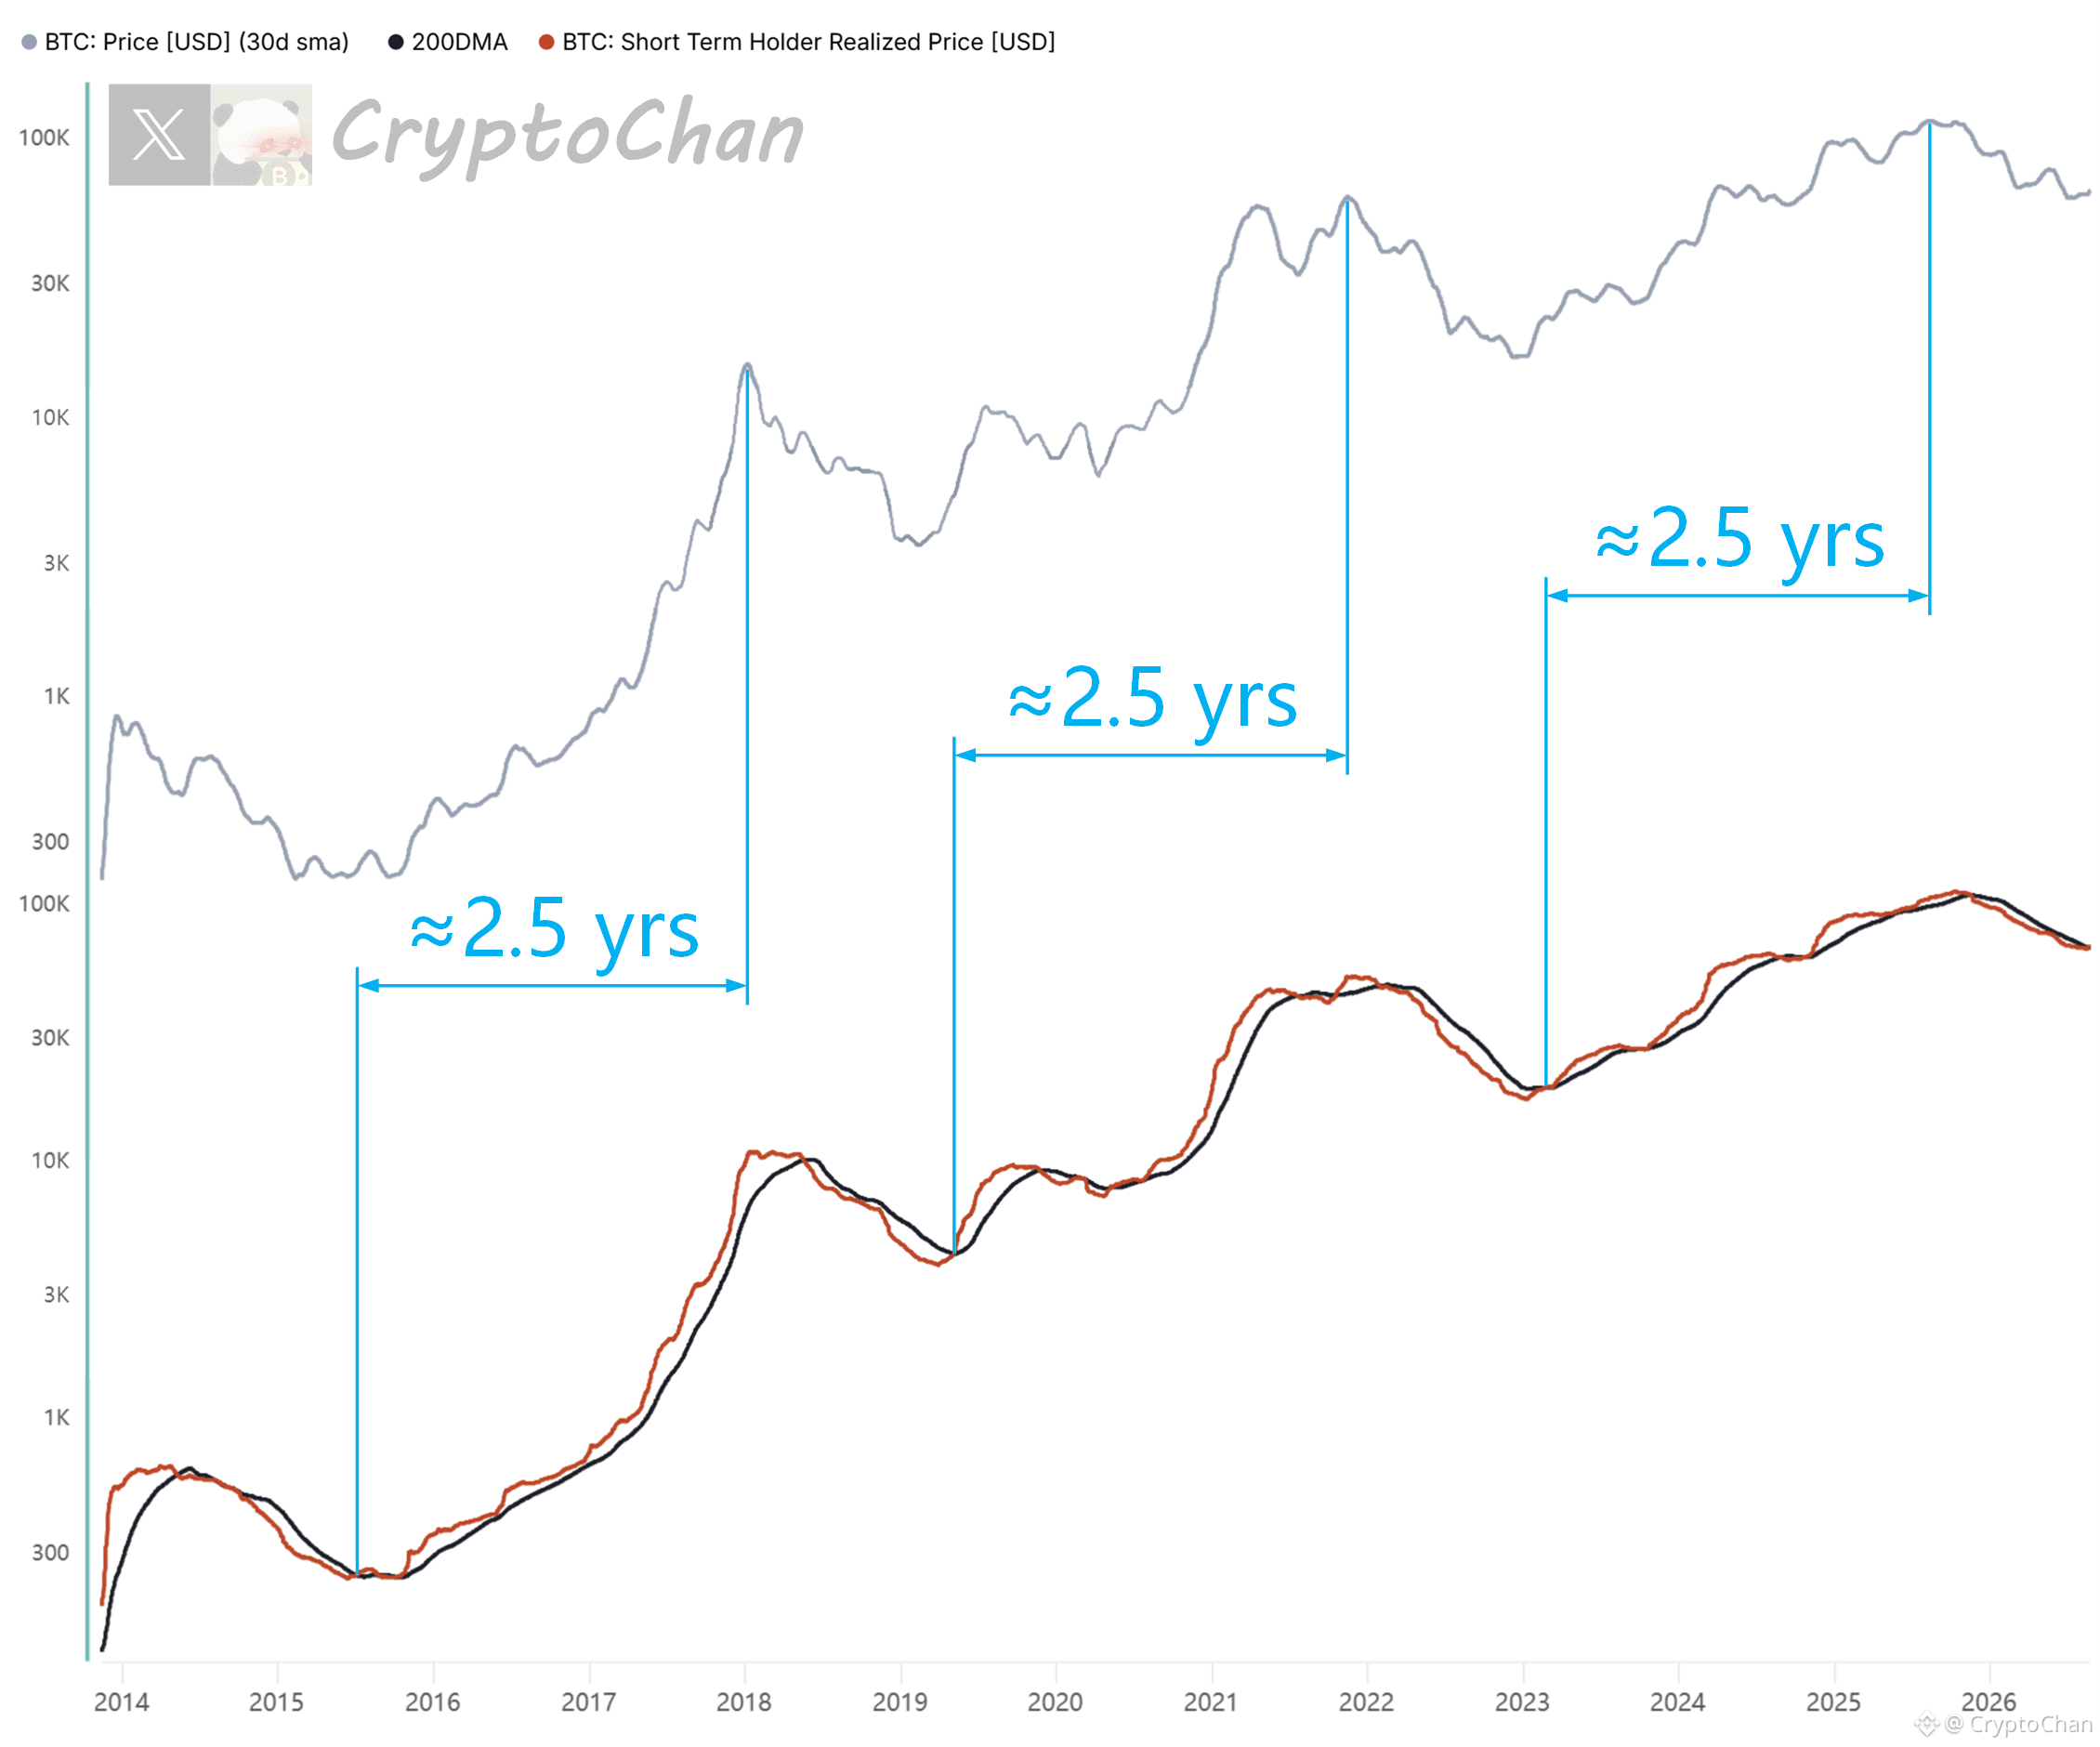
【 $BTC Bull market top-calling countdown series 02】
2015 red-black crossover: about one “kun” year later to the bull market top
2019 red-black crossover: about one “kun” year later to the bull market top
2023 red-black crossover: about one “kun” year later to the bull market top
2026 red-black crossover: 4 days and 5 hours have already passed
┌── 🐼 Indicator details ──┐
Gray line: Bitcoin price 30-day moving average
Red line: Bitcoin on-chain short-term holders’ average buy-in cost (average cost of holdings)
Black line: Bitcoin price 200-day moving average
2015 red-black crossover: about one “kun” year later to the bull market top
2019 red-black crossover: about one “kun” year later to the bull market top
2023 red-black crossover: about one “kun” year later to the bull market top
2026 red-black crossover: 4 days and 5 hours have already passed
┌── 🐼 Indicator details ──┐
Gray line: Bitcoin price 30-day moving average
Red line: Bitcoin on-chain short-term holders’ average buy-in cost (average cost of holdings)
Black line: Bitcoin price 200-day moving average