【 $BTC 4-Year Cycle Total Mark Series 53】
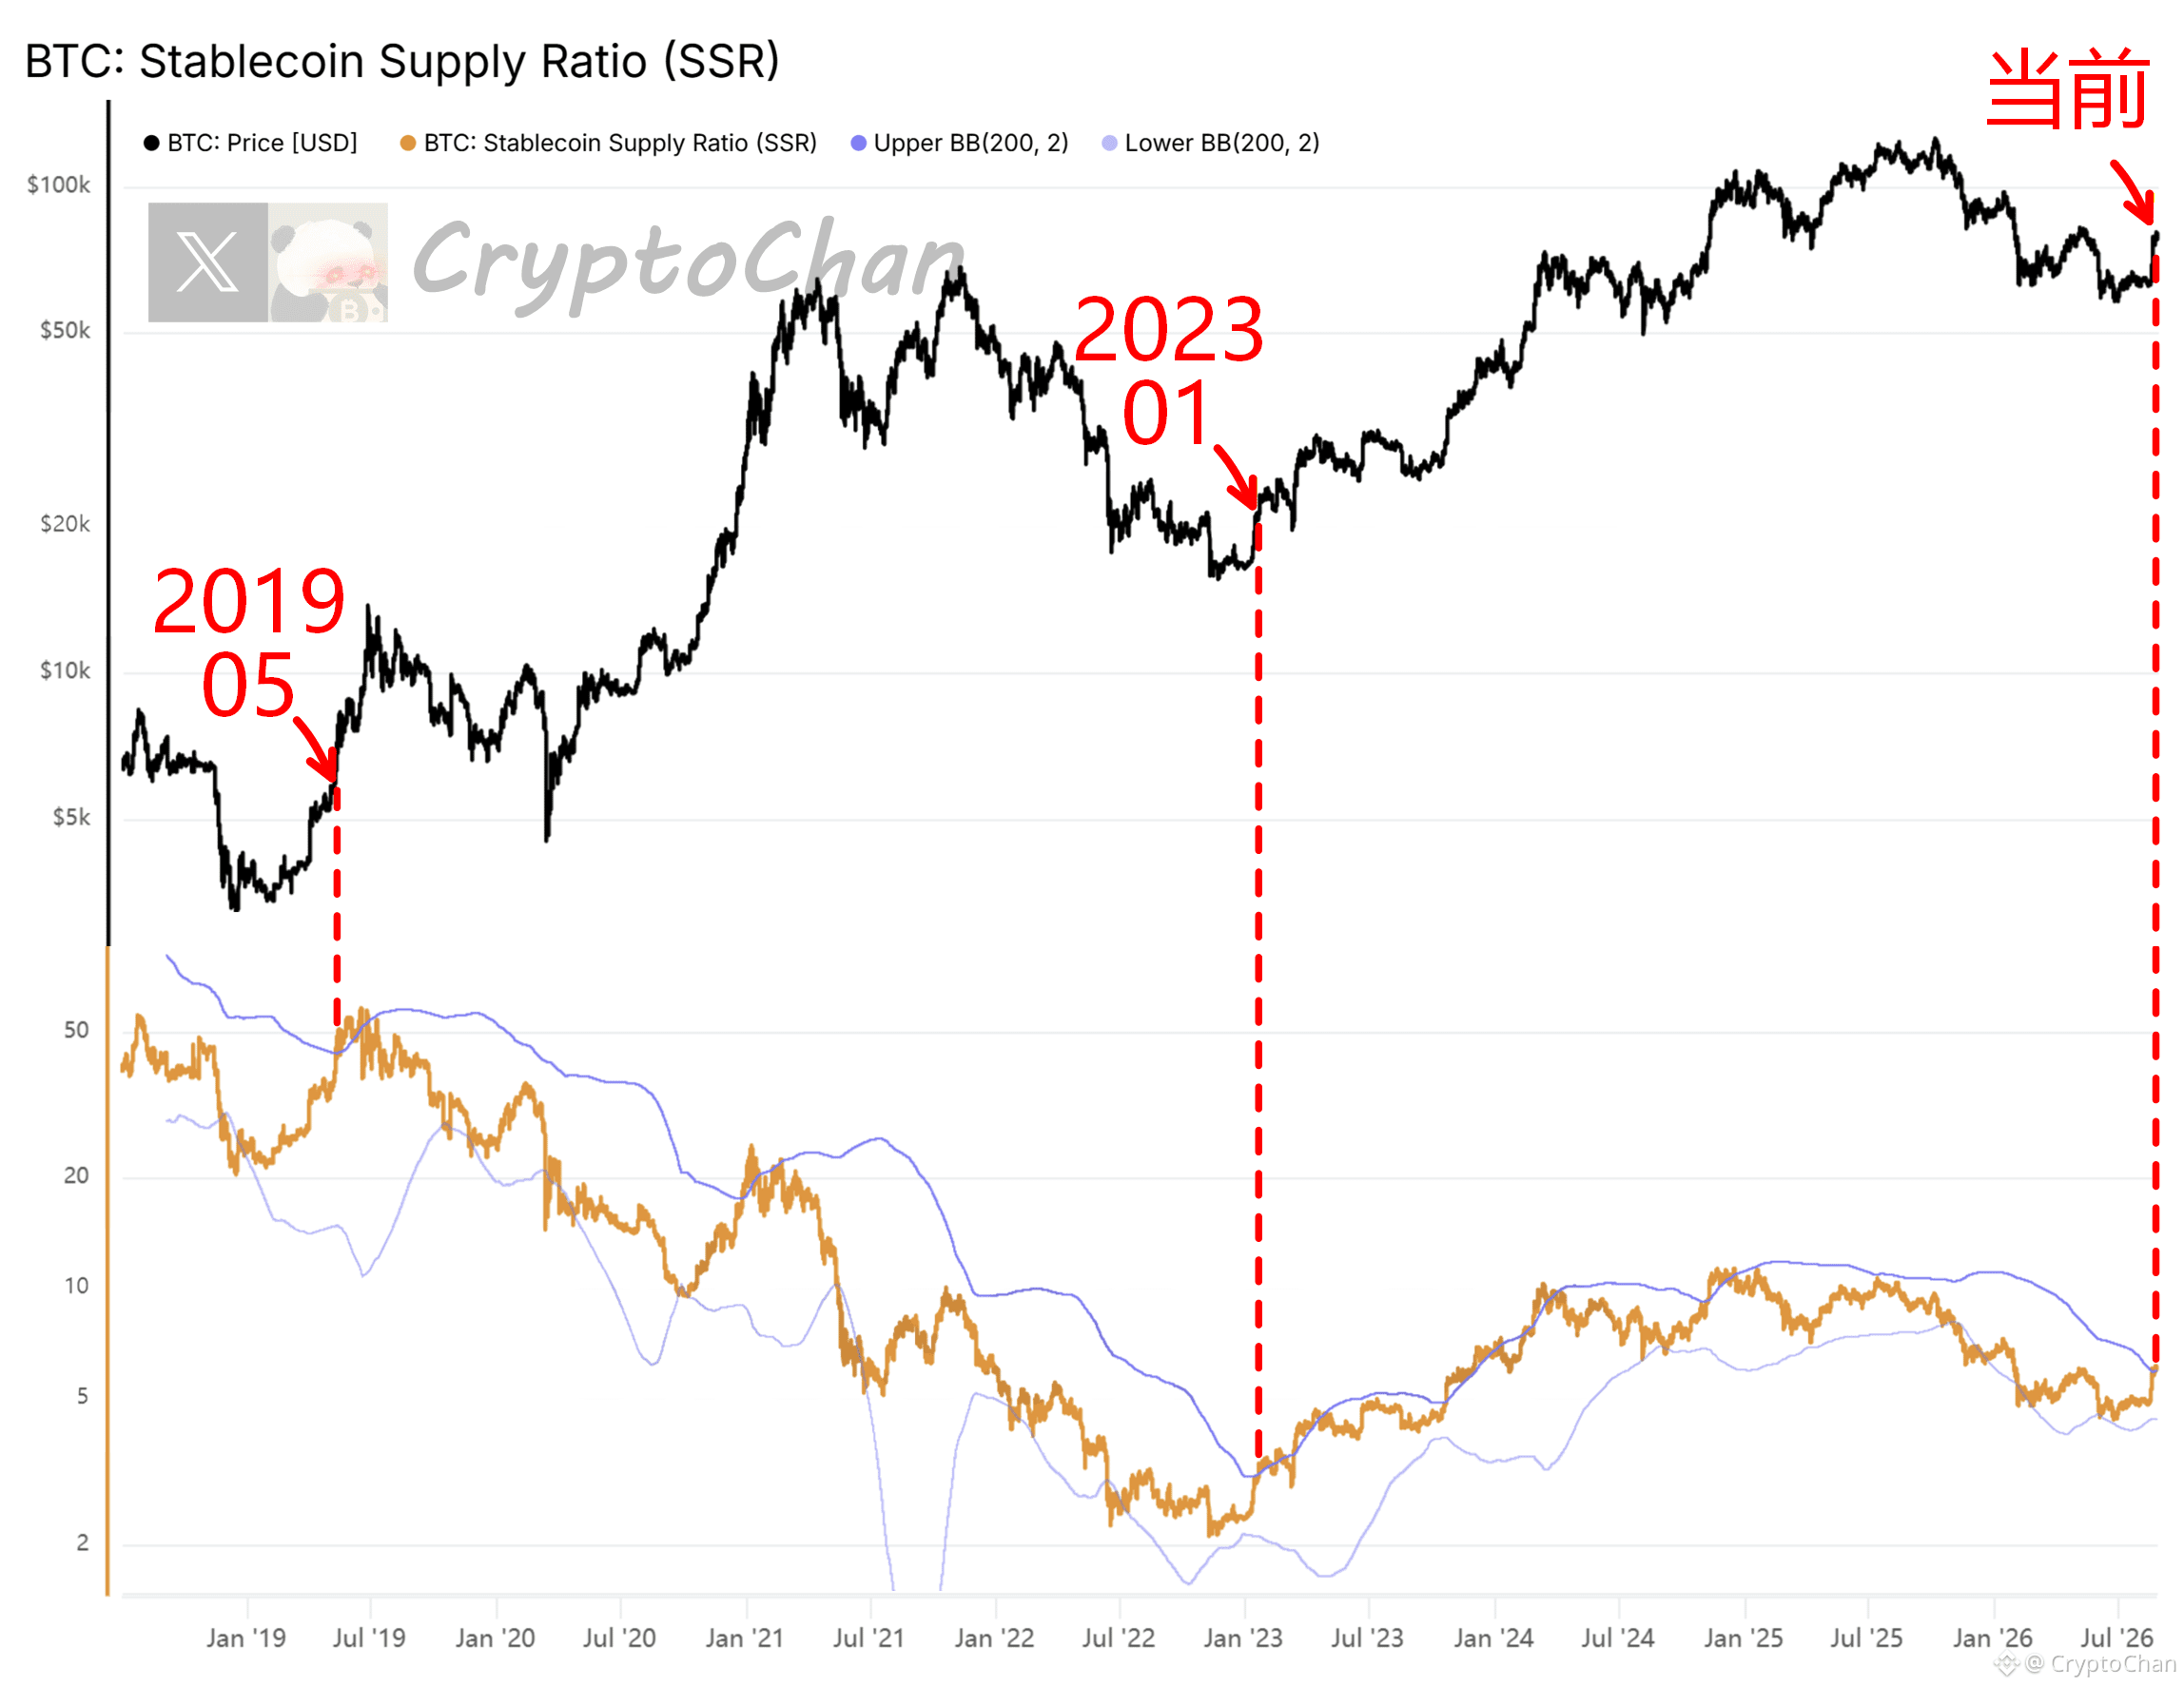
The current orange line has broken above the upper band. 🗡️ Below: May 2019 & January 2023
┌── 🐼 On-Chain Data Details ──┐
The orange line indicator at the bottom of the chart is SSR (Stablecoin Supply Ratio). The calculation formula is: Bitcoin total market cap ➗ total stablecoin market cap
SSR upper band = 200-day moving average + 2× standard deviation. Breaking above the upper band indicates SSR is in an extremely high range.
SSR lower band = 200-day moving average − 2× standard deviation. Dropping below the lower band indicates SSR is in an extremely low range.
The current orange line has broken above the upper band. 🗡️ Below: May 2019 & January 2023
┌── 🐼 On-Chain Data Details ──┐
The orange line indicator at the bottom of the chart is SSR (Stablecoin Supply Ratio). The calculation formula is: Bitcoin total market cap ➗ total stablecoin market cap
SSR upper band = 200-day moving average + 2× standard deviation. Breaking above the upper band indicates SSR is in an extremely high range.
SSR lower band = 200-day moving average − 2× standard deviation. Dropping below the lower band indicates SSR is in an extremely low range.