

Rahi Crypto Intel Pro
9.3k Posts

Rahi Crypto Intel Pro
Report
Block User
Spot Trader | Intraday • Swing • DCA 📊 Market insights, trade setups & Binance campaigns. Follow for clear crypto updates, research & opportunities.
Open Trade
Frequent Trader
5.4 Years
65 Following
1.6K+ Followers
11.2K+ Liked
Posts
Portfolio
All
Quotes
Videos
#ArgentineCourtDismissesLIBRACaseAgainstMilei
Argentina Dismisses Milei’s LIBRA Case — But What Does It Mean?
On October 23, an Argentine judge dismissed the criminal case involving President Javier Milei and others over the LIBRA memecoin controversy.
The case followed Milei’s February 2025 post promoting the token, which later collapsed and left investors facing losses.
However, dismissing this criminal case does not automatically mean every legal dispute is over or that all criticism was false.
The key lesson for crypto investors: never rely on a public figure’s endorsement alone. Research the project, understand the risks, and avoid investing based on hype.
Should public figures face stricter rules when promoting cryptocurrencies?
$ERA
{future}(ERAUSDT)
$DUSK
{future}(DUSKUSDT)
$QNT
{future}(QNTUSDT)
#ArgentineCourtDismissesLIBRACaseAgainstMilei
Argentina Dismisses Milei’s LIBRA Case — But What Does It Mean?
On October 23, an Argentine judge dismissed the criminal case involving President Javier Milei and others over the LIBRA memecoin controversy.
The case followed Milei’s February 2025 post promoting the token, which later collapsed and left investors facing losses.
However, dismissing this criminal case does not automatically mean every legal dispute is over or that all criticism was false.
The key lesson for crypto investors: never rely on a public figure’s endorsement alone. Research the project, understand the risks, and avoid investing based on hype.
Should public figures face stricter rules when promoting cryptocurrencies?
$ERA
$DUSK
$QNT
Argentina Dismisses Milei’s LIBRA Case — But What Does It Mean?
On October 23, an Argentine judge dismissed the criminal case involving President Javier Milei and others over the LIBRA memecoin controversy.
The case followed Milei’s February 2025 post promoting the token, which later collapsed and left investors facing losses.
However, dismissing this criminal case does not automatically mean every legal dispute is over or that all criticism was false.
The key lesson for crypto investors: never rely on a public figure’s endorsement alone. Research the project, understand the risks, and avoid investing based on hype.
Should public figures face stricter rules when promoting cryptocurrencies?
$ERA
$DUSK
$QNT

313
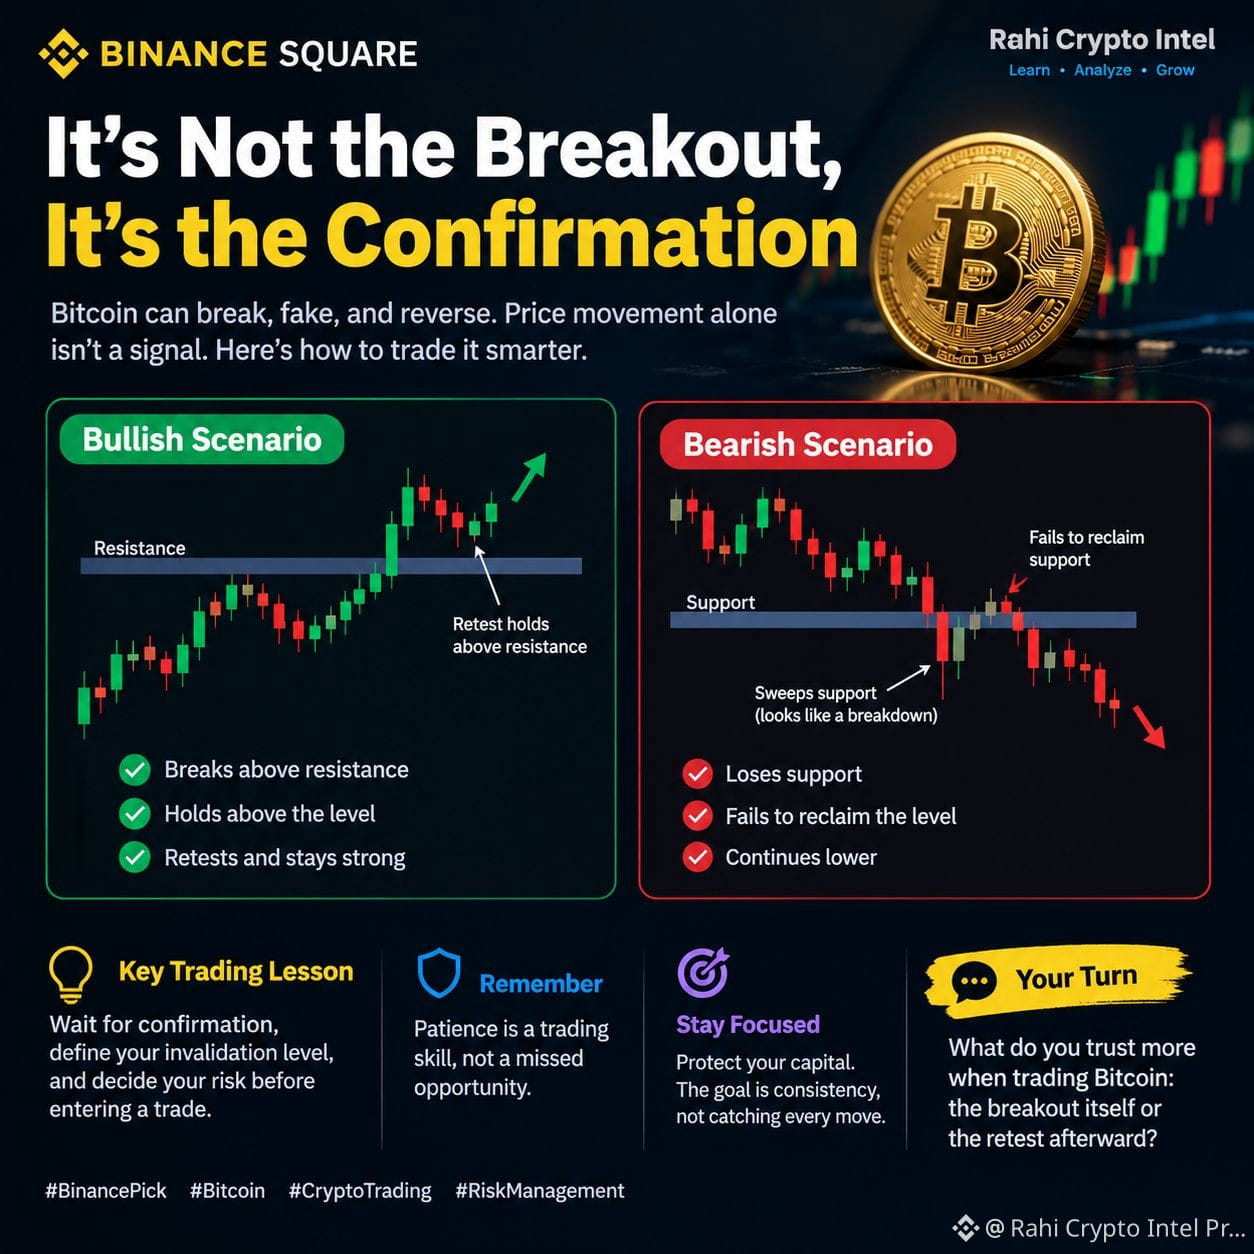
The biggest trading mistake isn’t missing a breakout. It’s entering before the market confirms it.
Bitcoin can break above resistance and attract excited buyers, only to fall back below the level. It can also sweep below support, trigger stop-losses, and then recover.
Both situations teach the same lesson: price movement alone is not confirmation.
A bullish setup becomes more convincing when price breaks resistance, holds above it, and successfully retests the level.
A bearish setup gains strength when price loses support and fails to reclaim it.
But neither scenario is guaranteed. The market can change direction at any time.
My trading rule: Wait for confirmation, define your invalidation level, and decide your risk before entering a trade. Protecting capital matters more than catching every move.
Patience is a trading skill, not a missed opportunity.
What do you trust more when trading Bitcoin: the breakout itself or the retest afterward?
#BinancePick #Bitcoin #CryptoTrading #RiskManagement
$BTC
{future}(BTCUSDT)
The biggest trading mistake isn’t missing a breakout. It’s entering before the market confirms it.
Bitcoin can break above resistance and attract excited buyers, only to fall back below the level. It can also sweep below support, trigger stop-losses, and then recover.
Both situations teach the same lesson: price movement alone is not confirmation.
A bullish setup becomes more convincing when price breaks resistance, holds above it, and successfully retests the level.
A bearish setup gains strength when price loses support and fails to reclaim it.
But neither scenario is guaranteed. The market can change direction at any time.
My trading rule: Wait for confirmation, define your invalidation level, and decide your risk before entering a trade. Protecting capital matters more than catching every move.
Patience is a trading skill, not a missed opportunity.
What do you trust more when trading Bitcoin: the breakout itself or the retest afterward?
#BinancePick #Bitcoin #CryptoTrading #RiskManagement
$BTC
Bitcoin can break above resistance and attract excited buyers, only to fall back below the level. It can also sweep below support, trigger stop-losses, and then recover.
Both situations teach the same lesson: price movement alone is not confirmation.
A bullish setup becomes more convincing when price breaks resistance, holds above it, and successfully retests the level.
A bearish setup gains strength when price loses support and fails to reclaim it.
But neither scenario is guaranteed. The market can change direction at any time.
My trading rule: Wait for confirmation, define your invalidation level, and decide your risk before entering a trade. Protecting capital matters more than catching every move.
Patience is a trading skill, not a missed opportunity.
What do you trust more when trading Bitcoin: the breakout itself or the retest afterward?
#BinancePick #Bitcoin #CryptoTrading #RiskManagement
$BTC
25
The debate over crypto regulation is about more than deciding which agency oversees digital assets. It is also about how crypto projects can raise money while protecting investors.
Senator Cynthia Lummis has criticized lawmakers over the Senate’s failed attempt to advance the CLARITY Act, pointing to proposed limits on crypto fundraising under a provision known as “Regulation Crypto.”
The proposal includes two important limits:
- An annual fundraising allowance of $50 million, subject to the provision’s specific conditions.
- A $200 million maximum in total gross proceeds under the exemption.
These limits are intended to create a defined route for certain crypto projects to raise capital while meeting disclosure requirements, rather than relying on the full securities registration process.
But there is an important distinction between the legislative record and the political argument surrounding it.
On September 15, 2026, the Senate voted 49–50 on a procedural motion to advance the CLARITY Act. The motion failed to secure the three-fifths majority required for cloture. The official record also shows that Senator Thom Tillis voted against the motion with the stated intention of seeking reconsideration.
Lummis argues that Democrats opposed protections and fundraising restrictions they had previously sought. However, that is her characterization of the negotiations and vote—not a conclusion established by the vote tally alone.
Why does this matter?
For crypto businesses, fundraising limits can affect how much capital eligible projects can raise through a regulatory exemption. For investors, disclosure requirements may improve access to information, although they cannot eliminate the risks of investing in crypto assets.
The next key question is whether lawmakers can reach an agreement that clarifies crypto oversight while balancing capital formation and investor protection.
The Senate vote is confirmed. The political dispute over who bears responsibility for the setback requires more context than a single social media statement.
$ENA
The debate over crypto regulation is about more than deciding which agency oversees digital assets. It is also about how crypto projects can raise money while protecting investors.
Senator Cynthia Lummis has criticized lawmakers over the Senate’s failed attempt to advance the CLARITY Act, pointing to proposed limits on crypto fundraising under a provision known as “Regulation Crypto.”
The proposal includes two important limits:
- An annual fundraising allowance of $50 million, subject to the provision’s specific conditions.
- A $200 million maximum in total gross proceeds under the exemption.
These limits are intended to create a defined route for certain crypto projects to raise capital while meeting disclosure requirements, rather than relying on the full securities registration process.
But there is an important distinction between the legislative record and the political argument surrounding it.
On September 15, 2026, the Senate voted 49–50 on a procedural motion to advance the CLARITY Act. The motion failed to secure the three-fifths majority required for cloture. The official record also shows that Senator Thom Tillis voted against the motion with the stated intention of seeking reconsideration.
Lummis argues that Democrats opposed protections and fundraising restrictions they had previously sought. However, that is her characterization of the negotiations and vote—not a conclusion established by the vote tally alone.
Why does this matter?
For crypto businesses, fundraising limits can affect how much capital eligible projects can raise through a regulatory exemption. For investors, disclosure requirements may improve access to information, although they cannot eliminate the risks of investing in crypto assets.
The next key question is whether lawmakers can reach an agreement that clarifies crypto oversight while balancing capital formation and investor protection.
The Senate vote is confirmed. The political dispute over who bears responsibility for the setback requires more context than a single social media statement.
$ENA
Senator Cynthia Lummis has criticized lawmakers over the Senate’s failed attempt to advance the CLARITY Act, pointing to proposed limits on crypto fundraising under a provision known as “Regulation Crypto.”
The proposal includes two important limits:
- An annual fundraising allowance of $50 million, subject to the provision’s specific conditions.
- A $200 million maximum in total gross proceeds under the exemption.
These limits are intended to create a defined route for certain crypto projects to raise capital while meeting disclosure requirements, rather than relying on the full securities registration process.
But there is an important distinction between the legislative record and the political argument surrounding it.
On September 15, 2026, the Senate voted 49–50 on a procedural motion to advance the CLARITY Act. The motion failed to secure the three-fifths majority required for cloture. The official record also shows that Senator Thom Tillis voted against the motion with the stated intention of seeking reconsideration.
Lummis argues that Democrats opposed protections and fundraising restrictions they had previously sought. However, that is her characterization of the negotiations and vote—not a conclusion established by the vote tally alone.
Why does this matter?
For crypto businesses, fundraising limits can affect how much capital eligible projects can raise through a regulatory exemption. For investors, disclosure requirements may improve access to information, although they cannot eliminate the risks of investing in crypto assets.
The next key question is whether lawmakers can reach an agreement that clarifies crypto oversight while balancing capital formation and investor protection.
The Senate vote is confirmed. The political dispute over who bears responsibility for the setback requires more context than a single social media statement.
$ENA


1
107
#USQ3GDPAndSeptemberPCEDueNextWeek
Bitcoin traders have two important US economic reports to watch next week. The key question is whether the data will give the Federal Reserve more room to ease interest rates or keep inflation concerns alive.
On October 29, the US will release its third-quarter GDP advance estimate and September PCE inflation data.
Why do these reports matter for crypto?
GDP measures the growth of the US economy. Stronger-than-expected growth can signal economic strength, while weaker growth may raise concerns about an economic slowdown.
PCE measures changes in prices paid for goods and services. The Federal Reserve closely watches PCE inflation when assessing price pressures and making monetary policy decisions.
Here are three possible scenarios:
• Strong GDP + cooler inflation: This could support market confidence while keeping the door open to easier monetary policy if inflation continues to cool.
• Strong GDP + hotter inflation: Interest rates could stay higher for longer, potentially putting pressure on risk assets such as Bitcoin.
• Weak GDP + cooler inflation: Markets may anticipate more room for rate cuts, although recession concerns could still weigh on sentiment.
These are possible reactions, not guaranteed outcomes. The actual impact will depend on the data compared with expectations, the details behind the numbers, and the Fed’s policy outlook.
One important detail: both reports are scheduled for Thursday, October 29, at 8:30 a.m. Eastern Time, according to the US Bureau of Economic Analysis.
For crypto traders, the goal is not to guess the numbers. It is to understand how the results could change interest-rate expectations and market sentiment.
$BTC
{future}(BTCUSDT)
$ETH
{future}(ETHUSDT)
$SOL
{future}(SOLUSDT)
#USQ3GDPAndSeptemberPCEDueNextWeek
Bitcoin traders have two important US economic reports to watch next week. The key question is whether the data will give the Federal Reserve more room to ease interest rates or keep inflation concerns alive.
On October 29, the US will release its third-quarter GDP advance estimate and September PCE inflation data.
Why do these reports matter for crypto?
GDP measures the growth of the US economy. Stronger-than-expected growth can signal economic strength, while weaker growth may raise concerns about an economic slowdown.
PCE measures changes in prices paid for goods and services. The Federal Reserve closely watches PCE inflation when assessing price pressures and making monetary policy decisions.
Here are three possible scenarios:
• Strong GDP + cooler inflation: This could support market confidence while keeping the door open to easier monetary policy if inflation continues to cool.
• Strong GDP + hotter inflation: Interest rates could stay higher for longer, potentially putting pressure on risk assets such as Bitcoin.
• Weak GDP + cooler inflation: Markets may anticipate more room for rate cuts, although recession concerns could still weigh on sentiment.
These are possible reactions, not guaranteed outcomes. The actual impact will depend on the data compared with expectations, the details behind the numbers, and the Fed’s policy outlook.
One important detail: both reports are scheduled for Thursday, October 29, at 8:30 a.m. Eastern Time, according to the US Bureau of Economic Analysis.
For crypto traders, the goal is not to guess the numbers. It is to understand how the results could change interest-rate expectations and market sentiment.
$BTC
$ETH
$SOL
Bitcoin traders have two important US economic reports to watch next week. The key question is whether the data will give the Federal Reserve more room to ease interest rates or keep inflation concerns alive.
On October 29, the US will release its third-quarter GDP advance estimate and September PCE inflation data.
Why do these reports matter for crypto?
GDP measures the growth of the US economy. Stronger-than-expected growth can signal economic strength, while weaker growth may raise concerns about an economic slowdown.
PCE measures changes in prices paid for goods and services. The Federal Reserve closely watches PCE inflation when assessing price pressures and making monetary policy decisions.
Here are three possible scenarios:
• Strong GDP + cooler inflation: This could support market confidence while keeping the door open to easier monetary policy if inflation continues to cool.
• Strong GDP + hotter inflation: Interest rates could stay higher for longer, potentially putting pressure on risk assets such as Bitcoin.
• Weak GDP + cooler inflation: Markets may anticipate more room for rate cuts, although recession concerns could still weigh on sentiment.
These are possible reactions, not guaranteed outcomes. The actual impact will depend on the data compared with expectations, the details behind the numbers, and the Fed’s policy outlook.
One important detail: both reports are scheduled for Thursday, October 29, at 8:30 a.m. Eastern Time, according to the US Bureau of Economic Analysis.
For crypto traders, the goal is not to guess the numbers. It is to understand how the results could change interest-rate expectations and market sentiment.
$BTC
$ETH
$SOL

55
Article
Crypto Weekly Recap: Bitcoin Near $80K, Ethereum Under Pressure — What’s Next?Crypto Weekly Recap: October 19–25, 2026 — Bitcoin Holds Near $80K as Ethereum Faces Pressure
This week reminded crypto traders that positive headlines do not always translate into rising prices.
Bitcoin attempted a recovery, institutional fund flows turned volatile, and Ethereum faced fresh uncertainty. Here’s what mattered.
Bitcoin ($BTC): Recovery Meets Selling Pressure
Bitcoin traded around the low-$80,000 range, briefly approaching $85,000 before losing momentum.
Available seven-day market data showed BTC down approximately 2.3%, with its price near $80,269 in the latest snapshot.
U.S. spot Bitcoin ETFs recorded strong inflows early in the week, including $526.7 million on October 19 and $524.8 million on October 21. However, October 22 brought $635.6 million in net outflows.
The takeaway: institutional demand appeared, but it was not consistent enough to prevent renewed selling pressure.
Ethereum ($ETH): More Challenges
Ethereum underperformed Bitcoin, falling approximately 4.1% over the seven-day period in the same market snapshot.
ETH also faced pressure from institutional fund flows. U.S. spot Ethereum ETFs recorded approximately $225.1 million in net outflows from October 19–22.
Another concern was Ethereum’s delayed Glamsterdam testnet upgrade following security concerns. Development delays do not automatically mean the network is failing, but they can affect market confidence and expectations.
Three Other Developments Worth Watching
1. Traditional finance enters crypto
BlackRock filed for a proposed Bitcoin ETF designed to provide limited downside protection through an options strategy. The proposed structure would involve trade-offs, including capped upside; protection would not be guaranteed.
2. Stablecoins expand into payments
HSBC introduced its Hong Kong dollar stablecoin, RedCoin, for PayMe users. This highlights how established financial institutions are exploring blockchain-based payments beyond crypto trading.
3. Macro uncertainty remains important
Technology stocks weakened amid concerns about AI investment costs and financing. With the Federal Reserve meeting scheduled for October 27–28, interest-rate expectations and broader risk sentiment could influence crypto volatility.
Three Things to Watch Next Week
- Bitcoin: Can BTC reclaim and hold higher levels, or will selling pressure return near resistance?
- Ethereum: Will ETF outflows ease, and will developers provide clarity on the delayed testnet upgrade?
- Macro and institutional flows: Watch the Federal Reserve’s October 27–28 meeting, fresh ETF flow data, and broader stock-market sentiment.
The Bigger Picture
Crypto sentiment remained cautious. Bitcoin showed relative resilience, but Ethereum and several altcoins struggled. ETF flows demonstrated that institutional demand can change quickly, while regulatory and technology developments continued to shape the market narrative.
One useful takeaway: Don’t judge the market by headlines alone. Combine price action, confirmed fund-flow data, macro conditions, and risk management before drawing conclusions.
Sources: Solidus Capital’s Week 43 market commentary; InflowScan’s October 24 ETF recap; TLT’s October 19–25 market summary; Reuters’ October 23 market report; CoinCentral’s October 24 weekly recap.
$BTC
{future}(BTCUSDT)
$ETH
{future}(ETHUSDT)
Crypto Weekly Recap: Bitcoin Near $80K, Ethereum Under Pressure — What’s Next?
Crypto Weekly Recap: October 19–25, 2026 — Bitcoin Holds Near $80K as Ethereum Faces Pressure
This week reminded crypto traders that positive headlines do not always translate into rising prices.
Bitcoin attempted a recovery, institutional fund flows turned volatile, and Ethereum faced fresh uncertainty. Here’s what mattered.
Bitcoin ($BTC ): Recovery Meets Selling Pressure
Bitcoin traded around the low-$80,000 range, briefly approaching $85,000 before losing momentum.
Available seven-day market data showed BTC down approximately 2.3%, with its price near $80,269 in the latest snapshot.
U.S. spot Bitcoin ETFs recorded strong inflows early in the week, including $526.7 million on October 19 and $524.8 million on October 21. However, October 22 brought $635.6 million in net outflows.
The takeaway: institutional demand appeared, but it was not consistent enough to prevent renewed selling pressure.
Ethereum ($ETH ): More Challenges
Ethereum underperformed Bitcoin, falling approximately 4.1% over the seven-day period in the same market snapshot.
ETH also faced pressure from institutional fund flows. U.S. spot Ethereum ETFs recorded approximately $225.1 million in net outflows from October 19–22.
Another concern was Ethereum’s delayed Glamsterdam testnet upgrade following security concerns. Development delays do not automatically mean the network is failing, but they can affect market confidence and expectations.
Three Other Developments Worth Watching
1. Traditional finance enters crypto
BlackRock filed for a proposed Bitcoin ETF designed to provide limited downside protection through an options strategy. The proposed structure would involve trade-offs, including capped upside; protection would not be guaranteed.
2. Stablecoins expand into payments
HSBC introduced its Hong Kong dollar stablecoin, RedCoin, for PayMe users. This highlights how established financial institutions are exploring blockchain-based payments beyond crypto trading.
3. Macro uncertainty remains important
Technology stocks weakened amid concerns about AI investment costs and financing. With the Federal Reserve meeting scheduled for October 27–28, interest-rate expectations and broader risk sentiment could influence crypto volatility.
Three Things to Watch Next Week
- Bitcoin: Can BTC reclaim and hold higher levels, or will selling pressure return near resistance?
- Ethereum: Will ETF outflows ease, and will developers provide clarity on the delayed testnet upgrade?
- Macro and institutional flows: Watch the Federal Reserve’s October 27–28 meeting, fresh ETF flow data, and broader stock-market sentiment.
The Bigger Picture
Crypto sentiment remained cautious. Bitcoin showed relative resilience, but Ethereum and several altcoins struggled. ETF flows demonstrated that institutional demand can change quickly, while regulatory and technology developments continued to shape the market narrative.
One useful takeaway: Don’t judge the market by headlines alone. Combine price action, confirmed fund-flow data, macro conditions, and risk management before drawing conclusions.
Sources: Solidus Capital’s Week 43 market commentary; InflowScan’s October 24 ETF recap; TLT’s October 19–25 market summary; Reuters’ October 23 market report; CoinCentral’s October 24 weekly recap.
$BTC
$ETH
This week reminded crypto traders that positive headlines do not always translate into rising prices.
Bitcoin attempted a recovery, institutional fund flows turned volatile, and Ethereum faced fresh uncertainty. Here’s what mattered.
Bitcoin ($BTC ): Recovery Meets Selling Pressure
Bitcoin traded around the low-$80,000 range, briefly approaching $85,000 before losing momentum.
Available seven-day market data showed BTC down approximately 2.3%, with its price near $80,269 in the latest snapshot.
U.S. spot Bitcoin ETFs recorded strong inflows early in the week, including $526.7 million on October 19 and $524.8 million on October 21. However, October 22 brought $635.6 million in net outflows.
The takeaway: institutional demand appeared, but it was not consistent enough to prevent renewed selling pressure.
Ethereum ($ETH ): More Challenges
Ethereum underperformed Bitcoin, falling approximately 4.1% over the seven-day period in the same market snapshot.
ETH also faced pressure from institutional fund flows. U.S. spot Ethereum ETFs recorded approximately $225.1 million in net outflows from October 19–22.
Another concern was Ethereum’s delayed Glamsterdam testnet upgrade following security concerns. Development delays do not automatically mean the network is failing, but they can affect market confidence and expectations.
Three Other Developments Worth Watching
1. Traditional finance enters crypto
BlackRock filed for a proposed Bitcoin ETF designed to provide limited downside protection through an options strategy. The proposed structure would involve trade-offs, including capped upside; protection would not be guaranteed.
2. Stablecoins expand into payments
HSBC introduced its Hong Kong dollar stablecoin, RedCoin, for PayMe users. This highlights how established financial institutions are exploring blockchain-based payments beyond crypto trading.
3. Macro uncertainty remains important
Technology stocks weakened amid concerns about AI investment costs and financing. With the Federal Reserve meeting scheduled for October 27–28, interest-rate expectations and broader risk sentiment could influence crypto volatility.
Three Things to Watch Next Week
- Bitcoin: Can BTC reclaim and hold higher levels, or will selling pressure return near resistance?
- Ethereum: Will ETF outflows ease, and will developers provide clarity on the delayed testnet upgrade?
- Macro and institutional flows: Watch the Federal Reserve’s October 27–28 meeting, fresh ETF flow data, and broader stock-market sentiment.
The Bigger Picture
Crypto sentiment remained cautious. Bitcoin showed relative resilience, but Ethereum and several altcoins struggled. ETF flows demonstrated that institutional demand can change quickly, while regulatory and technology developments continued to shape the market narrative.
One useful takeaway: Don’t judge the market by headlines alone. Combine price action, confirmed fund-flow data, macro conditions, and risk management before drawing conclusions.
Sources: Solidus Capital’s Week 43 market commentary; InflowScan’s October 24 ETF recap; TLT’s October 19–25 market summary; Reuters’ October 23 market report; CoinCentral’s October 24 weekly recap.
$BTC
$ETH
32
Nillion Covenants: Privacy Is What Could Make Web3 More Useful
In my opinion, privacy should not be an afterthought in Web3. It should be part of how applications are designed from the beginning.
What interests me most about Nillion Covenants is the potential to build applications that can work with sensitive information while giving users more control over their data.
I believe this matters because people and businesses need more than decentralization. They also need ways to protect information they don't want to expose publicly.
For me, the real value of privacy technology will depend on practical use cases, developer adoption, and how easily people can use it.
I'm interested to see how Nillion Covenants develops and whether it can help make privacy-focused applications more practical.
My take: privacy infrastructure becomes truly valuable when it solves real problems, not just when it sounds innovative.
What do you think is the biggest challenge for privacy-focused Web3 projects: adoption, usability, or real-world utility?
$NIL #NIL @nillionnetwork
{future}(NILUSDT)
Nillion Covenants: Privacy Is What Could Make Web3 More Useful
In my opinion, privacy should not be an afterthought in Web3. It should be part of how applications are designed from the beginning.
What interests me most about Nillion Covenants is the potential to build applications that can work with sensitive information while giving users more control over their data.
I believe this matters because people and businesses need more than decentralization. They also need ways to protect information they don't want to expose publicly.
For me, the real value of privacy technology will depend on practical use cases, developer adoption, and how easily people can use it.
I'm interested to see how Nillion Covenants develops and whether it can help make privacy-focused applications more practical.
My take: privacy infrastructure becomes truly valuable when it solves real problems, not just when it sounds innovative.
What do you think is the biggest challenge for privacy-focused Web3 projects: adoption, usability, or real-world utility?
$NIL #NIL @Nillion
In my opinion, privacy should not be an afterthought in Web3. It should be part of how applications are designed from the beginning.
What interests me most about Nillion Covenants is the potential to build applications that can work with sensitive information while giving users more control over their data.
I believe this matters because people and businesses need more than decentralization. They also need ways to protect information they don't want to expose publicly.
For me, the real value of privacy technology will depend on practical use cases, developer adoption, and how easily people can use it.
I'm interested to see how Nillion Covenants develops and whether it can help make privacy-focused applications more practical.
My take: privacy infrastructure becomes truly valuable when it solves real problems, not just when it sounds innovative.
What do you think is the biggest challenge for privacy-focused Web3 projects: adoption, usability, or real-world utility?
$NIL #NIL @Nillion

117
Binance Raised SHIB's Collateral Ratio to 60% — What Traders Need to Know
Binance has increased the collateral ratio for Shiba Inu, Polygon Ecosystem Token, and Stellar in its Cross Margin and Portfolio Margin systems.
According to Binance's official announcement, the changes took effect on October 23, 2026.
Here's what changed:
- SHIB: 50% to 60%
- POL: 50% to 60%
- XLM: 50% to 60%
Binance also increased the collateral ratios for COW, NEXO, RVN, and SAND from 10% to 30% in the relevant margin systems.
So, what does the SHIB update actually mean?
Collateral ratios help determine how much borrowing capacity an asset can support within applicable margin accounts.
A higher ratio can allow an eligible asset to contribute more collateral value under the relevant rules. However, the effect depends on the account type, applicable limits, and other margin requirements.
There is one important distinction: this is a margin-system adjustment, not a promise that SHIB's market price will rise.
It does not confirm new partnerships, increased demand, or an upcoming rally.
Binance also warns that collateral ratios and leverage affect portfolio margin risk calculations. Traders should monitor their margin requirements carefully because liquidation and losses remain possible.
For SHIB holders, the key takeaway is simple: understand what changed inside Binance's margin system before interpreting it as a market signal.
Rahi Crypto Intel — Separate exchange updates from price speculation.
$SHIB
{spot}(SHIBUSDT)
$POL
{future}(POLUSDT)
$XLM
{future}(XLMUSDT)
Binance Raised SHIB's Collateral Ratio to 60% — What Traders Need to Know
Binance has increased the collateral ratio for Shiba Inu, Polygon Ecosystem Token, and Stellar in its Cross Margin and Portfolio Margin systems.
According to Binance's official announcement, the changes took effect on October 23, 2026.
Here's what changed:
- SHIB: 50% to 60%
- POL: 50% to 60%
- XLM: 50% to 60%
Binance also increased the collateral ratios for COW, NEXO, RVN, and SAND from 10% to 30% in the relevant margin systems.
So, what does the SHIB update actually mean?
Collateral ratios help determine how much borrowing capacity an asset can support within applicable margin accounts.
A higher ratio can allow an eligible asset to contribute more collateral value under the relevant rules. However, the effect depends on the account type, applicable limits, and other margin requirements.
There is one important distinction: this is a margin-system adjustment, not a promise that SHIB's market price will rise.
It does not confirm new partnerships, increased demand, or an upcoming rally.
Binance also warns that collateral ratios and leverage affect portfolio margin risk calculations. Traders should monitor their margin requirements carefully because liquidation and losses remain possible.
For SHIB holders, the key takeaway is simple: understand what changed inside Binance's margin system before interpreting it as a market signal.
Rahi Crypto Intel — Separate exchange updates from price speculation.
$SHIB
$POL
$XLM
Binance has increased the collateral ratio for Shiba Inu, Polygon Ecosystem Token, and Stellar in its Cross Margin and Portfolio Margin systems.
According to Binance's official announcement, the changes took effect on October 23, 2026.
Here's what changed:
- SHIB: 50% to 60%
- POL: 50% to 60%
- XLM: 50% to 60%
Binance also increased the collateral ratios for COW, NEXO, RVN, and SAND from 10% to 30% in the relevant margin systems.
So, what does the SHIB update actually mean?
Collateral ratios help determine how much borrowing capacity an asset can support within applicable margin accounts.
A higher ratio can allow an eligible asset to contribute more collateral value under the relevant rules. However, the effect depends on the account type, applicable limits, and other margin requirements.
There is one important distinction: this is a margin-system adjustment, not a promise that SHIB's market price will rise.
It does not confirm new partnerships, increased demand, or an upcoming rally.
Binance also warns that collateral ratios and leverage affect portfolio margin risk calculations. Traders should monitor their margin requirements carefully because liquidation and losses remain possible.
For SHIB holders, the key takeaway is simple: understand what changed inside Binance's margin system before interpreting it as a market signal.
Rahi Crypto Intel — Separate exchange updates from price speculation.
$SHIB
$POL
$XLM

129

Article
Cardano’s $5M Copper Proposal: Can a Real-World Asset Investment Justify 22 Million ADA?Cardano’s treasury is facing an unusual investment proposal: use 22 million ADA to purchase physical copper and bring it on-chain.
Submitted by Toto Finance on October 15, the Cardano Strategic Copper Reserve proposal seeks approximately $5 million in treasury funding to buy verified copper and represent it through CuTT tokens on Cardano.
But the financial breakdown deserves a closer look.
📊 Where would the funding go?
According to the published governance proposal:
• 22 million ADA: Total treasury request, valued at approximately $5 million in the reported estimate.
• 14.72 million ADA (66.93%): Allocated to physical copper purchases.
• Remaining 33.07%: Covers technology and project management, external operations, insurance, storage, independent oversight, execution and other costs.
The proposal envisions holding the copper for 18–24 months, then selling it over time and returning net proceeds and unused funds to the treasury by month 36.
Here’s the critical question: Can the investment recover its cost?
The proposal’s financial assumptions put copper’s purchase price at approximately $6.73 per pound and its illustrative break-even sale price at around $10.06. That implies a roughly 49.4% increase in copper prices under the stated scenario.
Toto’s founder has also discussed a bullish scenario involving approximately 69% copper appreciation over two years. However, that is a projection—not a guaranteed outcome or an independently established forecast.
The proposal also includes potential payments to Toto and other project-related costs. Meanwhile, copper prices, ADA’s dollar value, custody arrangements, token security and resale liquidity could all affect the final result.
For Cardano, this could create an opportunity to develop real-world asset infrastructure. But ecosystem innovation alone does not guarantee a profitable treasury investment.
Governance update: The proposal remains listed as active and under voting, with November 15, 2026, shown as its expiration date. It has not been approved simply because it is being discussed.
Should Cardano use treasury funds for a physical commodity reserve, or should those funds prioritize core ecosystem development?
Share your reasoning below.
#Cardano #ADA #RWA
$ADA
{future}(ADAUSDT)
$XAU
{future}(XAUUSDT)
Cardano’s $5M Copper Proposal: Can a Real-World Asset Investment Justify 22 Million ADA?
Cardano’s treasury is facing an unusual investment proposal: use 22 million ADA to purchase physical copper and bring it on-chain.
Submitted by Toto Finance on October 15, the Cardano Strategic Copper Reserve proposal seeks approximately $5 million in treasury funding to buy verified copper and represent it through CuTT tokens on Cardano.
But the financial breakdown deserves a closer look.
📊 Where would the funding go?
According to the published governance proposal:
• 22 million ADA: Total treasury request, valued at approximately $5 million in the reported estimate.
• 14.72 million ADA (66.93%): Allocated to physical copper purchases.
• Remaining 33.07%: Covers technology and project management, external operations, insurance, storage, independent oversight, execution and other costs.
The proposal envisions holding the copper for 18–24 months, then selling it over time and returning net proceeds and unused funds to the treasury by month 36.
Here’s the critical question: Can the investment recover its cost?
The proposal’s financial assumptions put copper’s purchase price at approximately $6.73 per pound and its illustrative break-even sale price at around $10.06. That implies a roughly 49.4% increase in copper prices under the stated scenario.
Toto’s founder has also discussed a bullish scenario involving approximately 69% copper appreciation over two years. However, that is a projection—not a guaranteed outcome or an independently established forecast.
The proposal also includes potential payments to Toto and other project-related costs. Meanwhile, copper prices, ADA’s dollar value, custody arrangements, token security and resale liquidity could all affect the final result.
For Cardano, this could create an opportunity to develop real-world asset infrastructure. But ecosystem innovation alone does not guarantee a profitable treasury investment.
Governance update: The proposal remains listed as active and under voting, with November 15, 2026, shown as its expiration date. It has not been approved simply because it is being discussed.
Should Cardano use treasury funds for a physical commodity reserve, or should those funds prioritize core ecosystem development?
Share your reasoning below.
#Cardano #ADA #RWA
$ADA
$XAU
Submitted by Toto Finance on October 15, the Cardano Strategic Copper Reserve proposal seeks approximately $5 million in treasury funding to buy verified copper and represent it through CuTT tokens on Cardano.
But the financial breakdown deserves a closer look.
📊 Where would the funding go?
According to the published governance proposal:
• 22 million ADA: Total treasury request, valued at approximately $5 million in the reported estimate.
• 14.72 million ADA (66.93%): Allocated to physical copper purchases.
• Remaining 33.07%: Covers technology and project management, external operations, insurance, storage, independent oversight, execution and other costs.
The proposal envisions holding the copper for 18–24 months, then selling it over time and returning net proceeds and unused funds to the treasury by month 36.
Here’s the critical question: Can the investment recover its cost?
The proposal’s financial assumptions put copper’s purchase price at approximately $6.73 per pound and its illustrative break-even sale price at around $10.06. That implies a roughly 49.4% increase in copper prices under the stated scenario.
Toto’s founder has also discussed a bullish scenario involving approximately 69% copper appreciation over two years. However, that is a projection—not a guaranteed outcome or an independently established forecast.
The proposal also includes potential payments to Toto and other project-related costs. Meanwhile, copper prices, ADA’s dollar value, custody arrangements, token security and resale liquidity could all affect the final result.
For Cardano, this could create an opportunity to develop real-world asset infrastructure. But ecosystem innovation alone does not guarantee a profitable treasury investment.
Governance update: The proposal remains listed as active and under voting, with November 15, 2026, shown as its expiration date. It has not been approved simply because it is being discussed.
Should Cardano use treasury funds for a physical commodity reserve, or should those funds prioritize core ecosystem development?
Share your reasoning below.
#Cardano #ADA #RWA
$ADA
$XAU
134
🚀 Bitcoin’s Mining Power Is Recovering — But Is That Bullish for $BTC?
Bitcoin’s network is showing renewed mining strength, and the latest difficulty data gives us something important to watch.
Here’s what the numbers tell us as of October 25, 2026. 👇
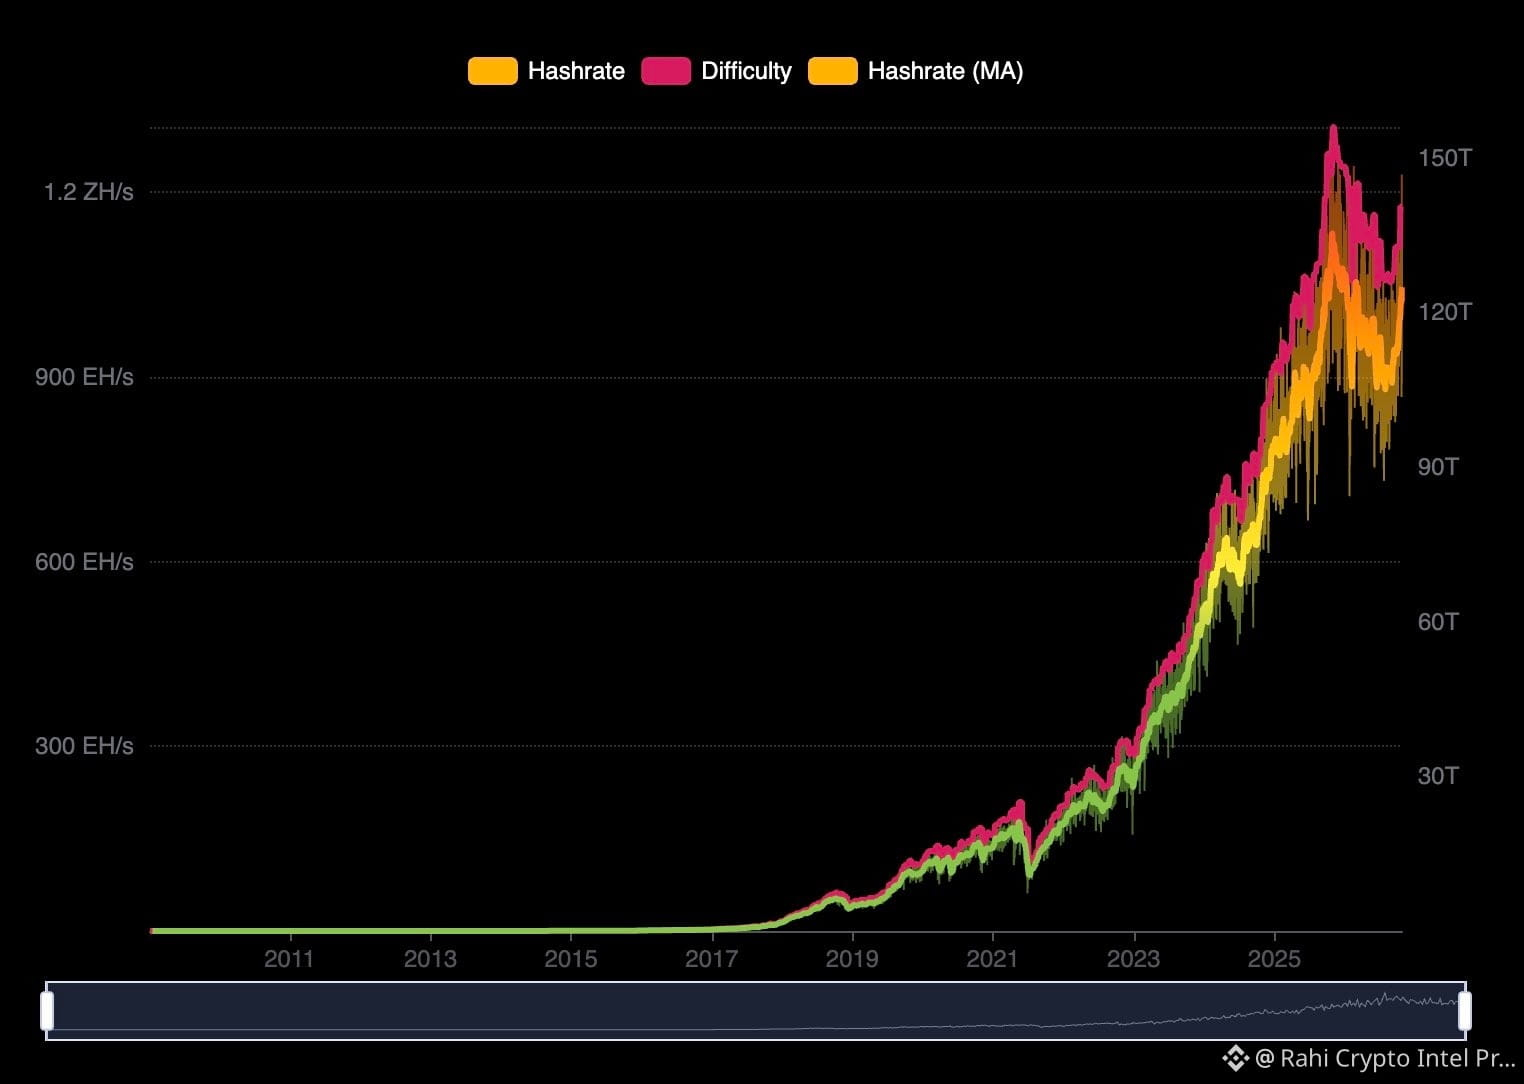
⛏️ Mining Difficulty: 140.58T
Bitcoin’s latest difficulty adjustment on October 16 increased by 5.92%, from 132.72T to 140.58T.
This means miners now face tougher competition to find valid blocks.
⚡ Hashrate: Around 964 EH/s
CoinWarz estimates Bitcoin’s network hashrate at approximately 964 EH/s, up 6.79% over the past 30 days.
However, daily readings fluctuate significantly, so one snapshot doesn’t tell the whole story.
🛡️ Why Does This Matter?
A sustained rise in hashrate can mean more computing power is helping secure Bitcoin’s network.
Increasing difficulty also reflects stronger competition among miners. Together, these metrics offer useful insight into Bitcoin’s network strength and mining activity.
But there’s another side to the story. 👀
💰 More Competition Doesn’t Always Mean More Profit
Higher difficulty can reduce the rewards an individual miner earns relative to their computing power.
Electricity costs, hardware efficiency, BTC prices and operating expenses all influence mining profitability.
And remember: a stronger network does NOT automatically mean Bitcoin’s market price will rise.
📊 The next difficulty adjustment is currently estimated around October 29, potentially bringing another increase. That forecast can still change before the adjustment occurs.
My takeaway: Bitcoin’s mining fundamentals look constructive, but the real question is whether this recovery can sustain itself while miners remain profitable.
🔥 What do you think? Is rising hashrate a meaningful long-term bullish signal for Bitcoin, or is price action still the bigger factor?
Share your thoughts below. 👇
#Bitcoin #BitcoinMining #RahiCryptoIntel
$BTC
{future}(BTCUSDT)
🚀 Bitcoin’s Mining Power Is Recovering — But Is That Bullish for $BTC ?
Bitcoin’s network is showing renewed mining strength, and the latest difficulty data gives us something important to watch.
Here’s what the numbers tell us as of October 25, 2026. 👇
⛏️ Mining Difficulty: 140.58T
Bitcoin’s latest difficulty adjustment on October 16 increased by 5.92%, from 132.72T to 140.58T.
This means miners now face tougher competition to find valid blocks.
⚡ Hashrate: Around 964 EH/s
CoinWarz estimates Bitcoin’s network hashrate at approximately 964 EH/s, up 6.79% over the past 30 days.
However, daily readings fluctuate significantly, so one snapshot doesn’t tell the whole story.
🛡️ Why Does This Matter?
A sustained rise in hashrate can mean more computing power is helping secure Bitcoin’s network.
Increasing difficulty also reflects stronger competition among miners. Together, these metrics offer useful insight into Bitcoin’s network strength and mining activity.
But there’s another side to the story. 👀
💰 More Competition Doesn’t Always Mean More Profit
Higher difficulty can reduce the rewards an individual miner earns relative to their computing power.
Electricity costs, hardware efficiency, BTC prices and operating expenses all influence mining profitability.
And remember: a stronger network does NOT automatically mean Bitcoin’s market price will rise.
📊 The next difficulty adjustment is currently estimated around October 29, potentially bringing another increase. That forecast can still change before the adjustment occurs.
My takeaway: Bitcoin’s mining fundamentals look constructive, but the real question is whether this recovery can sustain itself while miners remain profitable.
🔥 What do you think? Is rising hashrate a meaningful long-term bullish signal for Bitcoin, or is price action still the bigger factor?
Share your thoughts below. 👇
#Bitcoin #BitcoinMining #RahiCryptoIntel
$BTC
Bitcoin’s network is showing renewed mining strength, and the latest difficulty data gives us something important to watch.
Here’s what the numbers tell us as of October 25, 2026. 👇
⛏️ Mining Difficulty: 140.58T
Bitcoin’s latest difficulty adjustment on October 16 increased by 5.92%, from 132.72T to 140.58T.
This means miners now face tougher competition to find valid blocks.
⚡ Hashrate: Around 964 EH/s
CoinWarz estimates Bitcoin’s network hashrate at approximately 964 EH/s, up 6.79% over the past 30 days.
However, daily readings fluctuate significantly, so one snapshot doesn’t tell the whole story.
🛡️ Why Does This Matter?
A sustained rise in hashrate can mean more computing power is helping secure Bitcoin’s network.
Increasing difficulty also reflects stronger competition among miners. Together, these metrics offer useful insight into Bitcoin’s network strength and mining activity.
But there’s another side to the story. 👀
💰 More Competition Doesn’t Always Mean More Profit
Higher difficulty can reduce the rewards an individual miner earns relative to their computing power.
Electricity costs, hardware efficiency, BTC prices and operating expenses all influence mining profitability.
And remember: a stronger network does NOT automatically mean Bitcoin’s market price will rise.
📊 The next difficulty adjustment is currently estimated around October 29, potentially bringing another increase. That forecast can still change before the adjustment occurs.
My takeaway: Bitcoin’s mining fundamentals look constructive, but the real question is whether this recovery can sustain itself while miners remain profitable.
🔥 What do you think? Is rising hashrate a meaningful long-term bullish signal for Bitcoin, or is price action still the bigger factor?
Share your thoughts below. 👇
#Bitcoin #BitcoinMining #RahiCryptoIntel
$BTC
18
Solana's Big Upgrade Is Live — But What Does It Actually Mean for SOL?
Solana has reached an important technical milestone.
On October 21, 2026, Solana activated its Alpenglow consensus upgrade on mainnet, replacing its previous TowerBFT consensus protocol.
According to Solana's official documentation, Alpenglow targets transaction finality of around 150 milliseconds, compared with approximately 12.8 seconds under the previous system.
But what does that mean for everyday crypto users?
Think of transaction finality as the point when a transaction is considered irreversible. Faster finality can make trading, payments, and other blockchain applications feel more responsive.
For developers, it could also make Solana more attractive for applications that depend on fast settlement.
Does this automatically mean SOL will go up?
No.
A stronger network can improve a project's long-term potential, but token prices also depend on demand, market conditions, competition, liquidity, and actual adoption.
The important question now is whether this technical improvement translates into greater real-world usage.
Alpenglow is live, but its long-term impact still needs to be demonstrated through network activity and application adoption.
What do you think matters more for Solana's future: faster transaction finality or growing real-world demand for SOL?
Source: https://solana.com/upgrades/alpenglow
Rahi Crypto Intel
$SOL
{future}(SOLUSDT)
Solana's Big Upgrade Is Live — But What Does It Actually Mean for SOL?
Solana has reached an important technical milestone.
On October 21, 2026, Solana activated its Alpenglow consensus upgrade on mainnet, replacing its previous TowerBFT consensus protocol.
According to Solana's official documentation, Alpenglow targets transaction finality of around 150 milliseconds, compared with approximately 12.8 seconds under the previous system.
But what does that mean for everyday crypto users?
Think of transaction finality as the point when a transaction is considered irreversible. Faster finality can make trading, payments, and other blockchain applications feel more responsive.
For developers, it could also make Solana more attractive for applications that depend on fast settlement.
Does this automatically mean SOL will go up?
No.
A stronger network can improve a project's long-term potential, but token prices also depend on demand, market conditions, competition, liquidity, and actual adoption.
The important question now is whether this technical improvement translates into greater real-world usage.
Alpenglow is live, but its long-term impact still needs to be demonstrated through network activity and application adoption.
What do you think matters more for Solana's future: faster transaction finality or growing real-world demand for SOL?
Source: https://solana.com/upgrades/alpenglow
Rahi Crypto Intel
$SOL
Solana has reached an important technical milestone.
On October 21, 2026, Solana activated its Alpenglow consensus upgrade on mainnet, replacing its previous TowerBFT consensus protocol.
According to Solana's official documentation, Alpenglow targets transaction finality of around 150 milliseconds, compared with approximately 12.8 seconds under the previous system.
But what does that mean for everyday crypto users?
Think of transaction finality as the point when a transaction is considered irreversible. Faster finality can make trading, payments, and other blockchain applications feel more responsive.
For developers, it could also make Solana more attractive for applications that depend on fast settlement.
Does this automatically mean SOL will go up?
No.
A stronger network can improve a project's long-term potential, but token prices also depend on demand, market conditions, competition, liquidity, and actual adoption.
The important question now is whether this technical improvement translates into greater real-world usage.
Alpenglow is live, but its long-term impact still needs to be demonstrated through network activity and application adoption.
What do you think matters more for Solana's future: faster transaction finality or growing real-world demand for SOL?
Source: https://solana.com/upgrades/alpenglow
Rahi Crypto Intel
$SOL

48
Ethereum's AI Story Is Getting Bigger: More Than 72,000 Registered Agents
Artificial intelligence and blockchain are increasingly being discussed together, and new figures from the Ethereum ecosystem are adding weight to that conversation.
A report published by Coinotag on October 25 says Ethereum had 72,028 registered AI agents under the ERC-8004 standard as of October 20.
The report says that figure was up from 32,343 on May 13, meaning the number had more than doubled in roughly five months.
So, what exactly are AI agents?
Think of them as software systems designed to perform tasks with varying levels of autonomy. Depending on how they are built, they may be able to interact with applications, communicate with other agents or initiate transactions.
ERC-8004 is designed to support the identification and reputation of AI agents across blockchain networks.
Why is this worth watching?
• Blockchain infrastructure could help software agents establish verifiable identities and interact with on-chain services.
• Smart contracts could potentially automate parts of digital payments and transactions between applications.
• Ethereum could benefit if more AI-related applications create genuine demand for its network and ecosystem.
However, registered agents are not the same as active users, paying customers or profitable businesses. The registration figures alone do not prove that AI activity is increasing ETH demand or will push its price higher.
The bigger question is whether developers can turn this growing infrastructure into useful products that people actually need.
For crypto users, the AI-blockchain connection is a developing trend worth following, but real adoption will matter more than headlines.
Rahi Crypto Intel Pro
$ETH
{future}(ETHUSDT)
Ethereum's AI Story Is Getting Bigger: More Than 72,000 Registered Agents
Artificial intelligence and blockchain are increasingly being discussed together, and new figures from the Ethereum ecosystem are adding weight to that conversation.
A report published by Coinotag on October 25 says Ethereum had 72,028 registered AI agents under the ERC-8004 standard as of October 20.
The report says that figure was up from 32,343 on May 13, meaning the number had more than doubled in roughly five months.
So, what exactly are AI agents?
Think of them as software systems designed to perform tasks with varying levels of autonomy. Depending on how they are built, they may be able to interact with applications, communicate with other agents or initiate transactions.
ERC-8004 is designed to support the identification and reputation of AI agents across blockchain networks.
Why is this worth watching?
• Blockchain infrastructure could help software agents establish verifiable identities and interact with on-chain services.
• Smart contracts could potentially automate parts of digital payments and transactions between applications.
• Ethereum could benefit if more AI-related applications create genuine demand for its network and ecosystem.
However, registered agents are not the same as active users, paying customers or profitable businesses. The registration figures alone do not prove that AI activity is increasing ETH demand or will push its price higher.
The bigger question is whether developers can turn this growing infrastructure into useful products that people actually need.
For crypto users, the AI-blockchain connection is a developing trend worth following, but real adoption will matter more than headlines.
Rahi Crypto Intel Pro
$ETH
Artificial intelligence and blockchain are increasingly being discussed together, and new figures from the Ethereum ecosystem are adding weight to that conversation.
A report published by Coinotag on October 25 says Ethereum had 72,028 registered AI agents under the ERC-8004 standard as of October 20.
The report says that figure was up from 32,343 on May 13, meaning the number had more than doubled in roughly five months.
So, what exactly are AI agents?
Think of them as software systems designed to perform tasks with varying levels of autonomy. Depending on how they are built, they may be able to interact with applications, communicate with other agents or initiate transactions.
ERC-8004 is designed to support the identification and reputation of AI agents across blockchain networks.
Why is this worth watching?
• Blockchain infrastructure could help software agents establish verifiable identities and interact with on-chain services.
• Smart contracts could potentially automate parts of digital payments and transactions between applications.
• Ethereum could benefit if more AI-related applications create genuine demand for its network and ecosystem.
However, registered agents are not the same as active users, paying customers or profitable businesses. The registration figures alone do not prove that AI activity is increasing ETH demand or will push its price higher.
The bigger question is whether developers can turn this growing infrastructure into useful products that people actually need.
For crypto users, the AI-blockchain connection is a developing trend worth following, but real adoption will matter more than headlines.
Rahi Crypto Intel Pro
$ETH

46
Bitcoin Is Fighting to Hold $80,000 — What Should Traders Watch Next?
Bitcoin is facing another important market test as selling pressure and uncertainty continue to challenge the crypto market.
In reporting published on October 24, Bitcoin traded around $80,685, while Ethereum hovered near $2,370. Both assets were under pressure as investors assessed weaker institutional flows and uncertainty across global markets.
One important factor was ETF activity. According to The Economic Times, US spot Bitcoin ETFs recorded approximately $636 million in net outflows on Thursday, while Ether ETFs saw around $111 million in outflows.
Why does this matter?
• Bitcoin often reacts to changes in investor risk appetite, including movements in traditional financial markets.
• ETF outflows can signal weaker demand through those investment products, although they do not represent the entire crypto market.
• Traders will be watching whether Bitcoin can maintain support around $80,000 or whether selling pressure pushes it lower.
For beginners, the key lesson is simple: a price level becomes more meaningful when market structure, trading volume and investor flows support the same direction.
A move below $80,000 would not automatically confirm a deeper crash, just as holding that level would not guarantee a rally.
For now, risk management matters more than guessing the next candle.
Rahi Crypto Intel Pro
$BTC
{future}(BTCUSDT)
$ETH
{future}(ETHUSDT)
Bitcoin Is Fighting to Hold $80,000 — What Should Traders Watch Next?
Bitcoin is facing another important market test as selling pressure and uncertainty continue to challenge the crypto market.
In reporting published on October 24, Bitcoin traded around $80,685, while Ethereum hovered near $2,370. Both assets were under pressure as investors assessed weaker institutional flows and uncertainty across global markets.
One important factor was ETF activity. According to The Economic Times, US spot Bitcoin ETFs recorded approximately $636 million in net outflows on Thursday, while Ether ETFs saw around $111 million in outflows.
Why does this matter?
• Bitcoin often reacts to changes in investor risk appetite, including movements in traditional financial markets.
• ETF outflows can signal weaker demand through those investment products, although they do not represent the entire crypto market.
• Traders will be watching whether Bitcoin can maintain support around $80,000 or whether selling pressure pushes it lower.
For beginners, the key lesson is simple: a price level becomes more meaningful when market structure, trading volume and investor flows support the same direction.
A move below $80,000 would not automatically confirm a deeper crash, just as holding that level would not guarantee a rally.
For now, risk management matters more than guessing the next candle.
Rahi Crypto Intel Pro
$BTC
$ETH
Bitcoin is facing another important market test as selling pressure and uncertainty continue to challenge the crypto market.
In reporting published on October 24, Bitcoin traded around $80,685, while Ethereum hovered near $2,370. Both assets were under pressure as investors assessed weaker institutional flows and uncertainty across global markets.
One important factor was ETF activity. According to The Economic Times, US spot Bitcoin ETFs recorded approximately $636 million in net outflows on Thursday, while Ether ETFs saw around $111 million in outflows.
Why does this matter?
• Bitcoin often reacts to changes in investor risk appetite, including movements in traditional financial markets.
• ETF outflows can signal weaker demand through those investment products, although they do not represent the entire crypto market.
• Traders will be watching whether Bitcoin can maintain support around $80,000 or whether selling pressure pushes it lower.
For beginners, the key lesson is simple: a price level becomes more meaningful when market structure, trading volume and investor flows support the same direction.
A move below $80,000 would not automatically confirm a deeper crash, just as holding that level would not guarantee a rally.
For now, risk management matters more than guessing the next candle.
Rahi Crypto Intel Pro
$BTC
$ETH

80
🚨 PEPE COIN: RECOVERY OR ANOTHER SELL-OFF? The Next Levels Could Decide!
PEPE is showing mixed signals, and the next move could be more important than the recent bounce.
As of October 25, $PEPE is trading around $0.0000045, following a volatile week that brought renewed attention to the meme-coin market.
🐸 What the latest data tells us
Recent market analysis published on October 23 reported a sharp PEPE rally alongside a substantial increase in trading volume. However, a subsequent October 24 update highlighted potential selling pressure from exchange inflows.
Whale activity is also mixed. On October 22, Lookonchain reported that one large wallet accumulated approximately $195,000 worth of PEPE as part of a broader multi-token purchase. That is a confirmed reported transaction, but it does not prove a market-wide accumulation trend.
📊 Key levels to watch
• Support: $0.00000447 — Holding this area could help stabilize the short-term structure.
• Resistance: $0.00000462 — A convincing breakout above this level could strengthen the recovery case.
• Bearish warning: A sustained break below support could expose PEPE to further downside.
These are technical reference levels, not guaranteed turning points.
🟢 Bullish scenario: PEPE holds support, buying volume strengthens, and price breaks resistance with confirmation. That would improve the recovery outlook.
🔴 Bearish scenario: Selling pressure increases, exchange inflows remain elevated, and support fails. In that case, the recent bounce could lose momentum.
What should traders watch next?
Focus on whether rising prices are supported by genuine spot-market demand, whether exchange inflows continue, and whether Bitcoin's direction helps or hurts meme-coin sentiment.
The important distinction: a price rebound is observable; a sustained recovery still needs confirmation.
🐸 Your take: Is PEPE building a stronger base for another move upward, or do you expect sellers to regain control? What evidence would convince you?
$PEPE
{spot}(PEPEUSDT)
🚨 PEPE COIN: RECOVERY OR ANOTHER SELL-OFF? The Next Levels Could Decide!
PEPE is showing mixed signals, and the next move could be more important than the recent bounce.
As of October 25, $PEPE is trading around $0.0000045, following a volatile week that brought renewed attention to the meme-coin market.
🐸 What the latest data tells us
Recent market analysis published on October 23 reported a sharp PEPE rally alongside a substantial increase in trading volume. However, a subsequent October 24 update highlighted potential selling pressure from exchange inflows.
Whale activity is also mixed. On October 22, Lookonchain reported that one large wallet accumulated approximately $195,000 worth of PEPE as part of a broader multi-token purchase. That is a confirmed reported transaction, but it does not prove a market-wide accumulation trend.
📊 Key levels to watch
• Support: $0.00000447 — Holding this area could help stabilize the short-term structure.
• Resistance: $0.00000462 — A convincing breakout above this level could strengthen the recovery case.
• Bearish warning: A sustained break below support could expose PEPE to further downside.
These are technical reference levels, not guaranteed turning points.
🟢 Bullish scenario: PEPE holds support, buying volume strengthens, and price breaks resistance with confirmation. That would improve the recovery outlook.
🔴 Bearish scenario: Selling pressure increases, exchange inflows remain elevated, and support fails. In that case, the recent bounce could lose momentum.
What should traders watch next?
Focus on whether rising prices are supported by genuine spot-market demand, whether exchange inflows continue, and whether Bitcoin's direction helps or hurts meme-coin sentiment.
The important distinction: a price rebound is observable; a sustained recovery still needs confirmation.
🐸 Your take: Is PEPE building a stronger base for another move upward, or do you expect sellers to regain control? What evidence would convince you?
$PEPE
PEPE is showing mixed signals, and the next move could be more important than the recent bounce.
As of October 25, $PEPE is trading around $0.0000045, following a volatile week that brought renewed attention to the meme-coin market.
🐸 What the latest data tells us
Recent market analysis published on October 23 reported a sharp PEPE rally alongside a substantial increase in trading volume. However, a subsequent October 24 update highlighted potential selling pressure from exchange inflows.
Whale activity is also mixed. On October 22, Lookonchain reported that one large wallet accumulated approximately $195,000 worth of PEPE as part of a broader multi-token purchase. That is a confirmed reported transaction, but it does not prove a market-wide accumulation trend.
📊 Key levels to watch
• Support: $0.00000447 — Holding this area could help stabilize the short-term structure.
• Resistance: $0.00000462 — A convincing breakout above this level could strengthen the recovery case.
• Bearish warning: A sustained break below support could expose PEPE to further downside.
These are technical reference levels, not guaranteed turning points.
🟢 Bullish scenario: PEPE holds support, buying volume strengthens, and price breaks resistance with confirmation. That would improve the recovery outlook.
🔴 Bearish scenario: Selling pressure increases, exchange inflows remain elevated, and support fails. In that case, the recent bounce could lose momentum.
What should traders watch next?
Focus on whether rising prices are supported by genuine spot-market demand, whether exchange inflows continue, and whether Bitcoin's direction helps or hurts meme-coin sentiment.
The important distinction: a price rebound is observable; a sustained recovery still needs confirmation.
🐸 Your take: Is PEPE building a stronger base for another move upward, or do you expect sellers to regain control? What evidence would convince you?
$PEPE

137
🚨 Crypto Market Shake-Up: What Happens When Too Many Traders Bet on a Rally?
The market can turn against leveraged traders much faster than they expect. When too many positions lean in the same direction, a sudden move can trigger a painful chain reaction. 📉
According to the reported figures, the latest 24-hour period brought significant pressure across the crypto market:
🔻 $40 billion+ reportedly erased from total crypto market capitalization.
⚠️ 213,000+ traders reportedly liquidated.
⏱️ $270 million+ in liquidations reportedly recorded within a single hour.
📊 Around 94% of those hourly liquidations reportedly involved long positions, according to CoinGlass.
What does this reveal about the market?
When traders use excessive leverage to bet on rising prices, even a sharp market decline can put their positions at risk.
If prices reach a liquidation threshold, exchanges may automatically close leveraged positions. These forced closures can add further selling pressure, potentially creating a domino effect across the market.
However, heavy liquidations do not automatically mean another crash is coming.
They may indicate that overextended positions are being cleared out. What happens next depends on buying demand, selling pressure, liquidity, and broader market sentiment.
A recovery is possible, but continued weakness is also a risk. Liquidation figures alone cannot confirm which direction the market will take.
💡 A valuable lesson for every trader:
Leverage magnifies both potential gains and losses. Use sensible position sizing, establish your exit strategy before entering a trade, and never risk money you cannot afford to lose.
In volatile markets, protecting your capital matters more than chasing every opportunity.
💬 Your opinion: Do these liquidations create an opportunity for a market recovery, or should traders remain cautious until stronger confirmation appears?
$BTC
{future}(BTCUSDT)
$ARK
{future}(ARKUSDT)
$ERA
{future}(ERAUSDT)
🚨 Crypto Market Shake-Up: What Happens When Too Many Traders Bet on a Rally?
The market can turn against leveraged traders much faster than they expect. When too many positions lean in the same direction, a sudden move can trigger a painful chain reaction. 📉
According to the reported figures, the latest 24-hour period brought significant pressure across the crypto market:
🔻 $40 billion+ reportedly erased from total crypto market capitalization.
⚠️ 213,000+ traders reportedly liquidated.
⏱️ $270 million+ in liquidations reportedly recorded within a single hour.
📊 Around 94% of those hourly liquidations reportedly involved long positions, according to CoinGlass.
What does this reveal about the market?
When traders use excessive leverage to bet on rising prices, even a sharp market decline can put their positions at risk.
If prices reach a liquidation threshold, exchanges may automatically close leveraged positions. These forced closures can add further selling pressure, potentially creating a domino effect across the market.
However, heavy liquidations do not automatically mean another crash is coming.
They may indicate that overextended positions are being cleared out. What happens next depends on buying demand, selling pressure, liquidity, and broader market sentiment.
A recovery is possible, but continued weakness is also a risk. Liquidation figures alone cannot confirm which direction the market will take.
💡 A valuable lesson for every trader:
Leverage magnifies both potential gains and losses. Use sensible position sizing, establish your exit strategy before entering a trade, and never risk money you cannot afford to lose.
In volatile markets, protecting your capital matters more than chasing every opportunity.
💬 Your opinion: Do these liquidations create an opportunity for a market recovery, or should traders remain cautious until stronger confirmation appears?
$BTC
$ARK
$ERA
The market can turn against leveraged traders much faster than they expect. When too many positions lean in the same direction, a sudden move can trigger a painful chain reaction. 📉
According to the reported figures, the latest 24-hour period brought significant pressure across the crypto market:
🔻 $40 billion+ reportedly erased from total crypto market capitalization.
⚠️ 213,000+ traders reportedly liquidated.
⏱️ $270 million+ in liquidations reportedly recorded within a single hour.
📊 Around 94% of those hourly liquidations reportedly involved long positions, according to CoinGlass.
What does this reveal about the market?
When traders use excessive leverage to bet on rising prices, even a sharp market decline can put their positions at risk.
If prices reach a liquidation threshold, exchanges may automatically close leveraged positions. These forced closures can add further selling pressure, potentially creating a domino effect across the market.
However, heavy liquidations do not automatically mean another crash is coming.
They may indicate that overextended positions are being cleared out. What happens next depends on buying demand, selling pressure, liquidity, and broader market sentiment.
A recovery is possible, but continued weakness is also a risk. Liquidation figures alone cannot confirm which direction the market will take.
💡 A valuable lesson for every trader:
Leverage magnifies both potential gains and losses. Use sensible position sizing, establish your exit strategy before entering a trade, and never risk money you cannot afford to lose.
In volatile markets, protecting your capital matters more than chasing every opportunity.
💬 Your opinion: Do these liquidations create an opportunity for a market recovery, or should traders remain cautious until stronger confirmation appears?
$BTC
$ARK
$ERA

527
Bitcoin’s Drop Exposes a Dangerous Weakness in Crypto Trading: Excessive Leverage
The market doesn’t need every trader to turn bearish to trigger a sharp sell-off. Sometimes, too much leverage is enough.
On October 24, Bitcoin slipped below $80,000, while CoinGlass liquidation data cited in market reports showed hundreds of millions of dollars in leveraged positions being wiped out. In one reported 24-hour snapshot, more than 213,000 traders were liquidated.
Why does this matter?
When most liquidations come from long positions, it signals that many leveraged traders were betting on higher prices. As the market falls, some positions lose their required margin and are automatically closed.
Those forced exits can create additional selling pressure, potentially triggering more liquidations and accelerating volatility.
What could happen next?
📉 Bearish scenario: If Bitcoin fails to reclaim important support areas, selling pressure and further long liquidations could extend the decline.
📈 Bullish scenario: If buyers absorb the selling, Bitcoin stabilizes, and trading volume supports a recovery, the liquidation wave could eventually create room for a rebound.
Neither outcome is guaranteed. A liquidation spike alone cannot tell us where the market goes next.
What should traders watch?
• Bitcoin’s support and resistance structure
• Spot trading volume during any recovery
• Futures funding rates and open interest
• Whether fresh liquidation waves continue or begin to fade
One lesson worth remembering: Leverage magnifies mistakes as quickly as it magnifies profits. Keep position sizes manageable, define your invalidation level before entering, and never assume a falling market must bounce simply because liquidations are high.
The real opportunity is not predicting every move. It is waiting for evidence before taking a risk.
What do you think: is this liquidation wave a warning of further downside, or could it be the reset the market needed before recovering?
$BTC
{future}(BTCUSDT)
Bitcoin’s Drop Exposes a Dangerous Weakness in Crypto Trading: Excessive Leverage
The market doesn’t need every trader to turn bearish to trigger a sharp sell-off. Sometimes, too much leverage is enough.
On October 24, Bitcoin slipped below $80,000, while CoinGlass liquidation data cited in market reports showed hundreds of millions of dollars in leveraged positions being wiped out. In one reported 24-hour snapshot, more than 213,000 traders were liquidated.
Why does this matter?
When most liquidations come from long positions, it signals that many leveraged traders were betting on higher prices. As the market falls, some positions lose their required margin and are automatically closed.
Those forced exits can create additional selling pressure, potentially triggering more liquidations and accelerating volatility.
What could happen next?
📉 Bearish scenario: If Bitcoin fails to reclaim important support areas, selling pressure and further long liquidations could extend the decline.
📈 Bullish scenario: If buyers absorb the selling, Bitcoin stabilizes, and trading volume supports a recovery, the liquidation wave could eventually create room for a rebound.
Neither outcome is guaranteed. A liquidation spike alone cannot tell us where the market goes next.
What should traders watch?
• Bitcoin’s support and resistance structure
• Spot trading volume during any recovery
• Futures funding rates and open interest
• Whether fresh liquidation waves continue or begin to fade
One lesson worth remembering: Leverage magnifies mistakes as quickly as it magnifies profits. Keep position sizes manageable, define your invalidation level before entering, and never assume a falling market must bounce simply because liquidations are high.
The real opportunity is not predicting every move. It is waiting for evidence before taking a risk.
What do you think: is this liquidation wave a warning of further downside, or could it be the reset the market needed before recovering?
$BTC
The market doesn’t need every trader to turn bearish to trigger a sharp sell-off. Sometimes, too much leverage is enough.
On October 24, Bitcoin slipped below $80,000, while CoinGlass liquidation data cited in market reports showed hundreds of millions of dollars in leveraged positions being wiped out. In one reported 24-hour snapshot, more than 213,000 traders were liquidated.
Why does this matter?
When most liquidations come from long positions, it signals that many leveraged traders were betting on higher prices. As the market falls, some positions lose their required margin and are automatically closed.
Those forced exits can create additional selling pressure, potentially triggering more liquidations and accelerating volatility.
What could happen next?
📉 Bearish scenario: If Bitcoin fails to reclaim important support areas, selling pressure and further long liquidations could extend the decline.
📈 Bullish scenario: If buyers absorb the selling, Bitcoin stabilizes, and trading volume supports a recovery, the liquidation wave could eventually create room for a rebound.
Neither outcome is guaranteed. A liquidation spike alone cannot tell us where the market goes next.
What should traders watch?
• Bitcoin’s support and resistance structure
• Spot trading volume during any recovery
• Futures funding rates and open interest
• Whether fresh liquidation waves continue or begin to fade
One lesson worth remembering: Leverage magnifies mistakes as quickly as it magnifies profits. Keep position sizes manageable, define your invalidation level before entering, and never assume a falling market must bounce simply because liquidations are high.
The real opportunity is not predicting every move. It is waiting for evidence before taking a risk.
What do you think: is this liquidation wave a warning of further downside, or could it be the reset the market needed before recovering?
$BTC

23
🚨 A Breakout Means Nothing Until the Market Proves It!
Ever entered a trade the moment Bitcoin broke resistance, only to watch the price reverse and hit your stop-loss? You’re not alone. 👀
One of the most valuable trading lessons is to wait for confirmation instead of chasing the candle.
📈 Bullish scenario: Price breaks above resistance, closes convincingly, and successfully retests the level as support. This can suggest buyers are gaining control.
📉 Bearish scenario: Price breaks above resistance but quickly falls back below it. The breakout may be a trap, and late buyers could get caught.
🎯 What should traders watch? • A clear candle close beyond the level. • A retest that holds or fails. • Market structure and trading volume for additional confirmation. • A logical invalidation level before entering.
⚠️ Beginner mistake: Buying because a candle looks powerful without planning where the trade idea becomes invalid.
Remember, no setup is guaranteed. Protecting your capital matters more than catching every move.
💬 Your turn: Do you prefer entering immediately after a breakout or waiting for a retest? What makes you trust your entry?
#BinancePick
$BTC
{future}(BTCUSDT)
🚨 A Breakout Means Nothing Until the Market Proves It!
Ever entered a trade the moment Bitcoin broke resistance, only to watch the price reverse and hit your stop-loss? You’re not alone. 👀
One of the most valuable trading lessons is to wait for confirmation instead of chasing the candle.
📈 Bullish scenario: Price breaks above resistance, closes convincingly, and successfully retests the level as support. This can suggest buyers are gaining control.
📉 Bearish scenario: Price breaks above resistance but quickly falls back below it. The breakout may be a trap, and late buyers could get caught.
🎯 What should traders watch? • A clear candle close beyond the level. • A retest that holds or fails. • Market structure and trading volume for additional confirmation. • A logical invalidation level before entering.
⚠️ Beginner mistake: Buying because a candle looks powerful without planning where the trade idea becomes invalid.
Remember, no setup is guaranteed. Protecting your capital matters more than catching every move.
💬 Your turn: Do you prefer entering immediately after a breakout or waiting for a retest? What makes you trust your entry?
#BinancePick
$BTC
Ever entered a trade the moment Bitcoin broke resistance, only to watch the price reverse and hit your stop-loss? You’re not alone. 👀
One of the most valuable trading lessons is to wait for confirmation instead of chasing the candle.
📈 Bullish scenario: Price breaks above resistance, closes convincingly, and successfully retests the level as support. This can suggest buyers are gaining control.
📉 Bearish scenario: Price breaks above resistance but quickly falls back below it. The breakout may be a trap, and late buyers could get caught.
🎯 What should traders watch? • A clear candle close beyond the level. • A retest that holds or fails. • Market structure and trading volume for additional confirmation. • A logical invalidation level before entering.
⚠️ Beginner mistake: Buying because a candle looks powerful without planning where the trade idea becomes invalid.
Remember, no setup is guaranteed. Protecting your capital matters more than catching every move.
💬 Your turn: Do you prefer entering immediately after a breakout or waiting for a retest? What makes you trust your entry?
#BinancePick
$BTC

1
53
📉 BTC/USDT 4H: Lower Highs Signal Bearish Pressure
Bitcoin’s 4-hour chart shows a clear shift from the earlier rally toward $87,395 to a pattern of weaker rebounds and declining price action. BTC is currently shown near $80,198 on this screenshot.
🔍 Technical lesson: Lower highs can signal weakening momentum.
What the chart shows: Recent rebounds have struggled to reach previous swing highs, while price has continued moving lower. This suggests sellers may still have control.
✅ What confirmation is needed?
- A 4H candle closing below nearby support would strengthen the bearish case.
- A recovery above the latest swing high, followed by sustained strength, would challenge it.
❌ What invalidates the interpretation?
A convincing bullish reversal that breaks the lower-high structure would weaken the bearish outlook.
⚠️ Beginner mistake: Don’t assume every price drop means an immediate short opportunity. Wait for confirmation, define your invalidation level, and manage risk.
📊 Key takeaway: Read the market structure first. Predictions without confirmation can be costly.
#BTC #Bitcoin #TechnicalAnalysis #BinanceSquare
$BTC
{future}(BTCUSDT)
📉 BTC/USDT 4H: Lower Highs Signal Bearish Pressure
Bitcoin’s 4-hour chart shows a clear shift from the earlier rally toward $87,395 to a pattern of weaker rebounds and declining price action. BTC is currently shown near $80,198 on this screenshot.
🔍 Technical lesson: Lower highs can signal weakening momentum.
What the chart shows: Recent rebounds have struggled to reach previous swing highs, while price has continued moving lower. This suggests sellers may still have control.
✅ What confirmation is needed?
- A 4H candle closing below nearby support would strengthen the bearish case.
- A recovery above the latest swing high, followed by sustained strength, would challenge it.
❌ What invalidates the interpretation?
A convincing bullish reversal that breaks the lower-high structure would weaken the bearish outlook.
⚠️ Beginner mistake: Don’t assume every price drop means an immediate short opportunity. Wait for confirmation, define your invalidation level, and manage risk.
📊 Key takeaway: Read the market structure first. Predictions without confirmation can be costly.
#BTC #Bitcoin #TechnicalAnalysis #BinanceSquare
$BTC
Bitcoin’s 4-hour chart shows a clear shift from the earlier rally toward $87,395 to a pattern of weaker rebounds and declining price action. BTC is currently shown near $80,198 on this screenshot.
🔍 Technical lesson: Lower highs can signal weakening momentum.
What the chart shows: Recent rebounds have struggled to reach previous swing highs, while price has continued moving lower. This suggests sellers may still have control.
✅ What confirmation is needed?
- A 4H candle closing below nearby support would strengthen the bearish case.
- A recovery above the latest swing high, followed by sustained strength, would challenge it.
❌ What invalidates the interpretation?
A convincing bullish reversal that breaks the lower-high structure would weaken the bearish outlook.
⚠️ Beginner mistake: Don’t assume every price drop means an immediate short opportunity. Wait for confirmation, define your invalidation level, and manage risk.
📊 Key takeaway: Read the market structure first. Predictions without confirmation can be costly.
#BTC #Bitcoin #TechnicalAnalysis #BinanceSquare
$BTC
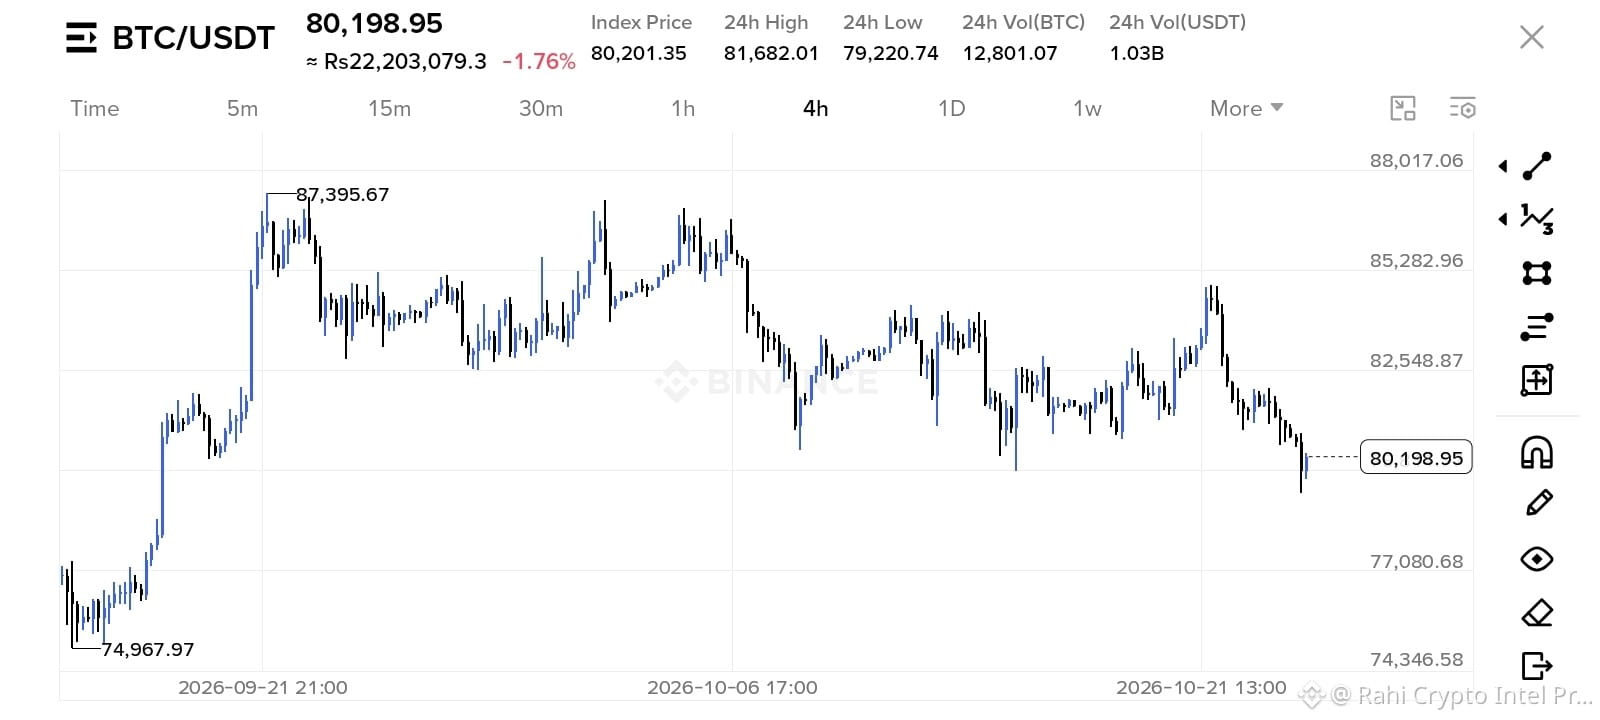
54
📊 Bitcoin Near $80K: Is This a Support Test or a Warning Sign?
Bitcoin was trading around $80,685 in an October 24 market report, while Ethereum hovered near $2,370.
Broader economic uncertainty and weak institutional flows are putting pressure on market sentiment. The upcoming Federal Reserve meeting on October 27–28 is another event traders are watching.
🐻 Bearish case: Persistent selling pressure and weaker risk appetite could make it harder for BTC to recover.
🐂 Bullish case: If buyers defend key price levels and sentiment improves, the market could stabilise.
The important thing is to watch confirmed price action instead of assuming the next move.
Which level would you watch most closely for Bitcoin: $80,000 support or $82,000 resistance?
#Bitcoin #BTC #Ethereum #ETH #CryptoAnalysis
$BTC
{future}(BTCUSDT)
$ETH
{future}(ETHUSDT)
📊 Bitcoin Near $80K: Is This a Support Test or a Warning Sign?
Bitcoin was trading around $80,685 in an October 24 market report, while Ethereum hovered near $2,370.
Broader economic uncertainty and weak institutional flows are putting pressure on market sentiment. The upcoming Federal Reserve meeting on October 27–28 is another event traders are watching.
🐻 Bearish case: Persistent selling pressure and weaker risk appetite could make it harder for BTC to recover.
🐂 Bullish case: If buyers defend key price levels and sentiment improves, the market could stabilise.
The important thing is to watch confirmed price action instead of assuming the next move.
Which level would you watch most closely for Bitcoin: $80,000 support or $82,000 resistance?
#Bitcoin #BTC #Ethereum #ETH #CryptoAnalysis
$BTC
$ETH
Bitcoin was trading around $80,685 in an October 24 market report, while Ethereum hovered near $2,370.
Broader economic uncertainty and weak institutional flows are putting pressure on market sentiment. The upcoming Federal Reserve meeting on October 27–28 is another event traders are watching.
🐻 Bearish case: Persistent selling pressure and weaker risk appetite could make it harder for BTC to recover.
🐂 Bullish case: If buyers defend key price levels and sentiment improves, the market could stabilise.
The important thing is to watch confirmed price action instead of assuming the next move.
Which level would you watch most closely for Bitcoin: $80,000 support or $82,000 resistance?
#Bitcoin #BTC #Ethereum #ETH #CryptoAnalysis
$BTC
$ETH
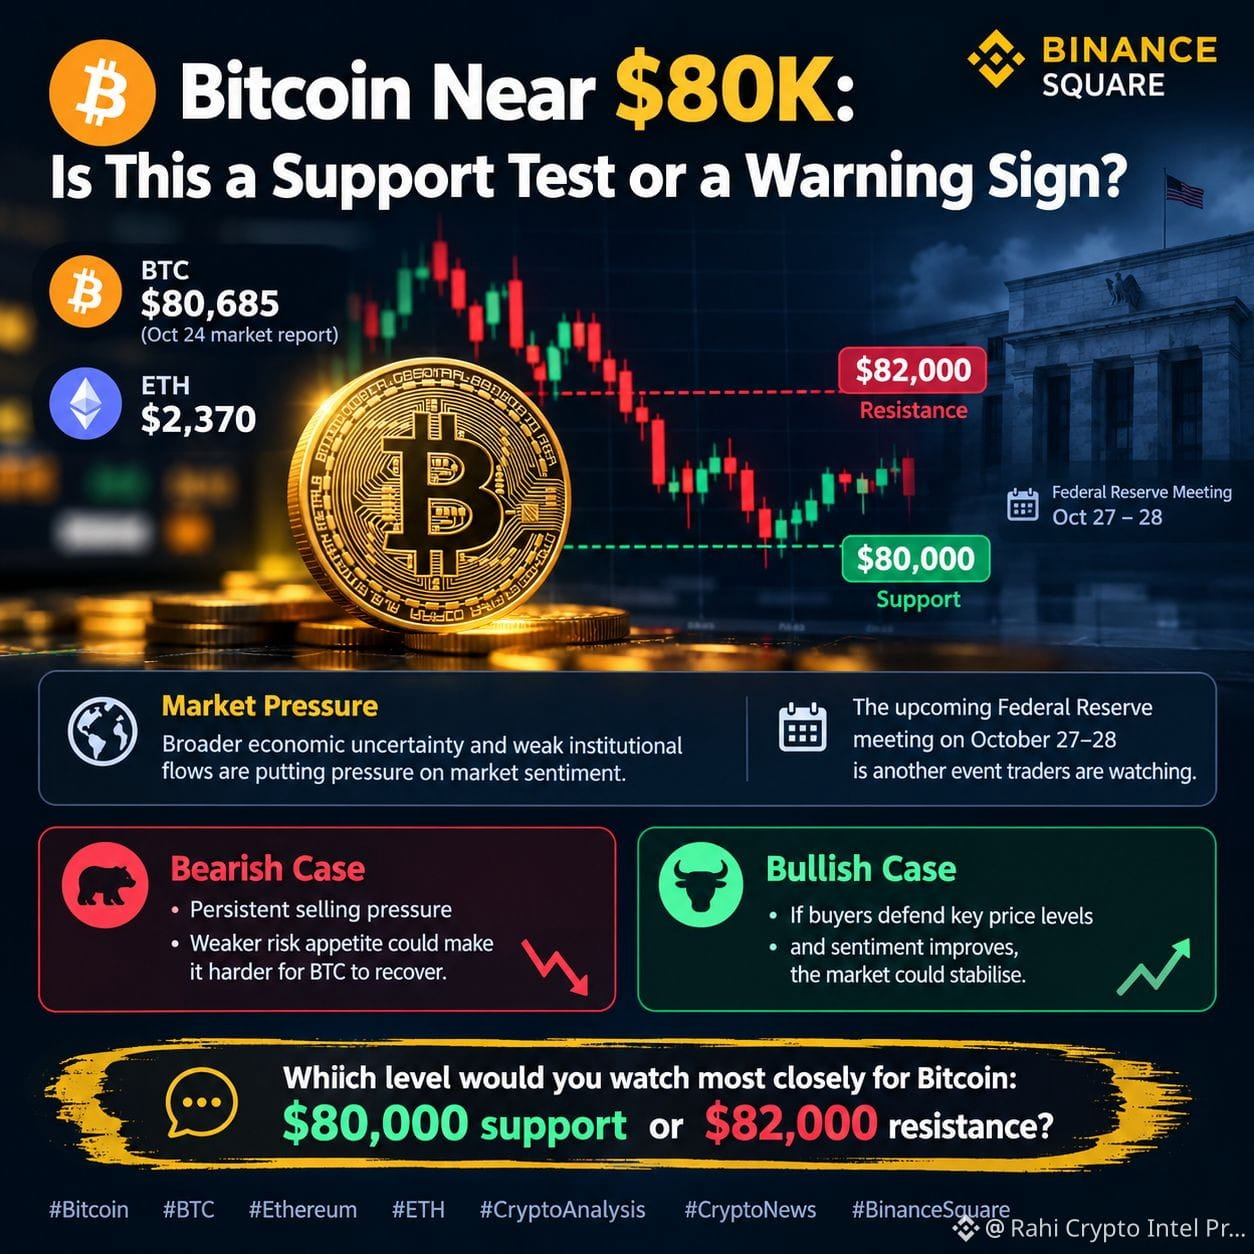
86
Verified
🌏 Asia Is Taking Another Step Toward Cross-Border Digital Money
On October 23, Singapore's MAS announced that Malaysia's central bank and the Bank of Thailand had joined its BLOOM initiative.
The project explores how tokenised bank deposits and regulated stablecoins could support cross-border payments and financial settlement.
✅ Bullish perspective: Better interoperability could make international transactions more efficient and strengthen real-world blockchain adoption.
⚠️ Cautious perspective: Regulation, technical challenges, and trust still matter. A new initiative does not mean widespread adoption will happen overnight.
This is an important development to watch beyond short-term token price movements.
Which use case has greater long-term potential: cross-border stablecoin payments or tokenised bank deposits?
#Stablecoins #Blockchain #CryptoNews #BinanceSquare
$EPIC
{spot}(EPICUSDT)
$ERA
{future}(ERAUSDT)
$ZBT
{future}(ZBTUSDT)
🌏 Asia Is Taking Another Step Toward Cross-Border Digital Money
On October 23, Singapore's MAS announced that Malaysia's central bank and the Bank of Thailand had joined its BLOOM initiative.
The project explores how tokenised bank deposits and regulated stablecoins could support cross-border payments and financial settlement.
✅ Bullish perspective: Better interoperability could make international transactions more efficient and strengthen real-world blockchain adoption.
⚠️ Cautious perspective: Regulation, technical challenges, and trust still matter. A new initiative does not mean widespread adoption will happen overnight.
This is an important development to watch beyond short-term token price movements.
Which use case has greater long-term potential: cross-border stablecoin payments or tokenised bank deposits?
#Stablecoins #Blockchain #CryptoNews #BinanceSquare
$EPIC
$ERA
$ZBT
On October 23, Singapore's MAS announced that Malaysia's central bank and the Bank of Thailand had joined its BLOOM initiative.
The project explores how tokenised bank deposits and regulated stablecoins could support cross-border payments and financial settlement.
✅ Bullish perspective: Better interoperability could make international transactions more efficient and strengthen real-world blockchain adoption.
⚠️ Cautious perspective: Regulation, technical challenges, and trust still matter. A new initiative does not mean widespread adoption will happen overnight.
This is an important development to watch beyond short-term token price movements.
Which use case has greater long-term potential: cross-border stablecoin payments or tokenised bank deposits?
#Stablecoins #Blockchain #CryptoNews #BinanceSquare
$EPIC
$ERA
$ZBT

513
🚨 Bitcoin ETF Outflows Raise a Big Question About Institutional Demand
US spot Bitcoin ETFs reportedly lost around $635.6 million on October 22, reversing a strong inflow day. The latest data also showed another day of net outflows on October 23.
📉 Bearish view: Continued withdrawals could signal weaker institutional demand and add pressure to BTC.
📈 Bullish view: Short-term outflows do not automatically mean institutions have lost confidence. Flows can reverse if market conditions improve.
The key question is whether this is temporary profit-taking or the start of a longer outflow trend.
What matters more to you right now: ETF flows or Bitcoin's price action?
#Bitcoin #BTC #BitcoinETF #CryptoMarket #BinanceSquare
$BTC
{future}(BTCUSDT)
🚨 Bitcoin ETF Outflows Raise a Big Question About Institutional Demand
US spot Bitcoin ETFs reportedly lost around $635.6 million on October 22, reversing a strong inflow day. The latest data also showed another day of net outflows on October 23.
📉 Bearish view: Continued withdrawals could signal weaker institutional demand and add pressure to BTC.
📈 Bullish view: Short-term outflows do not automatically mean institutions have lost confidence. Flows can reverse if market conditions improve.
The key question is whether this is temporary profit-taking or the start of a longer outflow trend.
What matters more to you right now: ETF flows or Bitcoin's price action?
#Bitcoin #BTC #BitcoinETF #CryptoMarket #BinanceSquare
$BTC
US spot Bitcoin ETFs reportedly lost around $635.6 million on October 22, reversing a strong inflow day. The latest data also showed another day of net outflows on October 23.
📉 Bearish view: Continued withdrawals could signal weaker institutional demand and add pressure to BTC.
📈 Bullish view: Short-term outflows do not automatically mean institutions have lost confidence. Flows can reverse if market conditions improve.
The key question is whether this is temporary profit-taking or the start of a longer outflow trend.
What matters more to you right now: ETF flows or Bitcoin's price action?
#Bitcoin #BTC #BitcoinETF #CryptoMarket #BinanceSquare
$BTC
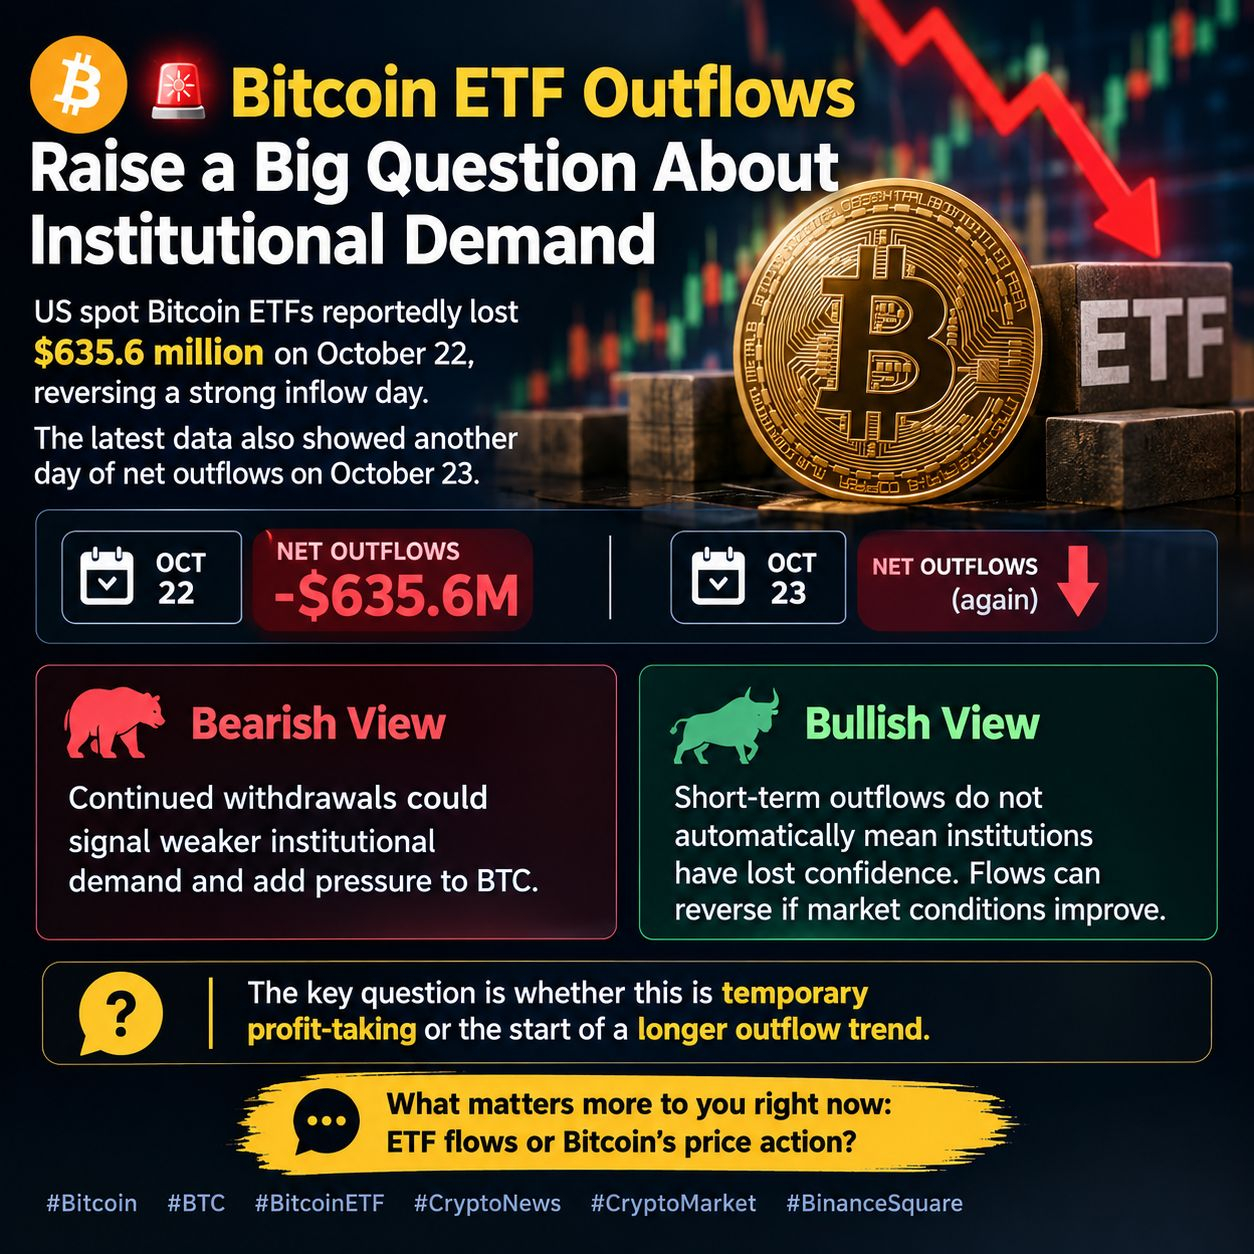
115
Log in to explore more content
Join global crypto users on Binance Square
⚡️ Get latest and useful information about crypto.
💬 Trusted by the world’s largest crypto exchange.
👍 Discover real insights from verified creators.
Email / Phone number
Trending Topics
BinancePick
2.5M views
138,548 Discussing
Join #EarningsSeason: Predict Earnings on Binance Pick, Share Your Take on Binance Square!
Binance Square Official
·400 Likes
·337.3k views
EarningsSeason
4.9M views
23,984 Discussing
ElectrumWalletBugLetRogueServersStealFunds
2,948 views
158 Discussing