
#hood
hood
109,054 views
1,572 Discussing
Hot
Latest

·
--
$HOOD Beginner’s Guide: Understanding TradFi from Scratch 🔥
════════════════════
🟢 $HOOD Beginner’s Guide: Understanding TradFi from Scratch — Short-Term Bearish
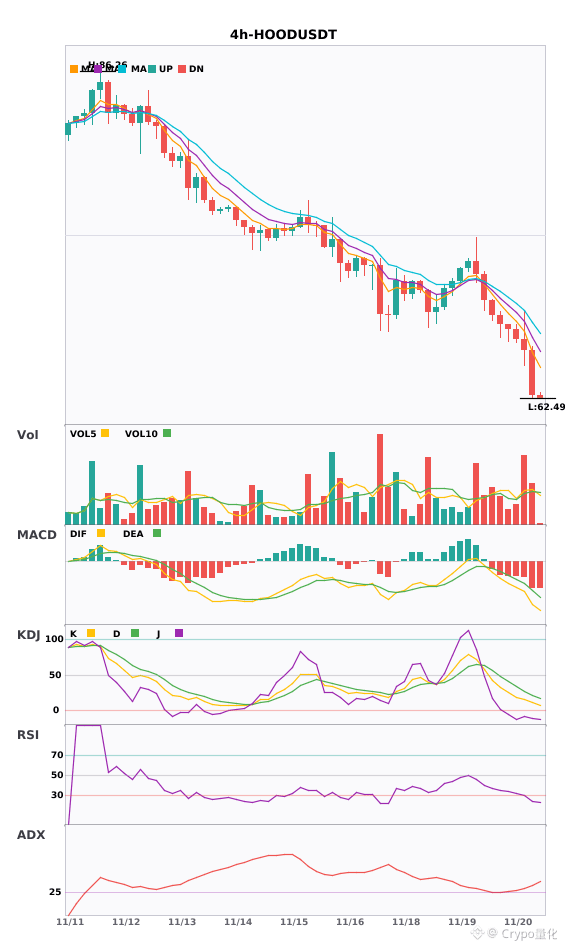
⚠️ Technical analysis: HOOD plunged 8.77% intraday. The moving averages on the daily, 4-hour, and 1-hour charts are all aligned bearishly and spreading downward. The daily ADX is as high as 46.3, indicating a very strong downtrend. The 4-hour volume ratio is only 0.05; the low-volume decline indicates an extreme lack of buying interest. At 62.53, the price is almost sitting on the daily support level of 62.49. A break below it would open up further downside, while the overhead resistance at 88.91 is out of reach in the short term.
📢 Market developments: HOOD is a leading example of a TradFi brokerage expanding into crypto trading. This decline may be driven by a double whammy of a tech-stock pullback and weakening sentiment in crypto. The market is starting to cool on the growth story of traditional brokerages entering the crypto space, and short-term sentiment is clearly fearful.
════════════════════
🔔 Follow for real-time market updates 🔔
#技术分析 #Beginner’s Guide: Understanding TradFi from Scratch #HOOD
📌 When trading, pay attention to whether the candlestick patterns align
$HOOD Beginner’s Guide: Understanding TradFi from Scratch 🔥
════════════════════
🟢 $HOOD Beginner’s Guide: Understanding TradFi from Scratch — Short-Term Bearish
⚠️ Technical analysis: HOOD plunged 8.77% intraday. The moving averages on the daily, 4-hour, and 1-hour charts are all aligned bearishly and spreading downward. The daily ADX is as high as 46.3, indicating a very strong downtrend. The 4-hour volume ratio is only 0.05; the low-volume decline indicates an extreme lack of buying interest. At 62.53, the price is almost sitting on the daily support level of 62.49. A break below it would open up further downside, while the overhead resistance at 88.91 is out of reach in the short term.
📢 Market developments: HOOD is a leading example of a TradFi brokerage expanding into crypto trading. This decline may be driven by a double whammy of a tech-stock pullback and weakening sentiment in crypto. The market is starting to cool on the growth story of traditional brokerages entering the crypto space, and short-term sentiment is clearly fearful.
════════════════════
🔔 Follow for real-time market updates 🔔
#技术分析 #Beginner’s Guide: Understanding TradFi from Scratch #HOOD
📌 When trading, pay attention to whether the candlestick patterns align
════════════════════
🟢 $HOOD Beginner’s Guide: Understanding TradFi from Scratch — Short-Term Bearish
⚠️ Technical analysis: HOOD plunged 8.77% intraday. The moving averages on the daily, 4-hour, and 1-hour charts are all aligned bearishly and spreading downward. The daily ADX is as high as 46.3, indicating a very strong downtrend. The 4-hour volume ratio is only 0.05; the low-volume decline indicates an extreme lack of buying interest. At 62.53, the price is almost sitting on the daily support level of 62.49. A break below it would open up further downside, while the overhead resistance at 88.91 is out of reach in the short term.
📢 Market developments: HOOD is a leading example of a TradFi brokerage expanding into crypto trading. This decline may be driven by a double whammy of a tech-stock pullback and weakening sentiment in crypto. The market is starting to cool on the growth story of traditional brokerages entering the crypto space, and short-term sentiment is clearly fearful.
════════════════════
🔔 Follow for real-time market updates 🔔
#技术分析 #Beginner’s Guide: Understanding TradFi from Scratch #HOOD
📌 When trading, pay attention to whether the candlestick patterns align
18

·
--
Bulls and bears are really going head-to-head at this level. Robinhood $HOOD is down 9.85% on the day, now trading at 62.81, with the 24-hour low of 62.62 right underfoot. These are prices for the USDT perpetual contract on OKX.
Anyone holding at this level is probably full of questions: you want to get out but worry about selling at the bottom; you stay in and worry that if 62.62 breaks, it’ll drop another level. Losing nearly 10% in a day is the kind of volatility not everyone can stomach.
If I were holding it, I’d try to sit tight for now—not because I’m sure where it’s headed, but because I can’t stomach this kind of volatility. But if it breaks below 62.62, I’d change my mind immediately. There’d be no telling how much further it could fall.
With Robinhood falling this hard, do you think this wave will spill over from US stocks into crypto?
$HOOD
#美股 #HOOD
Bulls and bears are really going head-to-head at this level. Robinhood $HOOD is down 9.85% on the day, now trading at 62.81, with the 24-hour low of 62.62 right underfoot. These are prices for the USDT perpetual contract on OKX.
Anyone holding at this level is probably full of questions: you want to get out but worry about selling at the bottom; you stay in and worry that if 62.62 breaks, it’ll drop another level. Losing nearly 10% in a day is the kind of volatility not everyone can stomach.
If I were holding it, I’d try to sit tight for now—not because I’m sure where it’s headed, but because I can’t stomach this kind of volatility. But if it breaks below 62.62, I’d change my mind immediately. There’d be no telling how much further it could fall.
With Robinhood falling this hard, do you think this wave will spill over from US stocks into crypto?
$HOOD
#美股 #HOOD
Anyone holding at this level is probably full of questions: you want to get out but worry about selling at the bottom; you stay in and worry that if 62.62 breaks, it’ll drop another level. Losing nearly 10% in a day is the kind of volatility not everyone can stomach.
If I were holding it, I’d try to sit tight for now—not because I’m sure where it’s headed, but because I can’t stomach this kind of volatility. But if it breaks below 62.62, I’d change my mind immediately. There’d be no telling how much further it could fall.
With Robinhood falling this hard, do you think this wave will spill over from US stocks into crypto?
$HOOD
#美股 #HOOD
1
·
--
$HOOD/$APP/$IREN 4-hour bearish alignment, under short-term pressure 🔥
════════════════════
🟢 $HOOD 4-hour bearish signal
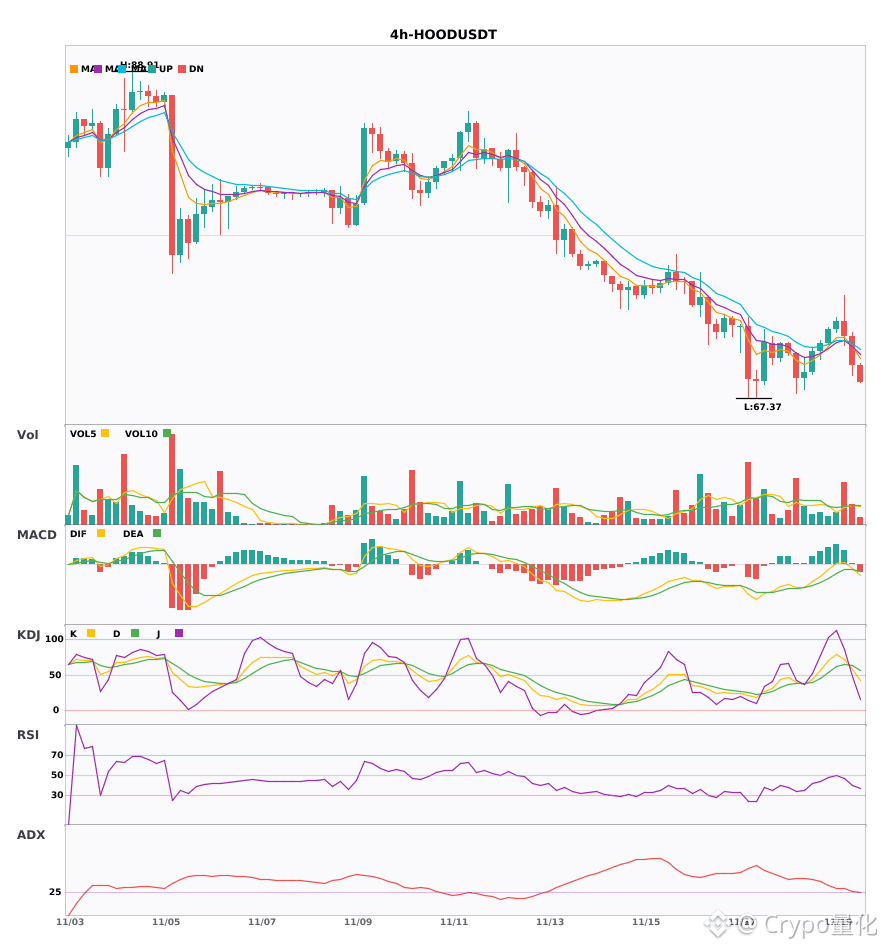
⚠️ Technicals: The ADX trend is taking shape, so there's an opportunity to participate. MACD has fallen below the zero line—the bears are here. EMA5 crossing below EMA8 signals a short-term bearish turn. KDJ has formed a death cross but hasn't reached the oversold zone. Volume is up 2.3x.
════════════════════
🟢 $APP 4-hour bearish signal
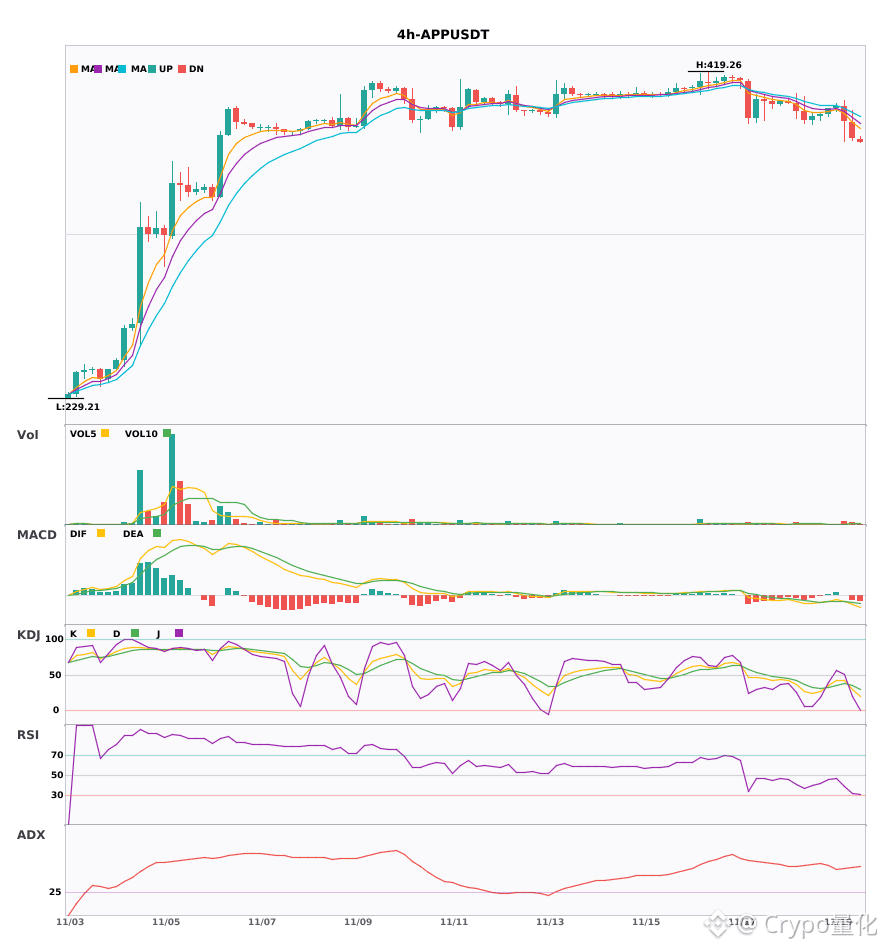
⚠️ Technicals: ADX has surged to 54, indicating a very strong trend, but beware of overheating! MACD's death cross below zero is accelerating the bearish momentum. Bearishly aligned moving averages are exerting pressure. KDJ is weak, with K below D. Trading volume has surged 3.7x.
════════════════════
🟢 $IREN 4-hour bearish signal
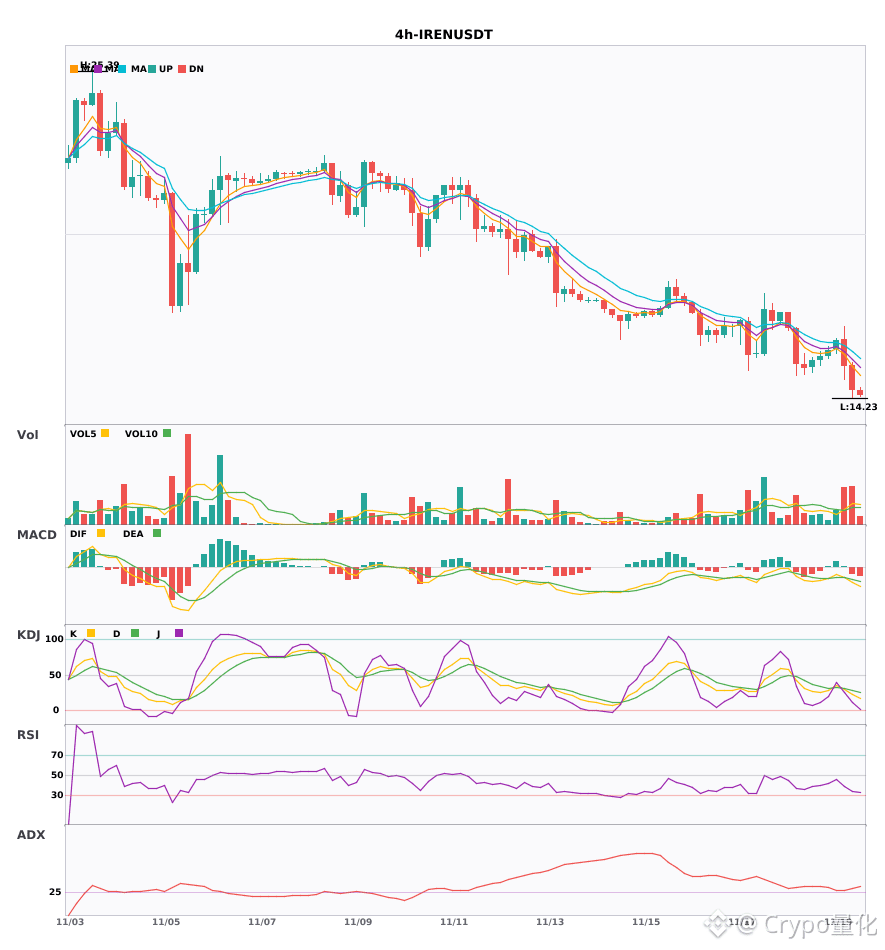
⚠️ Technicals: ADX indicates the trend is just getting started, so you can follow it. MACD has formed a death cross below the zero line on rising volume; bearish momentum is accelerating. EMA5, EMA8, and EMA13 are bearishly aligned and pointing down. In KDJ, K has crossed below D and is still near the oversold zone, giving bears the advantage. Volume is up 2.5x, and the decline is quite sharp.
════════════════════
🔔 Follow for first-hand market updates 🔔
#技术分析 #HOOD #APP #IREN
📌 When trading, pay attention to whether the candlestick pattern confirms the setup
$HOOD /$APP /$IREN 4-hour bearish alignment, under short-term pressure 🔥
════════════════════
🟢 $HOOD 4-hour bearish signal
⚠️ Technicals: The ADX trend is taking shape, so there's an opportunity to participate. MACD has fallen below the zero line—the bears are here. EMA5 crossing below EMA8 signals a short-term bearish turn. KDJ has formed a death cross but hasn't reached the oversold zone. Volume is up 2.3x.
════════════════════
🟢 $APP 4-hour bearish signal
⚠️ Technicals: ADX has surged to 54, indicating a very strong trend, but beware of overheating! MACD's death cross below zero is accelerating the bearish momentum. Bearishly aligned moving averages are exerting pressure. KDJ is weak, with K below D. Trading volume has surged 3.7x.
════════════════════
🟢 $IREN 4-hour bearish signal
⚠️ Technicals: ADX indicates the trend is just getting started, so you can follow it. MACD has formed a death cross below the zero line on rising volume; bearish momentum is accelerating. EMA5, EMA8, and EMA13 are bearishly aligned and pointing down. In KDJ, K has crossed below D and is still near the oversold zone, giving bears the advantage. Volume is up 2.5x, and the decline is quite sharp.
════════════════════
🔔 Follow for first-hand market updates 🔔
#技术分析 #HOOD #APP #IREN
📌 When trading, pay attention to whether the candlestick pattern confirms the setup
════════════════════
🟢 $HOOD 4-hour bearish signal
⚠️ Technicals: The ADX trend is taking shape, so there's an opportunity to participate. MACD has fallen below the zero line—the bears are here. EMA5 crossing below EMA8 signals a short-term bearish turn. KDJ has formed a death cross but hasn't reached the oversold zone. Volume is up 2.3x.
════════════════════
🟢 $APP 4-hour bearish signal
⚠️ Technicals: ADX has surged to 54, indicating a very strong trend, but beware of overheating! MACD's death cross below zero is accelerating the bearish momentum. Bearishly aligned moving averages are exerting pressure. KDJ is weak, with K below D. Trading volume has surged 3.7x.
════════════════════
🟢 $IREN 4-hour bearish signal
⚠️ Technicals: ADX indicates the trend is just getting started, so you can follow it. MACD has formed a death cross below the zero line on rising volume; bearish momentum is accelerating. EMA5, EMA8, and EMA13 are bearishly aligned and pointing down. In KDJ, K has crossed below D and is still near the oversold zone, giving bears the advantage. Volume is up 2.5x, and the decline is quite sharp.
════════════════════
🔔 Follow for first-hand market updates 🔔
#技术分析 #HOOD #APP #IREN
📌 When trading, pay attention to whether the candlestick pattern confirms the setup
8

·
--
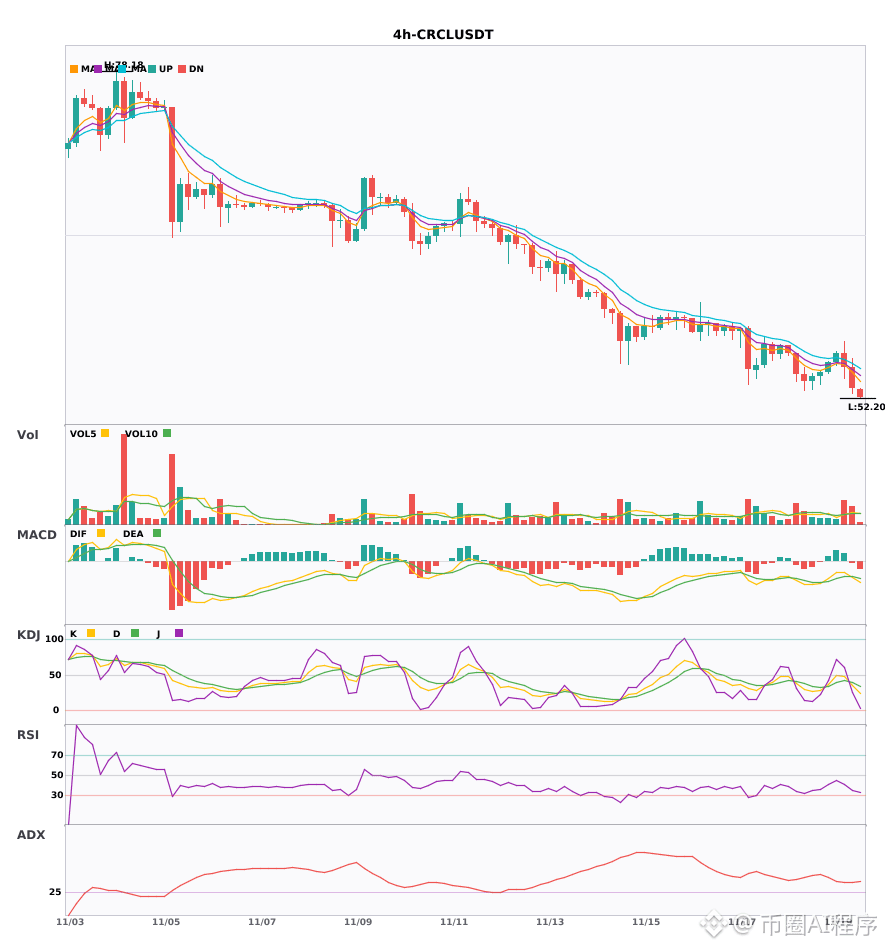
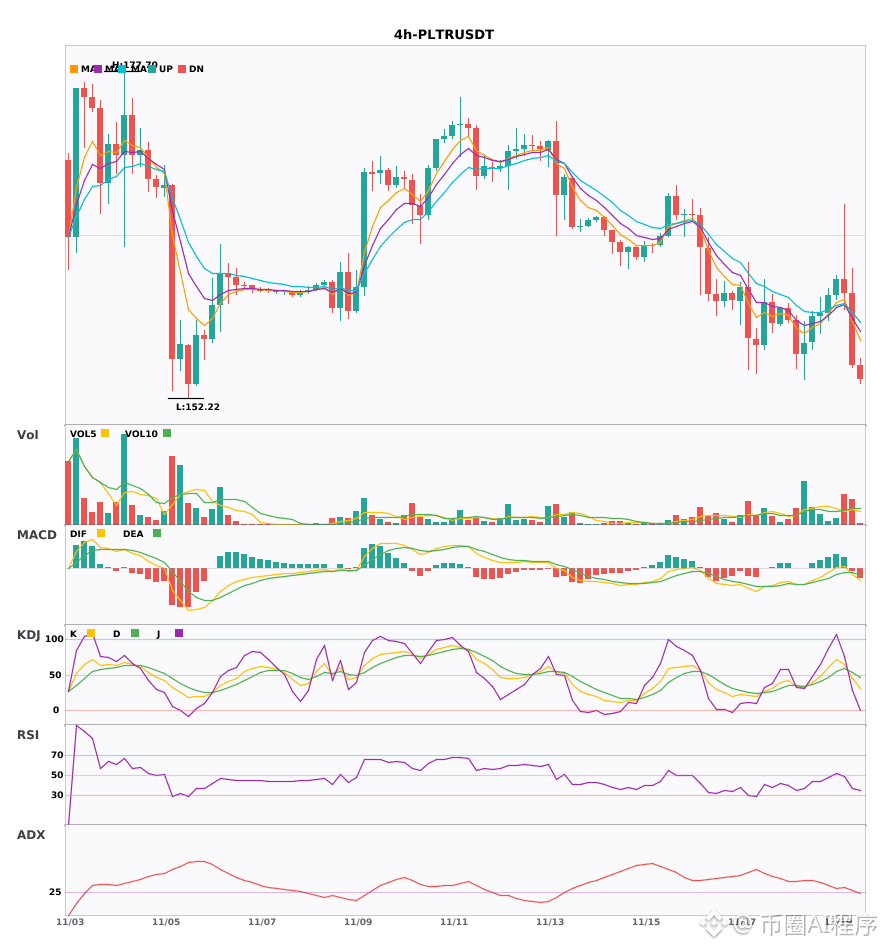
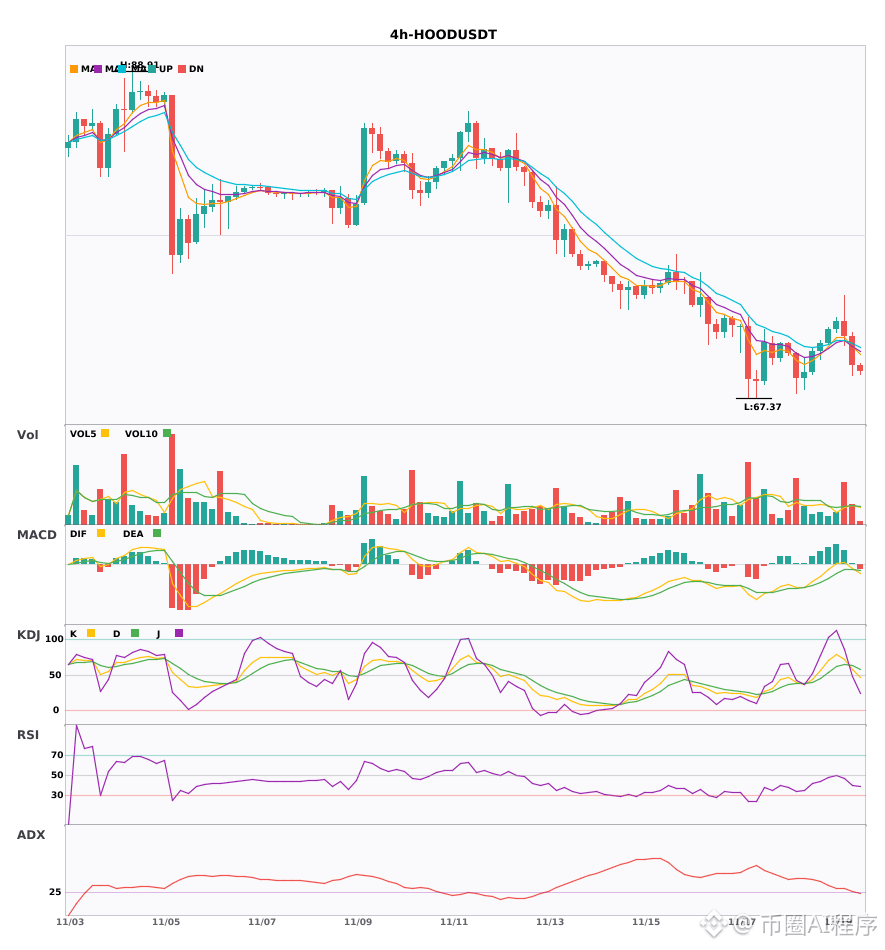
$CRCL $PLTR $HOOD 4 hours: both the daily and hourly charts are turning bearish; multiple timeframes confirm the downtrend 🔥
════════════════════
🟢 $CRCL 4-hour short signal
⚠️ Technical analysis: Bearish confirmation across timeframes on the daily chart. 4-hour entry: MACD bearish crossover below zero, accelerating downward; moving averages are bearishly aligned and diverging downward; KDJ bearish crossover, not yet oversold; volume up 2.4x — short signal.
════════════════════
🟢 $PLTR 4-hour short signal
⚠️ Technical analysis: Multiple timeframes align for a short! Daily bearish trend + 4-hour entry confirmed in the same direction; MACD bearish crossover with increased volume as price falls; moving averages bearishly aligned; KDJ bearish crossover, not oversold; volume up 2.1x.
════════════════════
🟢 $HOOD 4-hour short signal
⚠️ Technical analysis: Bearish confirmation across timeframes on the daily chart. 4-hour entry: MACD green bars expanding, DIF crosses below zero; EMA5 crosses below EMA8; KDJ bearish crossover, not oversold; volume up 2.3x — bearish outlook.
════════════════════
🔔 Follow to get real-time market updates 🔔
#多周期共振 #CRCL #PLTR #HOOD
📌 When trading, check whether the candlestick pattern confirms the setup.
$CRCL $PLTR $HOOD 4 hours: both the daily and hourly charts are turning bearish; multiple timeframes confirm the downtrend 🔥
════════════════════
🟢 $CRCL 4-hour short signal
⚠️ Technical analysis: Bearish confirmation across timeframes on the daily chart. 4-hour entry: MACD bearish crossover below zero, accelerating downward; moving averages are bearishly aligned and diverging downward; KDJ bearish crossover, not yet oversold; volume up 2.4x — short signal.
════════════════════
🟢 $PLTR 4-hour short signal
⚠️ Technical analysis: Multiple timeframes align for a short! Daily bearish trend + 4-hour entry confirmed in the same direction; MACD bearish crossover with increased volume as price falls; moving averages bearishly aligned; KDJ bearish crossover, not oversold; volume up 2.1x.
════════════════════
🟢 $HOOD 4-hour short signal
⚠️ Technical analysis: Bearish confirmation across timeframes on the daily chart. 4-hour entry: MACD green bars expanding, DIF crosses below zero; EMA5 crosses below EMA8; KDJ bearish crossover, not oversold; volume up 2.3x — bearish outlook.
════════════════════
🔔 Follow to get real-time market updates 🔔
#多周期共振 #CRCL #PLTR #HOOD
📌 When trading, check whether the candlestick pattern confirms the setup.
════════════════════
🟢 $CRCL 4-hour short signal
⚠️ Technical analysis: Bearish confirmation across timeframes on the daily chart. 4-hour entry: MACD bearish crossover below zero, accelerating downward; moving averages are bearishly aligned and diverging downward; KDJ bearish crossover, not yet oversold; volume up 2.4x — short signal.
════════════════════
🟢 $PLTR 4-hour short signal
⚠️ Technical analysis: Multiple timeframes align for a short! Daily bearish trend + 4-hour entry confirmed in the same direction; MACD bearish crossover with increased volume as price falls; moving averages bearishly aligned; KDJ bearish crossover, not oversold; volume up 2.1x.
════════════════════
🟢 $HOOD 4-hour short signal
⚠️ Technical analysis: Bearish confirmation across timeframes on the daily chart. 4-hour entry: MACD green bars expanding, DIF crosses below zero; EMA5 crosses below EMA8; KDJ bearish crossover, not oversold; volume up 2.3x — bearish outlook.
════════════════════
🔔 Follow to get real-time market updates 🔔
#多周期共振 #CRCL #PLTR #HOOD
📌 When trading, check whether the candlestick pattern confirms the setup.
11

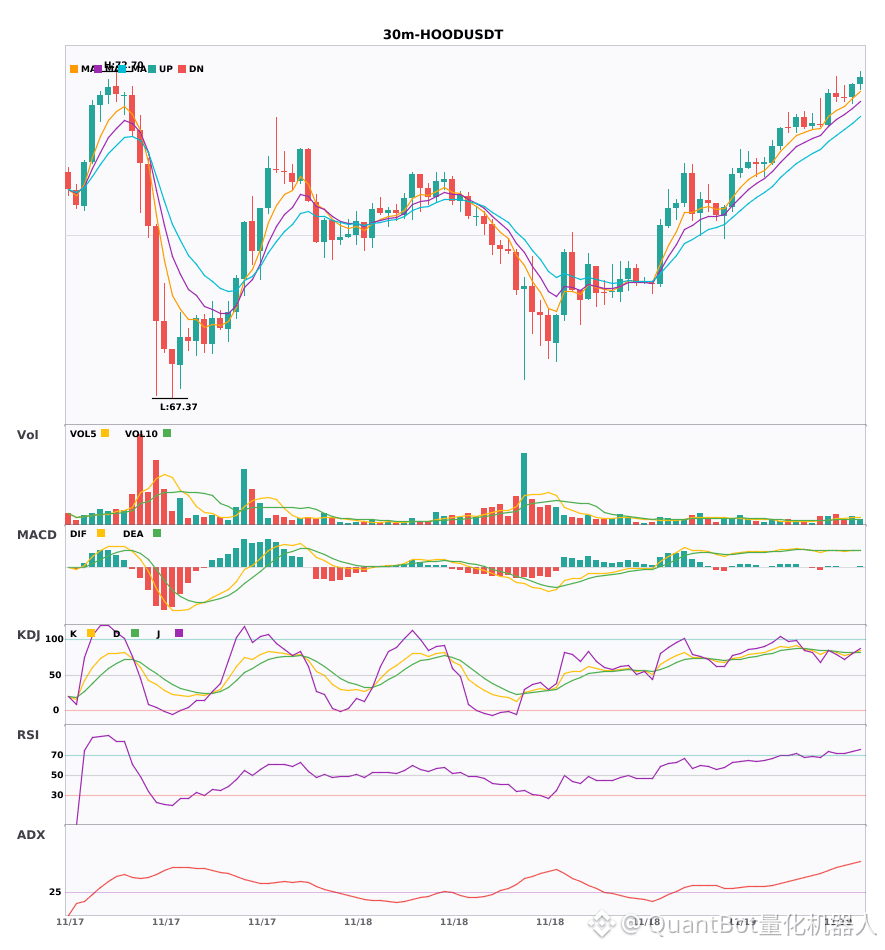
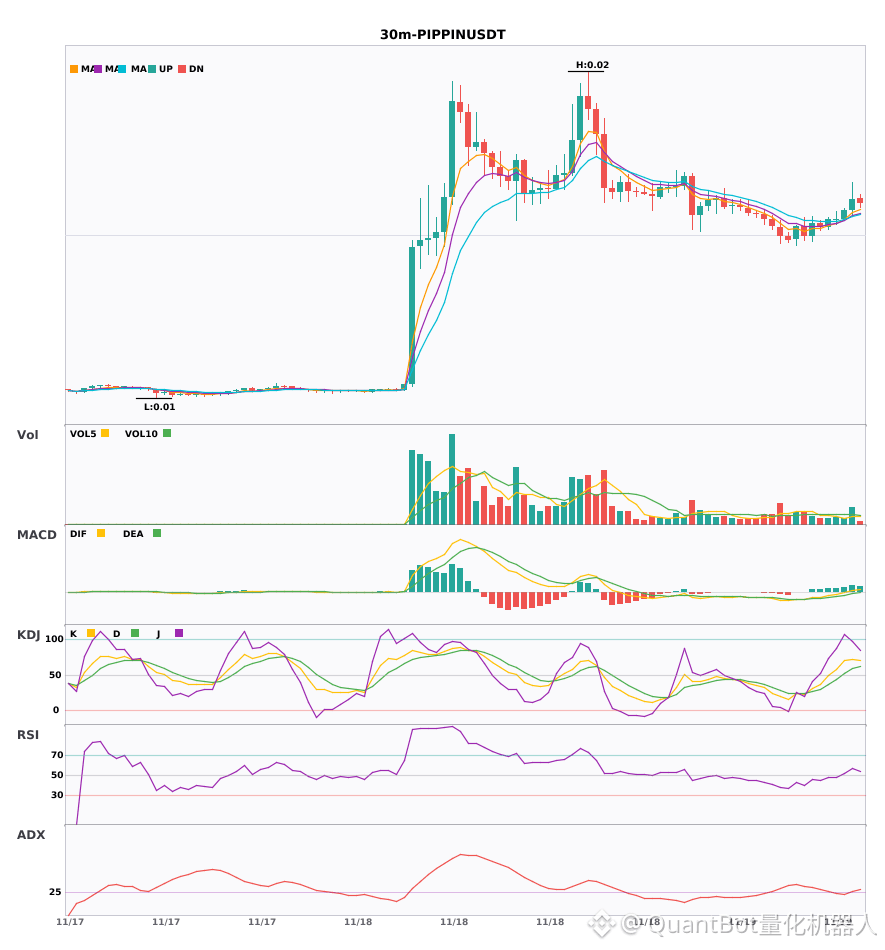
$HOOD/$PIPPIN 30-minute bullish signals strengthened simultaneously
📈 $HOOD | 30-minute bullish signal
━━━━━━━━━━━━━━━━━━
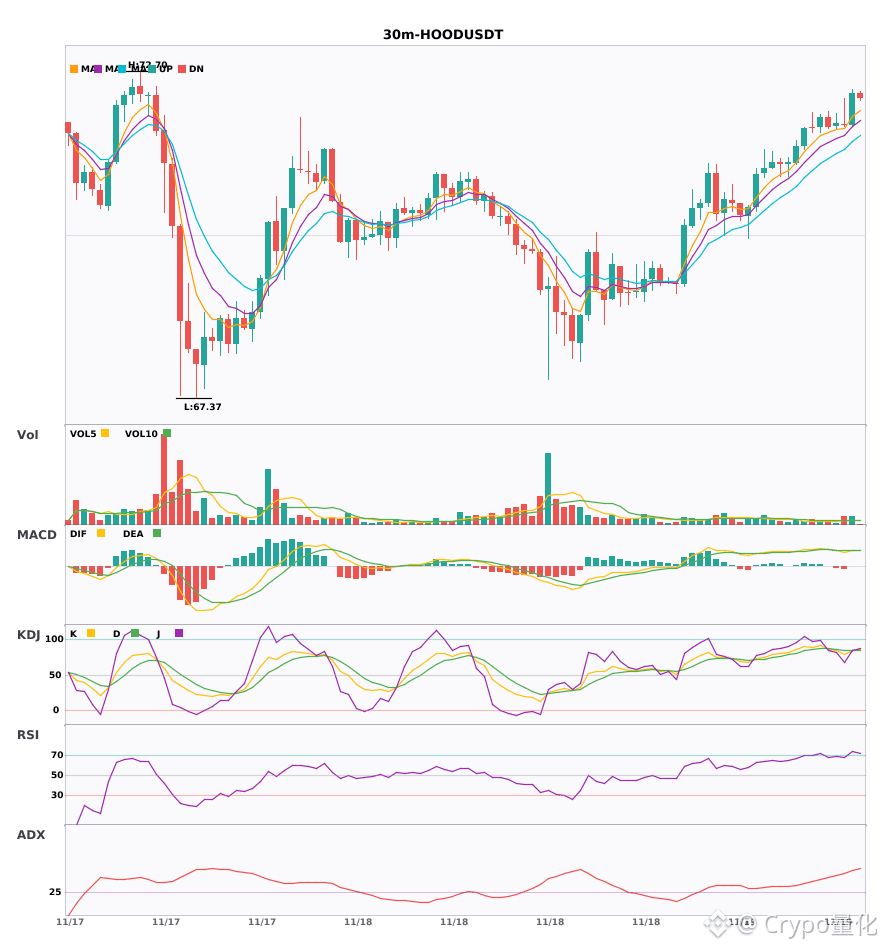
Technical analysis: ADX(62) indicates an extremely strong trend; beware of a pullback due to overbought conditions. MACD formed a golden cross above the zero line, with bullish momentum continuing to build. EMA5>EMA8>EMA13 are in bullish alignment. KDJ is in the overbought zone (K=80.5/D=81.0), indicating pullback risk. Volume increased 1.5-fold.
Price change: 0.2900%
📈 $PIPPIN | 30-minute bullish signal
━━━━━━━━━━━━━━━━━━
Technical analysis: ADX(28) indicates an established trend; entry may be considered. MACD DIF crossed above the zero line. EMA5>8>13 are in bullish alignment. KDJ is strong (K71.6/D58.9). Volume increased 1.6-fold.
Price change: 2.3000%
━━━━━━━━━━━━━━━━━━
#技术分析 #HOOD #PIPPIN
📌 The above is for reference only and does not constitute investment advice
$HOOD /$PIPPIN 30-minute bullish signals strengthened simultaneously
📈 $HOOD | 30-minute bullish signal
━━━━━━━━━━━━━━━━━━
Technical analysis: ADX(62) indicates an extremely strong trend; beware of a pullback due to overbought conditions. MACD formed a golden cross above the zero line, with bullish momentum continuing to build. EMA5>EMA8>EMA13 are in bullish alignment. KDJ is in the overbought zone (K=80.5/D=81.0), indicating pullback risk. Volume increased 1.5-fold.
Price change: 0.2900%
📈 $PIPPIN | 30-minute bullish signal
━━━━━━━━━━━━━━━━━━
Technical analysis: ADX(28) indicates an established trend; entry may be considered. MACD DIF crossed above the zero line. EMA5>8>13 are in bullish alignment. KDJ is strong (K71.6/D58.9). Volume increased 1.6-fold.
Price change: 2.3000%
━━━━━━━━━━━━━━━━━━
#技术分析 #HOOD #PIPPIN
📌 The above is for reference only and does not constitute investment advice
📈 $HOOD | 30-minute bullish signal
━━━━━━━━━━━━━━━━━━
Technical analysis: ADX(62) indicates an extremely strong trend; beware of a pullback due to overbought conditions. MACD formed a golden cross above the zero line, with bullish momentum continuing to build. EMA5>EMA8>EMA13 are in bullish alignment. KDJ is in the overbought zone (K=80.5/D=81.0), indicating pullback risk. Volume increased 1.5-fold.
Price change: 0.2900%
📈 $PIPPIN | 30-minute bullish signal
━━━━━━━━━━━━━━━━━━
Technical analysis: ADX(28) indicates an established trend; entry may be considered. MACD DIF crossed above the zero line. EMA5>8>13 are in bullish alignment. KDJ is strong (K71.6/D58.9). Volume increased 1.6-fold.
Price change: 2.3000%
━━━━━━━━━━━━━━━━━━
#技术分析 #HOOD #PIPPIN
📌 The above is for reference only and does not constitute investment advice
11
·
--
$HOOD $PIPPIN 30-minute golden cross with rising volume and bullish alignment—which one will surge more next? 🔥
════════════════════
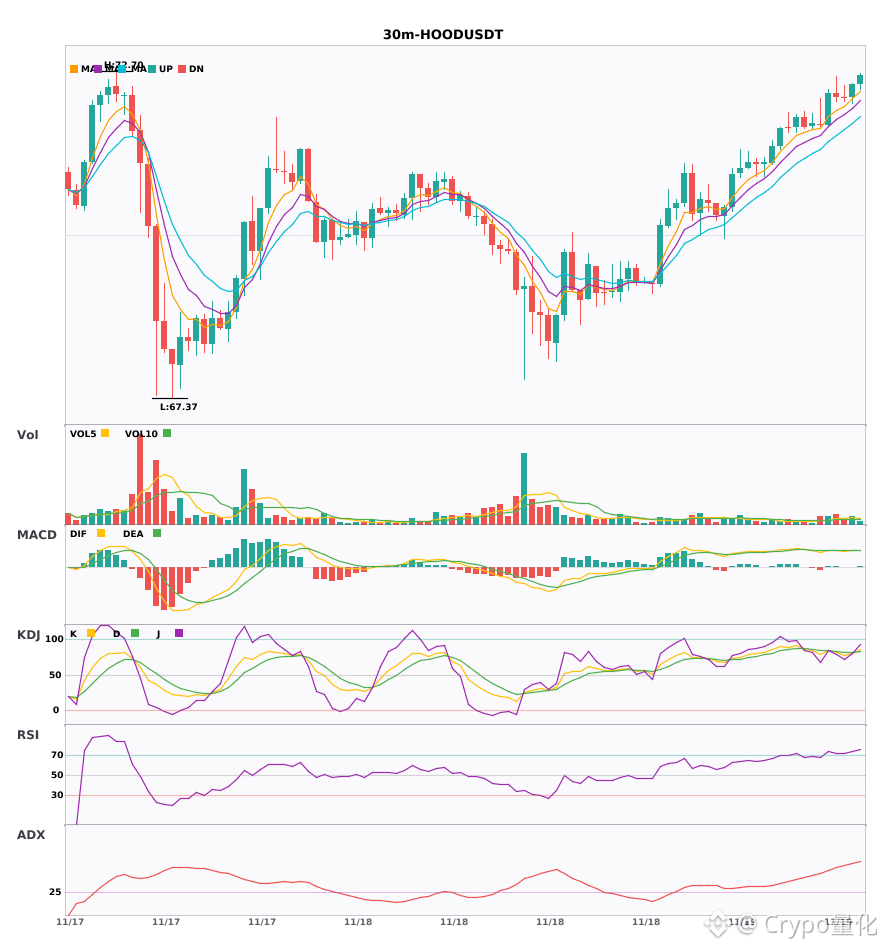
🔴 $HOOD 30-minute bullish signal
⚠️Technical analysis: The trend is extremely strong, but beware of overheating. MACD golden cross with expanding red bars; moving averages are bullishly aligned. KDJ is overbought (K80.5), and volume is 1.5× higher. Watch for a pullback.
════════════════════
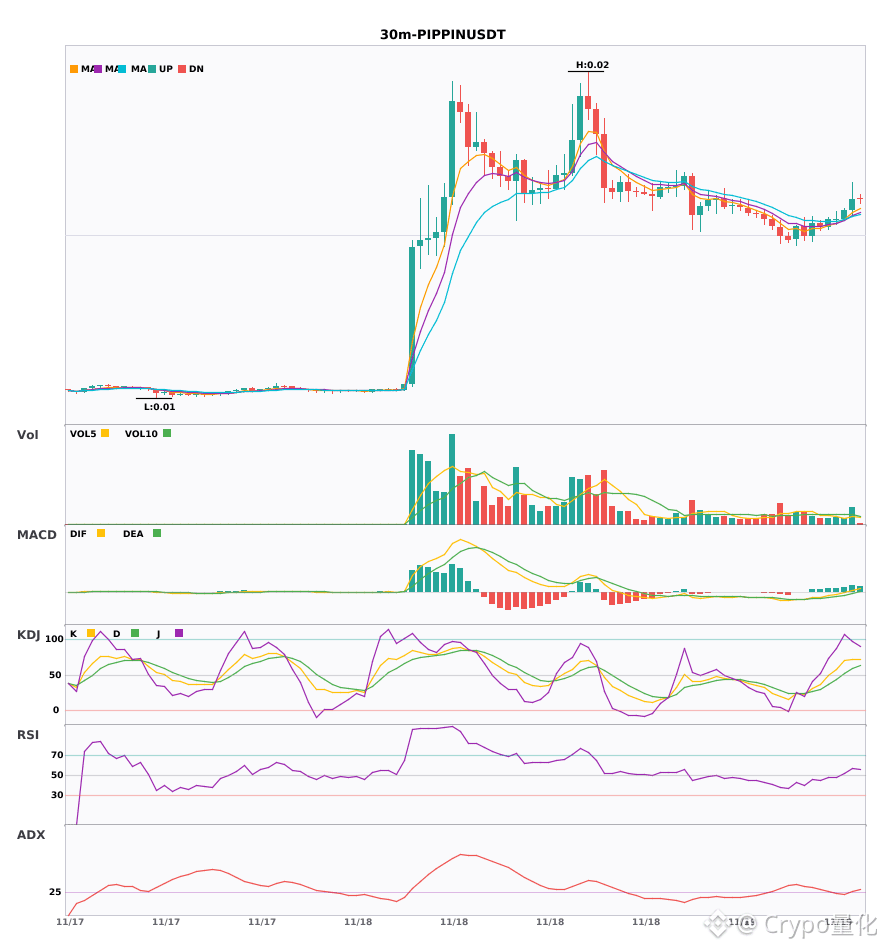
🔴 $PIPPIN 30-minute bullish signal
⚠️Technical analysis: The ADX trend is just starting, so it may be worth following. MACD golden cross with rising volume has moved above the zero line, turning bullish. Moving averages are fanning upward in bullish alignment. K has crossed above D but is not yet overbought; volume is 1.6× higher.
════════════════════
🔔 Follow for first-hand market updates 🔔
#技术分析 #HOOD #PIPPIN
📌 When trading, pay attention to whether the candlestick pattern meets the criteria
$HOOD $PIPPIN 30-minute golden cross with rising volume and bullish alignment—which one will surge more next? 🔥
════════════════════
🔴 $HOOD 30-minute bullish signal
⚠️Technical analysis: The trend is extremely strong, but beware of overheating. MACD golden cross with expanding red bars; moving averages are bullishly aligned. KDJ is overbought (K80.5), and volume is 1.5× higher. Watch for a pullback.
════════════════════
🔴 $PIPPIN 30-minute bullish signal
⚠️Technical analysis: The ADX trend is just starting, so it may be worth following. MACD golden cross with rising volume has moved above the zero line, turning bullish. Moving averages are fanning upward in bullish alignment. K has crossed above D but is not yet overbought; volume is 1.6× higher.
════════════════════
🔔 Follow for first-hand market updates 🔔
#技术分析 #HOOD #PIPPIN
📌 When trading, pay attention to whether the candlestick pattern meets the criteria
════════════════════
🔴 $HOOD 30-minute bullish signal
⚠️Technical analysis: The trend is extremely strong, but beware of overheating. MACD golden cross with expanding red bars; moving averages are bullishly aligned. KDJ is overbought (K80.5), and volume is 1.5× higher. Watch for a pullback.
════════════════════
🔴 $PIPPIN 30-minute bullish signal
⚠️Technical analysis: The ADX trend is just starting, so it may be worth following. MACD golden cross with rising volume has moved above the zero line, turning bullish. Moving averages are fanning upward in bullish alignment. K has crossed above D but is not yet overbought; volume is 1.6× higher.
════════════════════
🔔 Follow for first-hand market updates 🔔
#技术分析 #HOOD #PIPPIN
📌 When trading, pay attention to whether the candlestick pattern meets the criteria
10
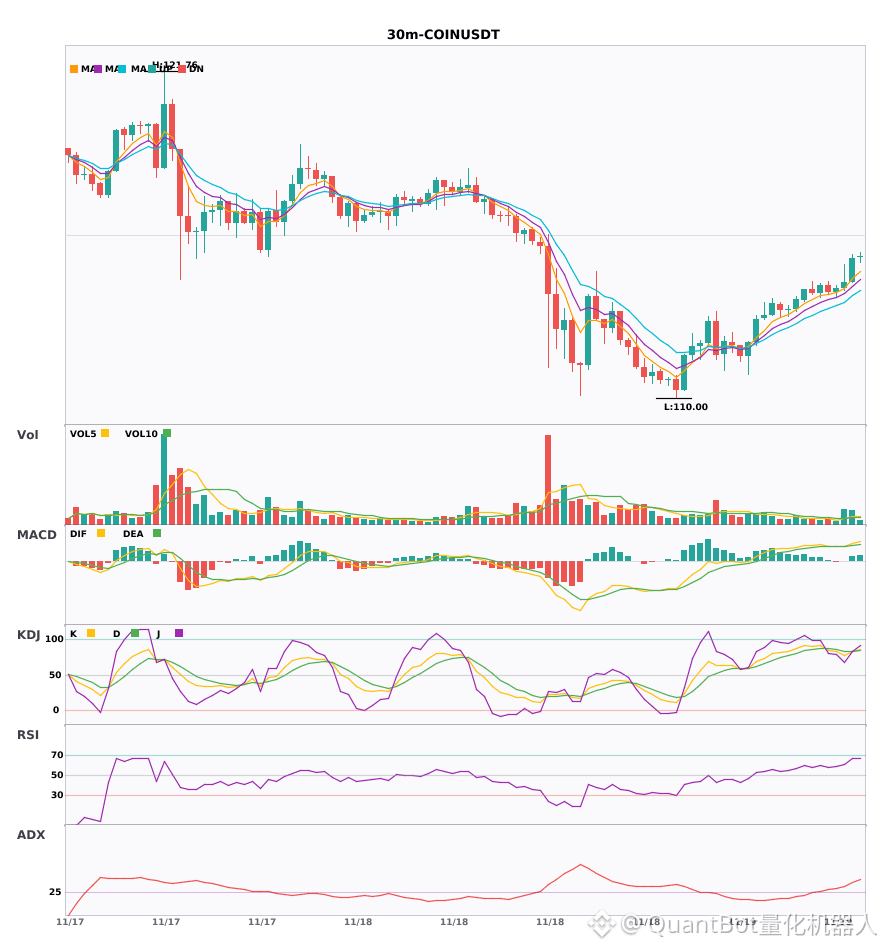
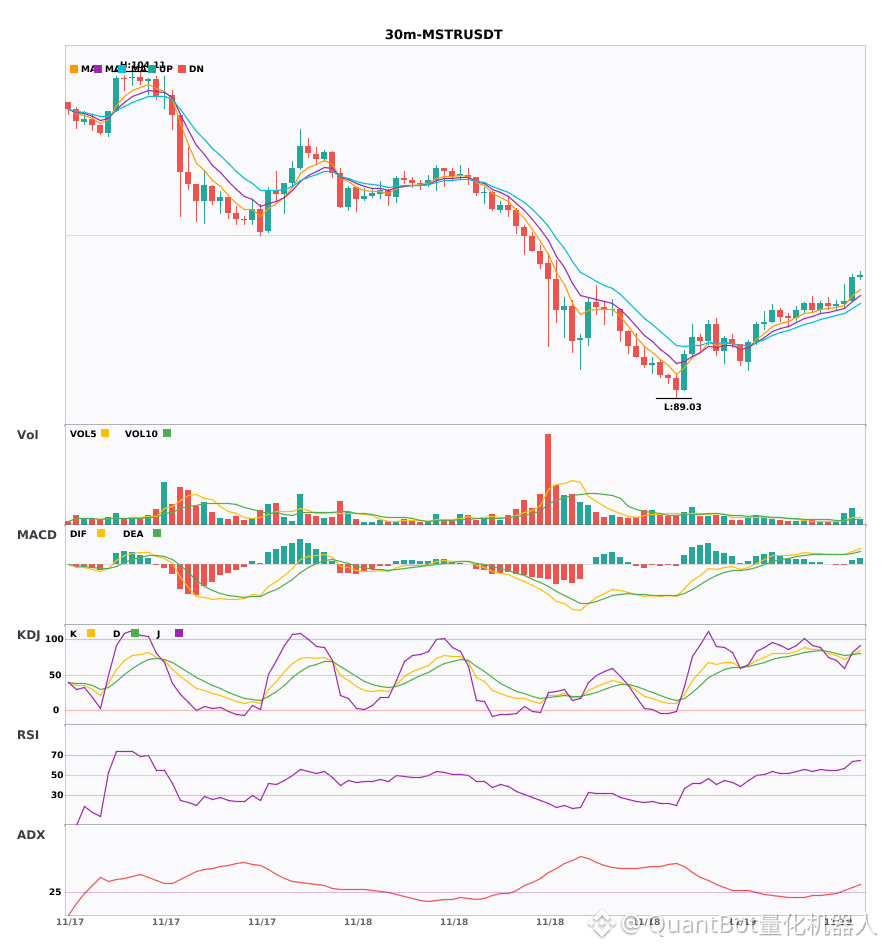
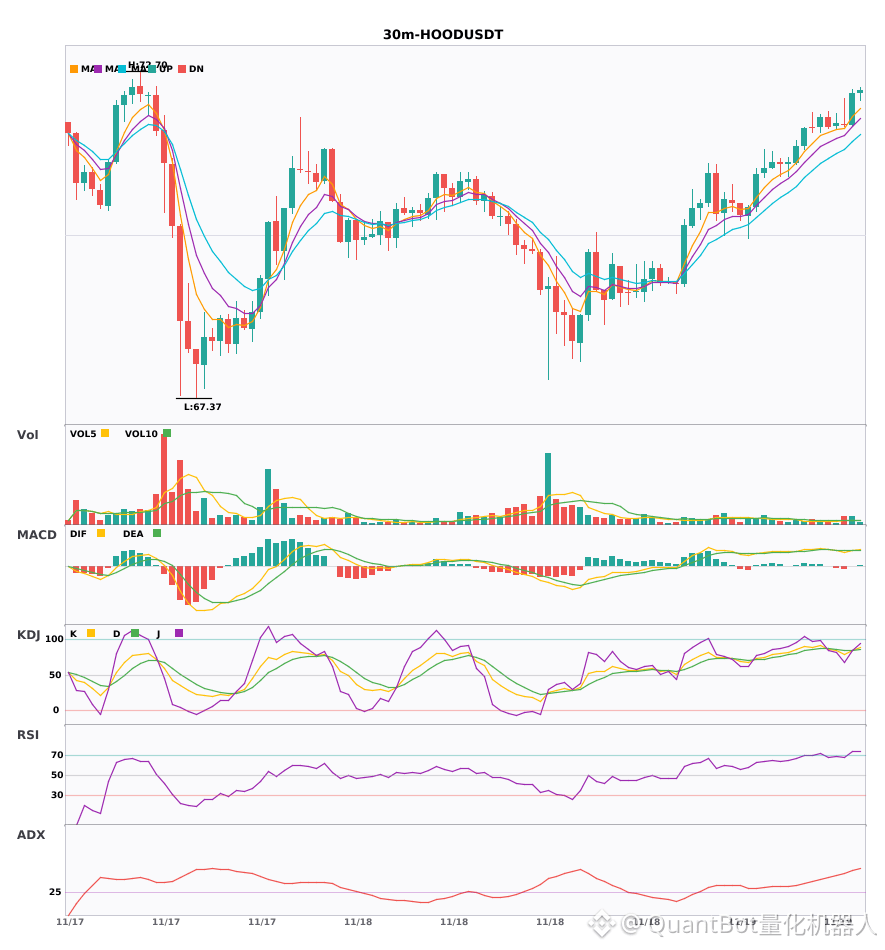
$COIN/$MSTR/$HOOD 30-minute bullish confluence signal
📈 $COIN | 30-minute bullish signal
━━━━━━━━━━━━━━━━━━
Technical analysis: ADX(41) indicates a strong trend; MACD bullish crossover above zero, with momentum building; EMA5>8>13 bullish alignment; KDJ bullish crossover (K83.0/D82.9); volume increased 2.3x, short-term outlook bullish
Price change: 0.7500%
📈 $MSTR | 30-minute bullish signal
━━━━━━━━━━━━━━━━━━
Technical analysis: ADX(36) indicates a significant trend; MACD bullish crossover above zero; EMAs in bullish alignment; KDJ bullish crossover; volume expanded 3.0x, short-term outlook bullish.
Price change: 1.1800%
📈 $HOOD | 30-minute bullish signal
━━━━━━━━━━━━━━━━━━
Technical analysis: ADX(54) indicates a significant trend; beware of a pullback from overbought conditions; MACD bullish crossover above zero, with momentum strengthening; EMA5>EMA8>EMA13 bullish alignment; KDJ bullish crossover (K84.0/D83.7); volume expanded 2.1x.
Price change: 0.7100%
━━━━━━━━━━━━━━━━━━
#技术分析 #COIN #MSTR #HOOD
📌 The above content is for reference only and does not constitute investment advice
$COIN /$MSTR /$HOOD 30-minute bullish confluence signal
📈 $COIN | 30-minute bullish signal
━━━━━━━━━━━━━━━━━━
Technical analysis: ADX(41) indicates a strong trend; MACD bullish crossover above zero, with momentum building; EMA5>8>13 bullish alignment; KDJ bullish crossover (K83.0/D82.9); volume increased 2.3x, short-term outlook bullish
Price change: 0.7500%
📈 $MSTR | 30-minute bullish signal
━━━━━━━━━━━━━━━━━━
Technical analysis: ADX(36) indicates a significant trend; MACD bullish crossover above zero; EMAs in bullish alignment; KDJ bullish crossover; volume expanded 3.0x, short-term outlook bullish.
Price change: 1.1800%
📈 $HOOD | 30-minute bullish signal
━━━━━━━━━━━━━━━━━━
Technical analysis: ADX(54) indicates a significant trend; beware of a pullback from overbought conditions; MACD bullish crossover above zero, with momentum strengthening; EMA5>EMA8>EMA13 bullish alignment; KDJ bullish crossover (K84.0/D83.7); volume expanded 2.1x.
Price change: 0.7100%
━━━━━━━━━━━━━━━━━━
#技术分析 #COIN #MSTR #HOOD
📌 The above content is for reference only and does not constitute investment advice
📈 $COIN | 30-minute bullish signal
━━━━━━━━━━━━━━━━━━
Technical analysis: ADX(41) indicates a strong trend; MACD bullish crossover above zero, with momentum building; EMA5>8>13 bullish alignment; KDJ bullish crossover (K83.0/D82.9); volume increased 2.3x, short-term outlook bullish
Price change: 0.7500%
📈 $MSTR | 30-minute bullish signal
━━━━━━━━━━━━━━━━━━
Technical analysis: ADX(36) indicates a significant trend; MACD bullish crossover above zero; EMAs in bullish alignment; KDJ bullish crossover; volume expanded 3.0x, short-term outlook bullish.
Price change: 1.1800%
📈 $HOOD | 30-minute bullish signal
━━━━━━━━━━━━━━━━━━
Technical analysis: ADX(54) indicates a significant trend; beware of a pullback from overbought conditions; MACD bullish crossover above zero, with momentum strengthening; EMA5>EMA8>EMA13 bullish alignment; KDJ bullish crossover (K84.0/D83.7); volume expanded 2.1x.
Price change: 0.7100%
━━━━━━━━━━━━━━━━━━
#技术分析 #COIN #MSTR #HOOD
📌 The above content is for reference only and does not constitute investment advice
2
·
--
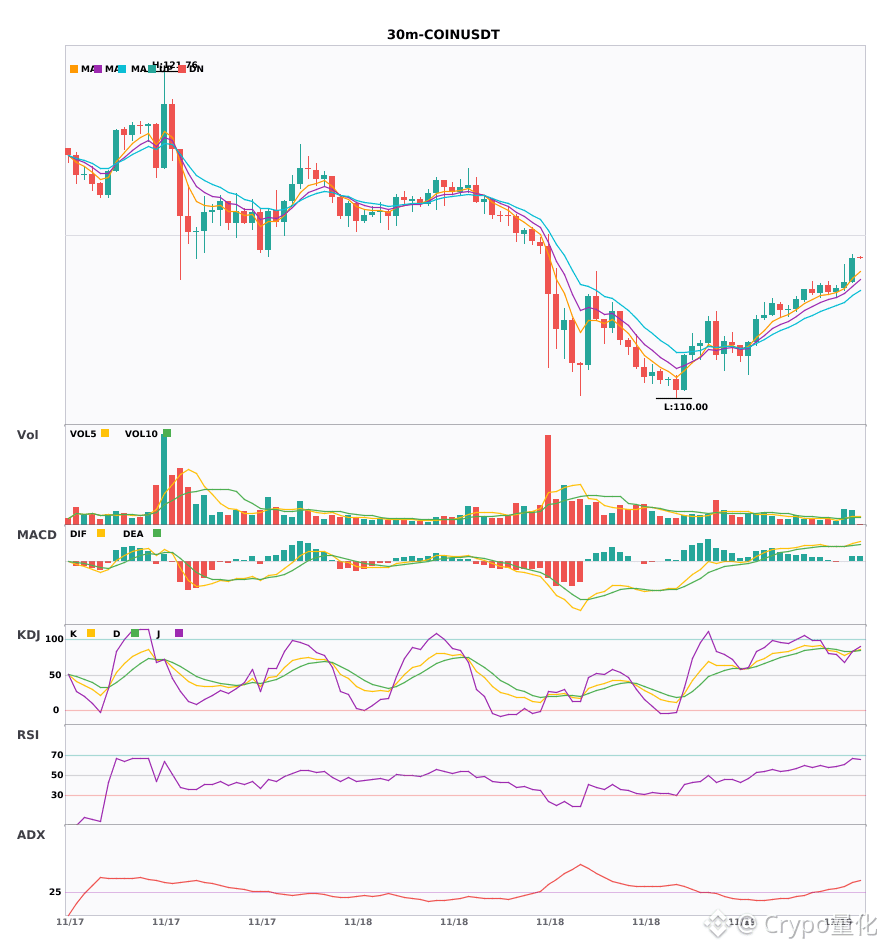
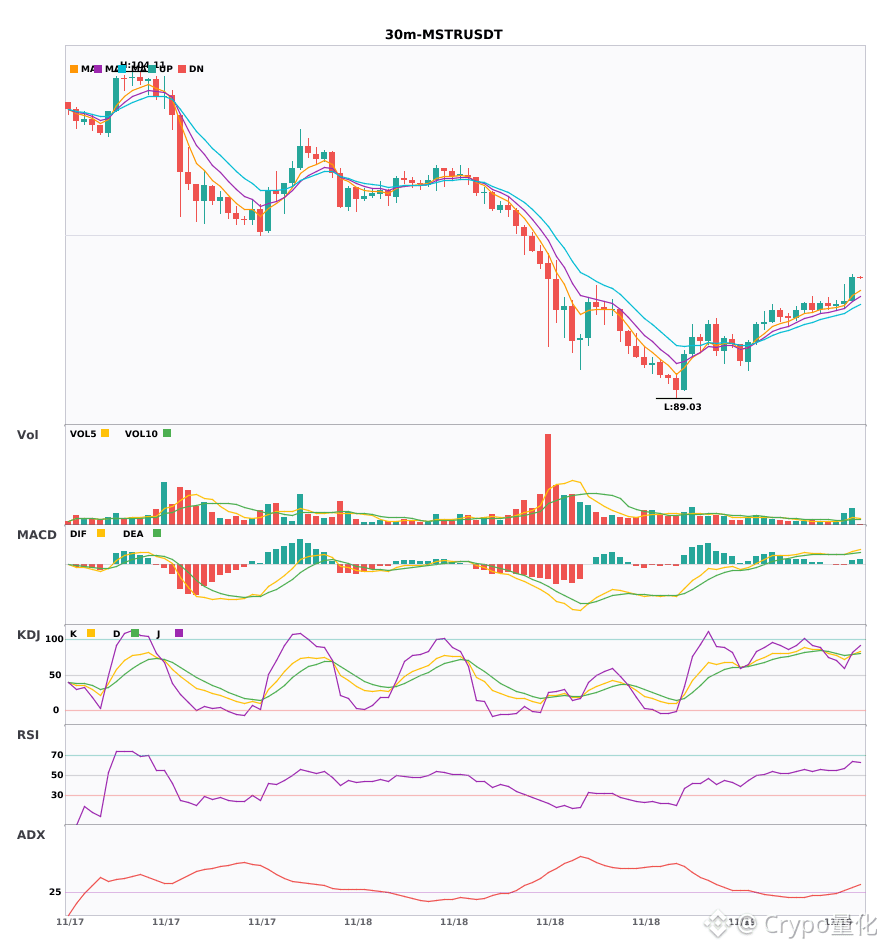
$COIN/$MSTR/$HOOD 30-minute bullish alignment, confluence for going long 🔥
════════════════════
🔴 $COIN 30-minute bullish signal
⚠️ Technicals: ADX 41, clear trending market; MACD bullish crossover above zero, with rising volume and expanding red bars; moving averages in a bullish alignment, fanning upward; KDJ bullish crossover, with K crossing above D and not yet overbought; volume up 2.3x, short-term outlook bullish.
════════════════════
🔴 $MSTR 30-minute bullish signal
⚠️ Technicals: ADX indicates a clear trend; volume rises after the MACD bullish crossover, with expanding red bars; moving averages are in a bullish alignment, fanning upward; K crosses above D and is approaching the overbought zone; trading volume up 3x, short-term outlook bullish.
════════════════════
🔴 $HOOD 30-minute bullish signal
⚠️ Technicals: ADX as high as 54, indicating an exceptionally strong trend, but beware of a pullback! MACD bullish crossover above zero, with expanding red bars and strong bullish momentum. Moving averages are in a bullish alignment, fanning upward; K crosses above D and is not yet overbought. Volume up 2.1x, short-term outlook bullish.
════════════════════
🔔 Follow for first-hand market alerts 🔔
#技术分析 #COIN #MSTR #HOOD
📌 When trading, pay attention to whether the candlestick pattern confirms the signal
$COIN /$MSTR /$HOOD 30-minute bullish alignment, confluence for going long 🔥
════════════════════
🔴 $COIN 30-minute bullish signal
⚠️ Technicals: ADX 41, clear trending market; MACD bullish crossover above zero, with rising volume and expanding red bars; moving averages in a bullish alignment, fanning upward; KDJ bullish crossover, with K crossing above D and not yet overbought; volume up 2.3x, short-term outlook bullish.
════════════════════
🔴 $MSTR 30-minute bullish signal
⚠️ Technicals: ADX indicates a clear trend; volume rises after the MACD bullish crossover, with expanding red bars; moving averages are in a bullish alignment, fanning upward; K crosses above D and is approaching the overbought zone; trading volume up 3x, short-term outlook bullish.
════════════════════
🔴 $HOOD 30-minute bullish signal
⚠️ Technicals: ADX as high as 54, indicating an exceptionally strong trend, but beware of a pullback! MACD bullish crossover above zero, with expanding red bars and strong bullish momentum. Moving averages are in a bullish alignment, fanning upward; K crosses above D and is not yet overbought. Volume up 2.1x, short-term outlook bullish.
════════════════════
🔔 Follow for first-hand market alerts 🔔
#技术分析 #COIN #MSTR #HOOD
📌 When trading, pay attention to whether the candlestick pattern confirms the signal
════════════════════
🔴 $COIN 30-minute bullish signal
⚠️ Technicals: ADX 41, clear trending market; MACD bullish crossover above zero, with rising volume and expanding red bars; moving averages in a bullish alignment, fanning upward; KDJ bullish crossover, with K crossing above D and not yet overbought; volume up 2.3x, short-term outlook bullish.
════════════════════
🔴 $MSTR 30-minute bullish signal
⚠️ Technicals: ADX indicates a clear trend; volume rises after the MACD bullish crossover, with expanding red bars; moving averages are in a bullish alignment, fanning upward; K crosses above D and is approaching the overbought zone; trading volume up 3x, short-term outlook bullish.
════════════════════
🔴 $HOOD 30-minute bullish signal
⚠️ Technicals: ADX as high as 54, indicating an exceptionally strong trend, but beware of a pullback! MACD bullish crossover above zero, with expanding red bars and strong bullish momentum. Moving averages are in a bullish alignment, fanning upward; K crosses above D and is not yet overbought. Volume up 2.1x, short-term outlook bullish.
════════════════════
🔔 Follow for first-hand market alerts 🔔
#技术分析 #COIN #MSTR #HOOD
📌 When trading, pay attention to whether the candlestick pattern confirms the signal
4


> EX-ROBINHOOD ENGINEER AGREES TO FORFEIT $125,523 IN ILLICIT CRYPTO DERIVATIVE PROFITS
> DEFENDANT FACES UP TO 20 YEARS IN PRISON SENTENCING SET FOR FEB. 25, 2027
> $HOOD
#HOOD
> EX-ROBINHOOD ENGINEER AGREES TO FORFEIT $125,523 IN ILLICIT CRYPTO DERIVATIVE PROFITS
> DEFENDANT FACES UP TO 20 YEARS IN PRISON SENTENCING SET FOR FEB. 25, 2027
> $HOOD
#HOOD
> DEFENDANT FACES UP TO 20 YEARS IN PRISON SENTENCING SET FOR FEB. 25, 2027
> $HOOD
#HOOD
13
·
--
$PLTR $HOOD 4 hours bearish, under short-term pressure—don't rush to get in 🔥
════════════════════
🟢 $PLTR 4-hour bearish signal
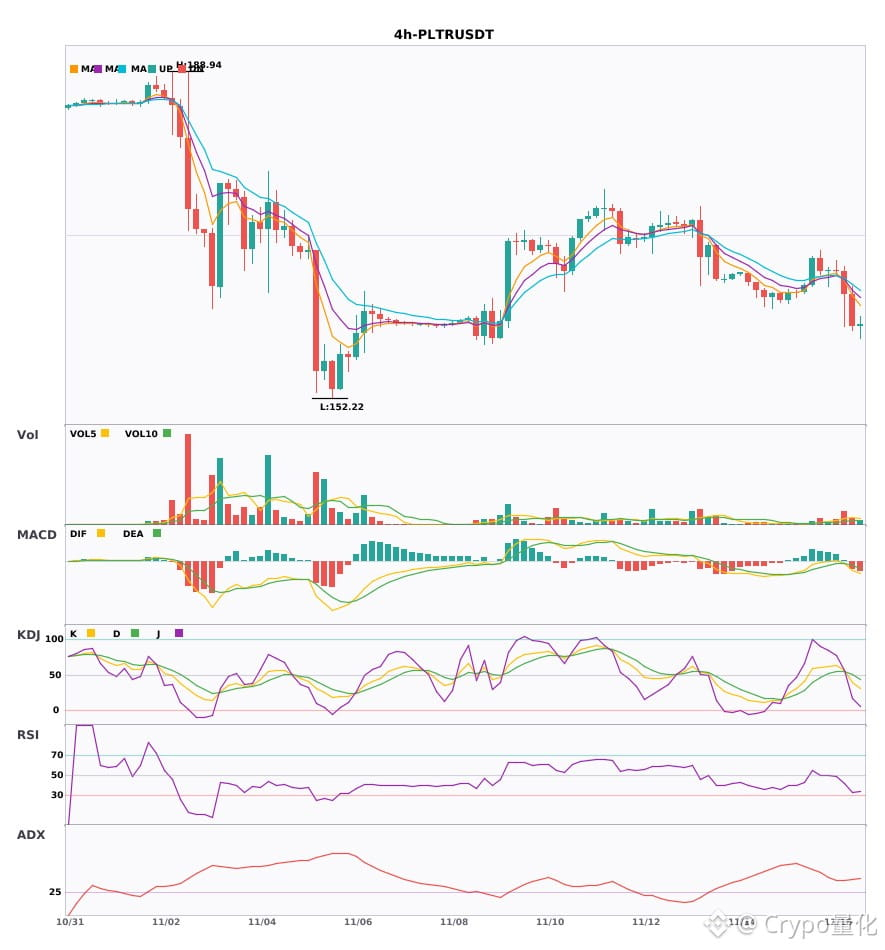
⚠️Technical analysis: ADX (42) shows a clear trend; MACD has a bearish cross below zero, with bears gaining strength; moving averages are in bearish alignment; KDJ has a bearish cross, with K crossing below D and not yet oversold; volume is up 3.5x, a bearish sign
════════════════════
🟢 $HOOD 4-hour bearish signal
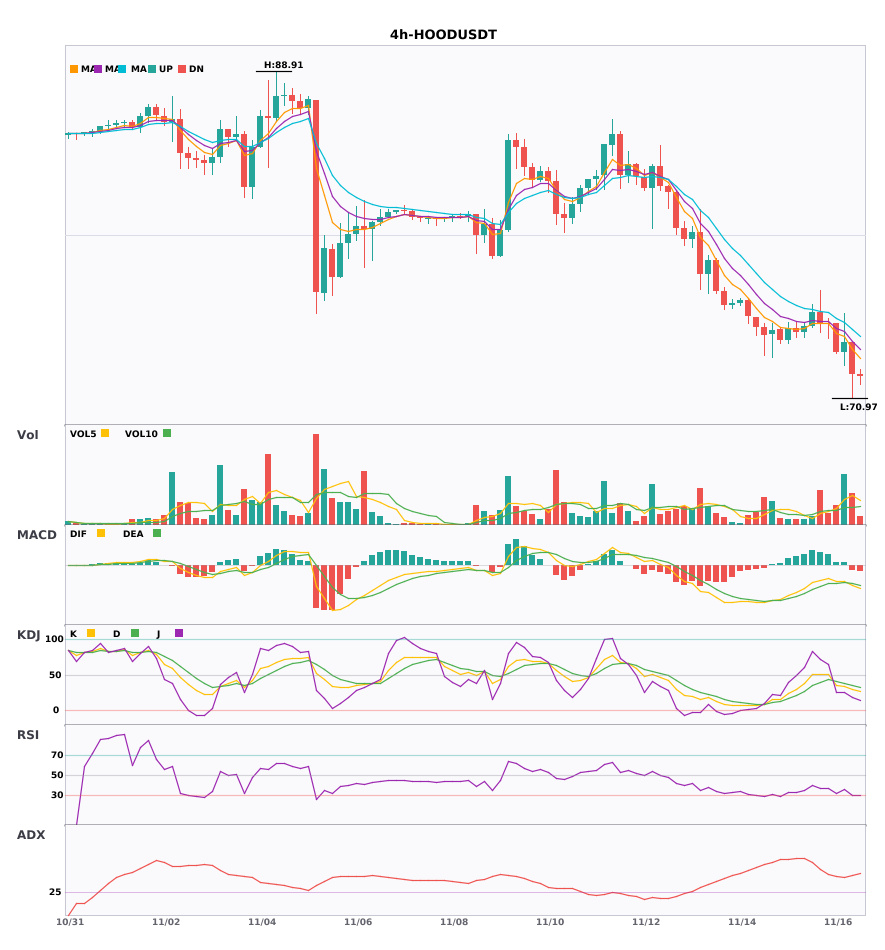
⚠️Technical analysis: ADX has surged to 43, indicating a very strong trend; MACD has a bearish cross below zero, accelerating bearish momentum; moving averages are trending downward in bearish alignment; KDJ is weak, with bears in control; volume has exploded to 2.9x, with heavy selling pressure.
════════════════════
🔔 Follow for first-hand market updates 🔔
#技术分析 #PLTR #HOOD
📌 When trading, pay attention to whether the candlestick pattern confirms the setup
$PLTR $HOOD 4 hours bearish, under short-term pressure—don't rush to get in 🔥
════════════════════
🟢 $PLTR 4-hour bearish signal
⚠️Technical analysis: ADX (42) shows a clear trend; MACD has a bearish cross below zero, with bears gaining strength; moving averages are in bearish alignment; KDJ has a bearish cross, with K crossing below D and not yet oversold; volume is up 3.5x, a bearish sign
════════════════════
🟢 $HOOD 4-hour bearish signal
⚠️Technical analysis: ADX has surged to 43, indicating a very strong trend; MACD has a bearish cross below zero, accelerating bearish momentum; moving averages are trending downward in bearish alignment; KDJ is weak, with bears in control; volume has exploded to 2.9x, with heavy selling pressure.
════════════════════
🔔 Follow for first-hand market updates 🔔
#技术分析 #PLTR #HOOD
📌 When trading, pay attention to whether the candlestick pattern confirms the setup
════════════════════
🟢 $PLTR 4-hour bearish signal
⚠️Technical analysis: ADX (42) shows a clear trend; MACD has a bearish cross below zero, with bears gaining strength; moving averages are in bearish alignment; KDJ has a bearish cross, with K crossing below D and not yet oversold; volume is up 3.5x, a bearish sign
════════════════════
🟢 $HOOD 4-hour bearish signal
⚠️Technical analysis: ADX has surged to 43, indicating a very strong trend; MACD has a bearish cross below zero, accelerating bearish momentum; moving averages are trending downward in bearish alignment; KDJ is weak, with bears in control; volume has exploded to 2.9x, with heavy selling pressure.
════════════════════
🔔 Follow for first-hand market updates 🔔
#技术分析 #PLTR #HOOD
📌 When trading, pay attention to whether the candlestick pattern confirms the setup
2
·
--
$HOOD 4-hour bearish alert is here; beware of pullback risk🔥
════════════════════
🟢 $HOOD 4-hour bearish signal
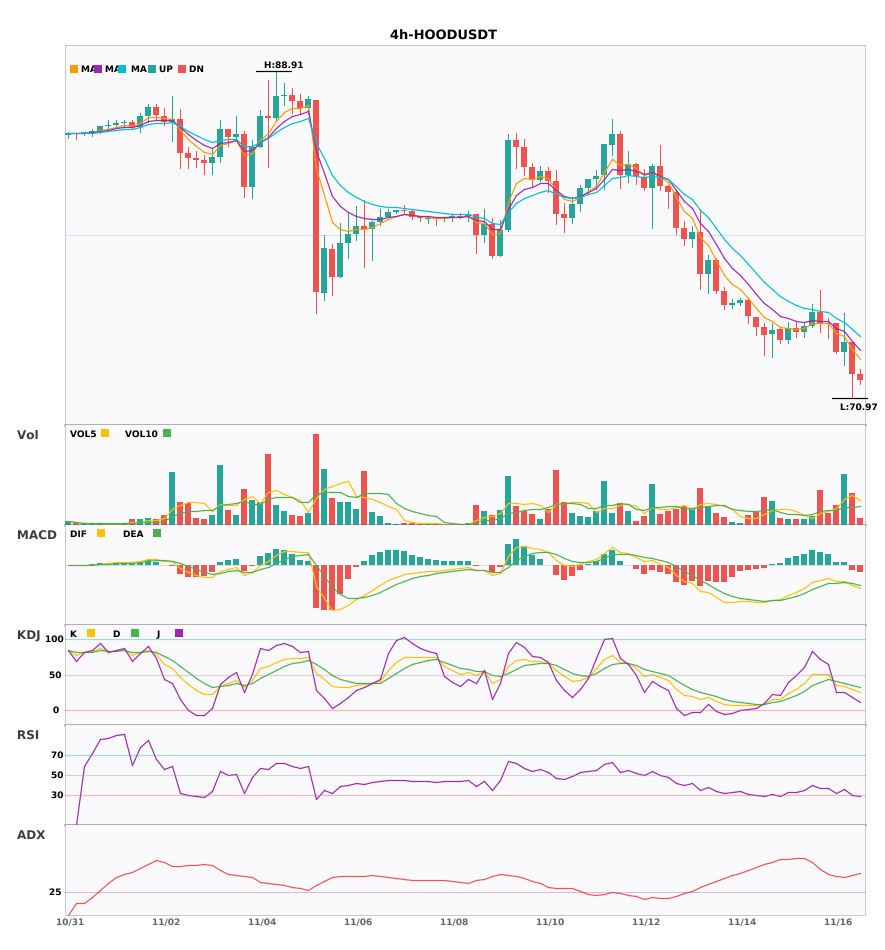
⚠️Technical analysis: ADX indicates a very strong trend. MACD has formed a death cross below the zero line with increasing volume, and the green bars are still growing. The moving averages are in a bearish alignment and diverging downward. KDJ's K line has fallen below the D line but has not yet reached the oversold zone, so bears have the upper hand. Trading volume is up 2.9 times.
════════════════════
🔔 Follow to get the latest market movements 🔔
#技术分析 #HOOD
📌 When trading, pay attention to whether the candlestick pattern confirms the setup
$HOOD 4-hour bearish alert is here; beware of pullback risk🔥
════════════════════
🟢 $HOOD 4-hour bearish signal
⚠️Technical analysis: ADX indicates a very strong trend. MACD has formed a death cross below the zero line with increasing volume, and the green bars are still growing. The moving averages are in a bearish alignment and diverging downward. KDJ's K line has fallen below the D line but has not yet reached the oversold zone, so bears have the upper hand. Trading volume is up 2.9 times.
════════════════════
🔔 Follow to get the latest market movements 🔔
#技术分析 #HOOD
📌 When trading, pay attention to whether the candlestick pattern confirms the setup
════════════════════
🟢 $HOOD 4-hour bearish signal
⚠️Technical analysis: ADX indicates a very strong trend. MACD has formed a death cross below the zero line with increasing volume, and the green bars are still growing. The moving averages are in a bearish alignment and diverging downward. KDJ's K line has fallen below the D line but has not yet reached the oversold zone, so bears have the upper hand. Trading volume is up 2.9 times.
════════════════════
🔔 Follow to get the latest market movements 🔔
#技术分析 #HOOD
📌 When trading, pay attention to whether the candlestick pattern confirms the setup
2
·
--
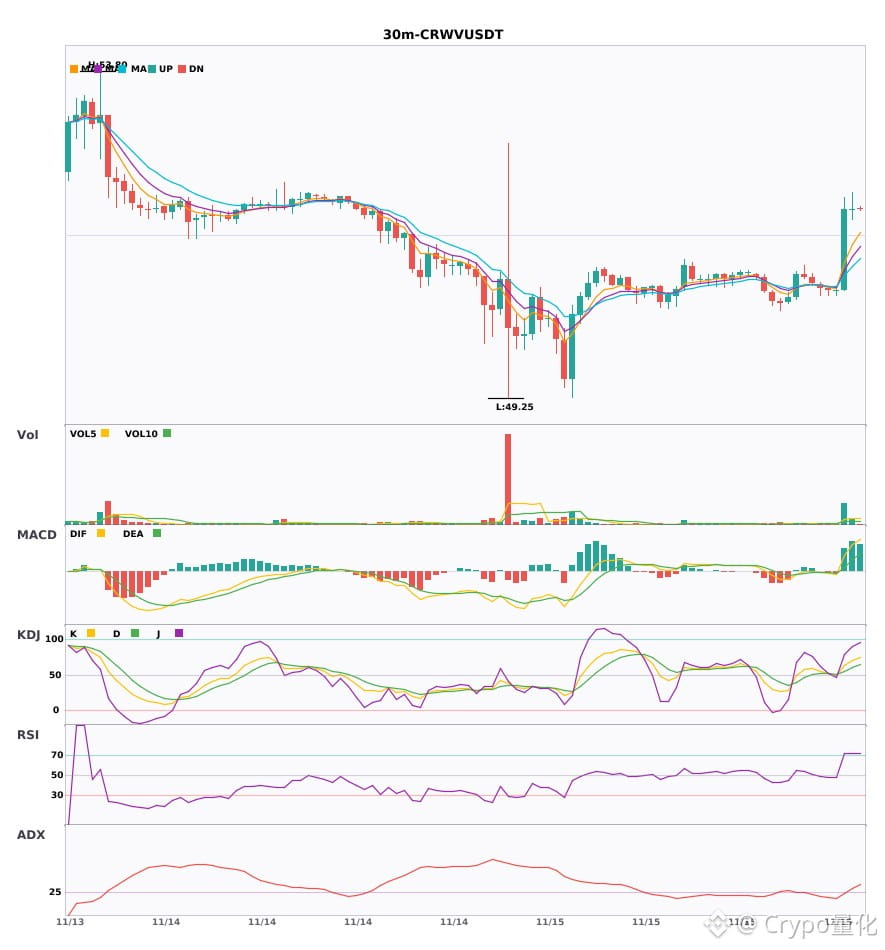
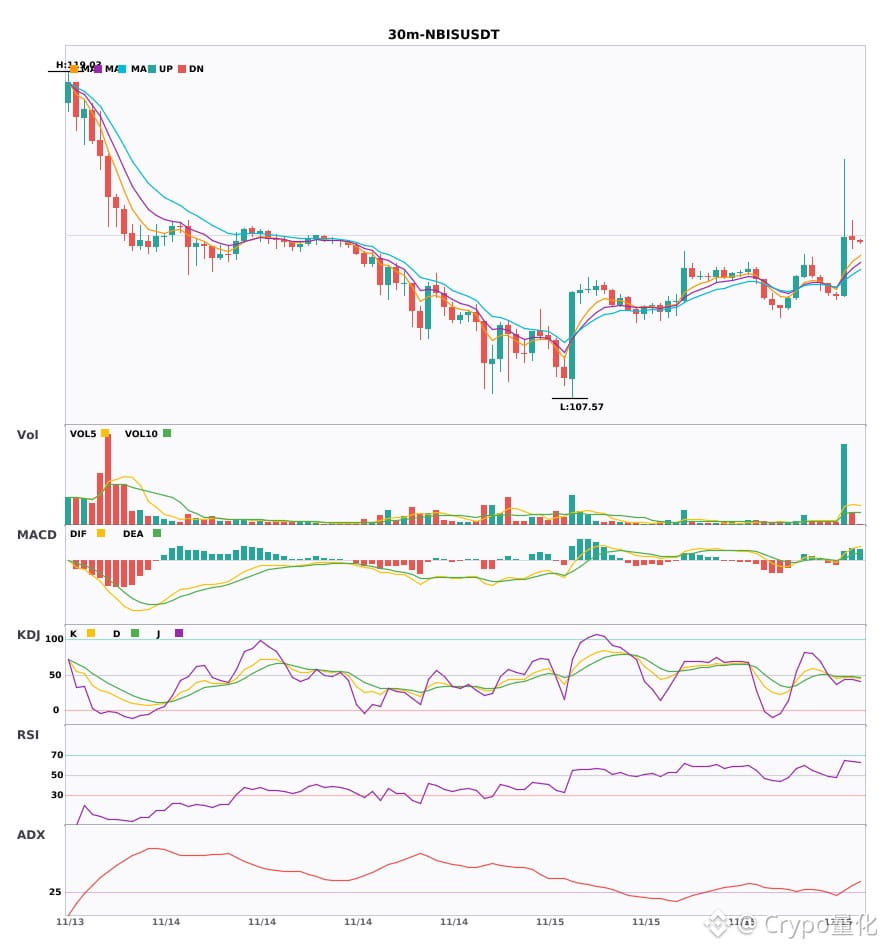
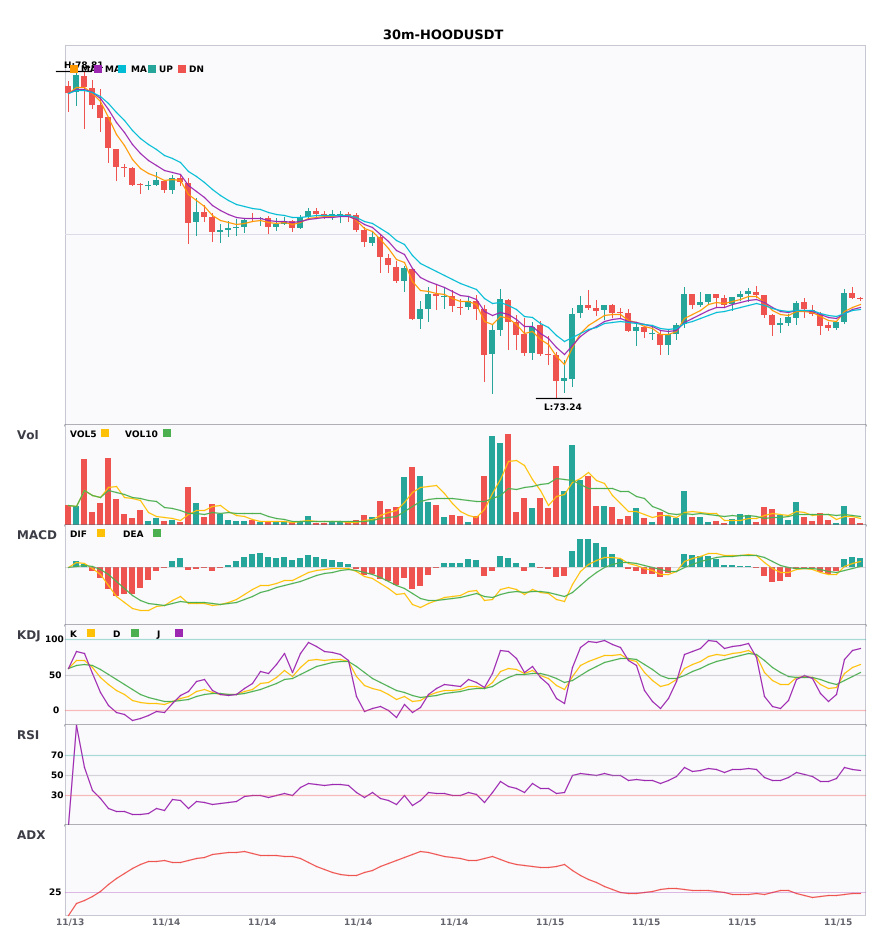
$CRWV $NBIS $HOOD 30-minute bullish convergence, short-term bullish 🔥
════════════════════
🔴 $CRWV 0-minute bullish signal
⚠️Technical analysis: The ADX trend is just starting, so it may be a good time to participate. MACD has formed a golden cross above zero, with expanding red bars. The moving averages have just formed a bullish alignment. KDJ has formed a golden cross and is not overbought. Trading volume has surged 6.7-fold.
════════════════════
🔴 $NBIS 30-minute bullish signal
⚠️Technical analysis: The ADX trend is just starting and may offer an opportunity to participate. MACD has formed a golden cross with increased volume. The moving averages have just formed a bullish alignment. In KDJ, K is slightly below D, but it is not in oversold territory. Trading volume has increased sevenfold.
════════════════════
🔴 $HOOD 30-minute bullish signal
⚠️Technical analysis: The trend is just starting and may offer an opportunity to participate. MACD has formed a golden cross with increased volume, and the red bars are expanding. The moving averages have just formed a bullish alignment. K has crossed above D and is not overbought. Trading volume has increased 1.8-fold.
════════════════════
🔔 Follow to get first-hand market movement updates 🔔
#技术分析 #CRWV #NBIS #HOOD
📌 When trading, pay attention to whether the candlestick pattern matches
$CRWV $NBIS $HOOD 30-minute bullish convergence, short-term bullish 🔥
════════════════════
🔴 $CRWV 0-minute bullish signal
⚠️Technical analysis: The ADX trend is just starting, so it may be a good time to participate. MACD has formed a golden cross above zero, with expanding red bars. The moving averages have just formed a bullish alignment. KDJ has formed a golden cross and is not overbought. Trading volume has surged 6.7-fold.
════════════════════
🔴 $NBIS 30-minute bullish signal
⚠️Technical analysis: The ADX trend is just starting and may offer an opportunity to participate. MACD has formed a golden cross with increased volume. The moving averages have just formed a bullish alignment. In KDJ, K is slightly below D, but it is not in oversold territory. Trading volume has increased sevenfold.
════════════════════
🔴 $HOOD 30-minute bullish signal
⚠️Technical analysis: The trend is just starting and may offer an opportunity to participate. MACD has formed a golden cross with increased volume, and the red bars are expanding. The moving averages have just formed a bullish alignment. K has crossed above D and is not overbought. Trading volume has increased 1.8-fold.
════════════════════
🔔 Follow to get first-hand market movement updates 🔔
#技术分析 #CRWV #NBIS #HOOD
📌 When trading, pay attention to whether the candlestick pattern matches
════════════════════
🔴 $CRWV 0-minute bullish signal
⚠️Technical analysis: The ADX trend is just starting, so it may be a good time to participate. MACD has formed a golden cross above zero, with expanding red bars. The moving averages have just formed a bullish alignment. KDJ has formed a golden cross and is not overbought. Trading volume has surged 6.7-fold.
════════════════════
🔴 $NBIS 30-minute bullish signal
⚠️Technical analysis: The ADX trend is just starting and may offer an opportunity to participate. MACD has formed a golden cross with increased volume. The moving averages have just formed a bullish alignment. In KDJ, K is slightly below D, but it is not in oversold territory. Trading volume has increased sevenfold.
════════════════════
🔴 $HOOD 30-minute bullish signal
⚠️Technical analysis: The trend is just starting and may offer an opportunity to participate. MACD has formed a golden cross with increased volume, and the red bars are expanding. The moving averages have just formed a bullish alignment. K has crossed above D and is not overbought. Trading volume has increased 1.8-fold.
════════════════════
🔔 Follow to get first-hand market movement updates 🔔
#技术分析 #CRWV #NBIS #HOOD
📌 When trading, pay attention to whether the candlestick pattern matches
5
·
--
$HOOD Newcomer’s Handbook: Understanding TradFi from Scratch 🔥
════════════════════
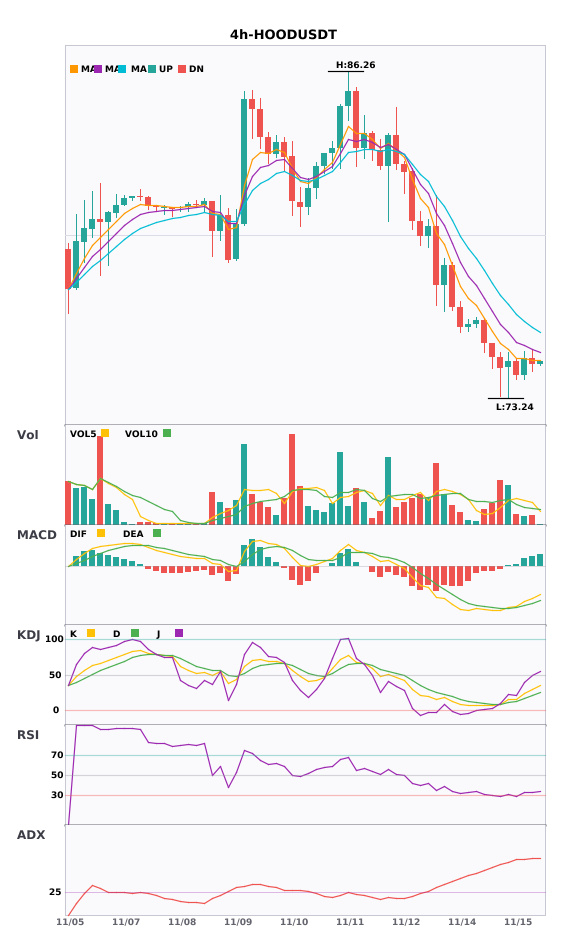
🔴 $HOOD Newcomer’s Handbook: Understanding TradFi from Scratch — Short-Term Bullish
⚠️ Technical analysis: HOOD is currently at 74.75. The daily chart is still in a bearish alignment, and an ADX of 39.2 indicates the downtrend still has momentum. However, support at 73.24 has held for now. The 4h volume ratio is only 0.03, showing a clear drop in volume—the bears seem to be running out of steam. The 1h chart has just formed a bullish alignment, and on the KDJ, K has crossed above D without entering overbought territory. A short-term rebound signal is taking shape. The first resistance above is at 96.90, which is still a long way off.
📢 Market update: HOOD is one of the best entry points for newcomers to TradFi, bringing stocks, options, and crypto together in one place. Retail account openings remain popular, and the growing adoption of TradFi is a long-term tailwind for user growth.
════════════════════
🔔 Follow for first-hand market updates 🔔
#技术分析 #Newcomer’s Handbook: Understanding TradFi from Scratch #HOOD
📌 When trading, pay attention to whether the candlestick pattern matches
$HOOD Newcomer’s Handbook: Understanding TradFi from Scratch 🔥
════════════════════
🔴 $HOOD Newcomer’s Handbook: Understanding TradFi from Scratch — Short-Term Bullish
⚠️ Technical analysis: HOOD is currently at 74.75. The daily chart is still in a bearish alignment, and an ADX of 39.2 indicates the downtrend still has momentum. However, support at 73.24 has held for now. The 4h volume ratio is only 0.03, showing a clear drop in volume—the bears seem to be running out of steam. The 1h chart has just formed a bullish alignment, and on the KDJ, K has crossed above D without entering overbought territory. A short-term rebound signal is taking shape. The first resistance above is at 96.90, which is still a long way off.
📢 Market update: HOOD is one of the best entry points for newcomers to TradFi, bringing stocks, options, and crypto together in one place. Retail account openings remain popular, and the growing adoption of TradFi is a long-term tailwind for user growth.
════════════════════
🔔 Follow for first-hand market updates 🔔
#技术分析 #Newcomer’s Handbook: Understanding TradFi from Scratch #HOOD
📌 When trading, pay attention to whether the candlestick pattern matches
════════════════════
🔴 $HOOD Newcomer’s Handbook: Understanding TradFi from Scratch — Short-Term Bullish
⚠️ Technical analysis: HOOD is currently at 74.75. The daily chart is still in a bearish alignment, and an ADX of 39.2 indicates the downtrend still has momentum. However, support at 73.24 has held for now. The 4h volume ratio is only 0.03, showing a clear drop in volume—the bears seem to be running out of steam. The 1h chart has just formed a bullish alignment, and on the KDJ, K has crossed above D without entering overbought territory. A short-term rebound signal is taking shape. The first resistance above is at 96.90, which is still a long way off.
📢 Market update: HOOD is one of the best entry points for newcomers to TradFi, bringing stocks, options, and crypto together in one place. Retail account openings remain popular, and the growing adoption of TradFi is a long-term tailwind for user growth.
════════════════════
🔔 Follow for first-hand market updates 🔔
#技术分析 #Newcomer’s Handbook: Understanding TradFi from Scratch #HOOD
📌 When trading, pay attention to whether the candlestick pattern matches
7
·
--
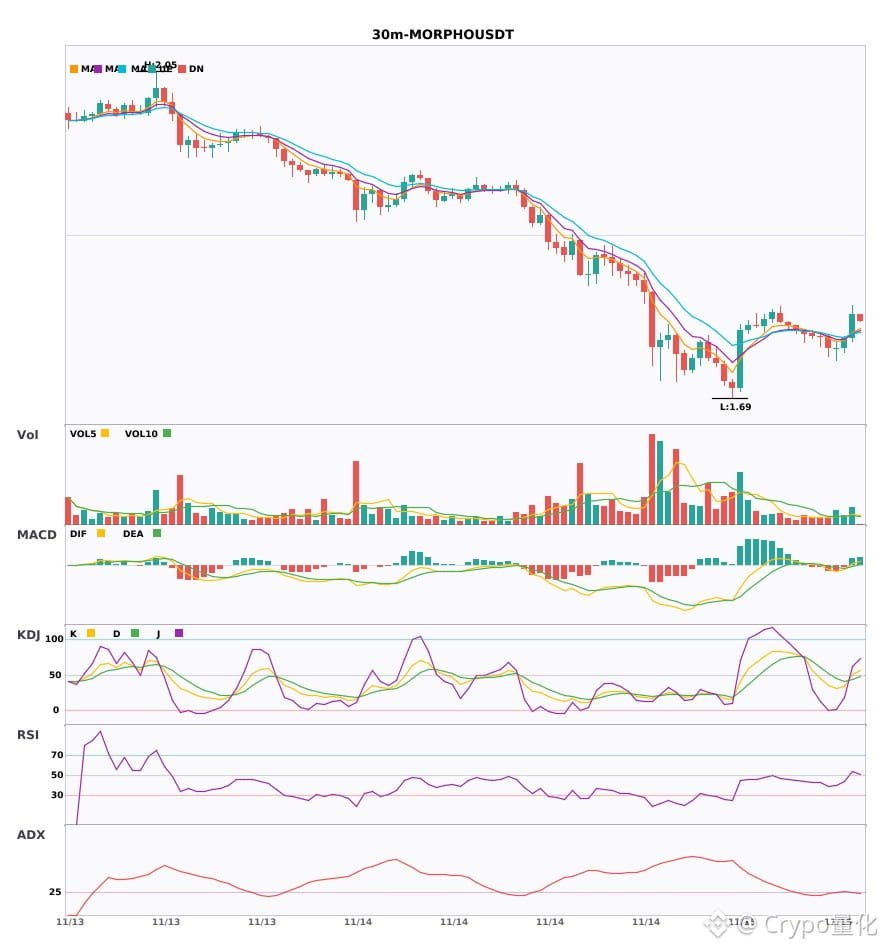
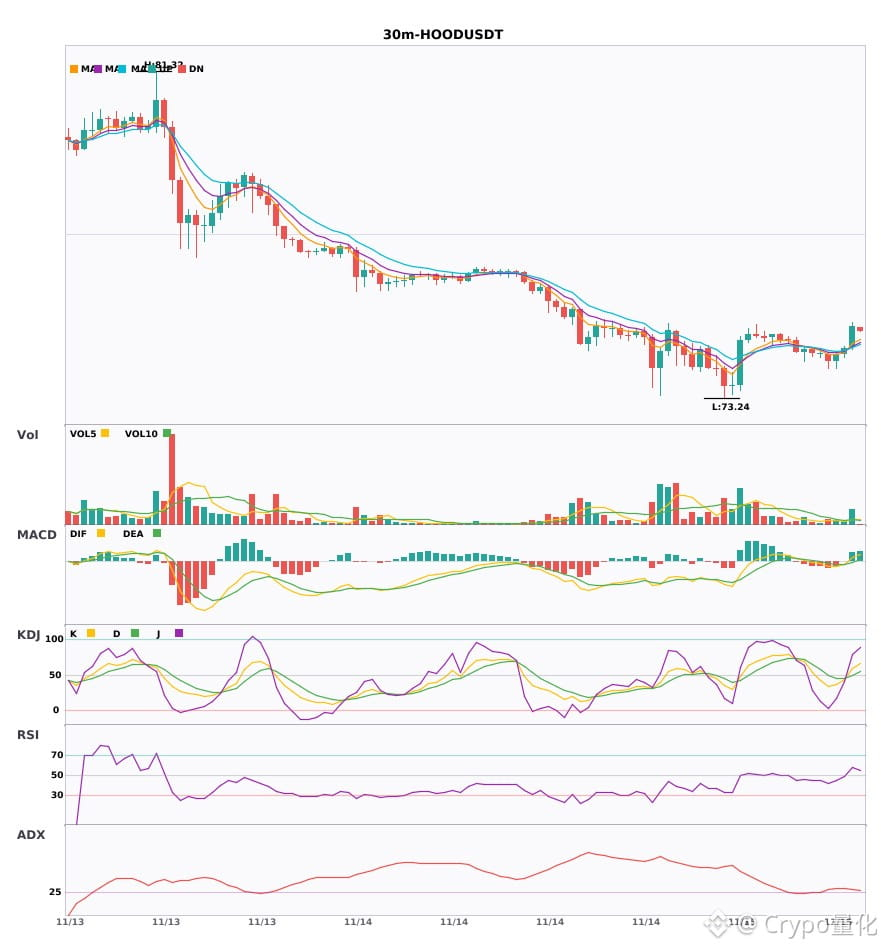
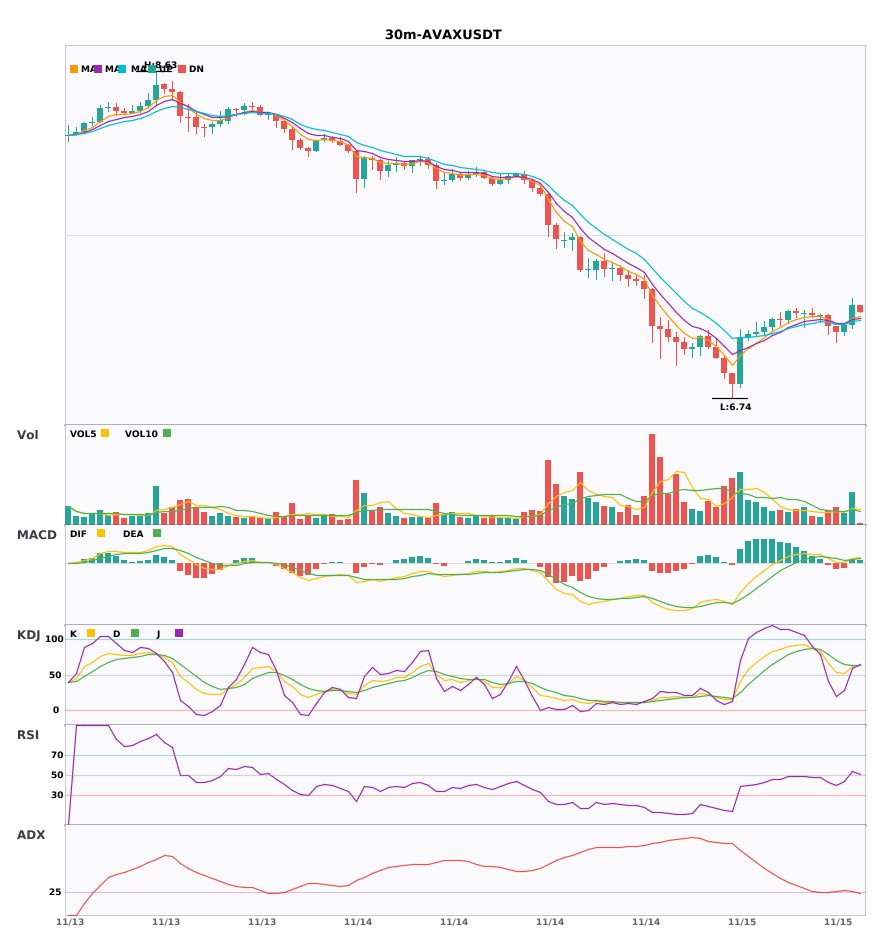
$MORPHO / $HOOD / $AVAX 30-minute MACD golden crosses with rising volume—who's about to take off? 🔥
════════════════════
🔴 $MORPHO 30-minute bullish signal
⚠️ Technicals: ADX 27, trend just starting—potential entry; MACD golden cross with rising volume; EMA5 crosses above EMA8; K crosses above D, not overbought—bullish; volume up 1.9x
════════════════════
🔴 $HOOD 30-minute bullish signal
⚠️ Technicals: ADX shows the trend is just starting and can be followed; volume picked up after the MACD golden cross, with red histogram bars continuing to expand; moving averages have just formed a bullish alignment; K crossed above D and is not yet overbought (K 59.3, D 49.6); volume is up nearly 3x—bullish in the short term.
════════════════════
🔴 $AVAX 30-minute bullish signal
⚠️ Technicals: ADX trend is just forming—potential entry | MACD golden cross with rising volume and expanding red histogram bars | EMA5 crosses above EMA8, turning bullish | KDJ is strong; K crosses above D and is not overbought | Volume up 2.2x
════════════════════
🔔 Follow for firsthand market updates 🔔
#技术分析 #MORPHO #HOOD #AVAX
📌 When trading, watch for confirmation from the candlestick pattern
$MORPHO / $HOOD / $AVAX 30-minute MACD golden crosses with rising volume—who's about to take off? 🔥
════════════════════
🔴 $MORPHO 30-minute bullish signal
⚠️ Technicals: ADX 27, trend just starting—potential entry; MACD golden cross with rising volume; EMA5 crosses above EMA8; K crosses above D, not overbought—bullish; volume up 1.9x
════════════════════
🔴 $HOOD 30-minute bullish signal
⚠️ Technicals: ADX shows the trend is just starting and can be followed; volume picked up after the MACD golden cross, with red histogram bars continuing to expand; moving averages have just formed a bullish alignment; K crossed above D and is not yet overbought (K 59.3, D 49.6); volume is up nearly 3x—bullish in the short term.
════════════════════
🔴 $AVAX 30-minute bullish signal
⚠️ Technicals: ADX trend is just forming—potential entry | MACD golden cross with rising volume and expanding red histogram bars | EMA5 crosses above EMA8, turning bullish | KDJ is strong; K crosses above D and is not overbought | Volume up 2.2x
════════════════════
🔔 Follow for firsthand market updates 🔔
#技术分析 #MORPHO #HOOD #AVAX
📌 When trading, watch for confirmation from the candlestick pattern
════════════════════
🔴 $MORPHO 30-minute bullish signal
⚠️ Technicals: ADX 27, trend just starting—potential entry; MACD golden cross with rising volume; EMA5 crosses above EMA8; K crosses above D, not overbought—bullish; volume up 1.9x
════════════════════
🔴 $HOOD 30-minute bullish signal
⚠️ Technicals: ADX shows the trend is just starting and can be followed; volume picked up after the MACD golden cross, with red histogram bars continuing to expand; moving averages have just formed a bullish alignment; K crossed above D and is not yet overbought (K 59.3, D 49.6); volume is up nearly 3x—bullish in the short term.
════════════════════
🔴 $AVAX 30-minute bullish signal
⚠️ Technicals: ADX trend is just forming—potential entry | MACD golden cross with rising volume and expanding red histogram bars | EMA5 crosses above EMA8, turning bullish | KDJ is strong; K crosses above D and is not overbought | Volume up 2.2x
════════════════════
🔔 Follow for firsthand market updates 🔔
#技术分析 #MORPHO #HOOD #AVAX
📌 When trading, watch for confirmation from the candlestick pattern
5

·
--
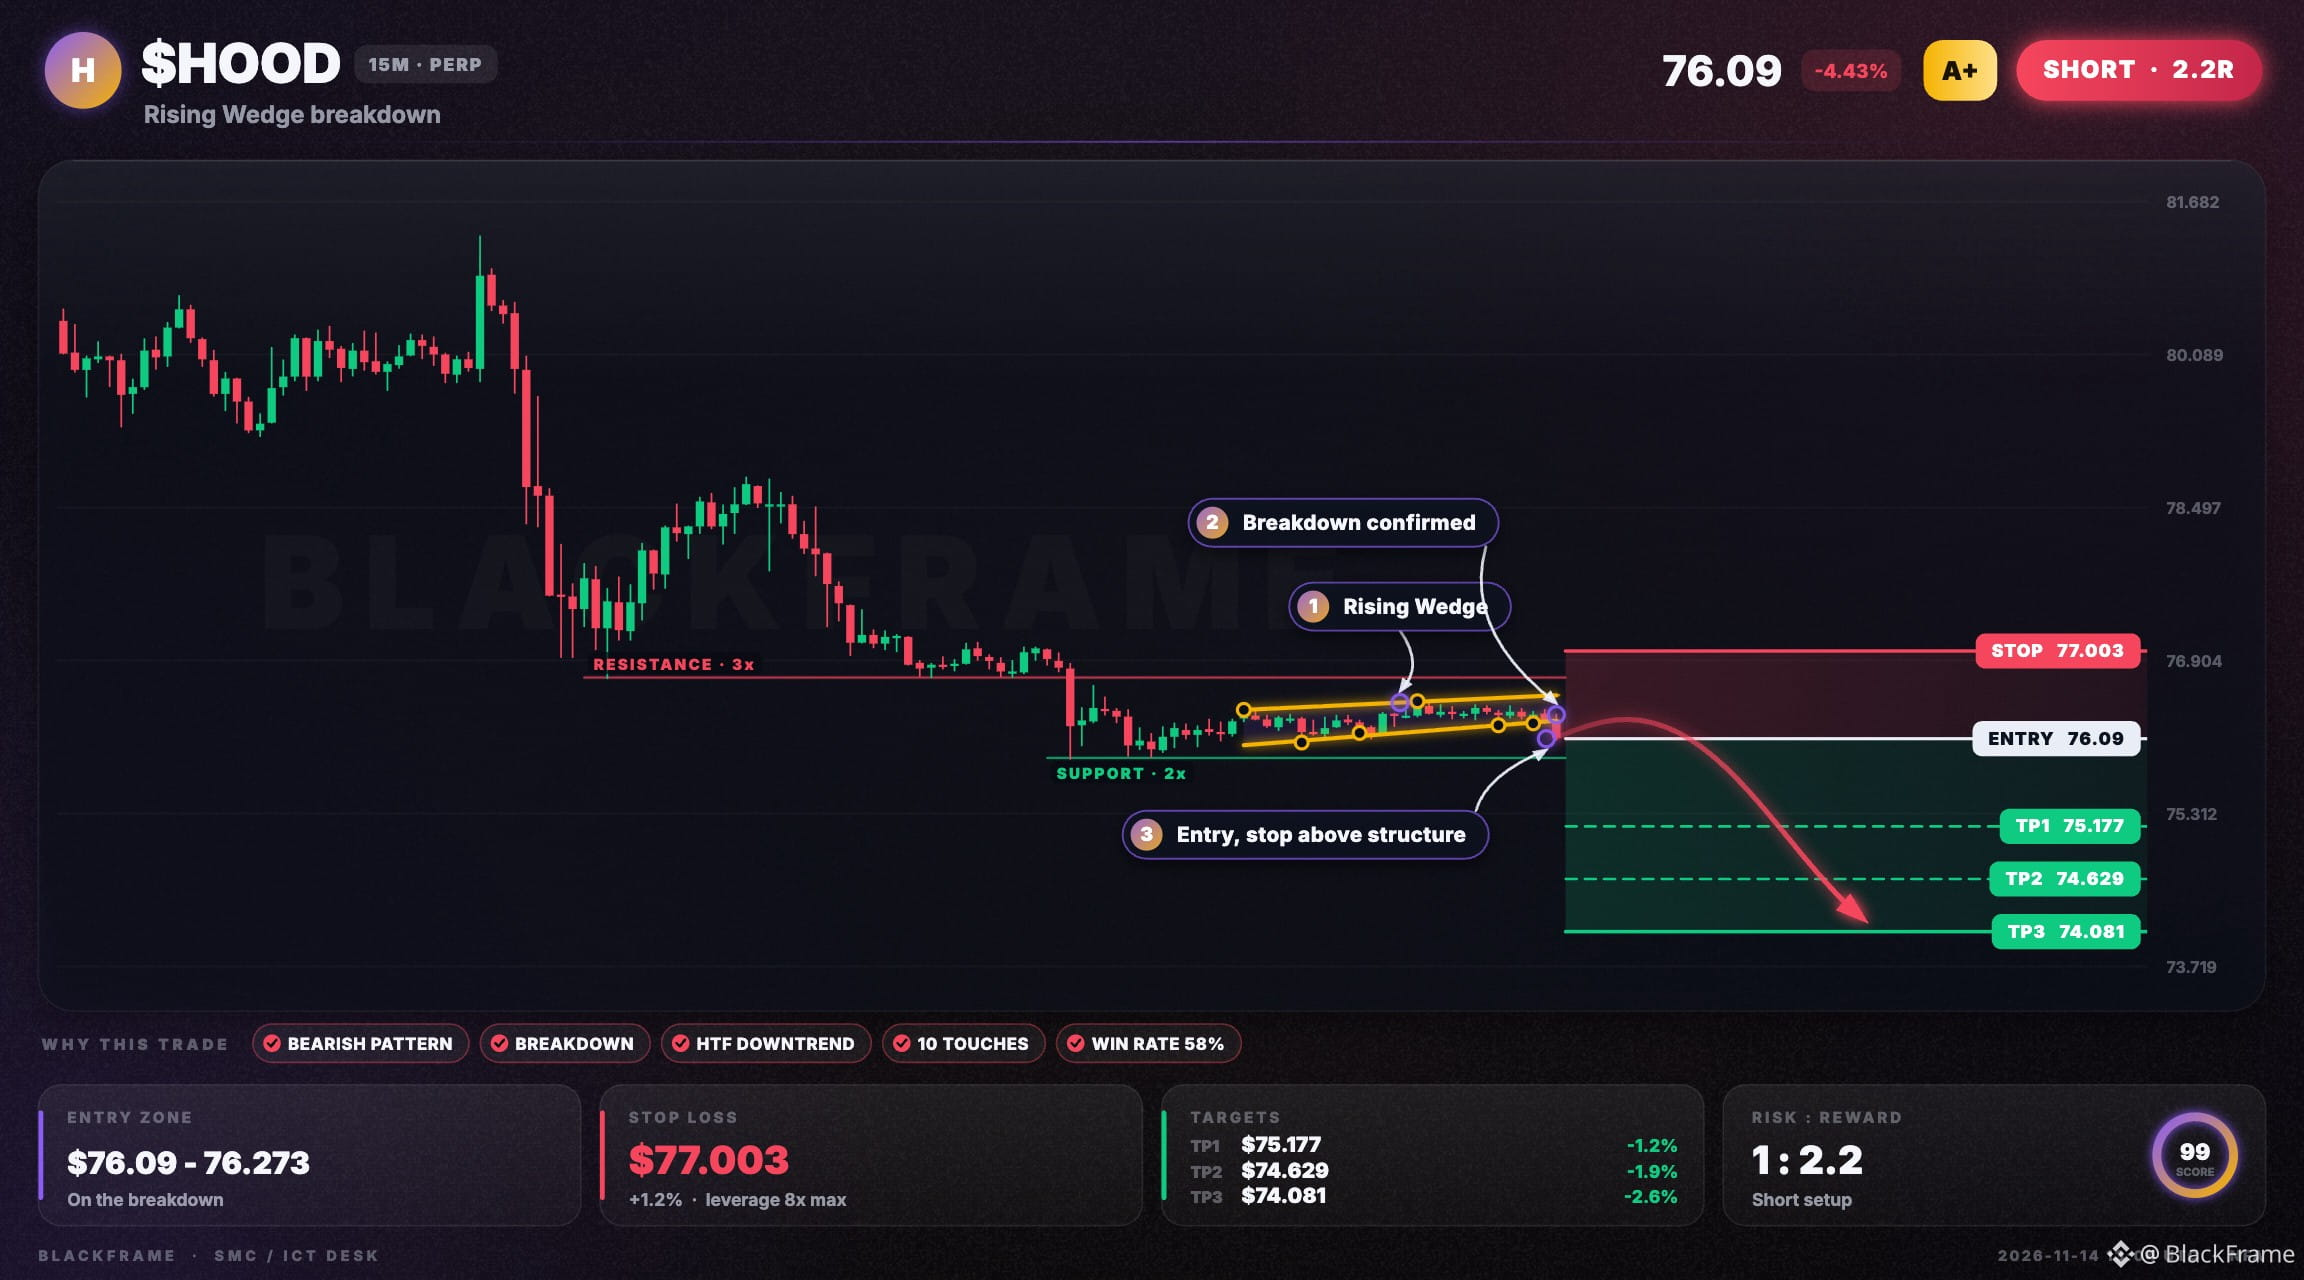
🧊 $HOOD support just gave way
SHORT · 15M
Entry: $76.09 - $76.318
TP1: $75.177
TP2: $74.629
TP3: $74.081
SL: $77.003
A rising wedge has formed on the 15M, tested 10 times on its lines. Price broke down below the pattern and is holding. The higher timeframe trend agrees, and the target is the measured move of the pattern.
#HOOD #Crypto #CryptoTrading · NFA
🧊 $HOOD support just gave way
SHORT · 15M
Entry: $76.09 - $76.318
TP1: $75.177
TP2: $74.629
TP3: $74.081
SL: $77.003
A rising wedge has formed on the 15M, tested 10 times on its lines. Price broke down below the pattern and is holding. The higher timeframe trend agrees, and the target is the measured move of the pattern.
#HOOD #Crypto #CryptoTrading · NFA
SHORT · 15M
Entry: $76.09 - $76.318
TP1: $75.177
TP2: $74.629
TP3: $74.081
SL: $77.003
A rising wedge has formed on the 15M, tested 10 times on its lines. Price broke down below the pattern and is holding. The higher timeframe trend agrees, and the target is the measured move of the pattern.
#HOOD #Crypto #CryptoTrading · NFA
41
·
--
That kick probably woke a lot of people up. Robinhood $HOOD futures are quoted at 76.03, down 5.55% on the day and just a step above today's low of 75.88.
Holding a brokerage stock like this that's tied to crypto is such a dilemma: when crypto falls, it follows; when crypto rises, it may not keep up. With the low right at its feet, buying in now risks catching it halfway down; sitting tight risks watching it slide further.
I'm leaning toward waiting for now, since 75.88 hasn't broken yet. If it falls below 75.88, I'll take that as a sign this drop isn't over; if it holds, I'll consider it a normal pullback.
If 75.88 doesn't hold, how much further room do you think it has to fall?
$HOOD
#美股 #HOOD
That kick probably woke a lot of people up. Robinhood $HOOD futures are quoted at 76.03, down 5.55% on the day and just a step above today's low of 75.88.
Holding a brokerage stock like this that's tied to crypto is such a dilemma: when crypto falls, it follows; when crypto rises, it may not keep up. With the low right at its feet, buying in now risks catching it halfway down; sitting tight risks watching it slide further.
I'm leaning toward waiting for now, since 75.88 hasn't broken yet. If it falls below 75.88, I'll take that as a sign this drop isn't over; if it holds, I'll consider it a normal pullback.
If 75.88 doesn't hold, how much further room do you think it has to fall?
$HOOD
#美股 #HOOD
Holding a brokerage stock like this that's tied to crypto is such a dilemma: when crypto falls, it follows; when crypto rises, it may not keep up. With the low right at its feet, buying in now risks catching it halfway down; sitting tight risks watching it slide further.
I'm leaning toward waiting for now, since 75.88 hasn't broken yet. If it falls below 75.88, I'll take that as a sign this drop isn't over; if it holds, I'll consider it a normal pullback.
If 75.88 doesn't hold, how much further room do you think it has to fall?
$HOOD
#美股 #HOOD
5
·
--
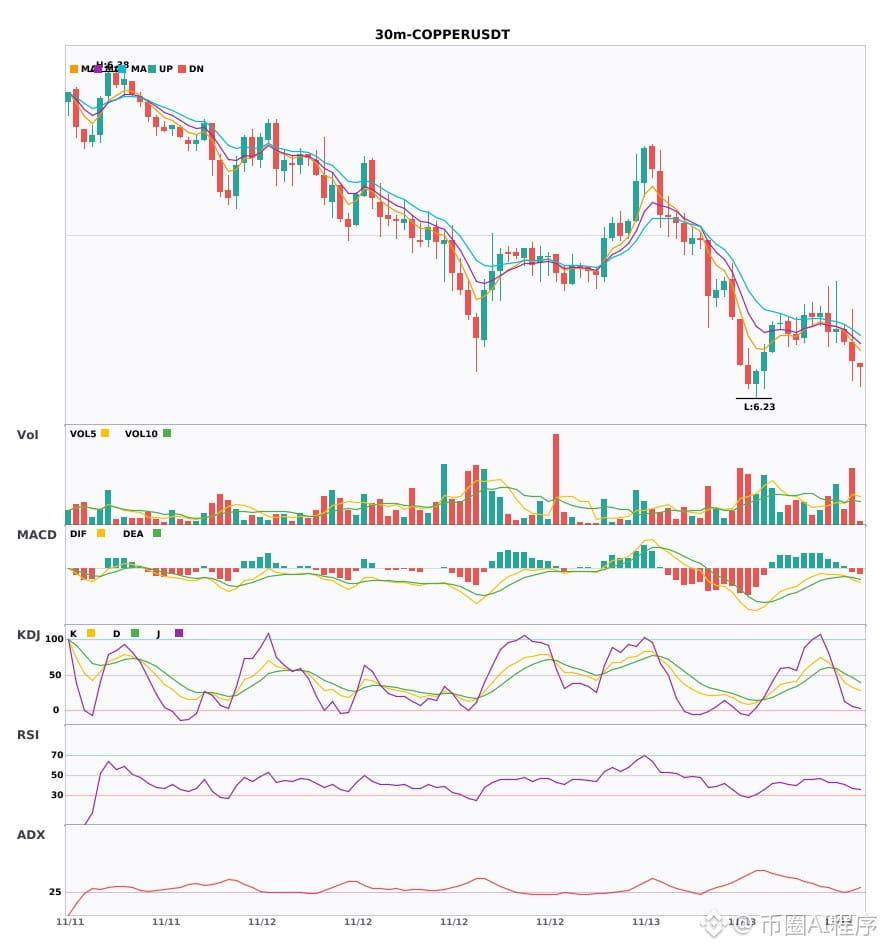
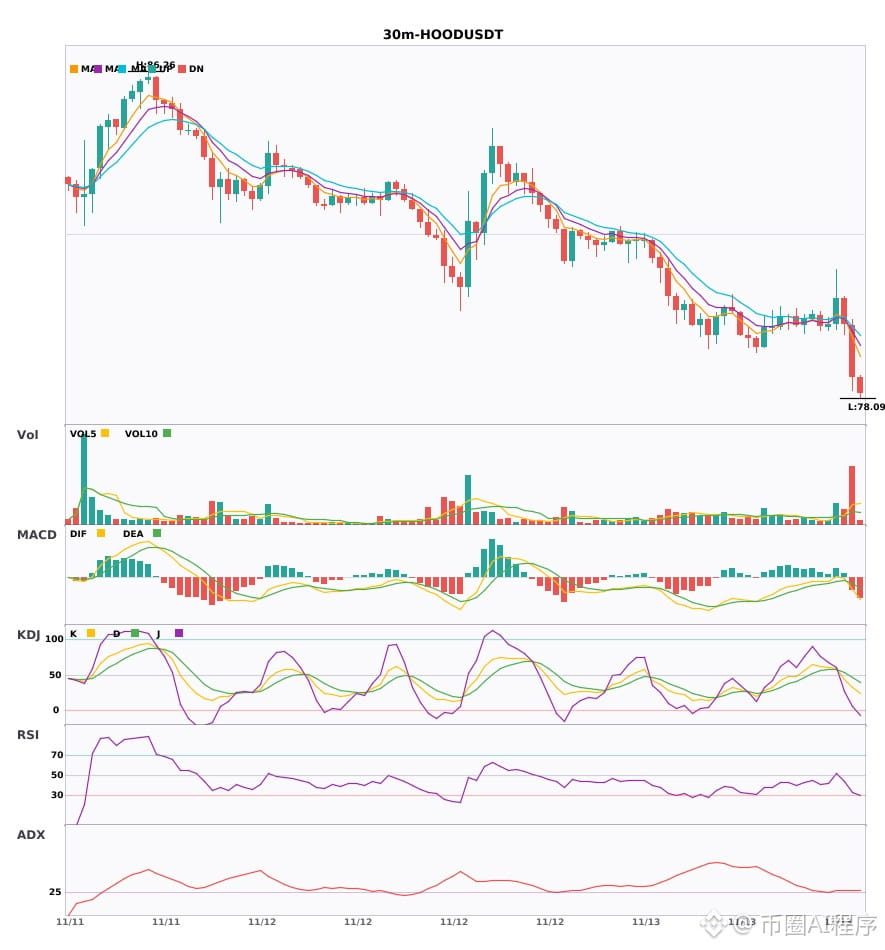
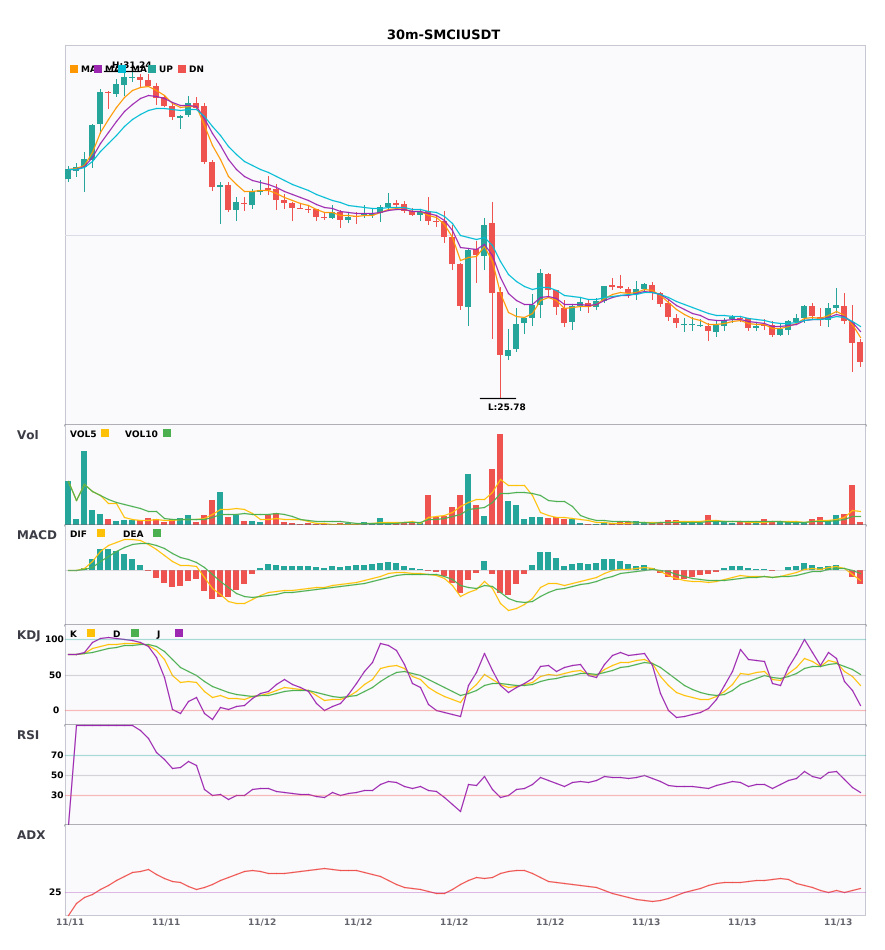
3 coins bearish on both the 30-minute and 4-hour charts; bearish confluence confirmed 🔥
════════════════════
🟢 $COPPER 30-minute bearish signal
⚠️Technical analysis: On the 30-minute chart, the MACD forms a death cross with rising volume, driving a sharp move downward. The moving averages are bearishly aligned and diverging downward. KDJ is weak (K32.6 D46.0). Volume is up 2.3x, confirming bearish confluence with the 4-hour chart. Go short.
════════════════════
🟢 $HOOD 30-minute bearish signal
⚠️Technical analysis: The 4-hour bearish trend is confirmed by confluence with the 30-minute chart! After a MACD death cross on the 30-minute chart, the green histogram bars are expanding, accelerating the bearish move. EMA5 has crossed below EMA8, forming a bearish alignment. K has crossed below D on KDJ but has not entered oversold territory, with weakness prevailing (K33 D46.5). Volume is up 4.3x, making the bearish confluence signal clear.
════════════════════
🟢 $SMCI 30-minute bearish signal
⚠️Technical analysis: The 4-hour bearish trend is confirmed by confluence with the 30-minute bearish trend! On the 30-minute chart, MACD forms a death cross after a golden cross, and the green histogram bars are expanding, accelerating the bearish move. The moving averages have just formed a bearish alignment and are turning downward. Volume has surged 4.5x.
════════════════════
🔔 Follow for first-hand market updates 🔔
#多周期共振 #COPPER #HOOD #SMCI
📌 When trading, pay attention to whether the candlestick pattern aligns
3 coins bearish on both the 30-minute and 4-hour charts; bearish confluence confirmed 🔥
════════════════════
🟢 $COPPER 30-minute bearish signal
⚠️Technical analysis: On the 30-minute chart, the MACD forms a death cross with rising volume, driving a sharp move downward. The moving averages are bearishly aligned and diverging downward. KDJ is weak (K32.6 D46.0). Volume is up 2.3x, confirming bearish confluence with the 4-hour chart. Go short.
════════════════════
🟢 $HOOD 30-minute bearish signal
⚠️Technical analysis: The 4-hour bearish trend is confirmed by confluence with the 30-minute chart! After a MACD death cross on the 30-minute chart, the green histogram bars are expanding, accelerating the bearish move. EMA5 has crossed below EMA8, forming a bearish alignment. K has crossed below D on KDJ but has not entered oversold territory, with weakness prevailing (K33 D46.5). Volume is up 4.3x, making the bearish confluence signal clear.
════════════════════
🟢 $SMCI 30-minute bearish signal
⚠️Technical analysis: The 4-hour bearish trend is confirmed by confluence with the 30-minute bearish trend! On the 30-minute chart, MACD forms a death cross after a golden cross, and the green histogram bars are expanding, accelerating the bearish move. The moving averages have just formed a bearish alignment and are turning downward. Volume has surged 4.5x.
════════════════════
🔔 Follow for first-hand market updates 🔔
#多周期共振 #COPPER #HOOD #SMCI
📌 When trading, pay attention to whether the candlestick pattern aligns
════════════════════
🟢 $COPPER 30-minute bearish signal
⚠️Technical analysis: On the 30-minute chart, the MACD forms a death cross with rising volume, driving a sharp move downward. The moving averages are bearishly aligned and diverging downward. KDJ is weak (K32.6 D46.0). Volume is up 2.3x, confirming bearish confluence with the 4-hour chart. Go short.
════════════════════
🟢 $HOOD 30-minute bearish signal
⚠️Technical analysis: The 4-hour bearish trend is confirmed by confluence with the 30-minute chart! After a MACD death cross on the 30-minute chart, the green histogram bars are expanding, accelerating the bearish move. EMA5 has crossed below EMA8, forming a bearish alignment. K has crossed below D on KDJ but has not entered oversold territory, with weakness prevailing (K33 D46.5). Volume is up 4.3x, making the bearish confluence signal clear.
════════════════════
🟢 $SMCI 30-minute bearish signal
⚠️Technical analysis: The 4-hour bearish trend is confirmed by confluence with the 30-minute bearish trend! On the 30-minute chart, MACD forms a death cross after a golden cross, and the green histogram bars are expanding, accelerating the bearish move. The moving averages have just formed a bearish alignment and are turning downward. Volume has surged 4.5x.
════════════════════
🔔 Follow for first-hand market updates 🔔
#多周期共振 #COPPER #HOOD #SMCI
📌 When trading, pay attention to whether the candlestick pattern aligns
4
·
--
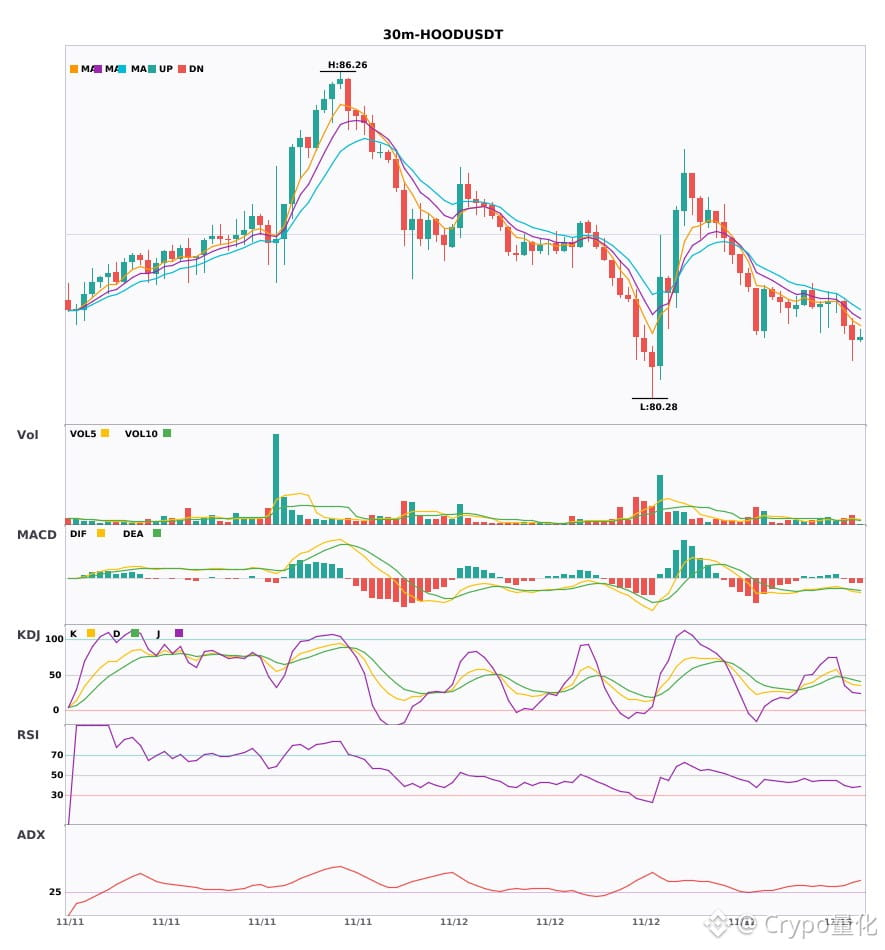
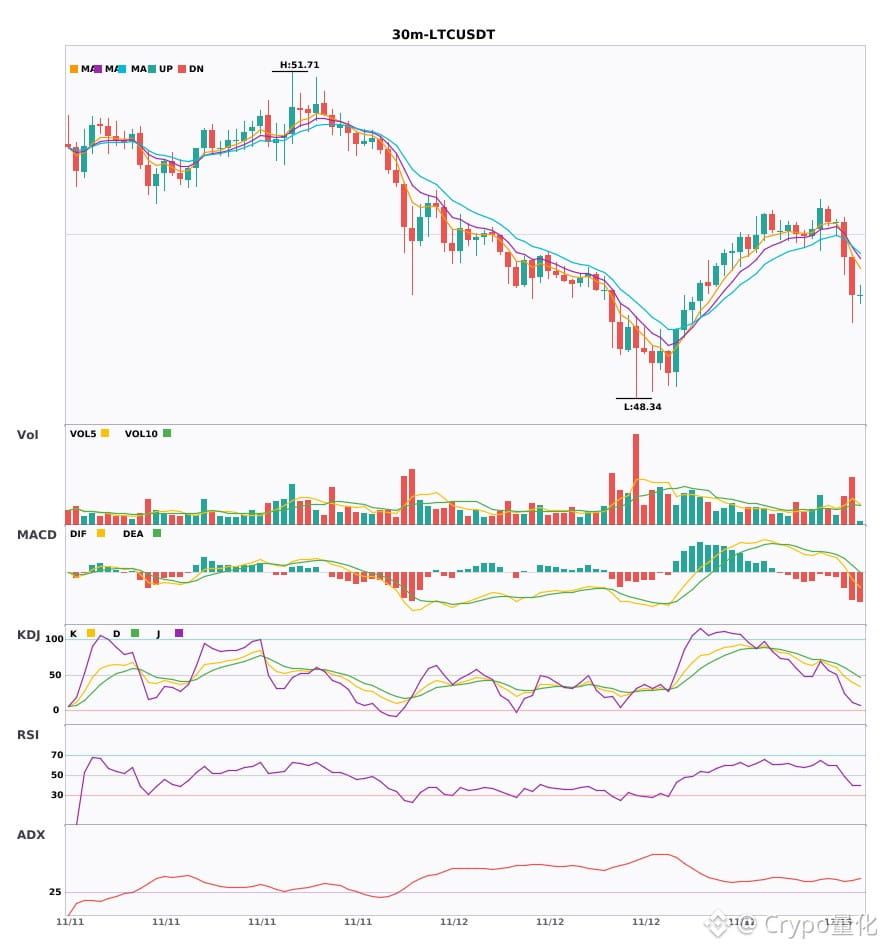
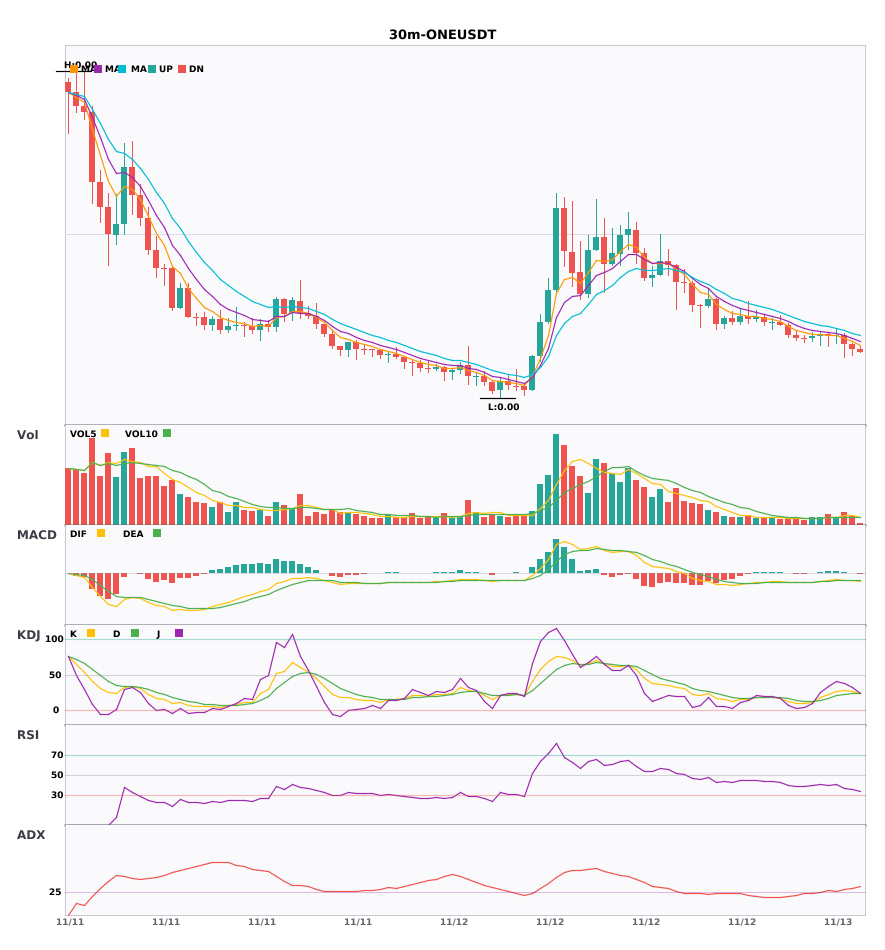
$HOOD/$LTC/$ONE 30-minute momentum is weakening in sync; beware pullback risk 🔥
════════════════════
🟢 $HOOD 30-minute bearish signal
⚠️ Technical analysis: ADX indicates a clear trend. MACD formed a bearish crossover below zero with rising volume, triggering a sharp selloff. Moving averages are bearishly aligned and diverging downward. KDJ has formed a bearish crossover but is not oversold (K42.4 D46.2). Volume is up 1.6x; the short-term outlook remains bearish.
════════════════════
🟢 $LTC 30-minute bearish signal
⚠️ Technical analysis: ADX has surged to 42, signaling a strong trend. After the MACD bearish crossover, DIF fell below the zero line, turning the outlook bearish. Moving averages have just formed a bearish alignment and are heading down. Volume is up 2.4x.
════════════════════
🟢 $ONE 30-minute bearish signal
⚠️ Technical analysis: Clear ADX trend | MACD bearish crossover below zero, bearish momentum accelerating | Bearishly aligned, diverging moving averages | Weak KDJ (K27 D24.6) | Volume up 1.7x
════════════════════
🔔 Follow for real-time market alerts 🔔
#技术分析 #HOOD #LTC #ONE
📌 When trading, pay attention to whether the candlestick pattern confirms the move
$HOOD /$LTC /$ONE 30-minute momentum is weakening in sync; beware pullback risk 🔥
════════════════════
🟢 $HOOD 30-minute bearish signal
⚠️ Technical analysis: ADX indicates a clear trend. MACD formed a bearish crossover below zero with rising volume, triggering a sharp selloff. Moving averages are bearishly aligned and diverging downward. KDJ has formed a bearish crossover but is not oversold (K42.4 D46.2). Volume is up 1.6x; the short-term outlook remains bearish.
════════════════════
🟢 $LTC 30-minute bearish signal
⚠️ Technical analysis: ADX has surged to 42, signaling a strong trend. After the MACD bearish crossover, DIF fell below the zero line, turning the outlook bearish. Moving averages have just formed a bearish alignment and are heading down. Volume is up 2.4x.
════════════════════
🟢 $ONE 30-minute bearish signal
⚠️ Technical analysis: Clear ADX trend | MACD bearish crossover below zero, bearish momentum accelerating | Bearishly aligned, diverging moving averages | Weak KDJ (K27 D24.6) | Volume up 1.7x
════════════════════
🔔 Follow for real-time market alerts 🔔
#技术分析 #HOOD #LTC #ONE
📌 When trading, pay attention to whether the candlestick pattern confirms the move
════════════════════
🟢 $HOOD 30-minute bearish signal
⚠️ Technical analysis: ADX indicates a clear trend. MACD formed a bearish crossover below zero with rising volume, triggering a sharp selloff. Moving averages are bearishly aligned and diverging downward. KDJ has formed a bearish crossover but is not oversold (K42.4 D46.2). Volume is up 1.6x; the short-term outlook remains bearish.
════════════════════
🟢 $LTC 30-minute bearish signal
⚠️ Technical analysis: ADX has surged to 42, signaling a strong trend. After the MACD bearish crossover, DIF fell below the zero line, turning the outlook bearish. Moving averages have just formed a bearish alignment and are heading down. Volume is up 2.4x.
════════════════════
🟢 $ONE 30-minute bearish signal
⚠️ Technical analysis: Clear ADX trend | MACD bearish crossover below zero, bearish momentum accelerating | Bearishly aligned, diverging moving averages | Weak KDJ (K27 D24.6) | Volume up 1.7x
════════════════════
🔔 Follow for real-time market alerts 🔔
#技术分析 #HOOD #LTC #ONE
📌 When trading, pay attention to whether the candlestick pattern confirms the move
13
·
--
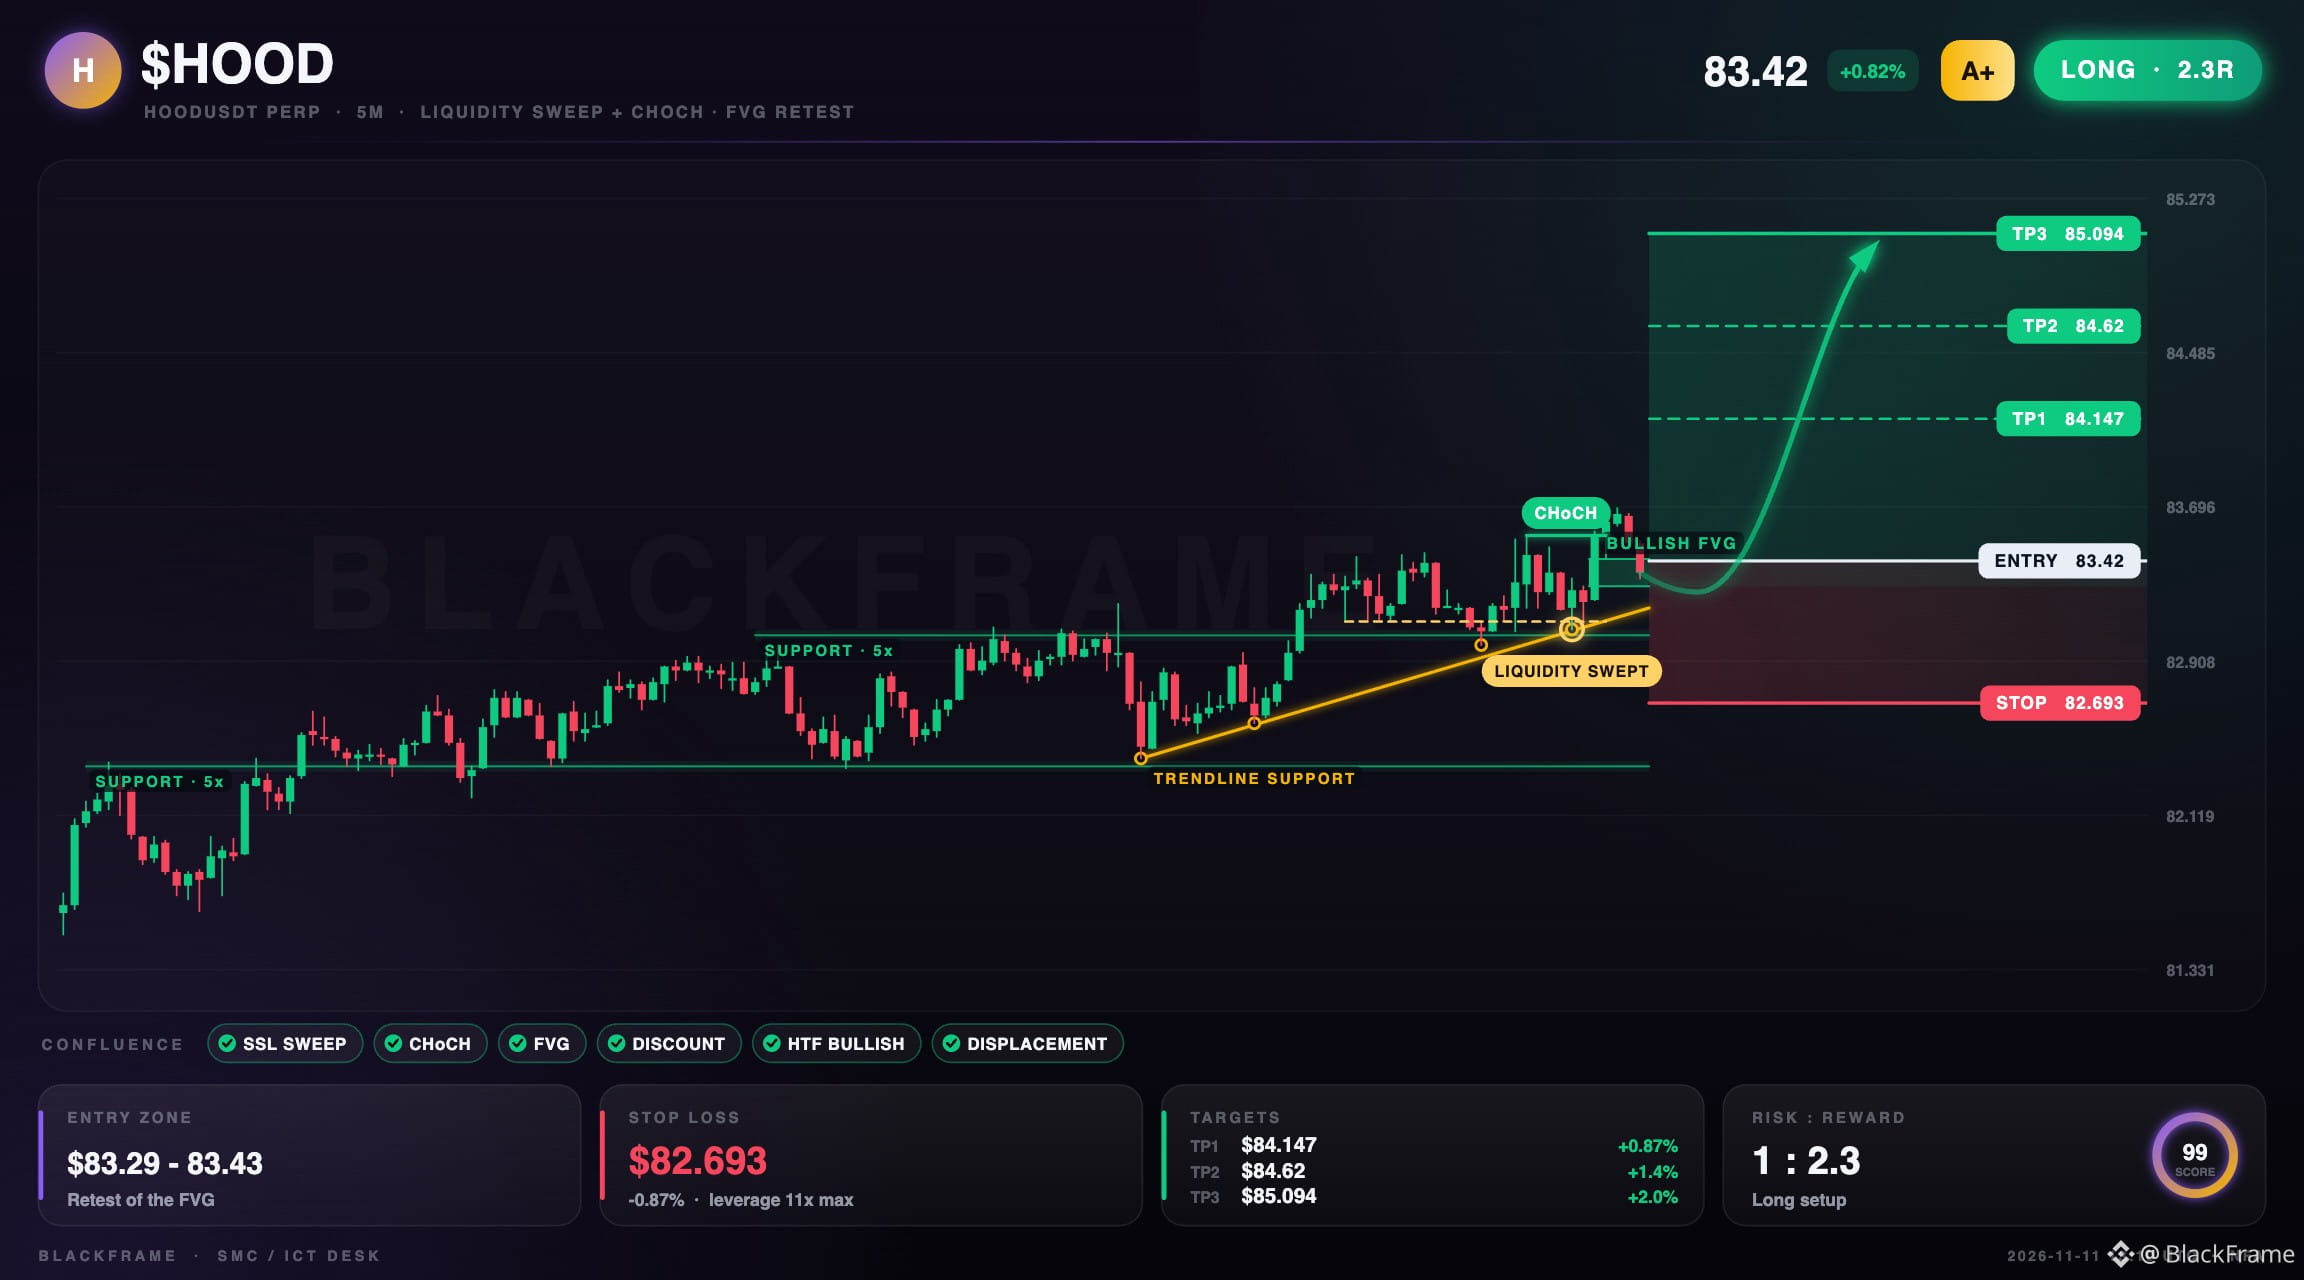
🚀 $HOOD lifts after sell‑side sweep
LONG · 5M
Entry: $83.42 - $83.43
TP1: $84.147
TP2: $84.62
TP3: $85.094
SL: $82.693
Sell‑side liquidity was swept and CHoCH confirmed on the 5M. Price tapped the bullish FVG, buying from discount with strong displacement out of the $83.29-83.43 zone. New York killzone aligns with bullish HTF bias; target is $85.094 and stop at $82.693.
#HOOD #SmartMoney · NFA
🚀 $HOOD lifts after sell‑side sweep
LONG · 5M
Entry: $83.42 - $83.43
TP1: $84.147
TP2: $84.62
TP3: $85.094
SL: $82.693
Sell‑side liquidity was swept and CHoCH confirmed on the 5M. Price tapped the bullish FVG, buying from discount with strong displacement out of the $83.29-83.43 zone. New York killzone aligns with bullish HTF bias; target is $85.094 and stop at $82.693.
#HOOD #SmartMoney · NFA
LONG · 5M
Entry: $83.42 - $83.43
TP1: $84.147
TP2: $84.62
TP3: $85.094
SL: $82.693
Sell‑side liquidity was swept and CHoCH confirmed on the 5M. Price tapped the bullish FVG, buying from discount with strong displacement out of the $83.29-83.43 zone. New York killzone aligns with bullish HTF bias; target is $85.094 and stop at $82.693.
#HOOD #SmartMoney · NFA
63

·
--
THE FUTURE OF CRYPTO MAY NOT DEPEND SOLELY ON BITCOIN. TWO NUMBERS IN $HOOD 'S LATEST EARNINGS REPORT TELL A BIGGER STORY.
Everyone in the crypto market is waiting for Bitcoin to rise. But Robinhood's latest earnings report tells a different story about where the real money could be made in the future.
Pay attention to two numbers.
1️⃣ $26 MILLION
Robinhood's new blockchain network, Robinhood Chain, generated $26 million in revenue during its first quarter after launching on mainnet. More than $80 billion in decentralized exchange transactions also took place across the network.
2️⃣ $173 MILLION
Robinhood generated $173 million in revenue from prediction markets in the third quarter. That's more than 6 times the amount reported in the same period last year. Even more interesting, this revenue surpassed the company's stock trading revenue.
Meanwhile, Robinhood's crypto transaction revenue fell 55% year over year to $120 million.
But the company continues to grow in other areas. I believe this points to an important shift.
The future of crypto isn't just about how high Bitcoin can go.
Companies building blockchain infrastructure, bringing tokenized assets to markets, and creating entirely new financial trading opportunities could also generate enormous economic value.
The next big opportunity in crypto may not be the next Bitcoin. It may be the infrastructure and financial ecosystem being built around it.
#HOOD
THE FUTURE OF CRYPTO MAY NOT DEPEND SOLELY ON BITCOIN. TWO NUMBERS IN $HOOD 'S LATEST EARNINGS REPORT TELL A BIGGER STORY.
Everyone in the crypto market is waiting for Bitcoin to rise. But Robinhood's latest earnings report tells a different story about where the real money could be made in the future.
Pay attention to two numbers.
1️⃣ $26 MILLION
Robinhood's new blockchain network, Robinhood Chain, generated $26 million in revenue during its first quarter after launching on mainnet. More than $80 billion in decentralized exchange transactions also took place across the network.
2️⃣ $173 MILLION
Robinhood generated $173 million in revenue from prediction markets in the third quarter. That's more than 6 times the amount reported in the same period last year. Even more interesting, this revenue surpassed the company's stock trading revenue.
Meanwhile, Robinhood's crypto transaction revenue fell 55% year over year to $120 million.
But the company continues to grow in other areas. I believe this points to an important shift.
The future of crypto isn't just about how high Bitcoin can go.
Companies building blockchain infrastructure, bringing tokenized assets to markets, and creating entirely new financial trading opportunities could also generate enormous economic value.
The next big opportunity in crypto may not be the next Bitcoin. It may be the infrastructure and financial ecosystem being built around it.
#HOOD
Everyone in the crypto market is waiting for Bitcoin to rise. But Robinhood's latest earnings report tells a different story about where the real money could be made in the future.
Pay attention to two numbers.
1️⃣ $26 MILLION
Robinhood's new blockchain network, Robinhood Chain, generated $26 million in revenue during its first quarter after launching on mainnet. More than $80 billion in decentralized exchange transactions also took place across the network.
2️⃣ $173 MILLION
Robinhood generated $173 million in revenue from prediction markets in the third quarter. That's more than 6 times the amount reported in the same period last year. Even more interesting, this revenue surpassed the company's stock trading revenue.
Meanwhile, Robinhood's crypto transaction revenue fell 55% year over year to $120 million.
But the company continues to grow in other areas. I believe this points to an important shift.
The future of crypto isn't just about how high Bitcoin can go.
Companies building blockchain infrastructure, bringing tokenized assets to markets, and creating entirely new financial trading opportunities could also generate enormous economic value.
The next big opportunity in crypto may not be the next Bitcoin. It may be the infrastructure and financial ecosystem being built around it.
#HOOD
1
668
Log in to explore more content
Join global crypto users on Binance Square
⚡️ Get latest and useful information about crypto.
💬 Trusted by the world’s largest crypto exchange.
👍 Discover real insights from verified creators.
Email / Phone number
Trending Topics
1
#XRPDropsToTwoYearLowNear87Cents
7,260 views
176 Discussing
2
#BitcoinFallsBelow$57KToTwoYearLow
4,316 views
32 Discussing
3
#NvidiaLoses$2.7TrillionInMonthAndAHalf
1,011 views
43 Discussing
4
#CanBTCReboundAfterFallingBelow60K?
539,018 views
2,311 Discussing
5
#GlobalStocksFaceLongestLosingStreakSince2023
185,273 views
1,603 Discussing
6
#BlackRockIBITPostsRecord$541MSingleDayOutflow
15,077 views
56 Discussing
7
#AnthropicPlungesTowardIPOPriceonDay2
91,463 views
926 Discussing
8
#TwentyOneCapitalAdds172.25BTC
38,580 views
441 Discussing
9
#HKBillWouldExcludeTokenizedDepositsFromVirtualAssets
3,549 views
43 Discussing
10
#BNBDropsBelow540USDTWith8.46%DailyDecline
53,057 views
473 Discussing