
#smci
smci
34,541 views
428 Discussing
Hot
Latest

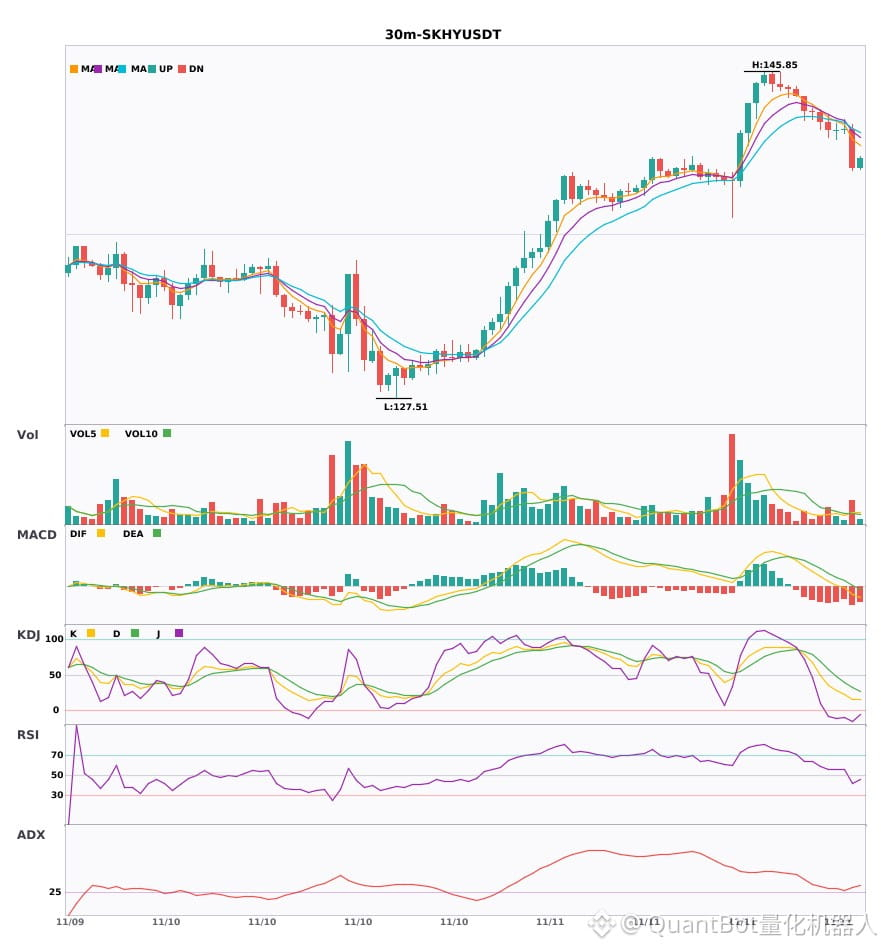
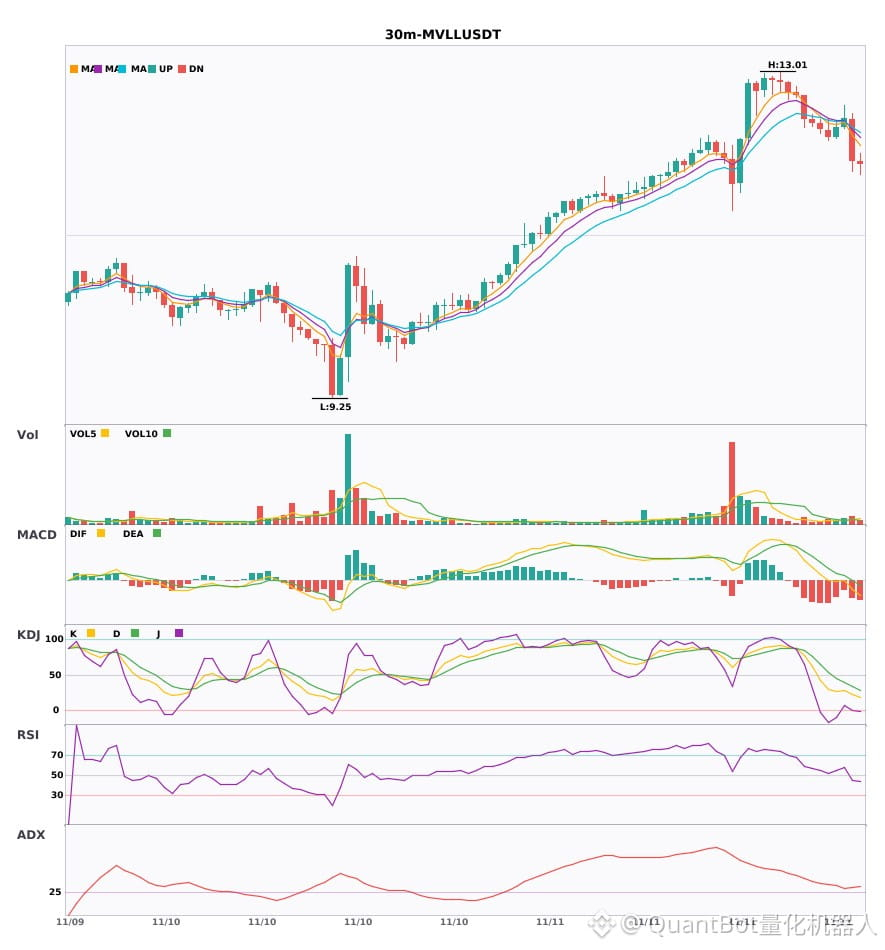
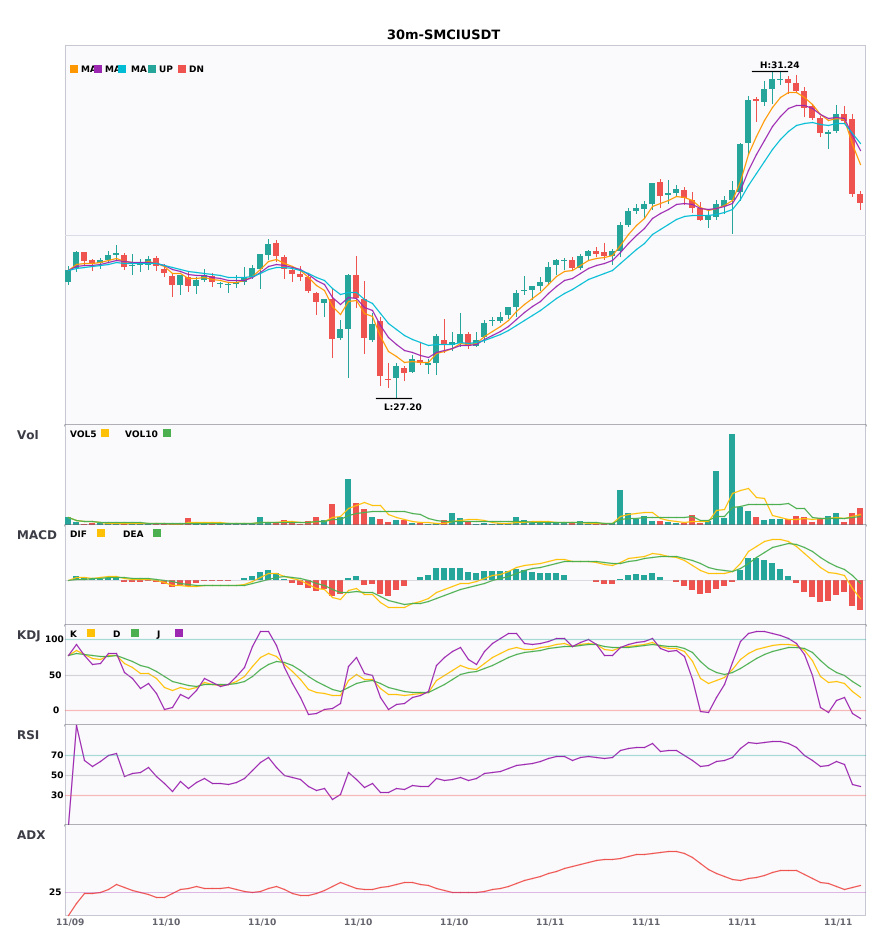
Three 30-minute bearish alerts: $SKHY / $MVLL / $SMCI
📉 $SKHY | 30-minute bearish signal
━━━━━━━━━━━━━━━━━━
Technical analysis: ADX(32) Clear trending market | MACD bearish, trend is weak, momentum increasing | EMA5 < EMA8 < EMA13, bearish alignment | KDJ weak, bears in control (K: 16.4, D: 31.8) | Volume increased (2.1x)
Price change: -1.5000%
📉 $MVLL | 30-minute bearish signal
━━━━━━━━━━━━━━━━━━
Technical analysis: ADX(32) Clear trending market | MACD bearish, trend is weak, momentum increasing | EMA5 < EMA8 < EMA13, bearish alignment | KDJ weak, bears in control (K: 22.5, D: 33.6) | Volume increased (1.6x)
Price change: -4.0100%
📉 $SMCI | 30-minute bearish signal
━━━━━━━━━━━━━━━━━━
Technical analysis: ADX(29) Trend is forming; entry is possible | MACD DIF has fallen below the zero line, trend has turned bearish | EMA5 < EMA8 < EMA13, bearish alignment | KDJ weak, bears in control (K: 26.3, D: 41.2) | Volume increased (1.6x)
Price change: -2.9400%
━━━━━━━━━━━━━━━━━━
#技术分析 #SKHY #MVLL #SMCI
📌 The above is for reference only and does not constitute investment advice
Three 30-minute bearish alerts: $SKHY / $MVLL / $SMCI
📉 $SKHY | 30-minute bearish signal
━━━━━━━━━━━━━━━━━━
Technical analysis: ADX(32) Clear trending market | MACD bearish, trend is weak, momentum increasing | EMA5 < EMA8 < EMA13, bearish alignment | KDJ weak, bears in control (K: 16.4, D: 31.8) | Volume increased (2.1x)
Price change: -1.5000%
📉 $MVLL | 30-minute bearish signal
━━━━━━━━━━━━━━━━━━
Technical analysis: ADX(32) Clear trending market | MACD bearish, trend is weak, momentum increasing | EMA5 < EMA8 < EMA13, bearish alignment | KDJ weak, bears in control (K: 22.5, D: 33.6) | Volume increased (1.6x)
Price change: -4.0100%
📉 $SMCI | 30-minute bearish signal
━━━━━━━━━━━━━━━━━━
Technical analysis: ADX(29) Trend is forming; entry is possible | MACD DIF has fallen below the zero line, trend has turned bearish | EMA5 < EMA8 < EMA13, bearish alignment | KDJ weak, bears in control (K: 26.3, D: 41.2) | Volume increased (1.6x)
Price change: -2.9400%
━━━━━━━━━━━━━━━━━━
#技术分析 #SKHY #MVLL #SMCI
📌 The above is for reference only and does not constitute investment advice
📉 $SKHY | 30-minute bearish signal
━━━━━━━━━━━━━━━━━━
Technical analysis: ADX(32) Clear trending market | MACD bearish, trend is weak, momentum increasing | EMA5 < EMA8 < EMA13, bearish alignment | KDJ weak, bears in control (K: 16.4, D: 31.8) | Volume increased (2.1x)
Price change: -1.5000%
📉 $MVLL | 30-minute bearish signal
━━━━━━━━━━━━━━━━━━
Technical analysis: ADX(32) Clear trending market | MACD bearish, trend is weak, momentum increasing | EMA5 < EMA8 < EMA13, bearish alignment | KDJ weak, bears in control (K: 22.5, D: 33.6) | Volume increased (1.6x)
Price change: -4.0100%
📉 $SMCI | 30-minute bearish signal
━━━━━━━━━━━━━━━━━━
Technical analysis: ADX(29) Trend is forming; entry is possible | MACD DIF has fallen below the zero line, trend has turned bearish | EMA5 < EMA8 < EMA13, bearish alignment | KDJ weak, bears in control (K: 26.3, D: 41.2) | Volume increased (1.6x)
Price change: -2.9400%
━━━━━━━━━━━━━━━━━━
#技术分析 #SKHY #MVLL #SMCI
📌 The above is for reference only and does not constitute investment advice
10

·
--
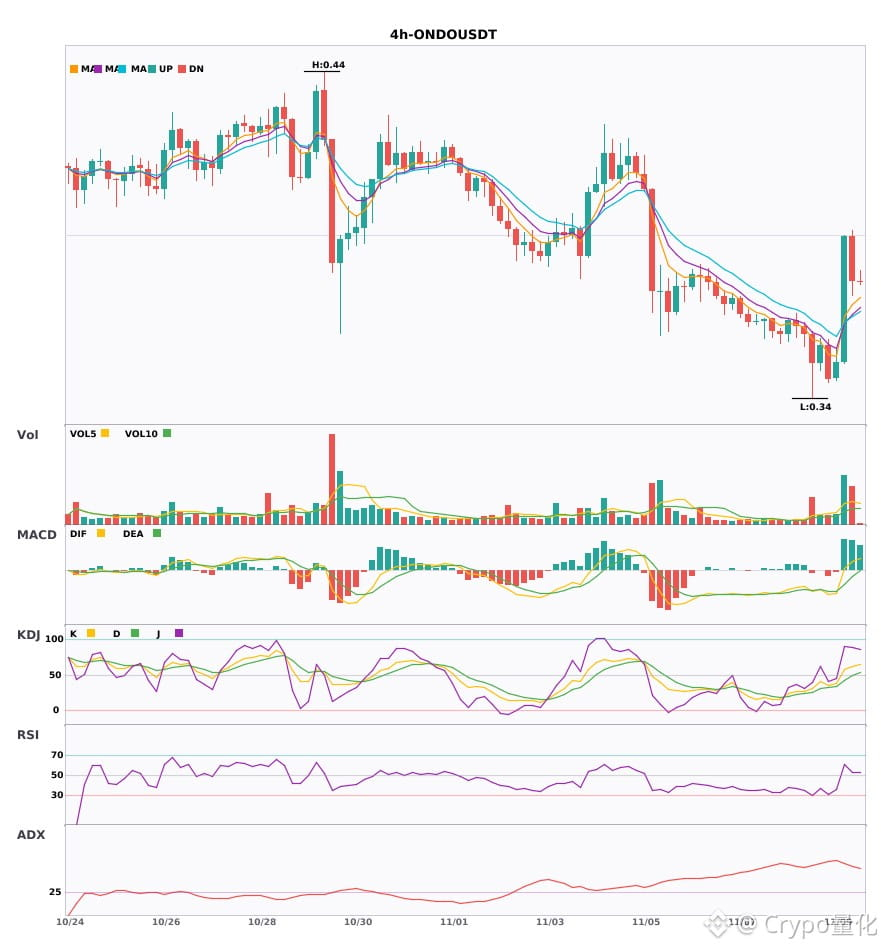
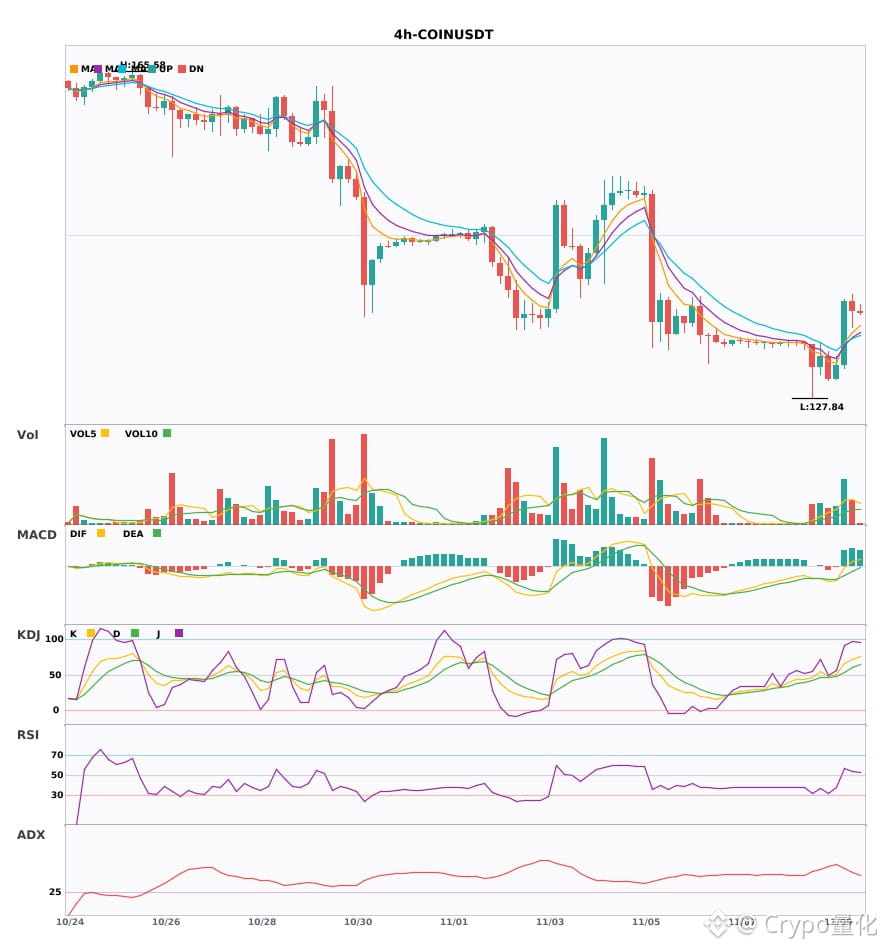
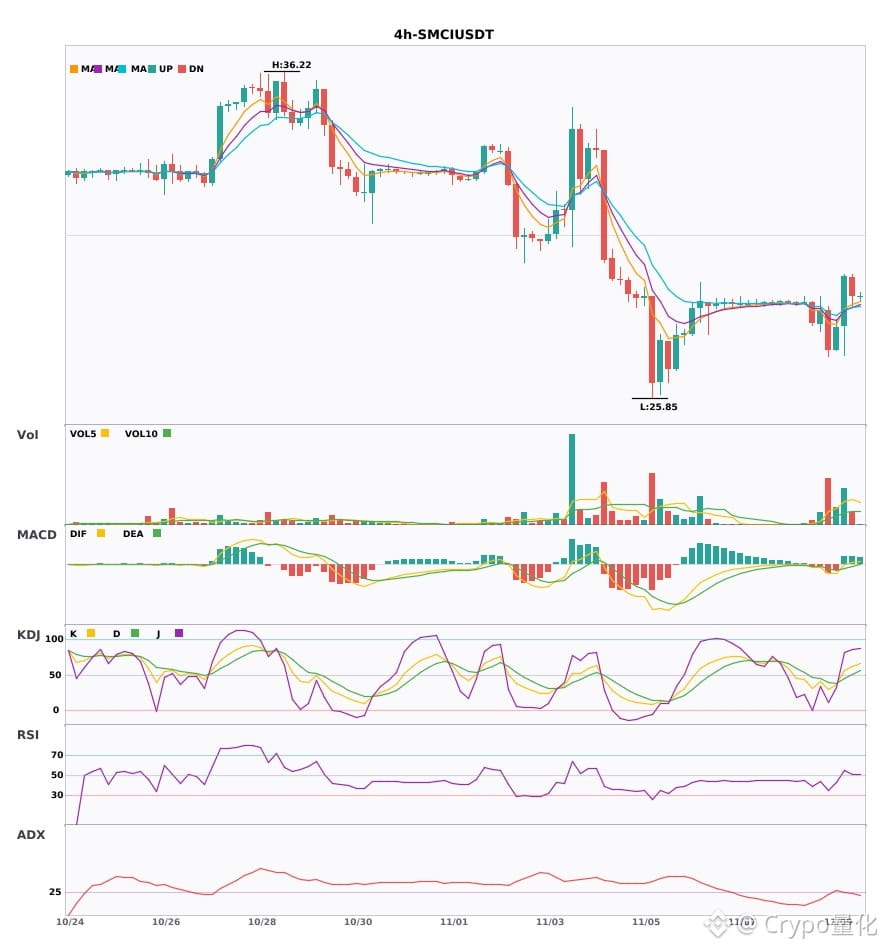
$ONDO / $COIN / $SMCI 4-hour confluence turns bullish, bullish signals appear simultaneously🔥
════════════════════
🔴 $ONDO 4-hour bullish signal
⚠️Technical analysis: ADX(57) Very strong trend (beware of overbought pullbacks) | MACD is bullish, trend is relatively strong, momentum is weakening | EMA5 > EMA8 > EMA13 bullish alignment | Volume surge (3.7x)
════════════════════
🔴 $COIN 4-hour bullish signal
⚠️Technical analysis: ADX(50) Very strong trend (beware of overbought pullbacks) | MACD DIF crossed above zero, trend turns bullish | EMA5 > EMA8 > EMA13 bullish alignment | KDJ is running strong, bulls have the upper hand (K is 72.3, D is 60.2) | Volume surge (3.6x)
📢Market update: Hard Fork vs. Soft Fork: How Blockchain Upgrades Work - Older nodes can accept soft-fork blocks without understanding every new rule. A hard fork requires upgraded software to follow the changed network, bu...
════════════════════
🔴 $SMCI 4-hour bullish signal
⚠️Technical analysis: ADX(26) Trend is forming, opportunity to participate | MACD DIF crossed above zero, trend turns bullish | EMA5 > EMA8 > EMA13 bullish alignment | KDJ is running strong, bulls have the upper hand (K is 62.2, D is 50.5) | Volume surge (3.0x)
════════════════════
🔔 Follow for first-hand market alerts 🔔
#技术分析 #ONDO #COIN #SMCI
📌 When trading, pay attention to whether the candlestick pattern is consistent
$ONDO / $COIN / $SMCI 4-hour confluence turns bullish, bullish signals appear simultaneously🔥
════════════════════
🔴 $ONDO 4-hour bullish signal
⚠️Technical analysis: ADX(57) Very strong trend (beware of overbought pullbacks) | MACD is bullish, trend is relatively strong, momentum is weakening | EMA5 > EMA8 > EMA13 bullish alignment | Volume surge (3.7x)
════════════════════
🔴 $COIN 4-hour bullish signal
⚠️Technical analysis: ADX(50) Very strong trend (beware of overbought pullbacks) | MACD DIF crossed above zero, trend turns bullish | EMA5 > EMA8 > EMA13 bullish alignment | KDJ is running strong, bulls have the upper hand (K is 72.3, D is 60.2) | Volume surge (3.6x)
📢Market update: Hard Fork vs. Soft Fork: How Blockchain Upgrades Work - Older nodes can accept soft-fork blocks without understanding every new rule. A hard fork requires upgraded software to follow the changed network, bu...
════════════════════
🔴 $SMCI 4-hour bullish signal
⚠️Technical analysis: ADX(26) Trend is forming, opportunity to participate | MACD DIF crossed above zero, trend turns bullish | EMA5 > EMA8 > EMA13 bullish alignment | KDJ is running strong, bulls have the upper hand (K is 62.2, D is 50.5) | Volume surge (3.0x)
════════════════════
🔔 Follow for first-hand market alerts 🔔
#技术分析 #ONDO #COIN #SMCI
📌 When trading, pay attention to whether the candlestick pattern is consistent
════════════════════
🔴 $ONDO 4-hour bullish signal
⚠️Technical analysis: ADX(57) Very strong trend (beware of overbought pullbacks) | MACD is bullish, trend is relatively strong, momentum is weakening | EMA5 > EMA8 > EMA13 bullish alignment | Volume surge (3.7x)
════════════════════
🔴 $COIN 4-hour bullish signal
⚠️Technical analysis: ADX(50) Very strong trend (beware of overbought pullbacks) | MACD DIF crossed above zero, trend turns bullish | EMA5 > EMA8 > EMA13 bullish alignment | KDJ is running strong, bulls have the upper hand (K is 72.3, D is 60.2) | Volume surge (3.6x)
📢Market update: Hard Fork vs. Soft Fork: How Blockchain Upgrades Work - Older nodes can accept soft-fork blocks without understanding every new rule. A hard fork requires upgraded software to follow the changed network, bu...
════════════════════
🔴 $SMCI 4-hour bullish signal
⚠️Technical analysis: ADX(26) Trend is forming, opportunity to participate | MACD DIF crossed above zero, trend turns bullish | EMA5 > EMA8 > EMA13 bullish alignment | KDJ is running strong, bulls have the upper hand (K is 62.2, D is 50.5) | Volume surge (3.0x)
════════════════════
🔔 Follow for first-hand market alerts 🔔
#技术分析 #ONDO #COIN #SMCI
📌 When trading, pay attention to whether the candlestick pattern is consistent
13

·
--
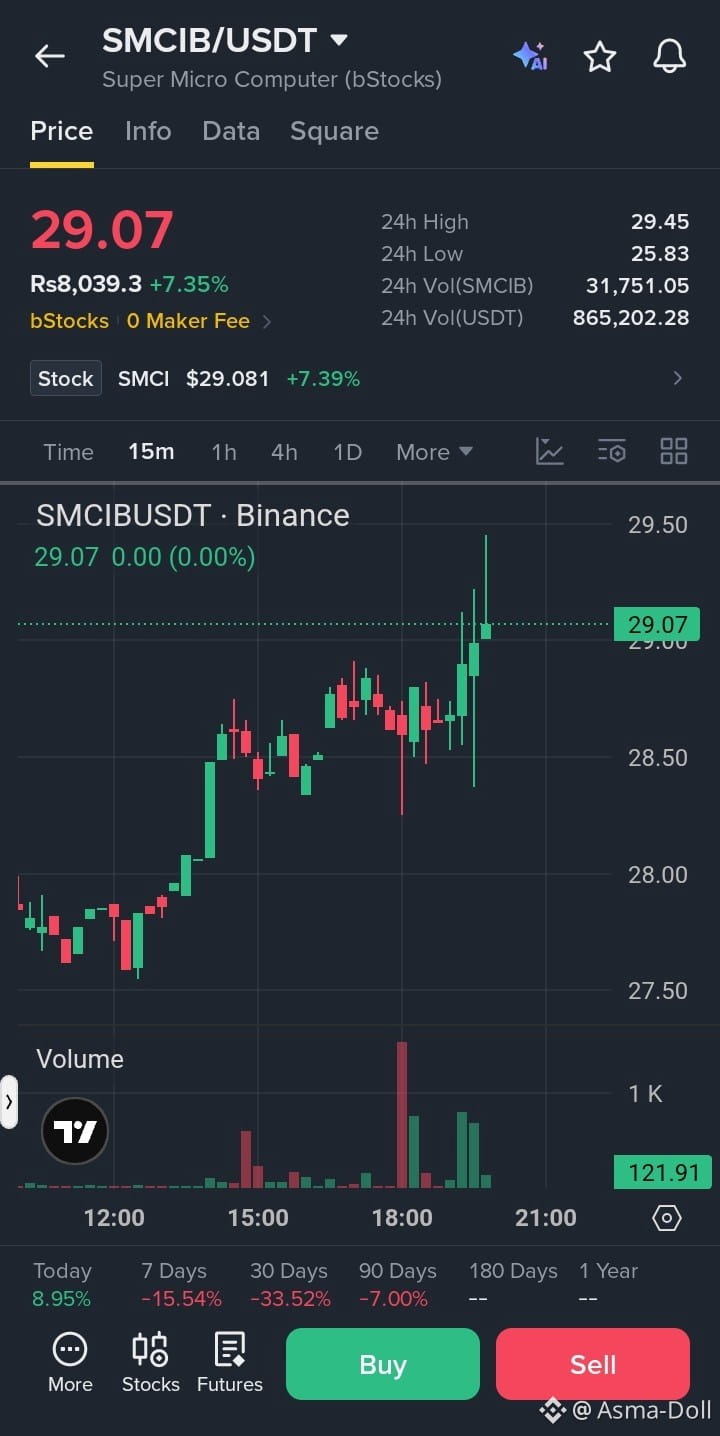
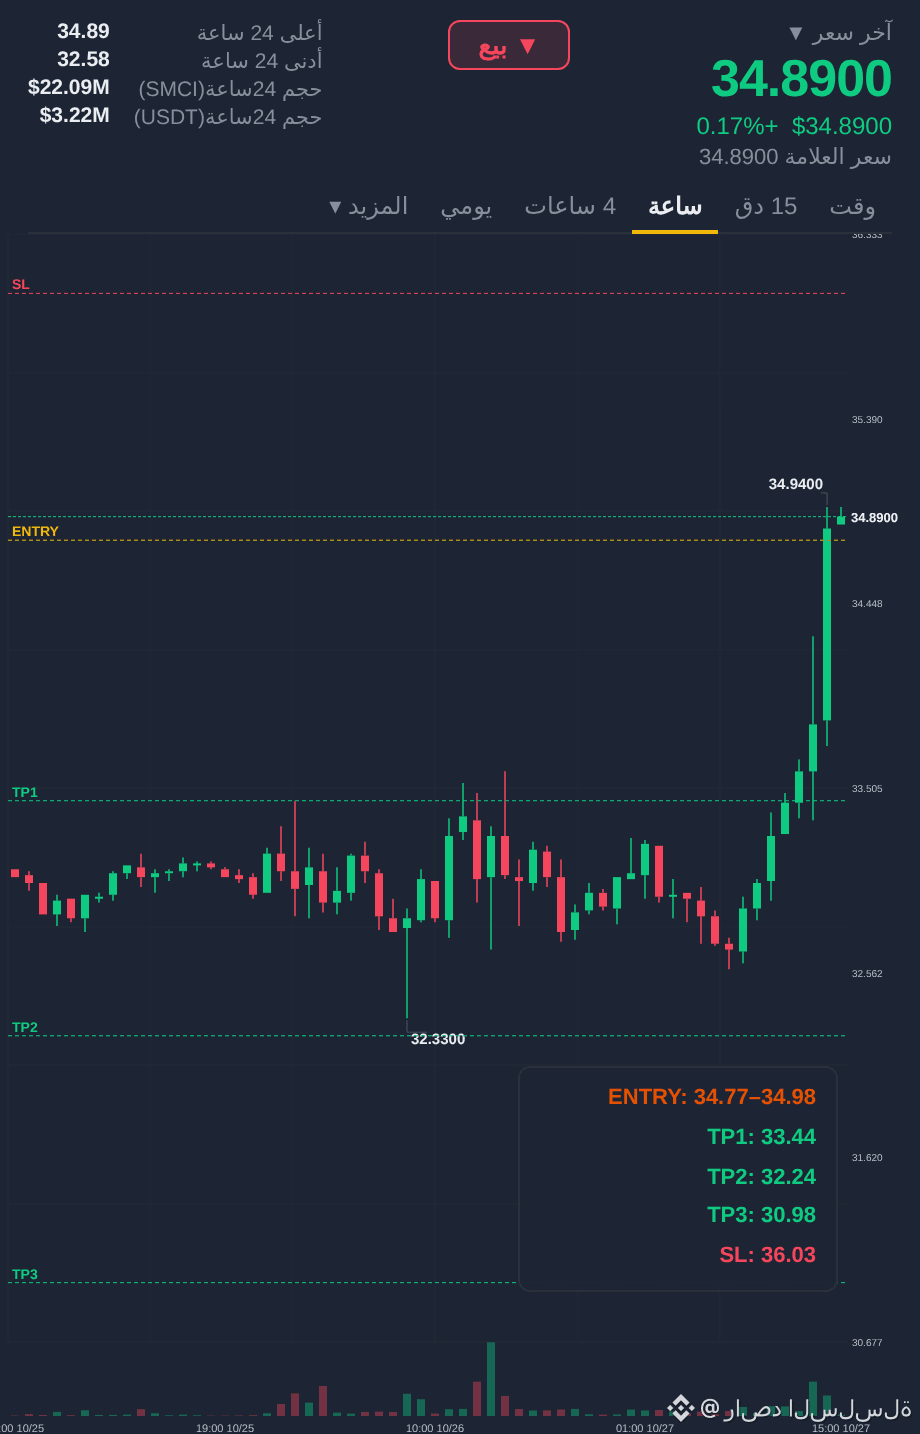
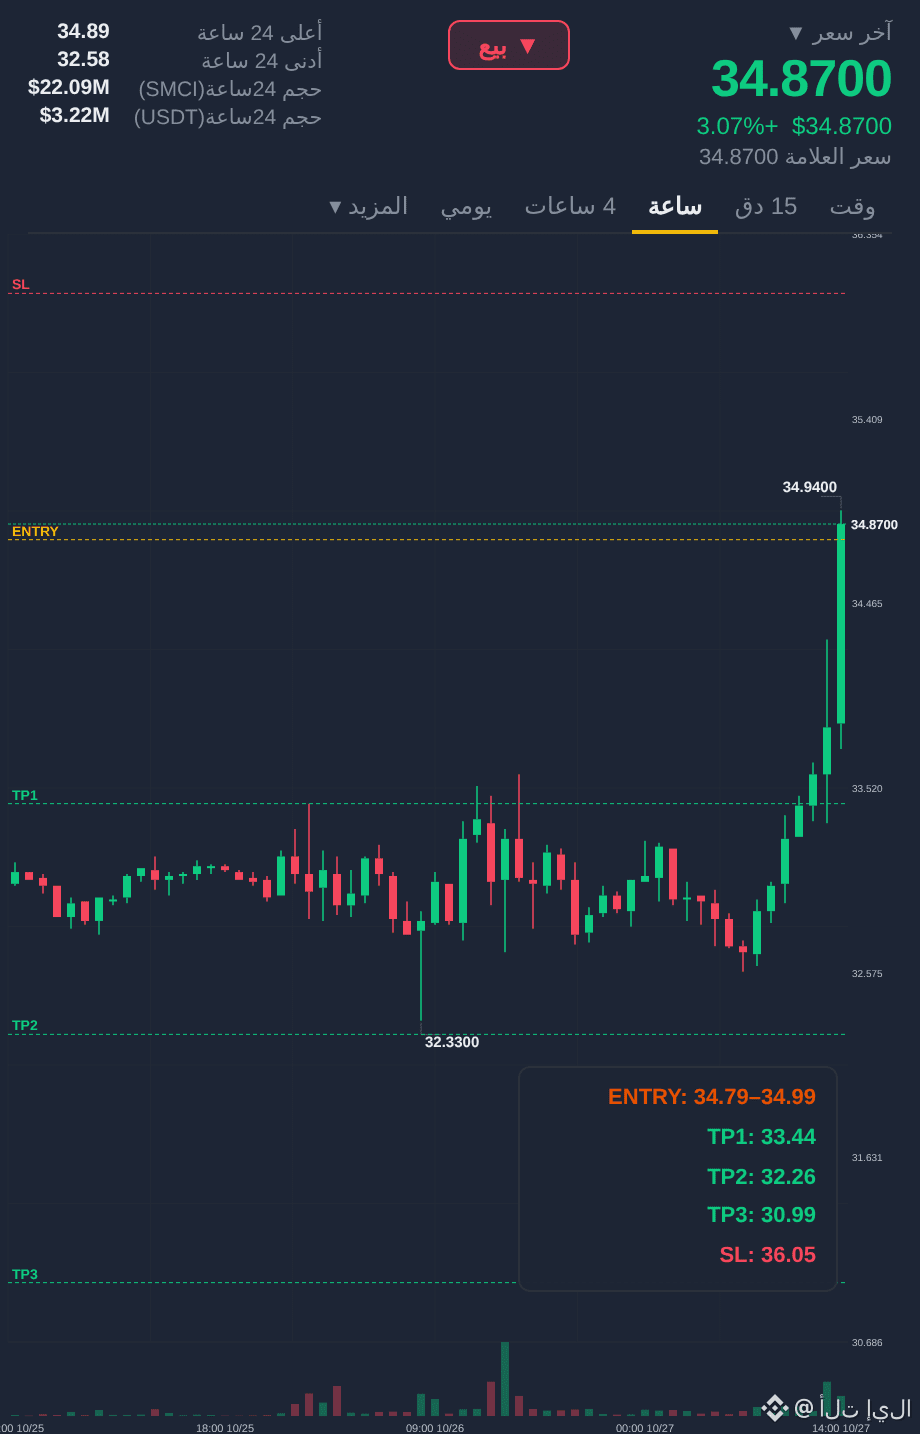
🔴 $SMCIB /USDT – SHORT SIGNAL
Trade Plan:
Direction: SHORT 📉
Entry: $29.10 – $29.45
Stop Loss (SL): $30.20
Take Profit Targets:
TP1: $28.50
TP2: $27.80
TP3: $26.80
Trade here $SMCIB
{spot}(SMCIBUSDT)
Analysis:
SMCIB is up 7.35% in 24 hours.
Price is approaching resistance near $29.45.
Underlying SMCI stock is also up 7.39%.
Weekly and monthly performance remains negative.
Rejection near $29.45 could trigger profit-taking.
A breakdown below $28.50 may increase selling pressure.
Confirmation: Wait for rejection around $29.45 and a confirmed 15m candle close below $28.80 before entering SHORT.
Risk-to-Reward:
TP1: 1:0.5
TP2: 1:1.2
TP3: 1:2.1
⚠️ Risk Warning: Strong daily buying momentum makes immediate shorting risky. Wait for bearish confirmation before entry. These levels are indicative and based only on your supplied snapshot.
#SMCIB #SMCI #BinanceTrading #ShortSignal #CryptoSignals
🔴 $SMCIB /USDT – SHORT SIGNAL
Trade Plan:
Direction: SHORT 📉
Entry: $29.10 – $29.45
Stop Loss (SL): $30.20
Take Profit Targets:
TP1: $28.50
TP2: $27.80
TP3: $26.80
Trade here $SMCIB
Analysis:
SMCIB is up 7.35% in 24 hours.
Price is approaching resistance near $29.45.
Underlying SMCI stock is also up 7.39%.
Weekly and monthly performance remains negative.
Rejection near $29.45 could trigger profit-taking.
A breakdown below $28.50 may increase selling pressure.
Confirmation: Wait for rejection around $29.45 and a confirmed 15m candle close below $28.80 before entering SHORT.
Risk-to-Reward:
TP1: 1:0.5
TP2: 1:1.2
TP3: 1:2.1
⚠️ Risk Warning: Strong daily buying momentum makes immediate shorting risky. Wait for bearish confirmation before entry. These levels are indicative and based only on your supplied snapshot.
#SMCIB #SMCI #BinanceTrading #ShortSignal #CryptoSignals
Trade Plan:
Direction: SHORT 📉
Entry: $29.10 – $29.45
Stop Loss (SL): $30.20
Take Profit Targets:
TP1: $28.50
TP2: $27.80
TP3: $26.80
Trade here $SMCIB
Analysis:
SMCIB is up 7.35% in 24 hours.
Price is approaching resistance near $29.45.
Underlying SMCI stock is also up 7.39%.
Weekly and monthly performance remains negative.
Rejection near $29.45 could trigger profit-taking.
A breakdown below $28.50 may increase selling pressure.
Confirmation: Wait for rejection around $29.45 and a confirmed 15m candle close below $28.80 before entering SHORT.
Risk-to-Reward:
TP1: 1:0.5
TP2: 1:1.2
TP3: 1:2.1
⚠️ Risk Warning: Strong daily buying momentum makes immediate shorting risky. Wait for bearish confirmation before entry. These levels are indicative and based only on your supplied snapshot.
#SMCIB #SMCI #BinanceTrading #ShortSignal #CryptoSignals
46

·
--
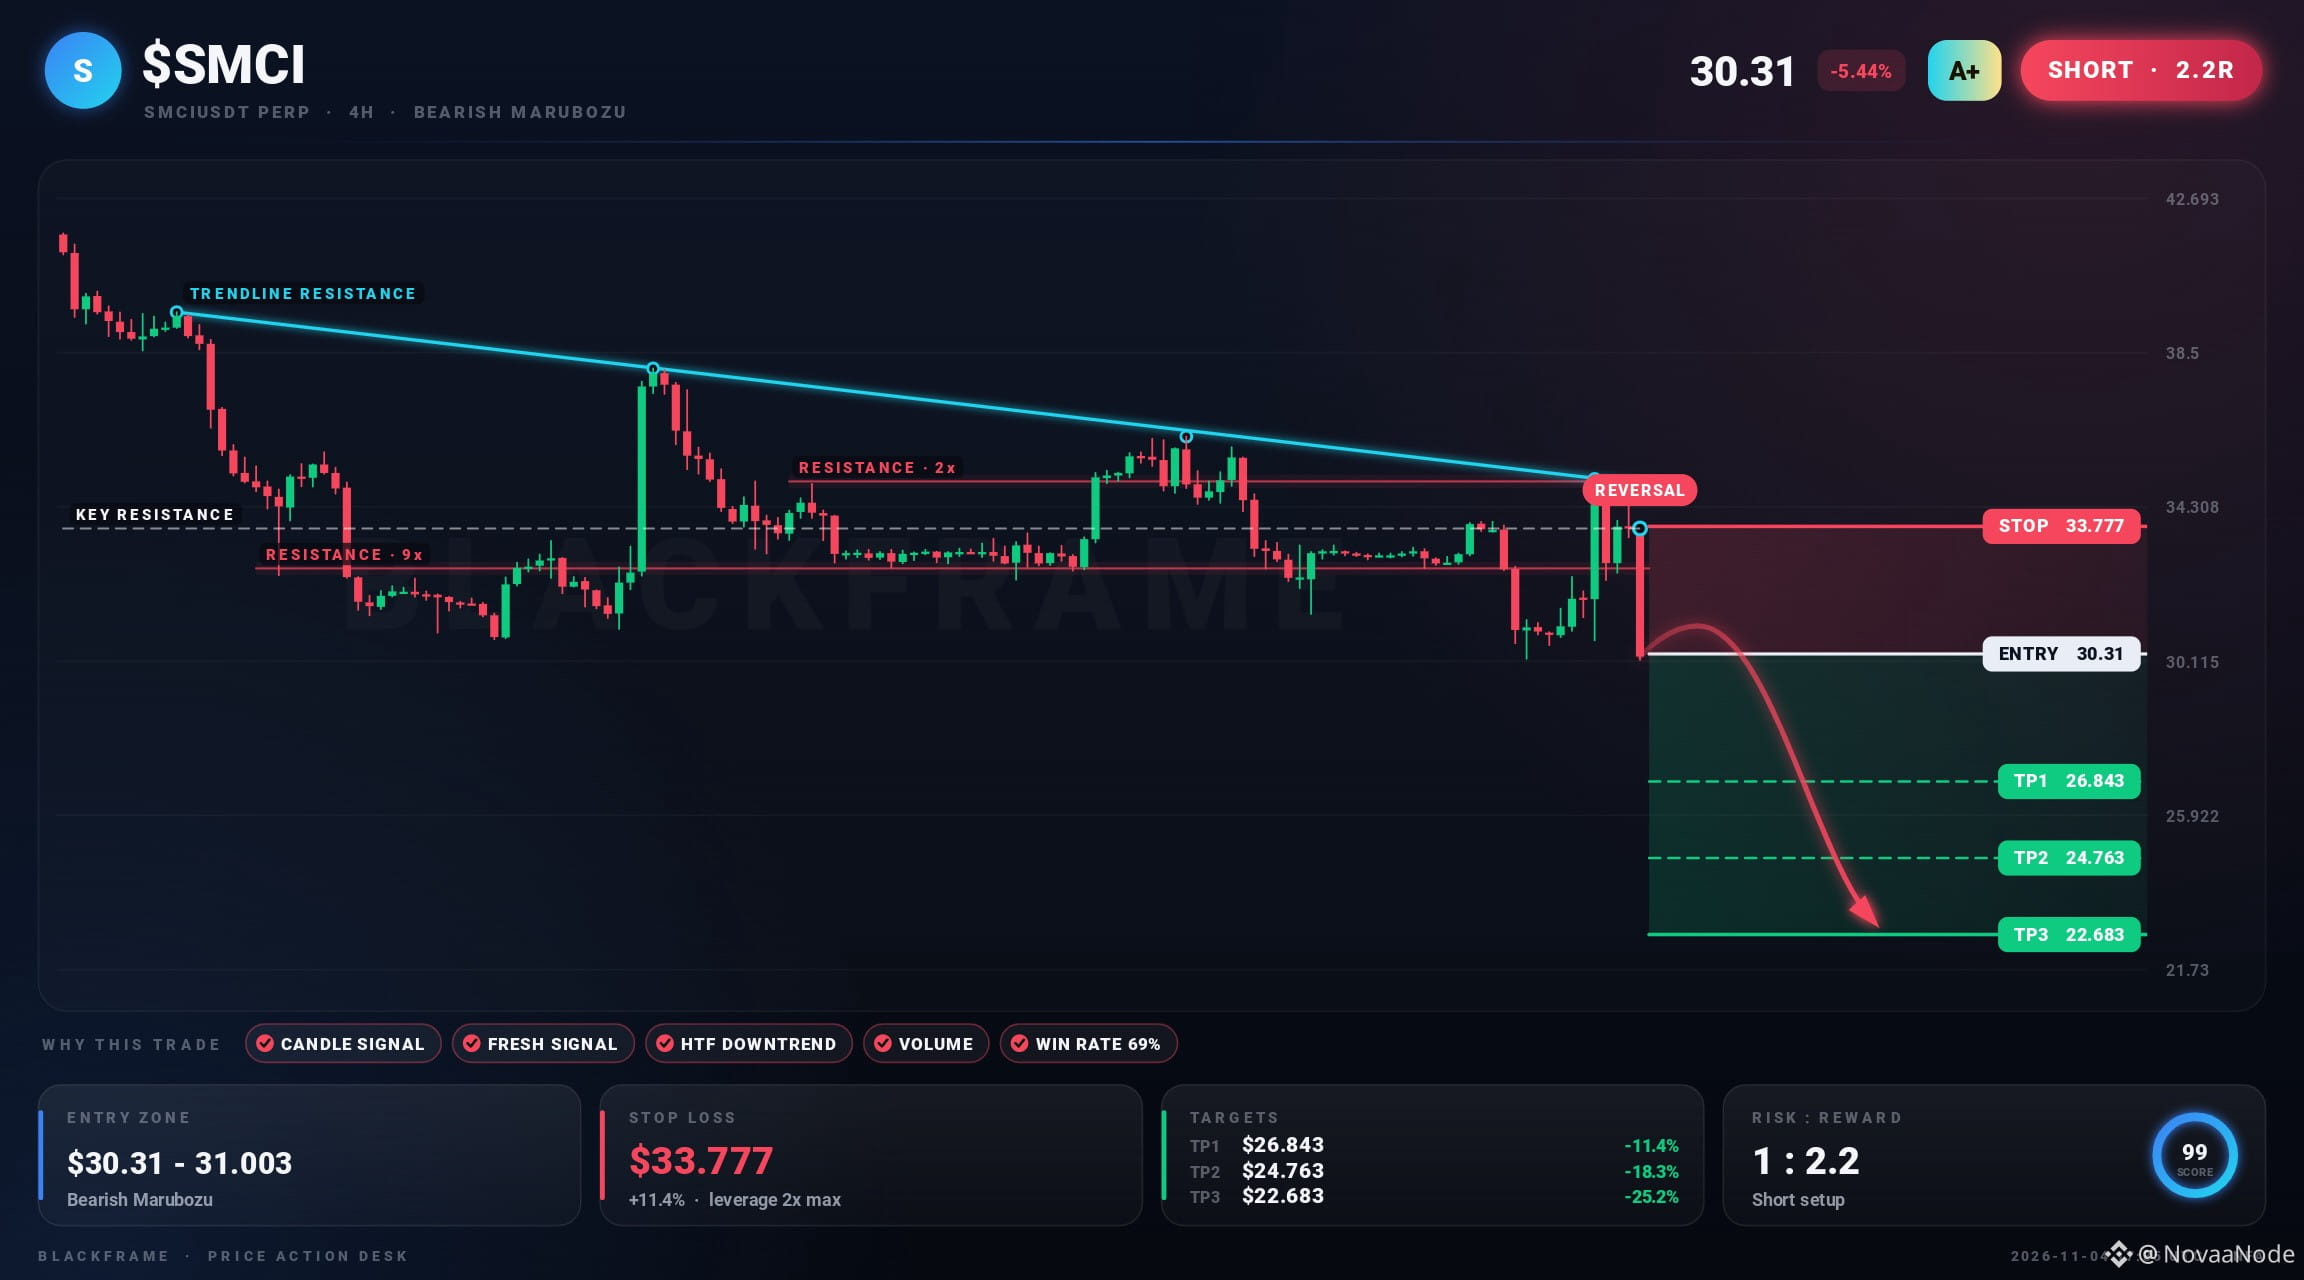
🕯️ $SMCI printed a reversal right at resistance
SHORT · 4H
Entry: $30.31 - $31.177
TP1: $26.843
TP2: $24.763
TP3: $22.683
SL: $33.777
A bearish reversal candle closed right at resistance near $33.72. The higher timeframe trend agrees.
#SMCI #TradingSignals #Altcoins · NFA
🕯️ $SMCI printed a reversal right at resistance
SHORT · 4H
Entry: $30.31 - $31.177
TP1: $26.843
TP2: $24.763
TP3: $22.683
SL: $33.777
A bearish reversal candle closed right at resistance near $33.72. The higher timeframe trend agrees.
#SMCI #TradingSignals #Altcoins · NFA
SHORT · 4H
Entry: $30.31 - $31.177
TP1: $26.843
TP2: $24.763
TP3: $22.683
SL: $33.777
A bearish reversal candle closed right at resistance near $33.72. The higher timeframe trend agrees.
#SMCI #TradingSignals #Altcoins · NFA
131

·
--
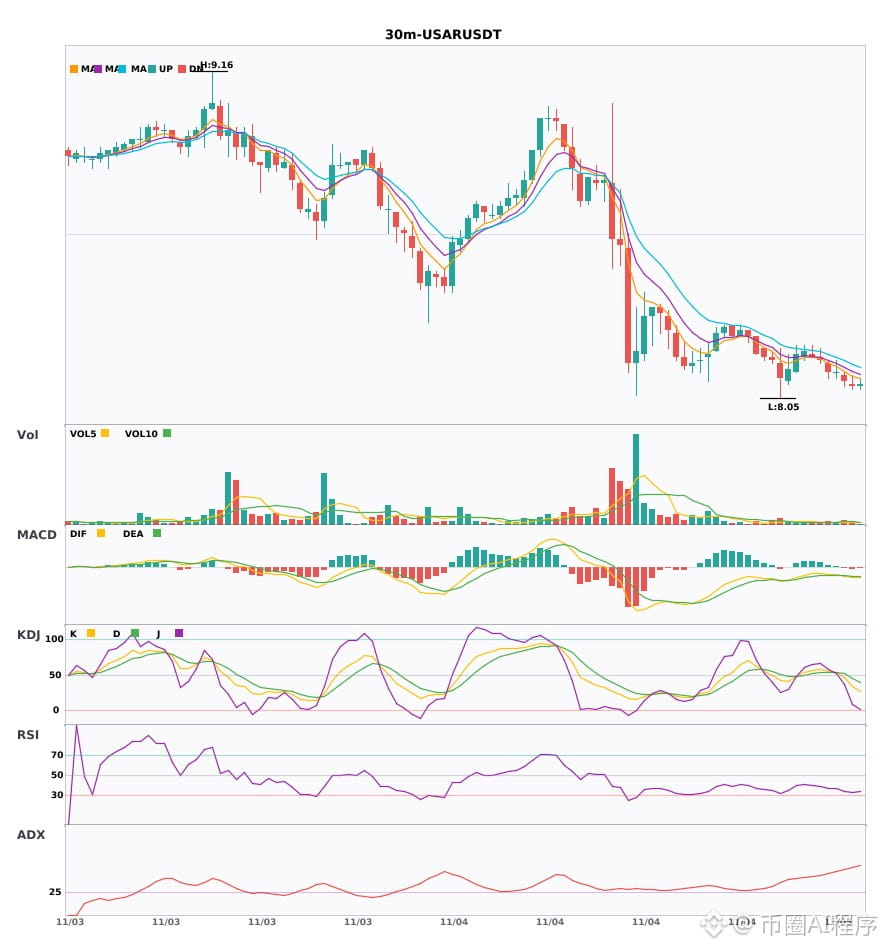
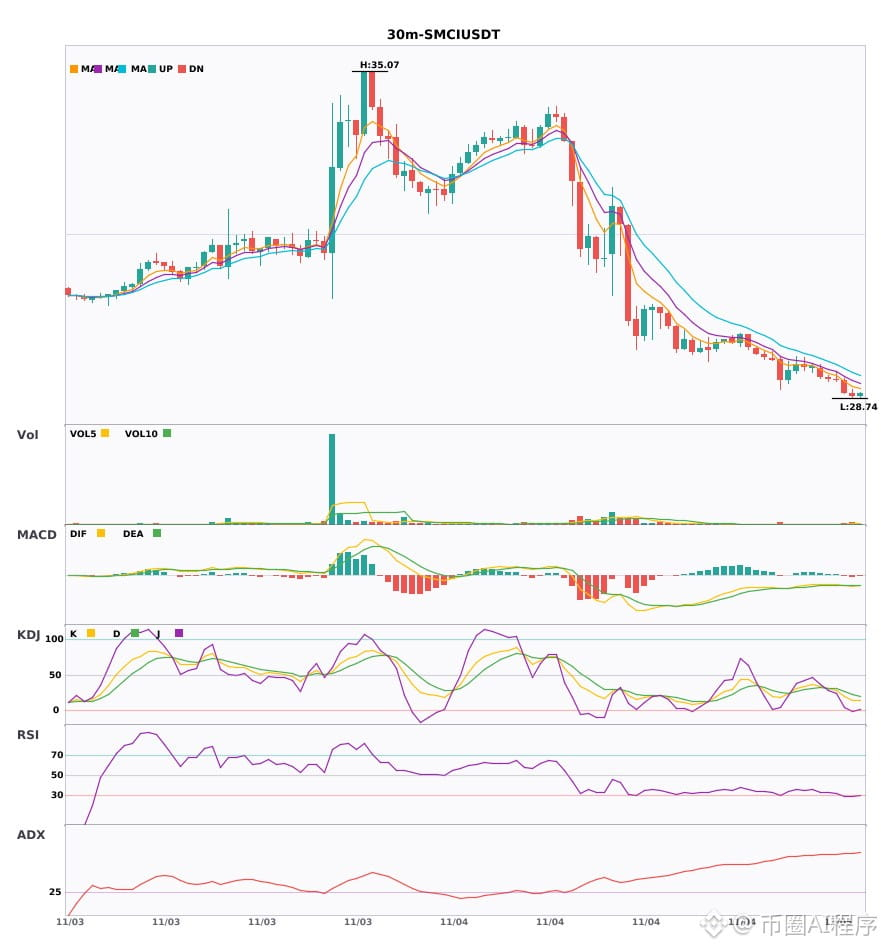
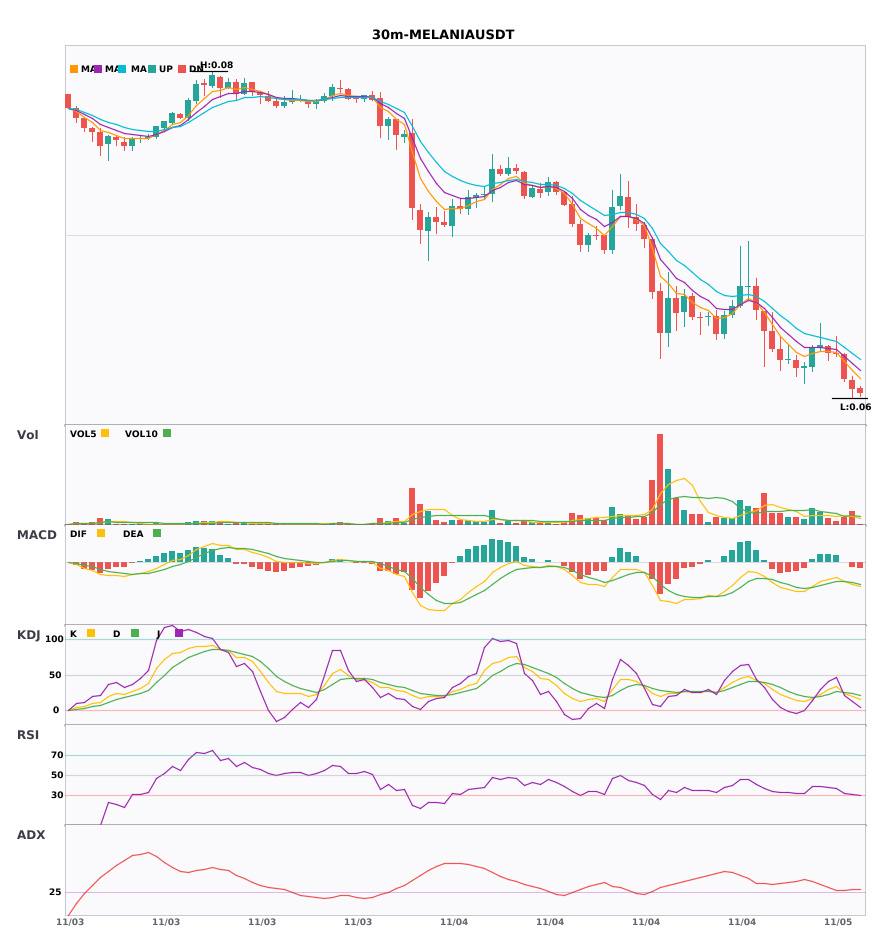
$USAR / $SMCI / $MELANIA 30-minute shorts + 4-hour shorts aligned; multi-timeframe confluence turns bearish 🔥
════════════════════
🟢 $USAR 30-minute Short Signal
⚠️ Technicals: 4-hour bearish confluence confirmed | 30-minute entry: MACD bearish cross below zero, bearish momentum accelerating | EMA5 < EMA8 < EMA13, bearish alignment | Normal volume (1.3x)
════════════════════
🟢 $SMCI 30-minute Short Signal
⚠️ Technicals: 4-hour bearish confluence confirmed | 30-minute entry: MACD bearish cross below zero, bearish momentum accelerating | EMA5 < EMA8 < EMA13, bearish alignment | KDJ weak, bears in control (K: 19.3, D: 26.8) | Increased volume (2.0x)
════════════════════
🟢 $MELANIA 30-minute Short Signal
⚠️ Technicals: 4-hour bearish confluence confirmed | 30-minute entry: MACD bearish cross below zero, bearish momentum accelerating | EMA5 < EMA8 < EMA13, bearish alignment | KDJ weak, bears in control (K: 20.3, D: 24.0) | Normal volume (1.5x)
════════════════════
🔔 Follow for first-hand market movement alerts 🔔
#多周期共振 #USAR #SMCI #MELANIA
📌 When trading, check whether the candlestick pattern matches
$USAR / $SMCI / $MELANIA 30-minute shorts + 4-hour shorts aligned; multi-timeframe confluence turns bearish 🔥
════════════════════
🟢 $USAR 30-minute Short Signal
⚠️ Technicals: 4-hour bearish confluence confirmed | 30-minute entry: MACD bearish cross below zero, bearish momentum accelerating | EMA5 < EMA8 < EMA13, bearish alignment | Normal volume (1.3x)
════════════════════
🟢 $SMCI 30-minute Short Signal
⚠️ Technicals: 4-hour bearish confluence confirmed | 30-minute entry: MACD bearish cross below zero, bearish momentum accelerating | EMA5 < EMA8 < EMA13, bearish alignment | KDJ weak, bears in control (K: 19.3, D: 26.8) | Increased volume (2.0x)
════════════════════
🟢 $MELANIA 30-minute Short Signal
⚠️ Technicals: 4-hour bearish confluence confirmed | 30-minute entry: MACD bearish cross below zero, bearish momentum accelerating | EMA5 < EMA8 < EMA13, bearish alignment | KDJ weak, bears in control (K: 20.3, D: 24.0) | Normal volume (1.5x)
════════════════════
🔔 Follow for first-hand market movement alerts 🔔
#多周期共振 #USAR #SMCI #MELANIA
📌 When trading, check whether the candlestick pattern matches
════════════════════
🟢 $USAR 30-minute Short Signal
⚠️ Technicals: 4-hour bearish confluence confirmed | 30-minute entry: MACD bearish cross below zero, bearish momentum accelerating | EMA5 < EMA8 < EMA13, bearish alignment | Normal volume (1.3x)
════════════════════
🟢 $SMCI 30-minute Short Signal
⚠️ Technicals: 4-hour bearish confluence confirmed | 30-minute entry: MACD bearish cross below zero, bearish momentum accelerating | EMA5 < EMA8 < EMA13, bearish alignment | KDJ weak, bears in control (K: 19.3, D: 26.8) | Increased volume (2.0x)
════════════════════
🟢 $MELANIA 30-minute Short Signal
⚠️ Technicals: 4-hour bearish confluence confirmed | 30-minute entry: MACD bearish cross below zero, bearish momentum accelerating | EMA5 < EMA8 < EMA13, bearish alignment | KDJ weak, bears in control (K: 20.3, D: 24.0) | Normal volume (1.5x)
════════════════════
🔔 Follow for first-hand market movement alerts 🔔
#多周期共振 #USAR #SMCI #MELANIA
📌 When trading, check whether the candlestick pattern matches
8
·
--
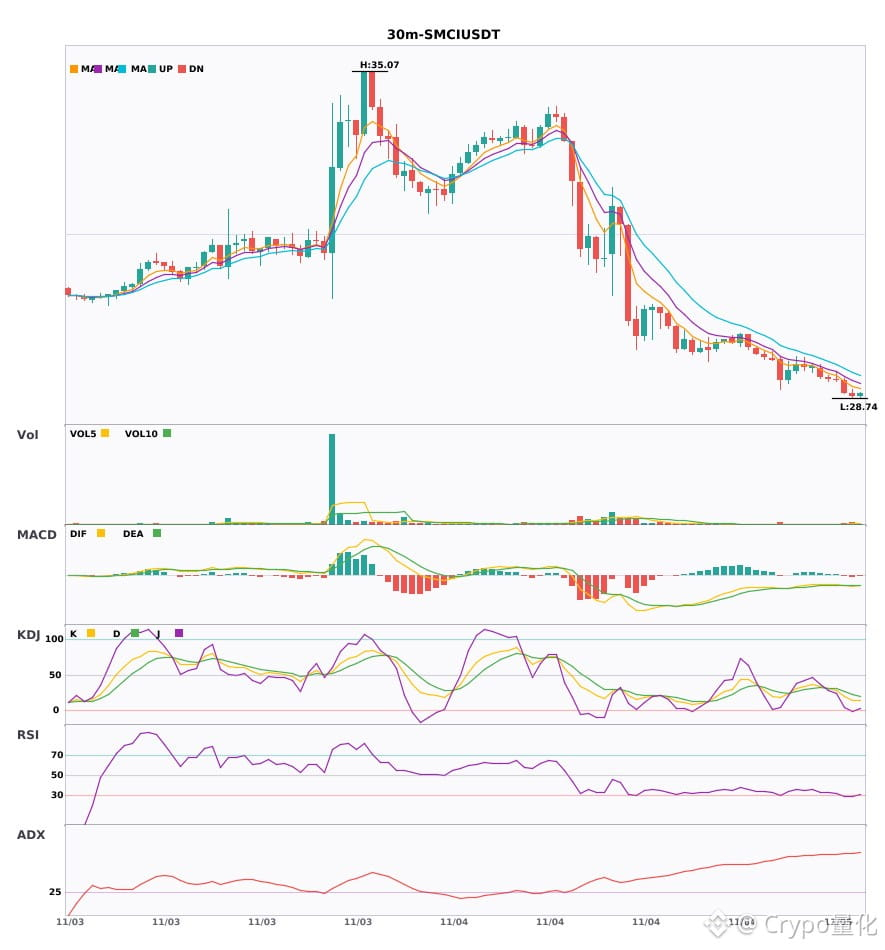
$SMCI 30-minute bearish warning 🔥
════════════════════
🟢 $SMCI 30-minute bearish signal
⚠️ Technicals: ADX(70) indicates a very strong trend (beware of an overheated pullback) | MACD bearish crossover below zero, bearish momentum accelerating | EMA5 < EMA8 < EMA13, bearish alignment | KDJ is weak, with bears in control (K: 19.3, D: 26.8) | Volume increased (2.0x)
════════════════════
🔔 Follow for first-hand market updates 🔔
#技术分析 #SMCI
📌 When trading, pay attention to whether the candlestick pattern matches
$SMCI 30-minute bearish warning 🔥
════════════════════
🟢 $SMCI 30-minute bearish signal
⚠️ Technicals: ADX(70) indicates a very strong trend (beware of an overheated pullback) | MACD bearish crossover below zero, bearish momentum accelerating | EMA5 < EMA8 < EMA13, bearish alignment | KDJ is weak, with bears in control (K: 19.3, D: 26.8) | Volume increased (2.0x)
════════════════════
🔔 Follow for first-hand market updates 🔔
#技术分析 #SMCI
📌 When trading, pay attention to whether the candlestick pattern matches
════════════════════
🟢 $SMCI 30-minute bearish signal
⚠️ Technicals: ADX(70) indicates a very strong trend (beware of an overheated pullback) | MACD bearish crossover below zero, bearish momentum accelerating | EMA5 < EMA8 < EMA13, bearish alignment | KDJ is weak, with bears in control (K: 19.3, D: 26.8) | Volume increased (2.0x)
════════════════════
🔔 Follow for first-hand market updates 🔔
#技术分析 #SMCI
📌 When trading, pay attention to whether the candlestick pattern matches
11
·
--
$SMCI / $AAOI 30-minute bearish + 4-hour bearish alignment; multi-timeframe confluence turns bearish 🔥
════════════════════
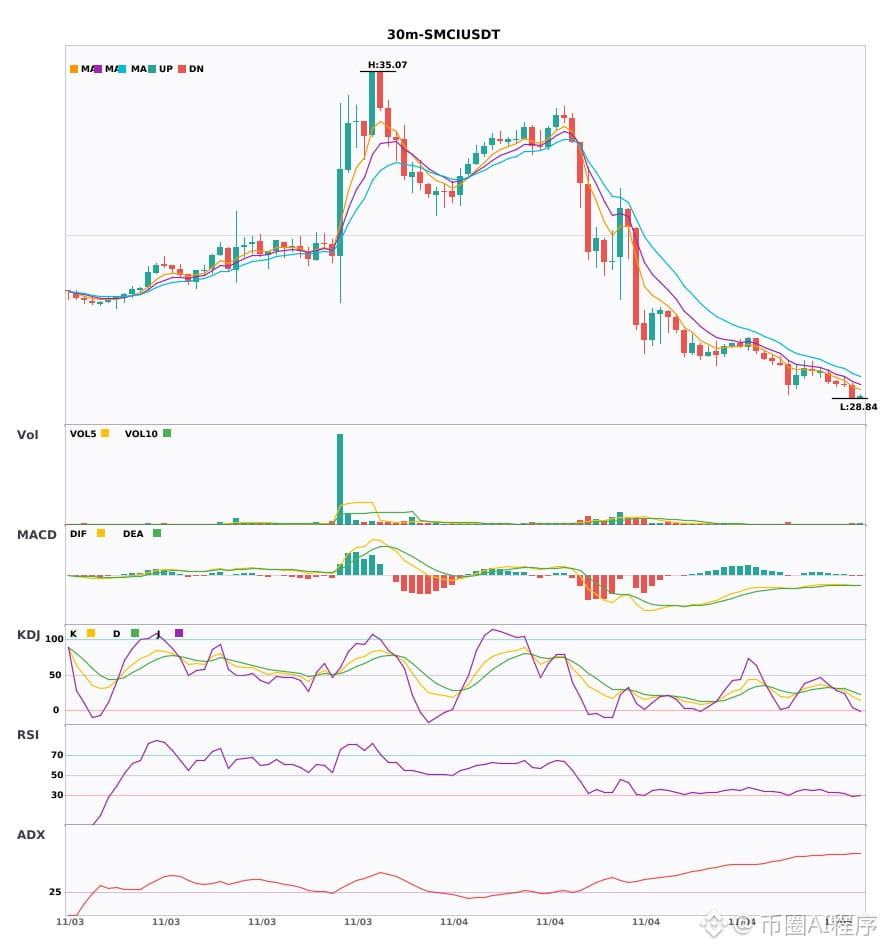
🟢 $SMCI 30-minute bearish signal
⚠️Technical analysis: 4-hour bearish confluence confirmed | 30-minute entry: MACD death cross below zero, bearish momentum accelerating | EMA5 < EMA8 < EMA13, bearish alignment | KDJ showing weakness, bears in control (K: 19.3, D: 26.8) | Increased volume (2.0x)
════════════════════
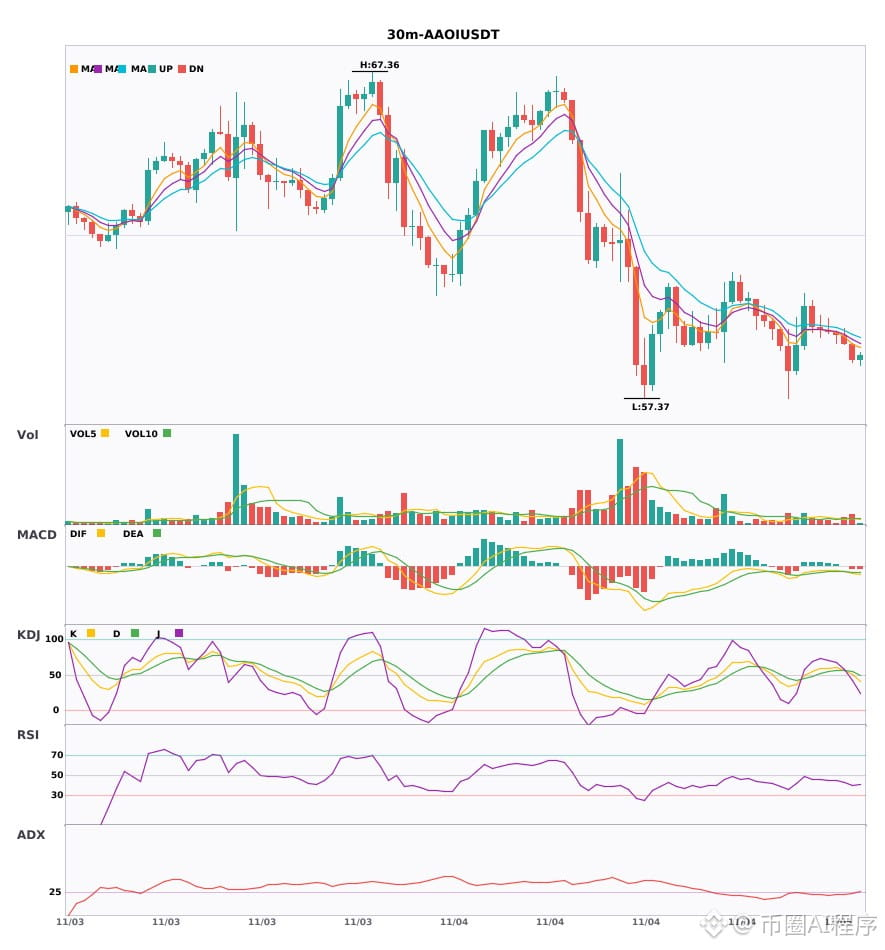
🟢 $AAOI 30-minute bearish signal
⚠️Technical analysis: 4-hour bearish confluence confirmed | 30-minute entry: MACD death cross below zero, bearish momentum accelerating | EMA5 < EMA8 < EMA13, bearish alignment | KDJ death cross, short-term outlook bearish (K: 50.1, D: 54.3) | Increased volume (1.5x)
════════════════════
🔔 Follow for first-hand market alerts 🔔
#多周期共振 #SMCI #AAOI
📌 When trading, watch for candlestick patterns that confirm the setup
$SMCI / $AAOI 30-minute bearish + 4-hour bearish alignment; multi-timeframe confluence turns bearish 🔥
════════════════════
🟢 $SMCI 30-minute bearish signal
⚠️Technical analysis: 4-hour bearish confluence confirmed | 30-minute entry: MACD death cross below zero, bearish momentum accelerating | EMA5 < EMA8 < EMA13, bearish alignment | KDJ showing weakness, bears in control (K: 19.3, D: 26.8) | Increased volume (2.0x)
════════════════════
🟢 $AAOI 30-minute bearish signal
⚠️Technical analysis: 4-hour bearish confluence confirmed | 30-minute entry: MACD death cross below zero, bearish momentum accelerating | EMA5 < EMA8 < EMA13, bearish alignment | KDJ death cross, short-term outlook bearish (K: 50.1, D: 54.3) | Increased volume (1.5x)
════════════════════
🔔 Follow for first-hand market alerts 🔔
#多周期共振 #SMCI #AAOI
📌 When trading, watch for candlestick patterns that confirm the setup
════════════════════
🟢 $SMCI 30-minute bearish signal
⚠️Technical analysis: 4-hour bearish confluence confirmed | 30-minute entry: MACD death cross below zero, bearish momentum accelerating | EMA5 < EMA8 < EMA13, bearish alignment | KDJ showing weakness, bears in control (K: 19.3, D: 26.8) | Increased volume (2.0x)
════════════════════
🟢 $AAOI 30-minute bearish signal
⚠️Technical analysis: 4-hour bearish confluence confirmed | 30-minute entry: MACD death cross below zero, bearish momentum accelerating | EMA5 < EMA8 < EMA13, bearish alignment | KDJ death cross, short-term outlook bearish (K: 50.1, D: 54.3) | Increased volume (1.5x)
════════════════════
🔔 Follow for first-hand market alerts 🔔
#多周期共振 #SMCI #AAOI
📌 When trading, watch for candlestick patterns that confirm the setup
4
·
--
Multi-timeframe confluence: $Lobster / $SMCI / $AGT 30-minute weakness, 4-hour bearish trend confirmed🔥
════════════════════
🟢 $Lobster 30-minute bearish signal
⚠️Technical analysis: 4-hour bearish confluence confirmed | 30-minute entry: MACD bearish, trend weakening, momentum strengthening | EMA5 < EMA8 < EMA13, bearish alignment | KDJ weak, bears in control (K: 17.4, D: 31.5) | Volume increased (2.0x)
════════════════════
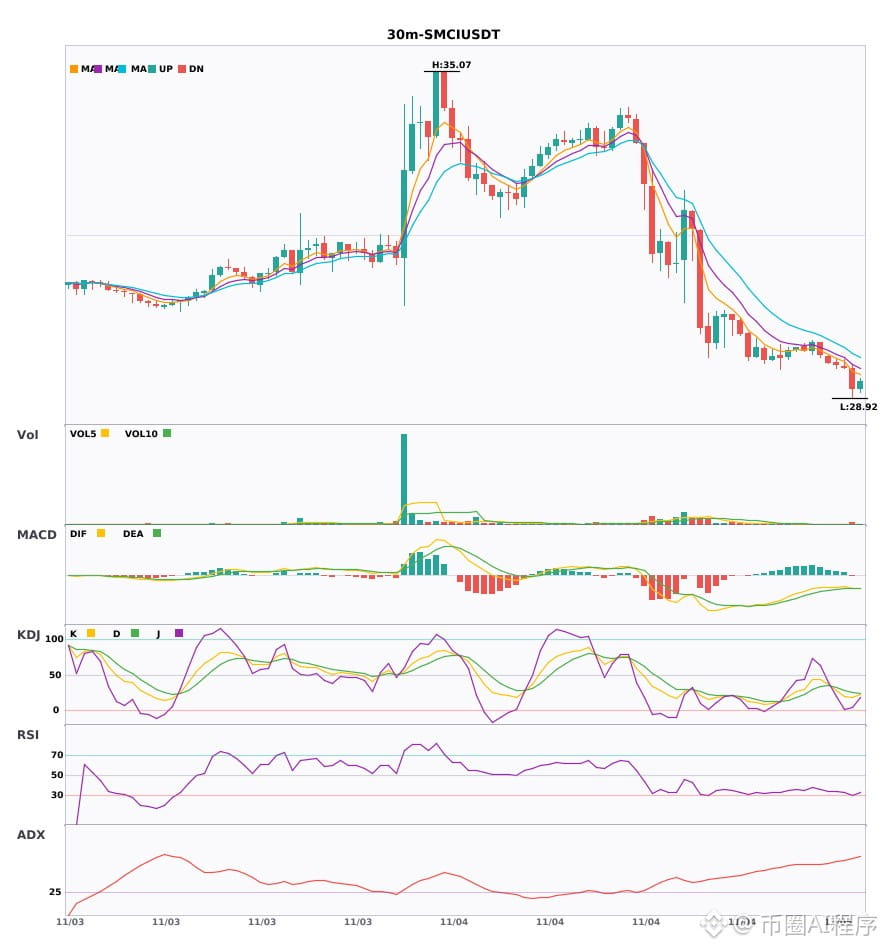
🟢 $SMCI 30-minute bearish signal
⚠️Technical analysis: 4-hour bearish confluence confirmed | 30-minute entry: MACD bearish cross below zero, bearish momentum accelerating | EMA5 < EMA8 < EMA13, bearish alignment | KDJ weak, bears in control (K: 18.5, D: 25.3) | Volume surged (2.7x)
════════════════════
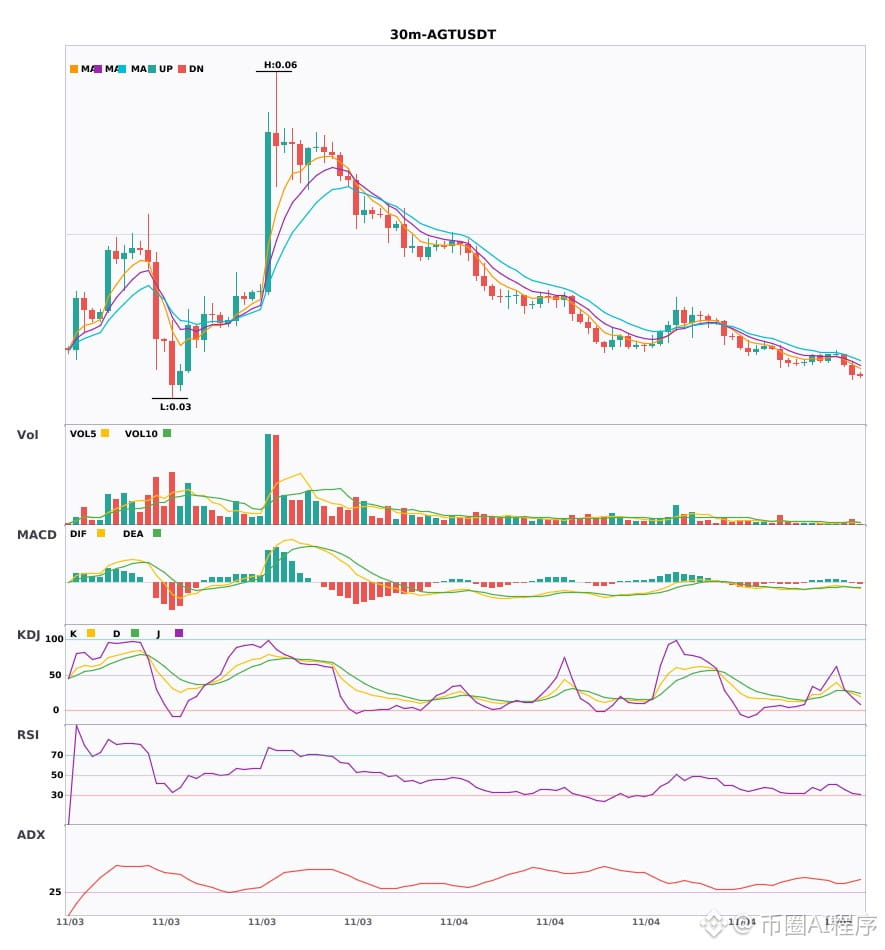
🟢 $AGT 30-minute bearish signal
⚠️Technical analysis: 4-hour bearish confluence confirmed | 30-minute entry: MACD bearish cross below zero, bearish momentum accelerating | EMA5 < EMA8 < EMA13, bearish alignment | KDJ bearish cross, short-term outlook bearish (K: 24.3, D: 27.1) | Volume increased (1.9x)
════════════════════
🔔 Follow for real-time market movements 🔔
#多周期共振 #龙虾 #SMCI #AGT
📌 When trading, pay attention to whether the candlestick patterns align
Multi-timeframe confluence: $Lobster / $SMCI / $AGT 30-minute weakness, 4-hour bearish trend confirmed🔥
════════════════════
🟢 $Lobster 30-minute bearish signal
⚠️Technical analysis: 4-hour bearish confluence confirmed | 30-minute entry: MACD bearish, trend weakening, momentum strengthening | EMA5 < EMA8 < EMA13, bearish alignment | KDJ weak, bears in control (K: 17.4, D: 31.5) | Volume increased (2.0x)
════════════════════
🟢 $SMCI 30-minute bearish signal
⚠️Technical analysis: 4-hour bearish confluence confirmed | 30-minute entry: MACD bearish cross below zero, bearish momentum accelerating | EMA5 < EMA8 < EMA13, bearish alignment | KDJ weak, bears in control (K: 18.5, D: 25.3) | Volume surged (2.7x)
════════════════════
🟢 $AGT 30-minute bearish signal
⚠️Technical analysis: 4-hour bearish confluence confirmed | 30-minute entry: MACD bearish cross below zero, bearish momentum accelerating | EMA5 < EMA8 < EMA13, bearish alignment | KDJ bearish cross, short-term outlook bearish (K: 24.3, D: 27.1) | Volume increased (1.9x)
════════════════════
🔔 Follow for real-time market movements 🔔
#多周期共振 #龙虾 #SMCI #AGT
📌 When trading, pay attention to whether the candlestick patterns align
════════════════════
🟢 $Lobster 30-minute bearish signal
⚠️Technical analysis: 4-hour bearish confluence confirmed | 30-minute entry: MACD bearish, trend weakening, momentum strengthening | EMA5 < EMA8 < EMA13, bearish alignment | KDJ weak, bears in control (K: 17.4, D: 31.5) | Volume increased (2.0x)
════════════════════
🟢 $SMCI 30-minute bearish signal
⚠️Technical analysis: 4-hour bearish confluence confirmed | 30-minute entry: MACD bearish cross below zero, bearish momentum accelerating | EMA5 < EMA8 < EMA13, bearish alignment | KDJ weak, bears in control (K: 18.5, D: 25.3) | Volume surged (2.7x)
════════════════════
🟢 $AGT 30-minute bearish signal
⚠️Technical analysis: 4-hour bearish confluence confirmed | 30-minute entry: MACD bearish cross below zero, bearish momentum accelerating | EMA5 < EMA8 < EMA13, bearish alignment | KDJ bearish cross, short-term outlook bearish (K: 24.3, D: 27.1) | Volume increased (1.9x)
════════════════════
🔔 Follow for real-time market movements 🔔
#多周期共振 #龙虾 #SMCI #AGT
📌 When trading, pay attention to whether the candlestick patterns align
23


> SMCI SEES FY NET SALES $72.0B TO $82.0B, SAW $65B TO $72B
> SMCI SEES 2Q NET SALES $19.5B TO $21.5B, EST.
> $16.53B
> $SMCI
#SMCI
> SMCI SEES FY NET SALES $72.0B TO $82.0B, SAW $65B TO $72B
> SMCI SEES 2Q NET SALES $19.5B TO $21.5B, EST.
> $16.53B
> $SMCI
#SMCI
> SMCI SEES 2Q NET SALES $19.5B TO $21.5B, EST.
> $16.53B
> $SMCI
#SMCI
119
·
--
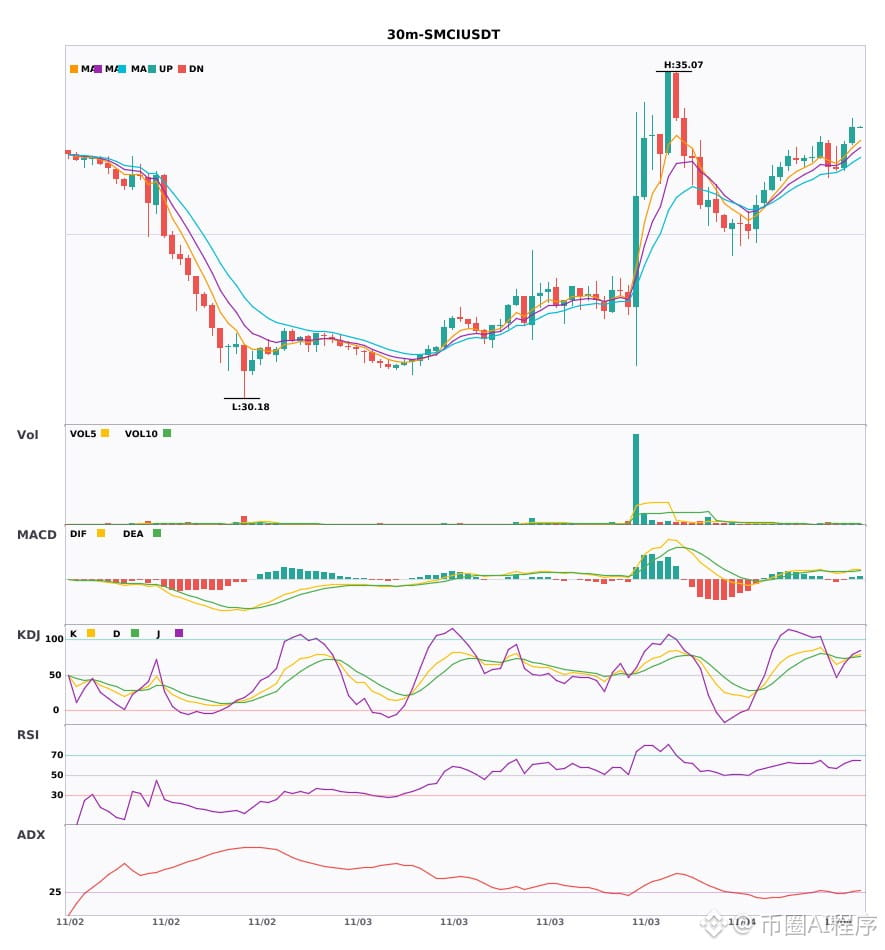
$SMCI 30-minute multi-timeframe resonance, 4-hour bullish trend confirmed🔥
════════════════════
🔴 $SMCI 30-minute bullish signal
⚠️Technical analysis: 4-hour bullish confluence confirmed | 30-minute entry: MACD golden cross above zero, bullish momentum released | EMA5 > EMA8 > EMA13, bullish alignment | KDJ golden cross, short-term outlook bullish (K: 75.4, D: 74.0) | Normal volume (1.3x)
════════════════════
🔔 Follow for first-hand market updates 🔔
#多周期共振 #SMCI
📌 When trading, pay attention to whether the candlestick pattern confirms the setup
$SMCI 30-minute multi-timeframe resonance, 4-hour bullish trend confirmed🔥
════════════════════
🔴 $SMCI 30-minute bullish signal
⚠️Technical analysis: 4-hour bullish confluence confirmed | 30-minute entry: MACD golden cross above zero, bullish momentum released | EMA5 > EMA8 > EMA13, bullish alignment | KDJ golden cross, short-term outlook bullish (K: 75.4, D: 74.0) | Normal volume (1.3x)
════════════════════
🔔 Follow for first-hand market updates 🔔
#多周期共振 #SMCI
📌 When trading, pay attention to whether the candlestick pattern confirms the setup
════════════════════
🔴 $SMCI 30-minute bullish signal
⚠️Technical analysis: 4-hour bullish confluence confirmed | 30-minute entry: MACD golden cross above zero, bullish momentum released | EMA5 > EMA8 > EMA13, bullish alignment | KDJ golden cross, short-term outlook bullish (K: 75.4, D: 74.0) | Normal volume (1.3x)
════════════════════
🔔 Follow for first-hand market updates 🔔
#多周期共振 #SMCI
📌 When trading, pay attention to whether the candlestick pattern confirms the setup
14
·
--
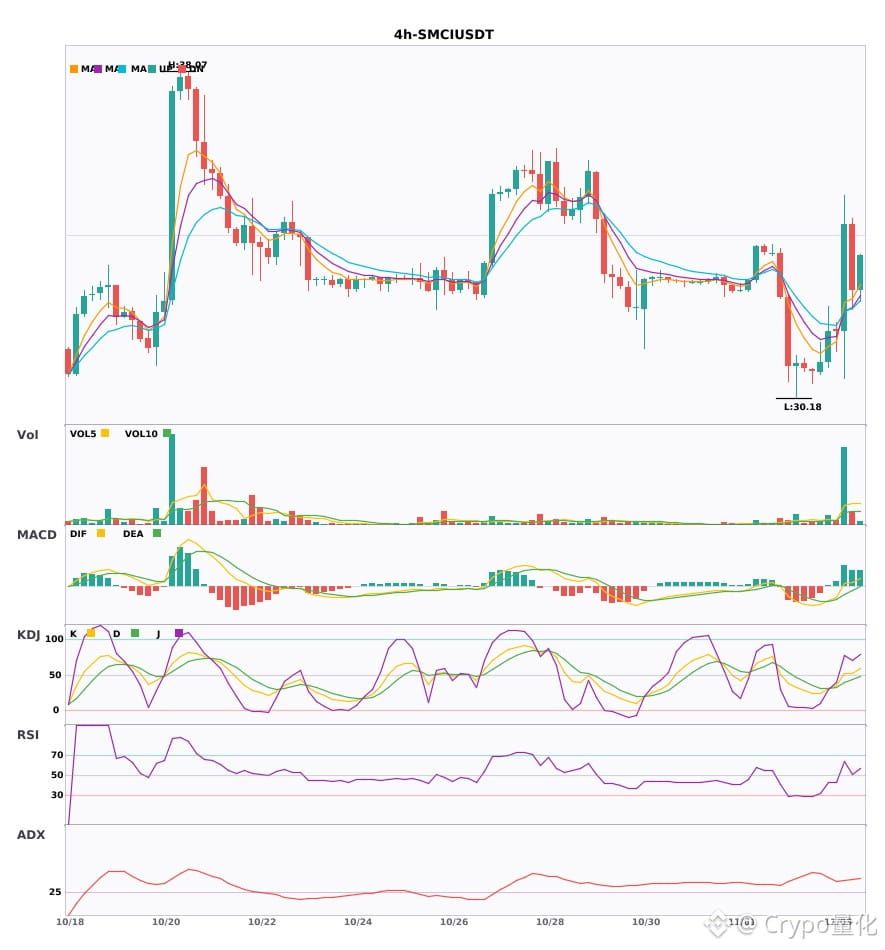
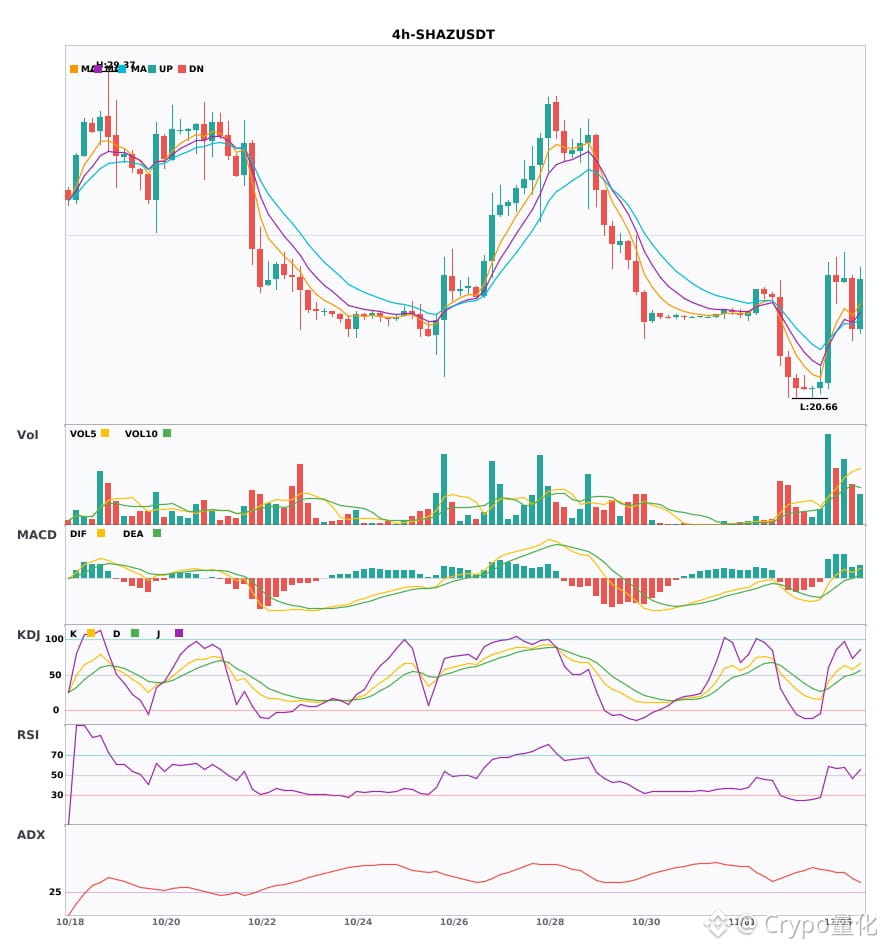
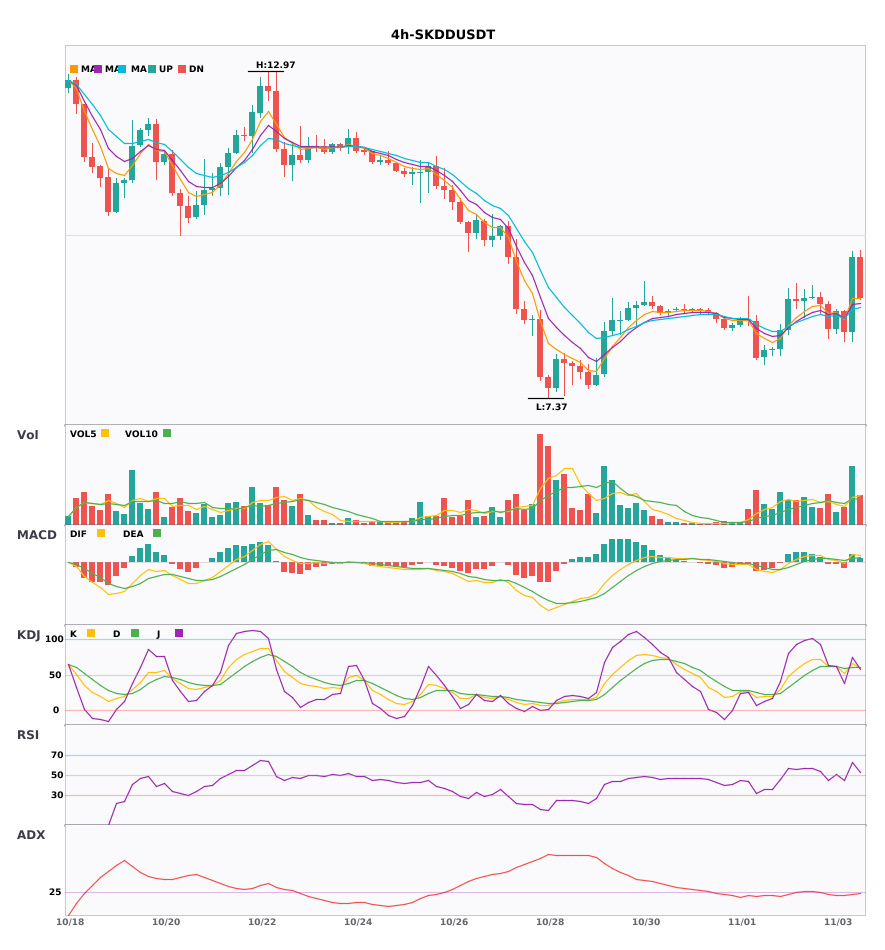
Three 4-hour bullish signals appeared simultaneously: $SMCI / $SHAZ / $SKDD🔥
════════════════════
🔴 $SMCI 4-hour bullish signal
⚠️Technical analysis: ADX(41) indicates a clear trend | MACD is bullish, with a strong trend but weakening momentum | EMA5 > EMA8 > EMA13, bullish alignment | Volume surge (6.3x)
════════════════════
🔴 $SHAZ 4-hour bullish signal
⚠️Technical analysis: ADX(50) indicates a very strong trend (watch out for an overheated pullback) | MACD is bullish, with a strong trend but weakening momentum | EMA5 > EMA8 > EMA13, bullish alignment | Increased volume (1.9x)
════════════════════
🔴 $SKDD 4-hour bullish signal
⚠️Technical analysis: ADX(26) indicates a trend is forming; entry is possible | MACD bullish crossover above zero, bullish momentum emerging | EMA5 crossed above EMA8, turning bullish in the short term | KDJ bullish crossover, short-term outlook bullish (K: 65.8, D: 61.1) | Increased volume (2.2x)
════════════════════
🔔 Follow us for first-hand market alerts 🔔
#技术分析 #SMCI #SHAZ #SKDD
📌 When trading, pay attention to whether the candlestick patterns align
Three 4-hour bullish signals appeared simultaneously: $SMCI / $SHAZ / $SKDD 🔥
════════════════════
🔴 $SMCI 4-hour bullish signal
⚠️Technical analysis: ADX(41) indicates a clear trend | MACD is bullish, with a strong trend but weakening momentum | EMA5 > EMA8 > EMA13, bullish alignment | Volume surge (6.3x)
════════════════════
🔴 $SHAZ 4-hour bullish signal
⚠️Technical analysis: ADX(50) indicates a very strong trend (watch out for an overheated pullback) | MACD is bullish, with a strong trend but weakening momentum | EMA5 > EMA8 > EMA13, bullish alignment | Increased volume (1.9x)
════════════════════
🔴 $SKDD 4-hour bullish signal
⚠️Technical analysis: ADX(26) indicates a trend is forming; entry is possible | MACD bullish crossover above zero, bullish momentum emerging | EMA5 crossed above EMA8, turning bullish in the short term | KDJ bullish crossover, short-term outlook bullish (K: 65.8, D: 61.1) | Increased volume (2.2x)
════════════════════
🔔 Follow us for first-hand market alerts 🔔
#技术分析 #SMCI #SHAZ #SKDD
📌 When trading, pay attention to whether the candlestick patterns align
════════════════════
🔴 $SMCI 4-hour bullish signal
⚠️Technical analysis: ADX(41) indicates a clear trend | MACD is bullish, with a strong trend but weakening momentum | EMA5 > EMA8 > EMA13, bullish alignment | Volume surge (6.3x)
════════════════════
🔴 $SHAZ 4-hour bullish signal
⚠️Technical analysis: ADX(50) indicates a very strong trend (watch out for an overheated pullback) | MACD is bullish, with a strong trend but weakening momentum | EMA5 > EMA8 > EMA13, bullish alignment | Increased volume (1.9x)
════════════════════
🔴 $SKDD 4-hour bullish signal
⚠️Technical analysis: ADX(26) indicates a trend is forming; entry is possible | MACD bullish crossover above zero, bullish momentum emerging | EMA5 crossed above EMA8, turning bullish in the short term | KDJ bullish crossover, short-term outlook bullish (K: 65.8, D: 61.1) | Increased volume (2.2x)
════════════════════
🔔 Follow us for first-hand market alerts 🔔
#技术分析 #SMCI #SHAZ #SKDD
📌 When trading, pay attention to whether the candlestick patterns align
4
·
--
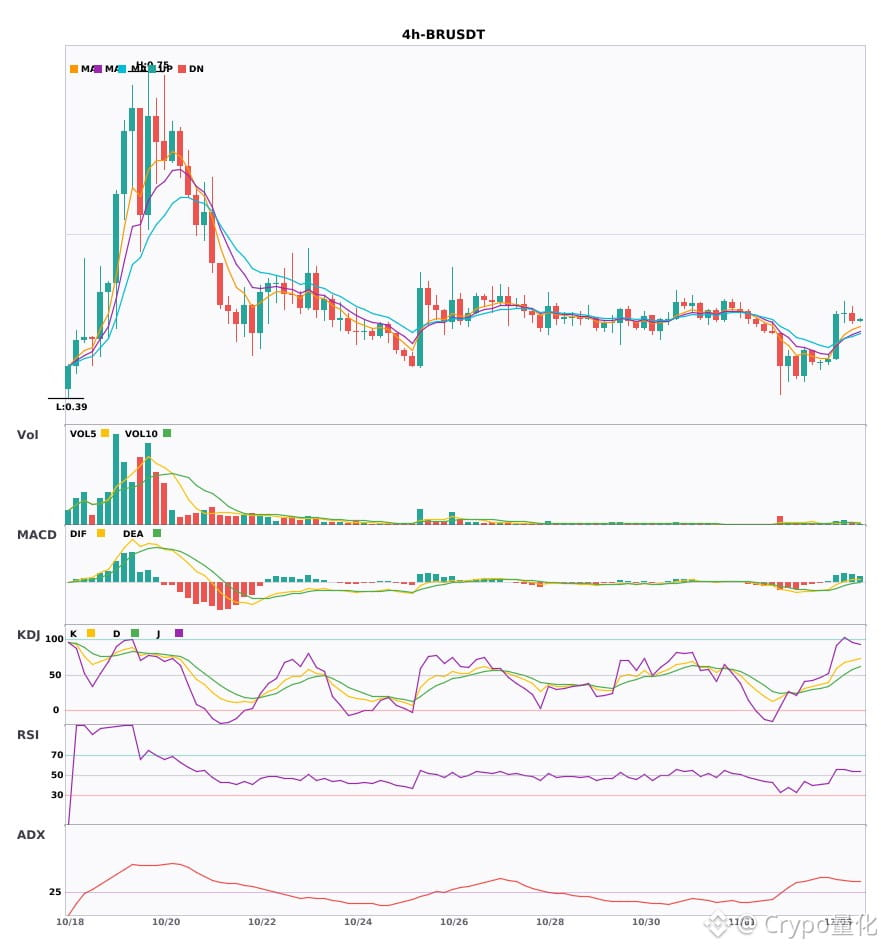
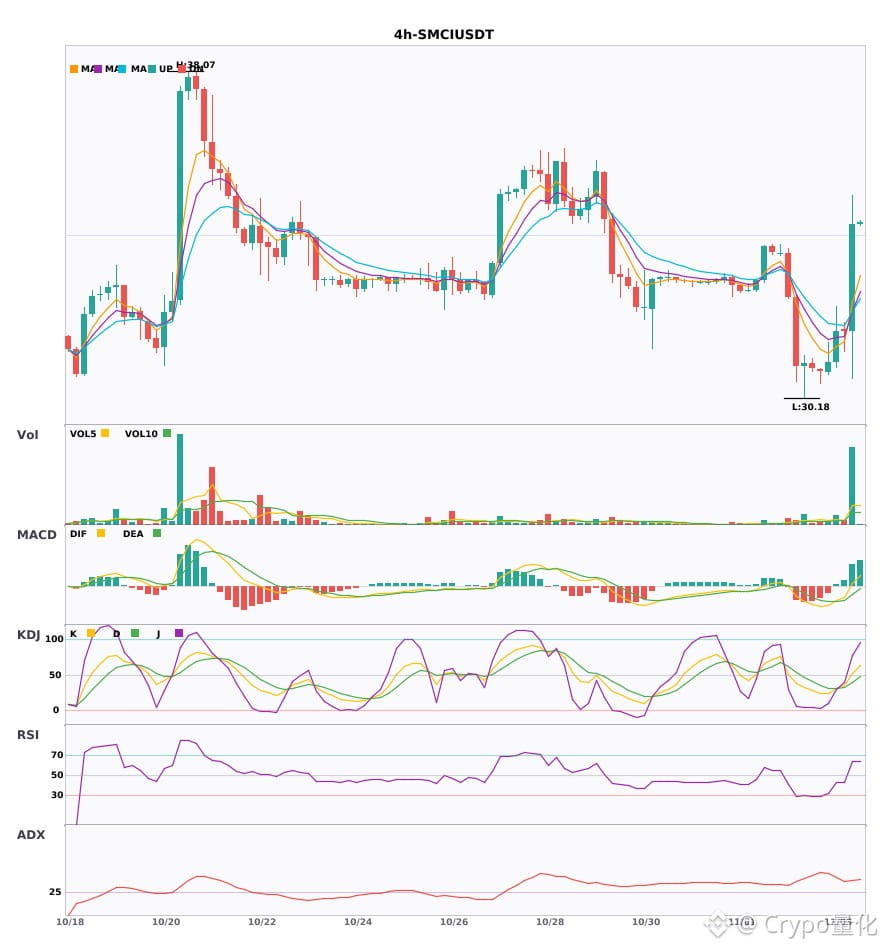
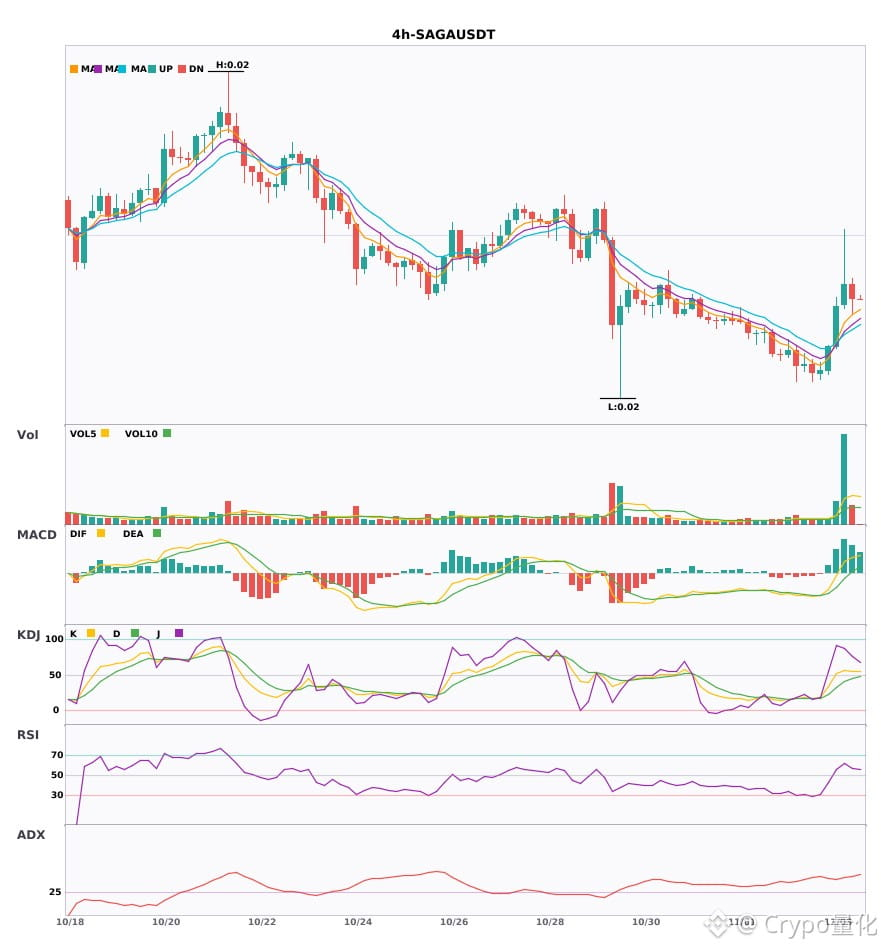
$BR / $SMCI / $SAGA 4-hour resonance turns bullish, with bullish signals appearing simultaneously🔥
════════════════════
🔴 $BR 4-hour bullish signal
⚠️Technical analysis: ADX(42) indicates a clear trending market | MACD is bullish, the trend is relatively strong, but momentum is weakening | EMA5 > EMA8 > EMA13, bullish alignment | KDJ is strong, with bulls in control (K is 70.3, D is 57.4) | Volume increased (1.8x)
════════════════════
🔴 $SMCI 4-hour bullish signal
⚠️Technical analysis: ADX(40) indicates a clear trending market | MACD DIF broke above the zero line, signaling a bullish trend reversal | EMA5 crossed above EMA8, signaling a short-term bullish turn | Volume surged (6.3x)
════════════════════
🔴 $SAGA 4-hour bullish signal
⚠️Technical analysis: ADX(44) indicates a clear trending market | MACD DIF broke above the zero line, signaling a bullish trend reversal | EMA5 > EMA8 > EMA13, bullish alignment | Volume surged (5.6x)
════════════════════
🔔 Follow for first-hand market alerts 🔔
#技术分析 #BR #SMCI #SAGA
📌 When trading, pay attention to whether the candlestick pattern matches
$BR / $SMCI / $SAGA 4-hour resonance turns bullish, with bullish signals appearing simultaneously🔥
════════════════════
🔴 $BR 4-hour bullish signal
⚠️Technical analysis: ADX(42) indicates a clear trending market | MACD is bullish, the trend is relatively strong, but momentum is weakening | EMA5 > EMA8 > EMA13, bullish alignment | KDJ is strong, with bulls in control (K is 70.3, D is 57.4) | Volume increased (1.8x)
════════════════════
🔴 $SMCI 4-hour bullish signal
⚠️Technical analysis: ADX(40) indicates a clear trending market | MACD DIF broke above the zero line, signaling a bullish trend reversal | EMA5 crossed above EMA8, signaling a short-term bullish turn | Volume surged (6.3x)
════════════════════
🔴 $SAGA 4-hour bullish signal
⚠️Technical analysis: ADX(44) indicates a clear trending market | MACD DIF broke above the zero line, signaling a bullish trend reversal | EMA5 > EMA8 > EMA13, bullish alignment | Volume surged (5.6x)
════════════════════
🔔 Follow for first-hand market alerts 🔔
#技术分析 #BR #SMCI #SAGA
📌 When trading, pay attention to whether the candlestick pattern matches
════════════════════
🔴 $BR 4-hour bullish signal
⚠️Technical analysis: ADX(42) indicates a clear trending market | MACD is bullish, the trend is relatively strong, but momentum is weakening | EMA5 > EMA8 > EMA13, bullish alignment | KDJ is strong, with bulls in control (K is 70.3, D is 57.4) | Volume increased (1.8x)
════════════════════
🔴 $SMCI 4-hour bullish signal
⚠️Technical analysis: ADX(40) indicates a clear trending market | MACD DIF broke above the zero line, signaling a bullish trend reversal | EMA5 crossed above EMA8, signaling a short-term bullish turn | Volume surged (6.3x)
════════════════════
🔴 $SAGA 4-hour bullish signal
⚠️Technical analysis: ADX(44) indicates a clear trending market | MACD DIF broke above the zero line, signaling a bullish trend reversal | EMA5 > EMA8 > EMA13, bullish alignment | Volume surged (5.6x)
════════════════════
🔔 Follow for first-hand market alerts 🔔
#技术分析 #BR #SMCI #SAGA
📌 When trading, pay attention to whether the candlestick pattern matches
65




·
--
🦈 $SMCI INFRASTRUCTURE DIVERGENCE SIGNALS MASSIVE INSTITUTIONAL LIQUIDITY DISLOCATION! ⚡
🔍 We are observing an extreme divergence between physical AI infrastructure procurement and public market valuation. While physical deployment demand through related supply chains continues to accelerate, high-beta data center colocation names have dropped sharply into deep discount territory.
💡 This price dislocation mirrors classic historical structural re-accumulations like the post-shock discount cycles. Institutional footprints often form during these deep mispricings before the macro narrative re-aligns with corporate earnings. 💬 Are you treating this compression as smart money absorption or waiting for post-earnings confirmation? 👇
⚠️ Not financial advice. Always manage your risk. 🛡️
🏷️ #SMCI #AIInfrastructure #SmartMoney #MarketStructure #Crypto
🎯 🦈
🦈 $SMCI INFRASTRUCTURE DIVERGENCE SIGNALS MASSIVE INSTITUTIONAL LIQUIDITY DISLOCATION! ⚡
🔍 We are observing an extreme divergence between physical AI infrastructure procurement and public market valuation. While physical deployment demand through related supply chains continues to accelerate, high-beta data center colocation names have dropped sharply into deep discount territory.
💡 This price dislocation mirrors classic historical structural re-accumulations like the post-shock discount cycles. Institutional footprints often form during these deep mispricings before the macro narrative re-aligns with corporate earnings. 💬 Are you treating this compression as smart money absorption or waiting for post-earnings confirmation? 👇
⚠️ Not financial advice. Always manage your risk. 🛡️
🏷️ #SMCI #AIInfrastructure #SmartMoney #MarketStructure #Crypto
🎯 🦈
🔍 We are observing an extreme divergence between physical AI infrastructure procurement and public market valuation. While physical deployment demand through related supply chains continues to accelerate, high-beta data center colocation names have dropped sharply into deep discount territory.
💡 This price dislocation mirrors classic historical structural re-accumulations like the post-shock discount cycles. Institutional footprints often form during these deep mispricings before the macro narrative re-aligns with corporate earnings. 💬 Are you treating this compression as smart money absorption or waiting for post-earnings confirmation? 👇
⚠️ Not financial advice. Always manage your risk. 🛡️
🏷️ #SMCI #AIInfrastructure #SmartMoney #MarketStructure #Crypto
🎯 🦈
4

·
--
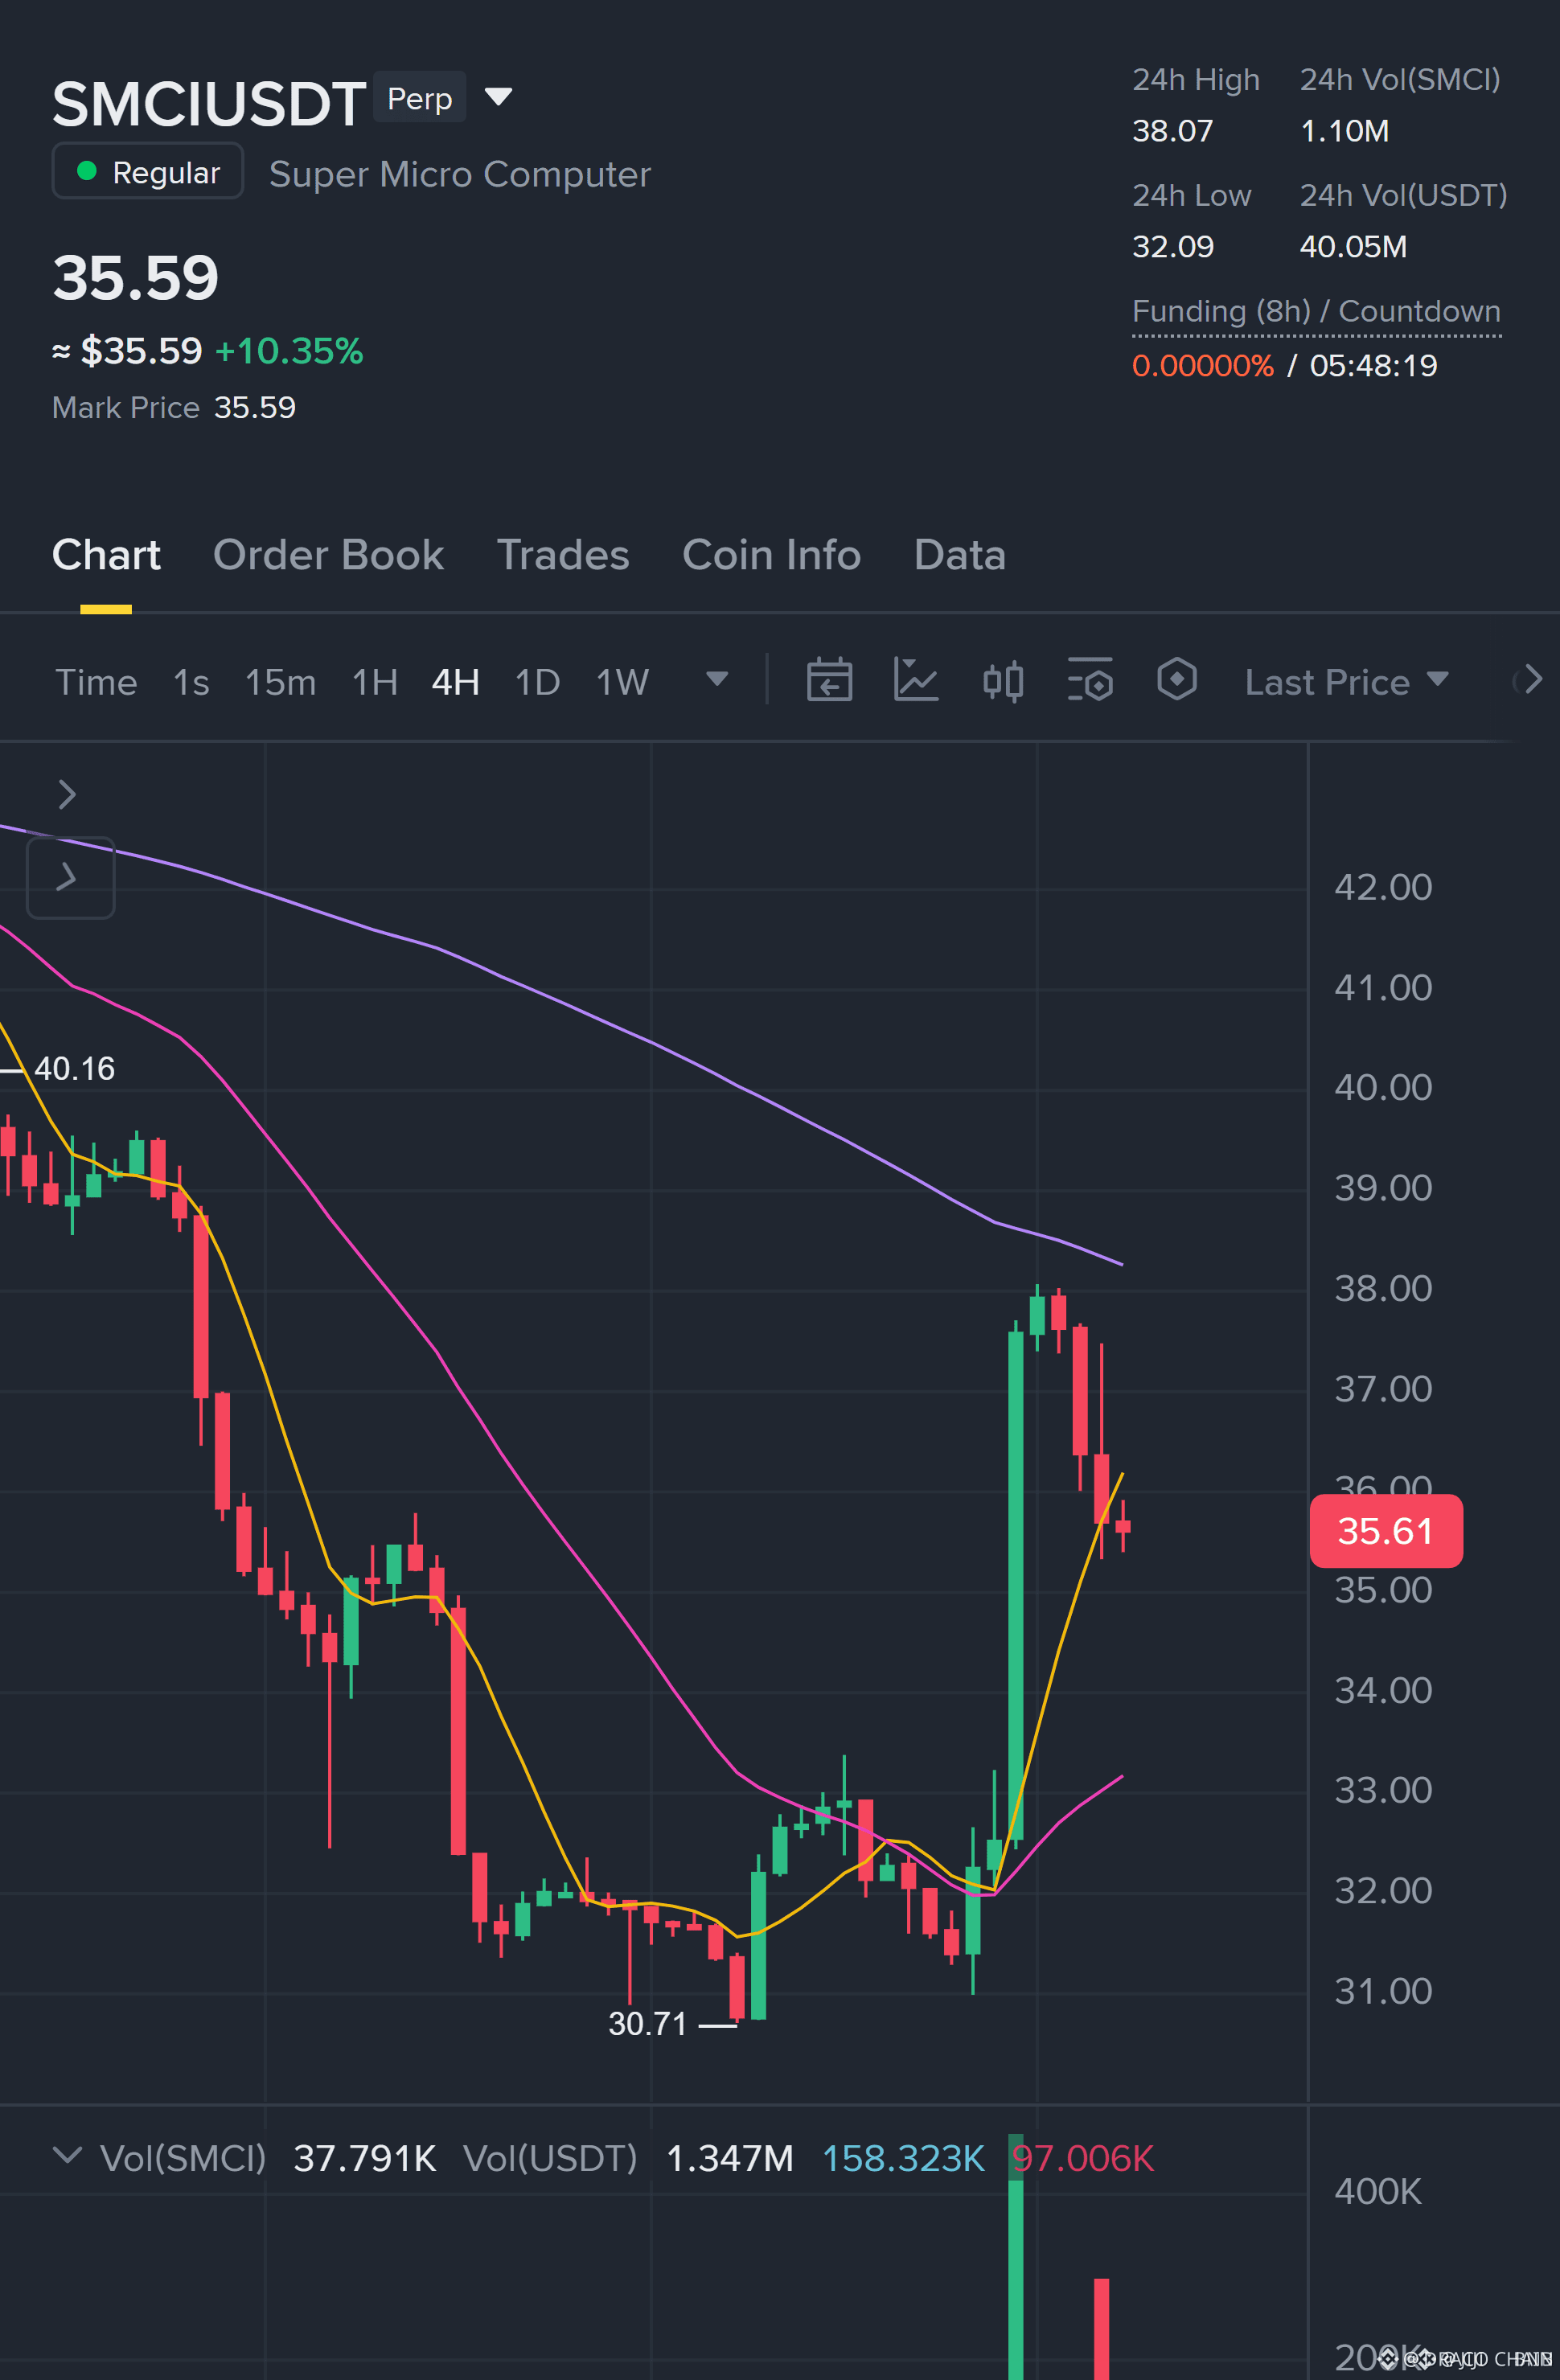
🚨 $SMCI 1H PULLBACK TO LIQUIDITY ZONE – BULLISH REENTRY 💥
Entry: 35.32-35.48 ⚡
Target: 37.48 🚀
Target: 38.07 🎯
Target: 38.56 💥
Stop Loss: 34.72 ⚠️
📊 The 1‑hour pullback is carving into a pristine order‑block that smart money used to soak up excess supply. 🦈 Even though the 15‑minute confirmation remains pending, the macro bullish trend still frames the zone as a prime accumulation point.
⚡ With R‑multiples topping 3.9 on TP2, the risk‑reward profile screams asymmetric upside, especially when scaling out 20‑30‑50% at each target. 📈 The setup stays on the watchlist until the lower‑timeframe validation aligns.
⚠️ Not financial advice. Always manage your risk. 🛡️
🏷️ #SMCI #LongSetup #Pullback #SmartMoney #Crypto
🚀 🦈
🚨 $SMCI 1H PULLBACK TO LIQUIDITY ZONE – BULLISH REENTRY 💥
Entry: 35.32-35.48 ⚡
Target: 37.48 🚀
Target: 38.07 🎯
Target: 38.56 💥
Stop Loss: 34.72 ⚠️
📊 The 1‑hour pullback is carving into a pristine order‑block that smart money used to soak up excess supply. 🦈 Even though the 15‑minute confirmation remains pending, the macro bullish trend still frames the zone as a prime accumulation point.
⚡ With R‑multiples topping 3.9 on TP2, the risk‑reward profile screams asymmetric upside, especially when scaling out 20‑30‑50% at each target. 📈 The setup stays on the watchlist until the lower‑timeframe validation aligns.
⚠️ Not financial advice. Always manage your risk. 🛡️
🏷️ #SMCI #LongSetup #Pullback #SmartMoney #Crypto
🚀 🦈
Entry: 35.32-35.48 ⚡
Target: 37.48 🚀
Target: 38.07 🎯
Target: 38.56 💥
Stop Loss: 34.72 ⚠️
📊 The 1‑hour pullback is carving into a pristine order‑block that smart money used to soak up excess supply. 🦈 Even though the 15‑minute confirmation remains pending, the macro bullish trend still frames the zone as a prime accumulation point.
⚡ With R‑multiples topping 3.9 on TP2, the risk‑reward profile screams asymmetric upside, especially when scaling out 20‑30‑50% at each target. 📈 The setup stays on the watchlist until the lower‑timeframe validation aligns.
⚠️ Not financial advice. Always manage your risk. 🛡️
🏷️ #SMCI #LongSetup #Pullback #SmartMoney #Crypto
🚀 🦈
12

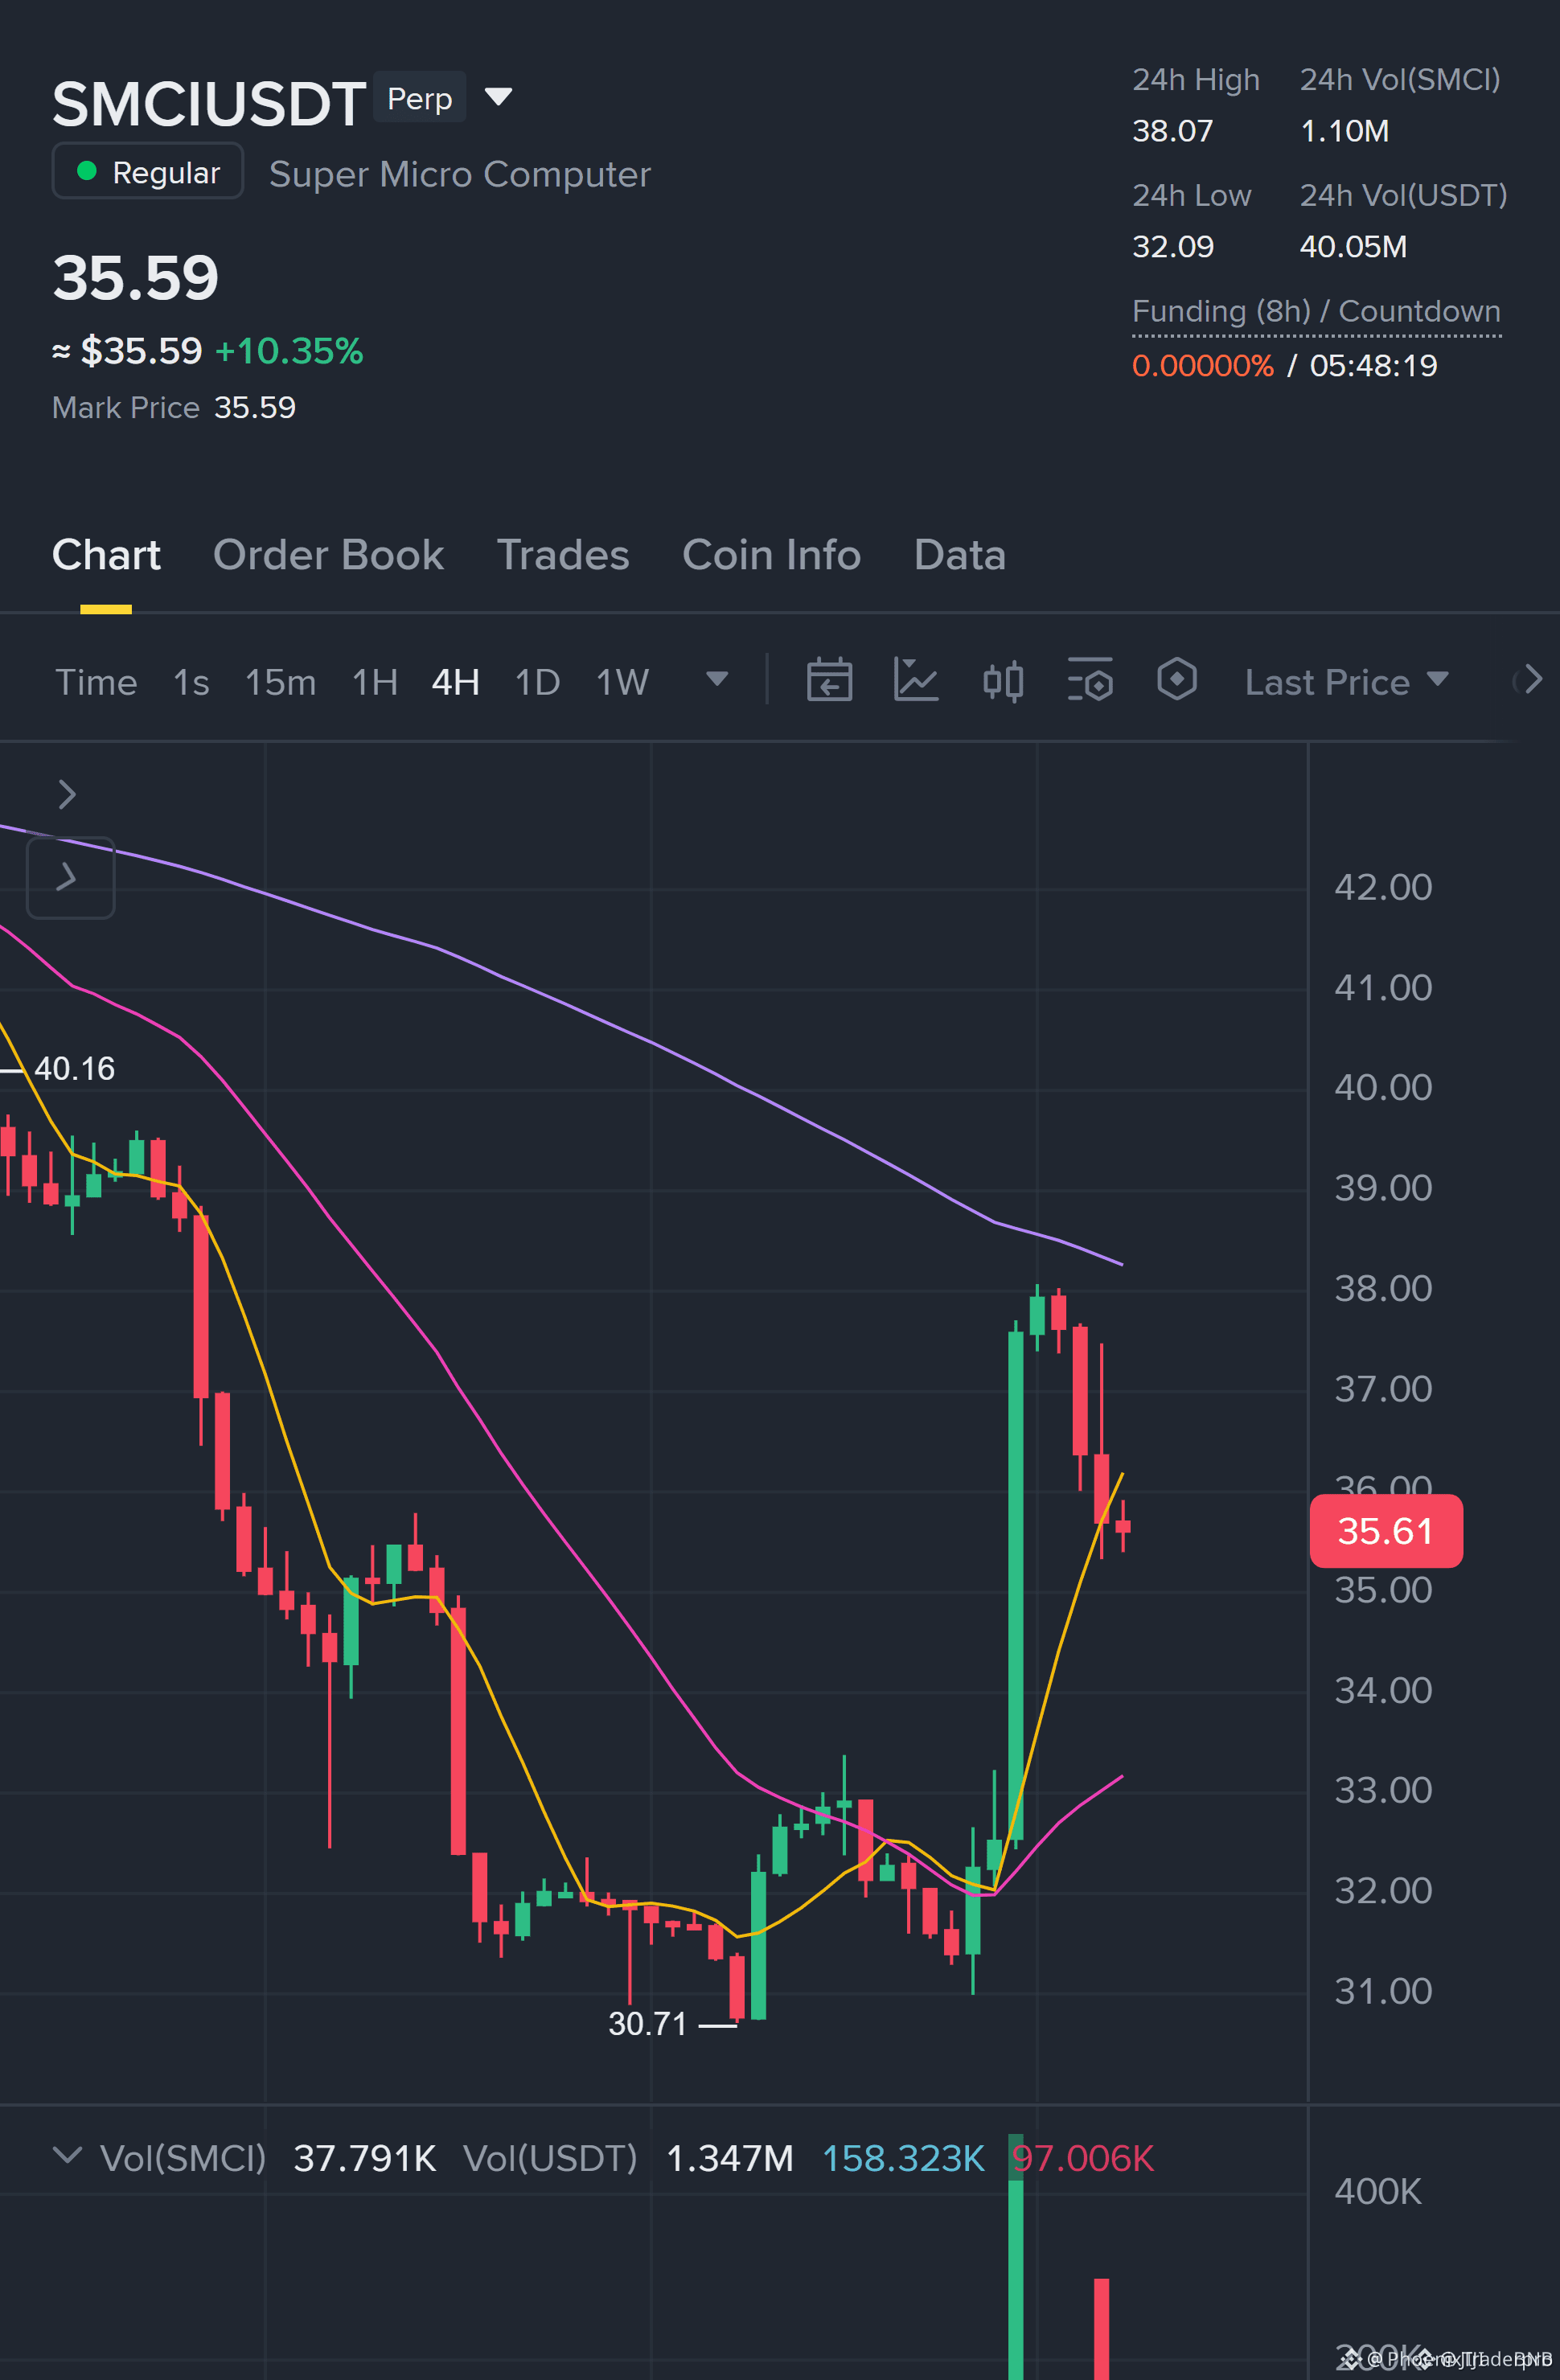
🚀 $SMCI PREPARES FOR A 4X RALLY ON 1H PULLBACK 🦈
Entry: 35.32‑35.48 ⚡
Target: 37.48 🚀
Target: 38.07 🚀
Target: 38.56 🚀
Stop Loss: 34.72 ⚠️
📊 The 1H chart is screaming bullish as price tests a tight demand zone, while smart‑money whales are sweeping liquidity at the lower edge. ⚡ Volume spikes hint at a rapid flip, and the higher timeframes keep the trend intact. 🌊 Still, the 15M candle hasn’t sealed the entry, so I’m keeping this on the watchlist until the final confirmation lights up. 💡
💬 Are you ready to scale in once the 15‑minute candle validates the breakout? 👇
⚠️ Not financial advice. Always manage your risk. 🛡️
🏷️ #SMCI #LongSetup #Bullish #Crypto
🔥 🚀
🚀 $SMCI PREPARES FOR A 4X RALLY ON 1H PULLBACK 🦈
Entry: 35.32‑35.48 ⚡
Target: 37.48 🚀
Target: 38.07 🚀
Target: 38.56 🚀
Stop Loss: 34.72 ⚠️
📊 The 1H chart is screaming bullish as price tests a tight demand zone, while smart‑money whales are sweeping liquidity at the lower edge. ⚡ Volume spikes hint at a rapid flip, and the higher timeframes keep the trend intact. 🌊 Still, the 15M candle hasn’t sealed the entry, so I’m keeping this on the watchlist until the final confirmation lights up. 💡
💬 Are you ready to scale in once the 15‑minute candle validates the breakout? 👇
⚠️ Not financial advice. Always manage your risk. 🛡️
🏷️ #SMCI #LongSetup #Bullish #Crypto
🔥 🚀
Entry: 35.32‑35.48 ⚡
Target: 37.48 🚀
Target: 38.07 🚀
Target: 38.56 🚀
Stop Loss: 34.72 ⚠️
📊 The 1H chart is screaming bullish as price tests a tight demand zone, while smart‑money whales are sweeping liquidity at the lower edge. ⚡ Volume spikes hint at a rapid flip, and the higher timeframes keep the trend intact. 🌊 Still, the 15M candle hasn’t sealed the entry, so I’m keeping this on the watchlist until the final confirmation lights up. 💡
💬 Are you ready to scale in once the 15‑minute candle validates the breakout? 👇
⚠️ Not financial advice. Always manage your risk. 🛡️
🏷️ #SMCI #LongSetup #Bullish #Crypto
🔥 🚀
5

·
--
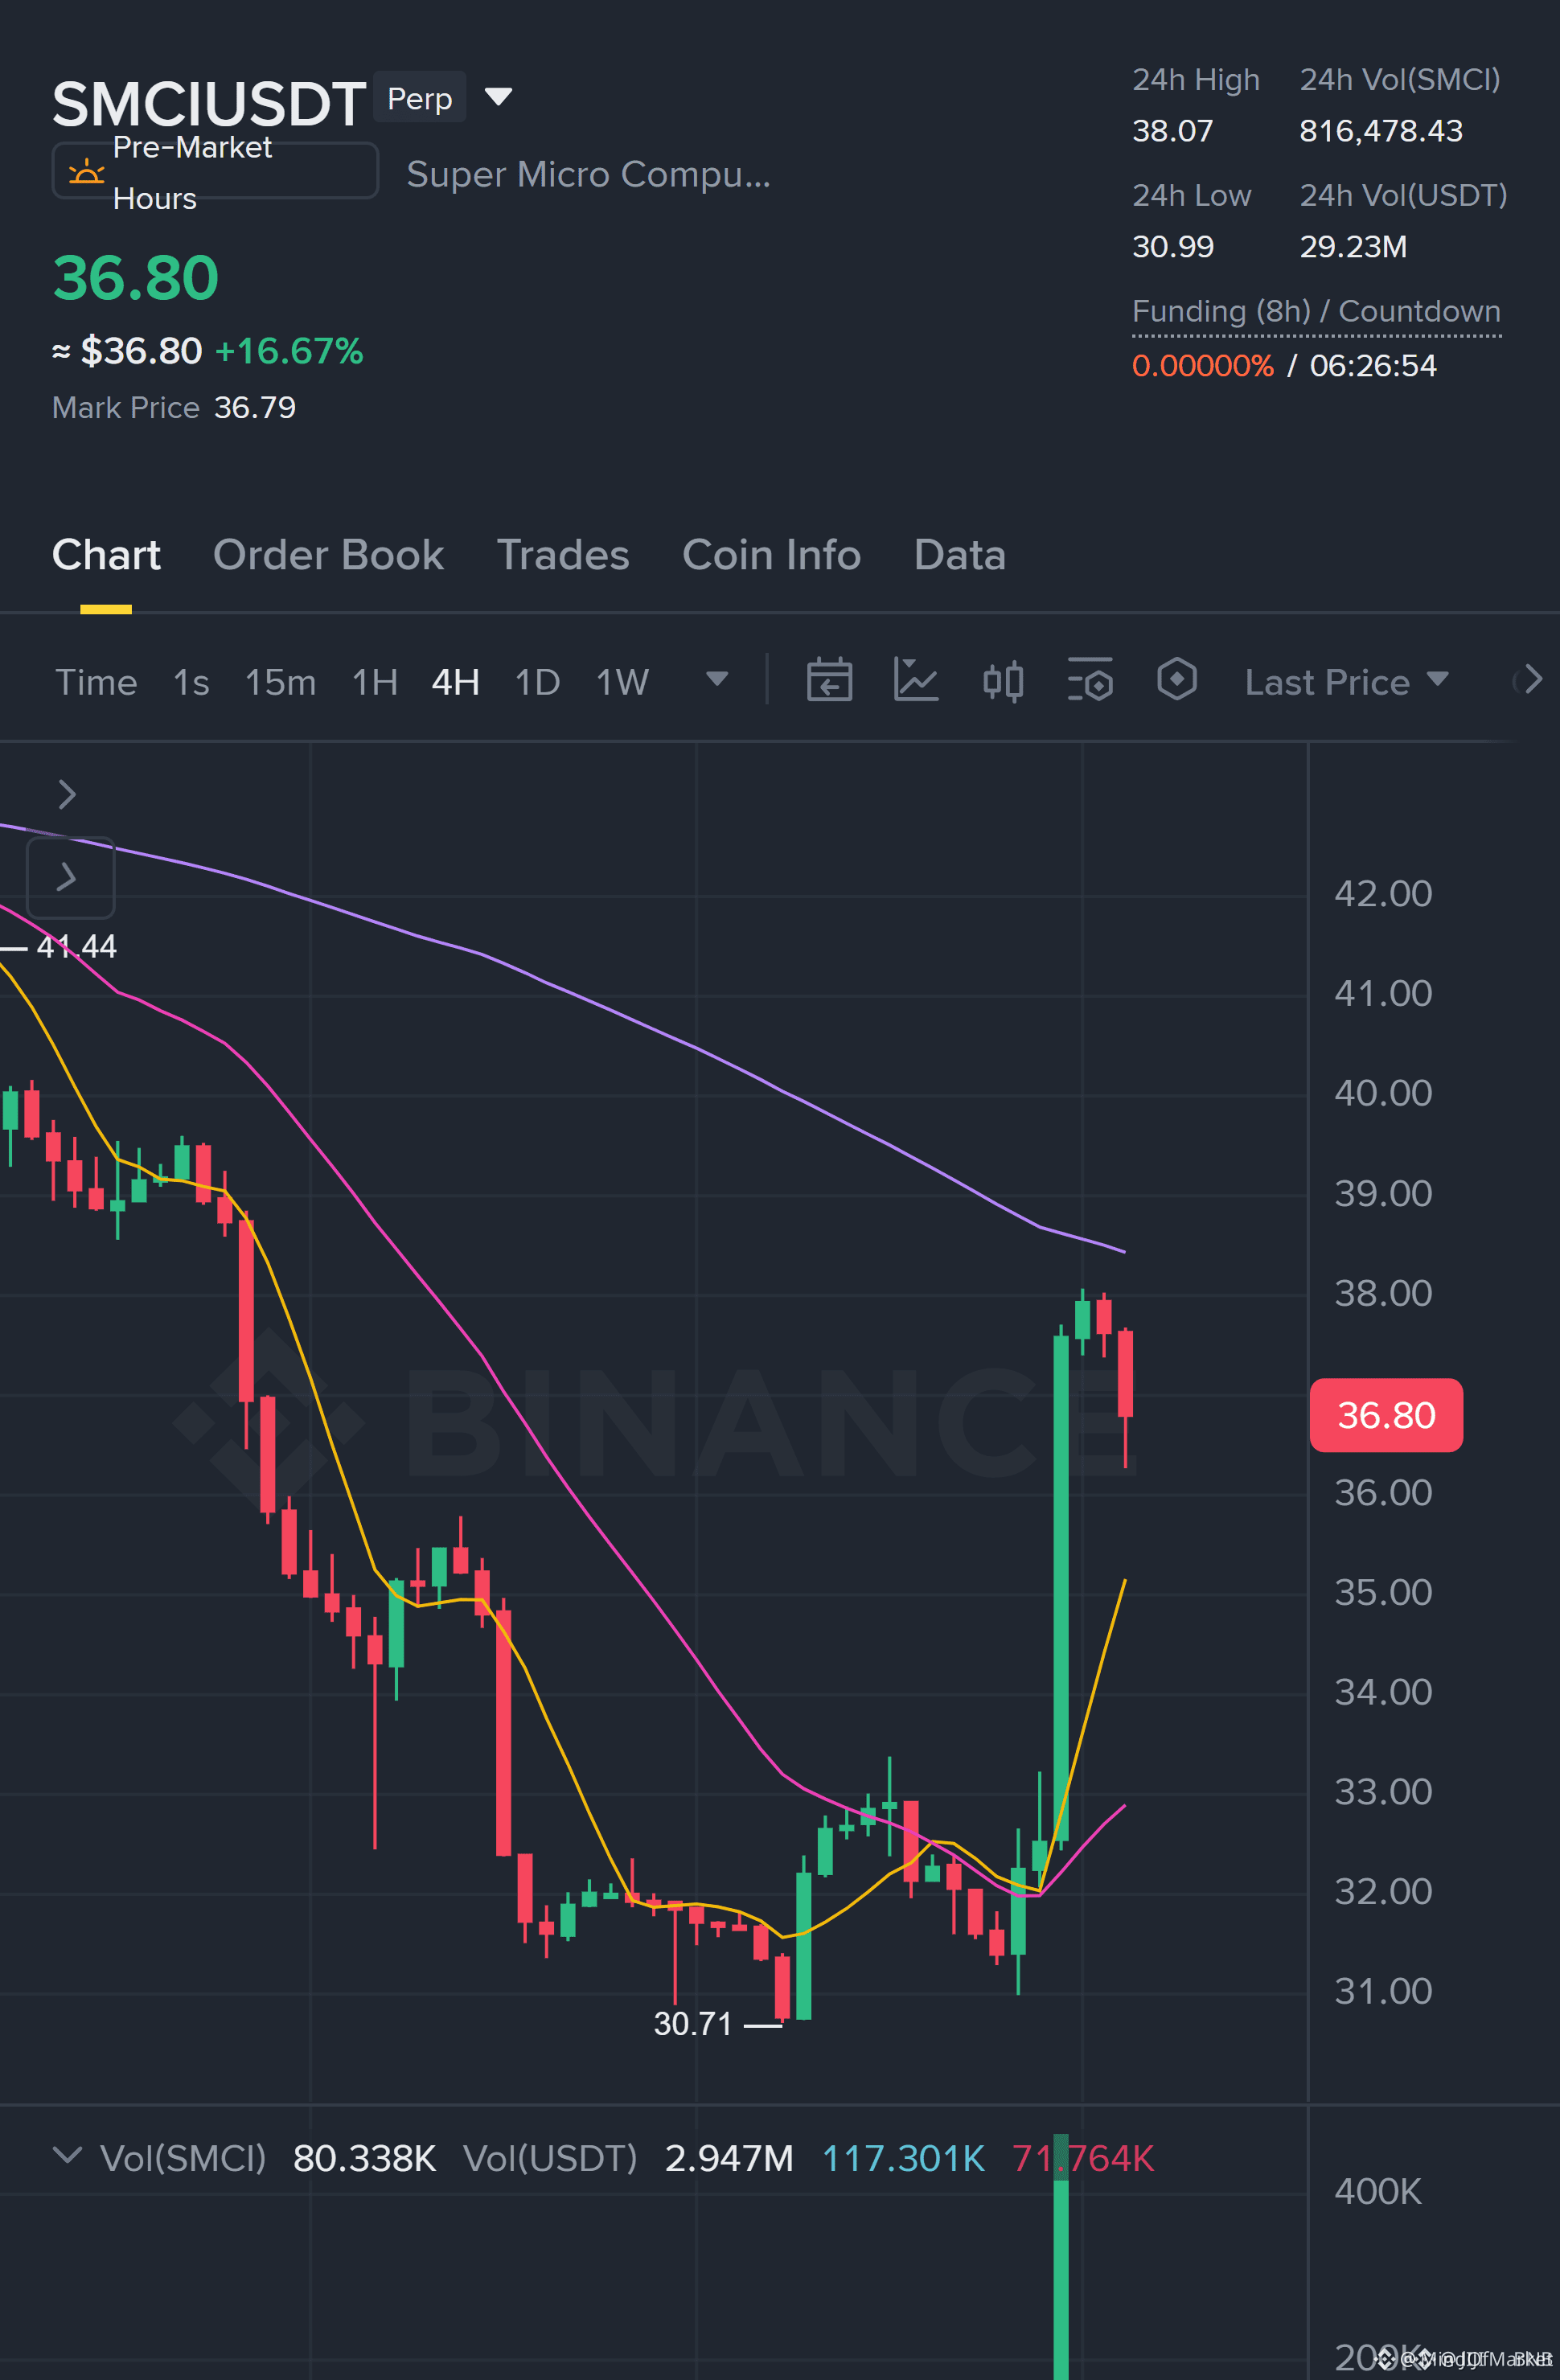
🦈 $SMCI LIQUIDITY POOL IN SIGHT AS INTRADAY RETRACEMENT OFFERS CONTINUATION SETUP! 📈
Entry: 36.75–36.86 ⚡
Target: 38.03 / 38.46 / 38.89 🎯
Stop Loss: 36.18 🛑
📌 Price is delivering an orderly 1H retracement right into institutional demand between 36.75 and 36.86, setting up clean expansion paths toward higher liquidity targets up to 38.89.
🔍 However, structure demands discipline: 15-minute execution confirmation remains incomplete, keeping this strictly on the watchlist until smart money validates absorption. 💬 Are you front-running this order block or waiting for the lower timeframe reclaim? 👇
⚠️ Not financial advice. Always manage your risk. 🛡️
🏷️ #SMCI #PriceAction #SmartMoneyConcepts #TradingSetup #Crypto
🎯 🦈
🦈 $SMCI LIQUIDITY POOL IN SIGHT AS INTRADAY RETRACEMENT OFFERS CONTINUATION SETUP! 📈
Entry: 36.75–36.86 ⚡
Target: 38.03 / 38.46 / 38.89 🎯
Stop Loss: 36.18 🛑
📌 Price is delivering an orderly 1H retracement right into institutional demand between 36.75 and 36.86, setting up clean expansion paths toward higher liquidity targets up to 38.89.
🔍 However, structure demands discipline: 15-minute execution confirmation remains incomplete, keeping this strictly on the watchlist until smart money validates absorption. 💬 Are you front-running this order block or waiting for the lower timeframe reclaim? 👇
⚠️ Not financial advice. Always manage your risk. 🛡️
🏷️ #SMCI #PriceAction #SmartMoneyConcepts #TradingSetup #Crypto
🎯 🦈
Entry: 36.75–36.86 ⚡
Target: 38.03 / 38.46 / 38.89 🎯
Stop Loss: 36.18 🛑
📌 Price is delivering an orderly 1H retracement right into institutional demand between 36.75 and 36.86, setting up clean expansion paths toward higher liquidity targets up to 38.89.
🔍 However, structure demands discipline: 15-minute execution confirmation remains incomplete, keeping this strictly on the watchlist until smart money validates absorption. 💬 Are you front-running this order block or waiting for the lower timeframe reclaim? 👇
⚠️ Not financial advice. Always manage your risk. 🛡️
🏷️ #SMCI #PriceAction #SmartMoneyConcepts #TradingSetup #Crypto
🎯 🦈
19
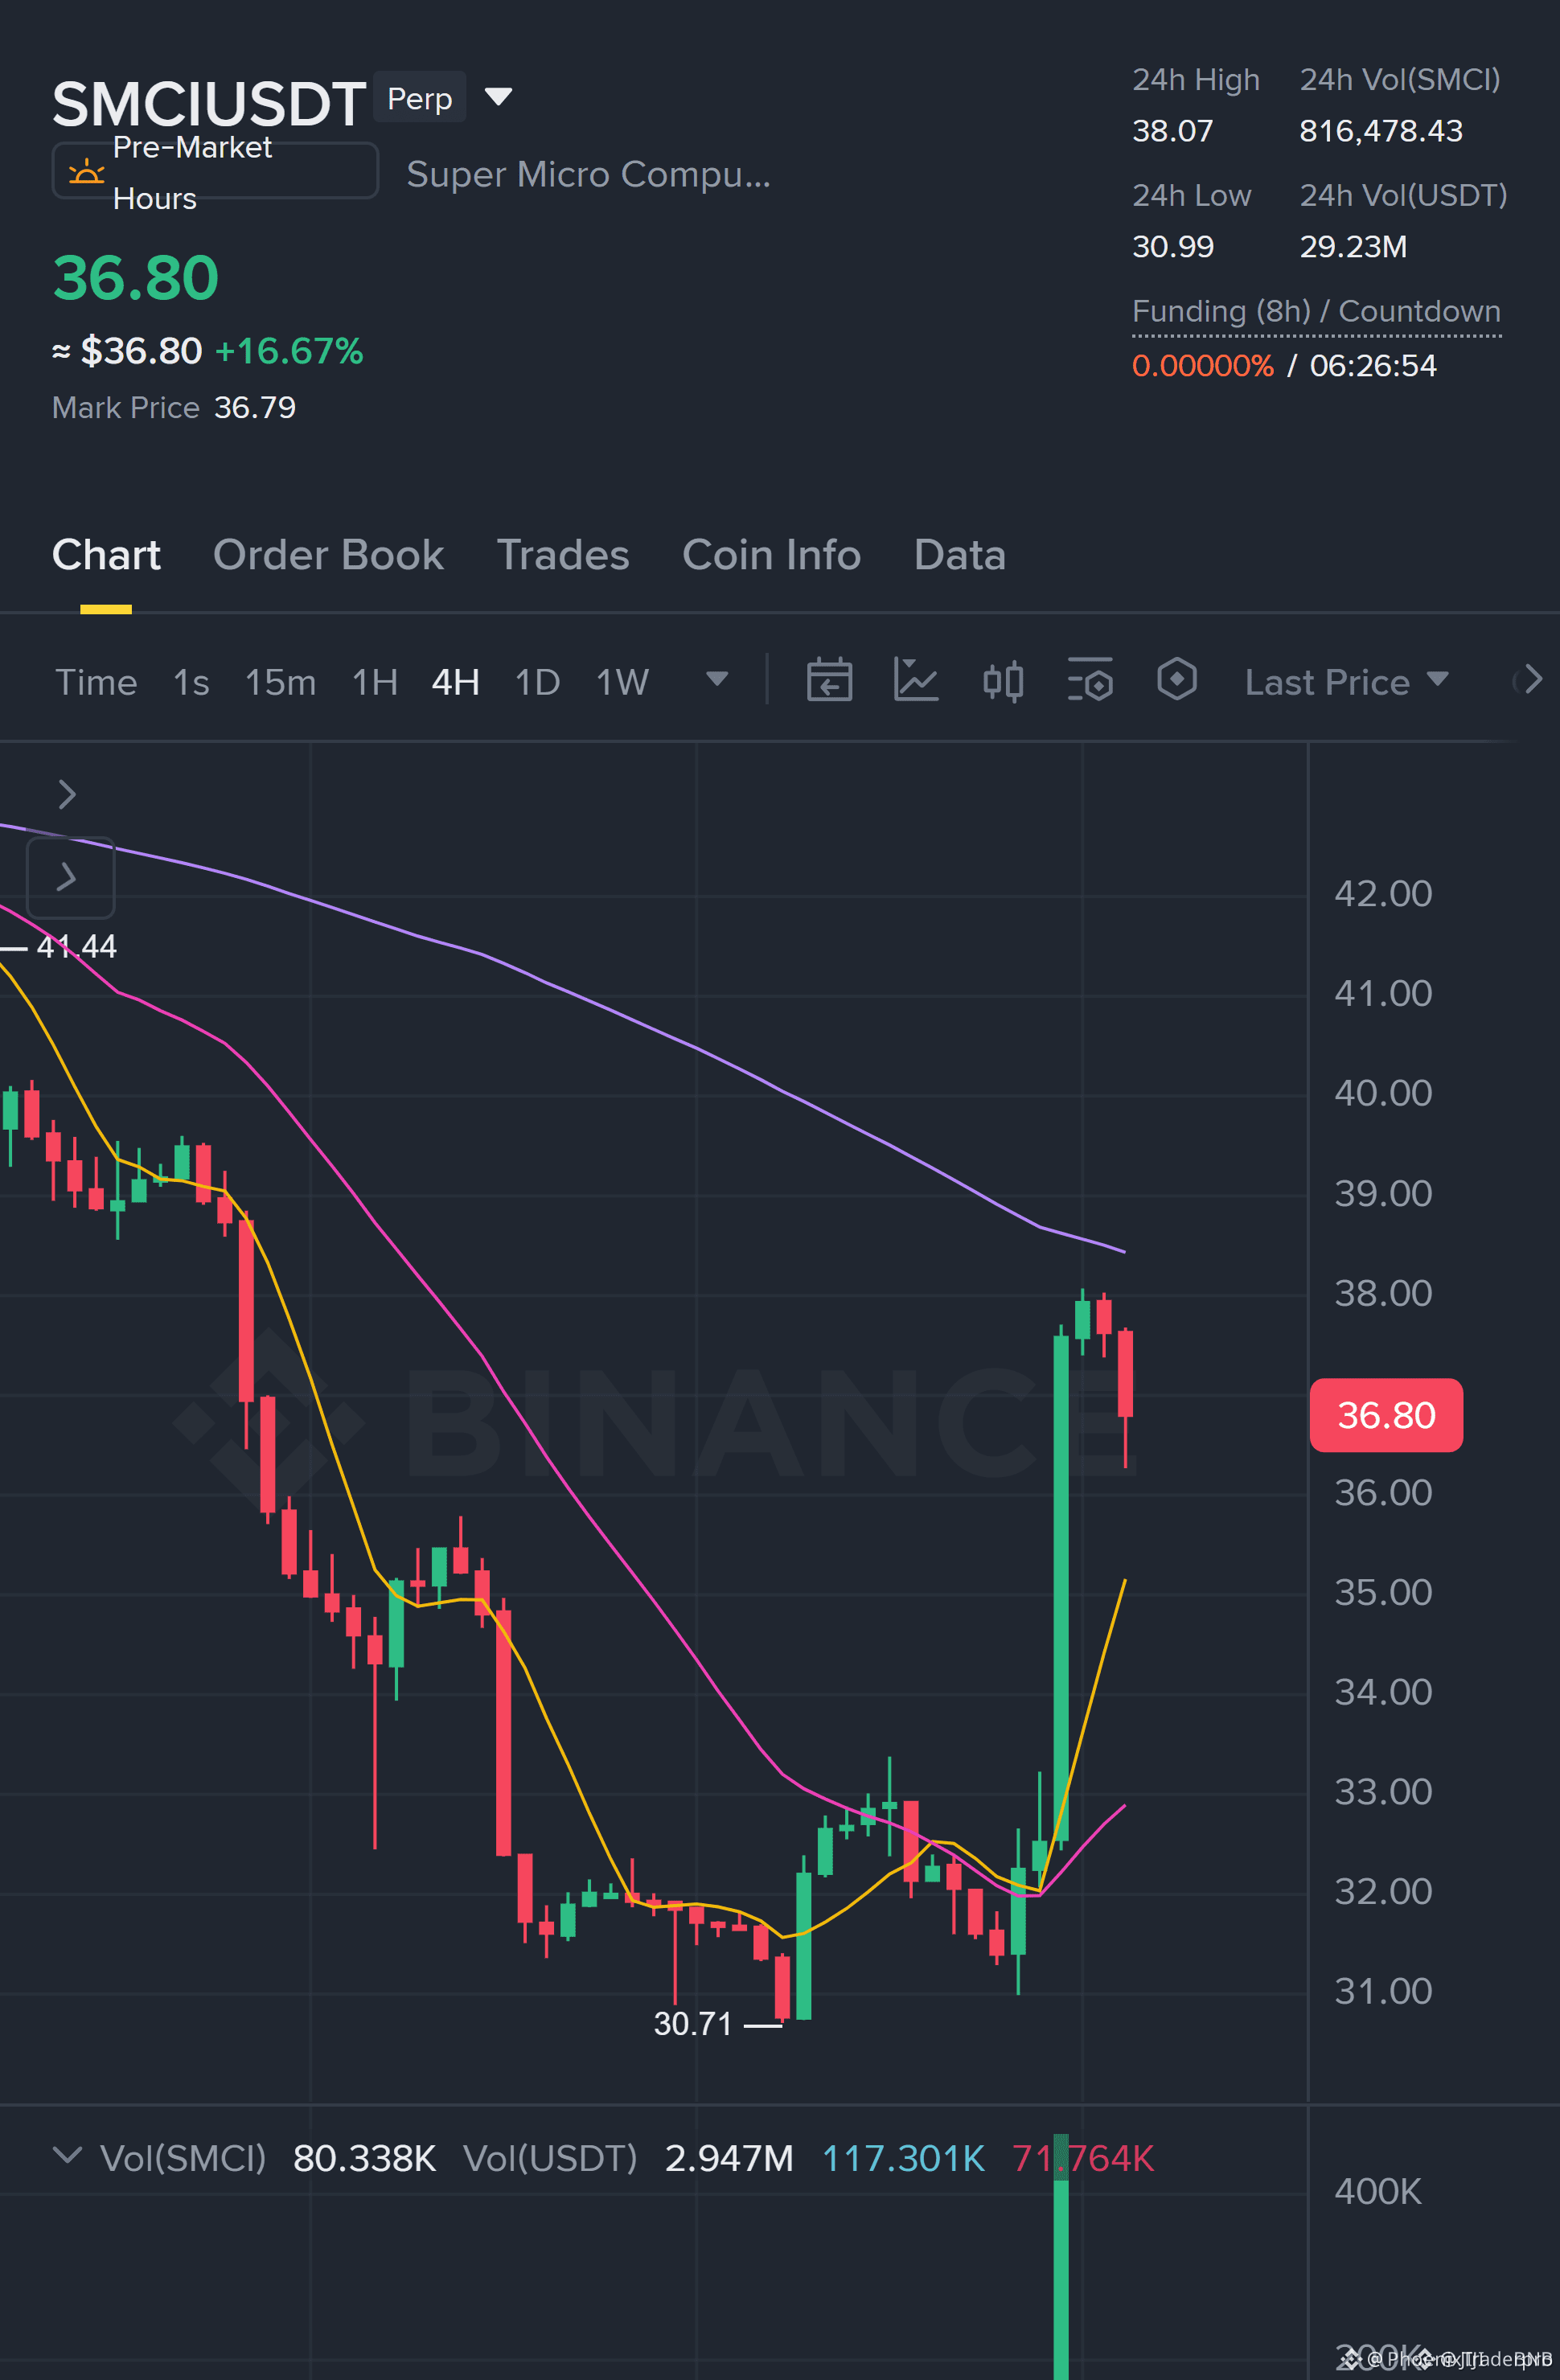
⚡ $SMCI PULLBACK PINPOINTS A HIGH-REWARD CONTINUATION POCKET ON THE 1H CHART! 🎯
Entry: 36.75–36.86 ⚡
Target: 38.03, 38.46, 38.89 🚀
Stop Loss: 36.18 ⚠️
📌 Price is carving out a clean retracement right into the 36.75–36.86 demand pocket, teeing up an asymmetrical trend continuation toward 38.89. 💡 However, the 15M trigger confirmation remains incomplete, keeping this locked on high-priority radar until the tape validates real buyer absorption.
🔍 Patience is the real edge here—front-running an unconfirmed pivot carries friction when the edge demands ironclad execution. 💬 Are you front-running this bid zone or waiting for the 15M candle close to confirm the reclaim? 👇
⚠️ Not financial advice. Always manage your risk. 🛡️
🏷️ #SMCI #LongSetup #TradingSignals #PriceAction
🎯 ⚡
⚡ $SMCI PULLBACK PINPOINTS A HIGH-REWARD CONTINUATION POCKET ON THE 1H CHART! 🎯
Entry: 36.75–36.86 ⚡
Target: 38.03, 38.46, 38.89 🚀
Stop Loss: 36.18 ⚠️
📌 Price is carving out a clean retracement right into the 36.75–36.86 demand pocket, teeing up an asymmetrical trend continuation toward 38.89. 💡 However, the 15M trigger confirmation remains incomplete, keeping this locked on high-priority radar until the tape validates real buyer absorption.
🔍 Patience is the real edge here—front-running an unconfirmed pivot carries friction when the edge demands ironclad execution. 💬 Are you front-running this bid zone or waiting for the 15M candle close to confirm the reclaim? 👇
⚠️ Not financial advice. Always manage your risk. 🛡️
🏷️ #SMCI #LongSetup #TradingSignals #PriceAction
🎯 ⚡
Entry: 36.75–36.86 ⚡
Target: 38.03, 38.46, 38.89 🚀
Stop Loss: 36.18 ⚠️
📌 Price is carving out a clean retracement right into the 36.75–36.86 demand pocket, teeing up an asymmetrical trend continuation toward 38.89. 💡 However, the 15M trigger confirmation remains incomplete, keeping this locked on high-priority radar until the tape validates real buyer absorption.
🔍 Patience is the real edge here—front-running an unconfirmed pivot carries friction when the edge demands ironclad execution. 💬 Are you front-running this bid zone or waiting for the 15M candle close to confirm the reclaim? 👇
⚠️ Not financial advice. Always manage your risk. 🛡️
🏷️ #SMCI #LongSetup #TradingSignals #PriceAction
🎯 ⚡
13
Log in to explore more content
Join global crypto users on Binance Square
⚡️ Get latest and useful information about crypto.
💬 Trusted by the world’s largest crypto exchange.
👍 Discover real insights from verified creators.
Email / Phone number
Trending Topics
1
#HuangRisksOusterOverReportedAffairWithSubordinate
30,239 views
481 Discussing
2
#AnthropicRejectsIPODelayValuationinQuestion
474,813 views
3,930 Discussing
3
#CoreWeaveJumps10%On168%RevenueGrowth
66,985 views
889 Discussing
4
#ZcashFallsBelow$1000ForFirstTimeSinceSeptember
38,269 views
187 Discussing
5
#MSCIRemovalMayCurbStrategy’sBitcoinBuying
1,855 views
57 Discussing
6
#CanNvidiaEarningsEaseMarketConcerns?
178,665 views
1,828 Discussing
7
#SouthKoreaToLetExchangesSuspendWithdrawalsOnSuspectedHacks
86 views
1 Discussing
8
#PythAddsNYSERealTimeDataToMarketplace
1,172 views
46 Discussing
9
#SolanaCompanyReports$3.4MQ3Revenue
970 views
22 Discussing
10
#tZEROWinsCFTCApprovalForRegulatedDerivativesExchange
720 views
12 Discussing