
#26
26
7,668 views
86 Discussing
Hot
Latest

$HOOD I’m more inclined to be bullish, and I also feel this isn’t the kind of stock that just runs hot for a day or two and then goes nowhere.
When I look at a company like this, my first reaction isn’t to ask how much it’s up today.
First, I check which track or sector it’s in.
From what I understand, $HOOD is roughly still focused on the retail trading entry point—benefiting from the way ordinary people migrate their habits of participating in stocks, options, and crypto trading.
Once these platforms truly manage to build user habits, the stickiness is often not low.
Your account is here, your money is here, and your trading actions are here. Cutting over to another platform sounds easy on the surface, but in reality, not that many people actually do it.
The market price action also gives me some confidence.
It’s currently $106.23, the 24-hour high is $106.25, and the low is $100.82—basically it was pressured during the daytime, then it pushed back.
That kind of movement makes me want to take a closer look.
It’s not a hot-blast,爽文-style surge. It’s a move where someone is willing to buy when it dips.
Looking at the activity levels too: on Binance, in the U.S. stock perpetuals, it ranks #24 on the gainers list, #26 on the trading volume list, with $27.26M USDT in 24-hour volume.
This suggests it’s not ignored—it's just not hot enough yet that everyone is shouting about it.
Honestly, I prefer this kind of state.
I’ve lost too much on stocks that were too crowded.
There’s one more detail I can’t completely ignore.
The funding rate is +0.0354%, not exaggerated, and the open interest is 113,733 contracts.
This feels a bit like when people are starting to lean toward the long side, but they haven’t leaned so far that it’s really scorching.
When I traded futures in those years, the thing I feared most was a position where, at a glance, it seems like everyone in the world believes it’s going to keep charging.
With this level of crowding, at least it hasn’t given me chills.
Of course, being bullish doesn’t mean you can just close your eyes and go up.
This kind of trade is very dependent on market sentiment. If trading heat fades, or if the overall market direction turns, then things with higher elasticity can snap back quickly too.
For my own part, I would treat it as something “worth continuously watching,” not as an impulse trade you chase on the spur of the moment.
If you ask me what my attitude is right now, I’m willing to keep standing on the bullish side and watching it.
If I really decide to act, I’d be more willing to wait for an opportunity after a pullback—I don’t want to reach in at the peak of the hottest emotion.
That’s my take. Your money is your decision. $HOOD #美股
When I look at a company like this, my first reaction isn’t to ask how much it’s up today.
First, I check which track or sector it’s in.
From what I understand, $HOOD is roughly still focused on the retail trading entry point—benefiting from the way ordinary people migrate their habits of participating in stocks, options, and crypto trading.
Once these platforms truly manage to build user habits, the stickiness is often not low.
Your account is here, your money is here, and your trading actions are here. Cutting over to another platform sounds easy on the surface, but in reality, not that many people actually do it.
The market price action also gives me some confidence.
It’s currently $106.23, the 24-hour high is $106.25, and the low is $100.82—basically it was pressured during the daytime, then it pushed back.
That kind of movement makes me want to take a closer look.
It’s not a hot-blast,爽文-style surge. It’s a move where someone is willing to buy when it dips.
Looking at the activity levels too: on Binance, in the U.S. stock perpetuals, it ranks #24 on the gainers list, #26 on the trading volume list, with $27.26M USDT in 24-hour volume.
This suggests it’s not ignored—it's just not hot enough yet that everyone is shouting about it.
Honestly, I prefer this kind of state.
I’ve lost too much on stocks that were too crowded.
There’s one more detail I can’t completely ignore.
The funding rate is +0.0354%, not exaggerated, and the open interest is 113,733 contracts.
This feels a bit like when people are starting to lean toward the long side, but they haven’t leaned so far that it’s really scorching.
When I traded futures in those years, the thing I feared most was a position where, at a glance, it seems like everyone in the world believes it’s going to keep charging.
With this level of crowding, at least it hasn’t given me chills.
Of course, being bullish doesn’t mean you can just close your eyes and go up.
This kind of trade is very dependent on market sentiment. If trading heat fades, or if the overall market direction turns, then things with higher elasticity can snap back quickly too.
For my own part, I would treat it as something “worth continuously watching,” not as an impulse trade you chase on the spur of the moment.
If you ask me what my attitude is right now, I’m willing to keep standing on the bullish side and watching it.
If I really decide to act, I’d be more willing to wait for an opportunity after a pullback—I don’t want to reach in at the peak of the hottest emotion.
That’s my take. Your money is your decision. $HOOD #美股

See translation
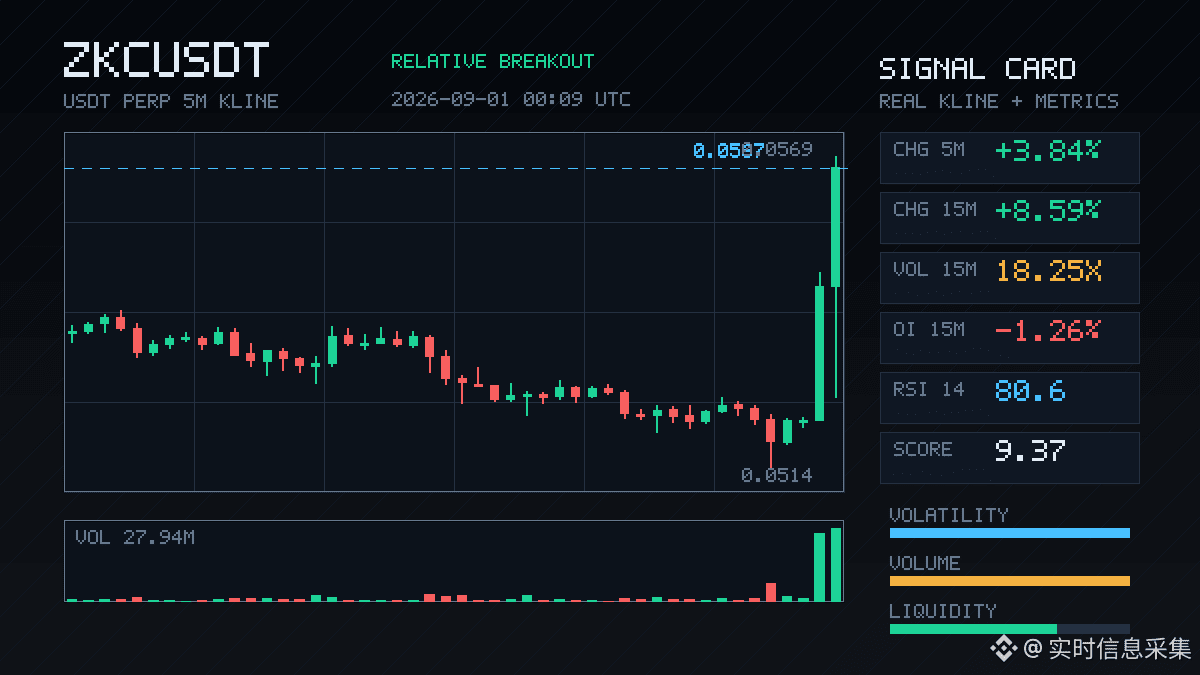
$ZKC 这波15分钟直接拉了8.59%,量能放到18倍,价格突破近20根5分钟K线的高点,但OI却在下降——空头回补的味道很浓,不是新多头进场。
名义变化冲到全池#26,异常分位86%,这个深度确认没什么好挑的。主动成交差7.5%,买盘略占优,但更关键的是合约持仓在跌,说明这波更多是仓位挤压而非趋势启动。
1小时OI也降了3.64%,短期追高风险不小。如果要介入,得盯着回踩确认,别盲目追突破。
名义变化冲到全池#26,异常分位86%,这个深度确认没什么好挑的。主动成交差7.5%,买盘略占优,但更关键的是合约持仓在跌,说明这波更多是仓位挤压而非趋势启动。
1小时OI也降了3.64%,短期追高风险不小。如果要介入,得盯着回踩确认,别盲目追突破。

$HEMI Today’s price action has one detail worth discussing carefully
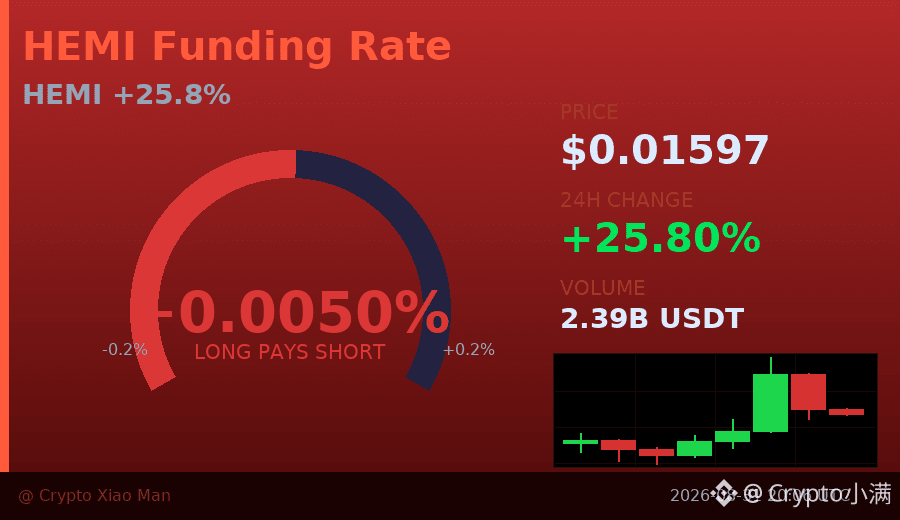
In the past 24 hours, it’s up nearly 26%—and that’s already a significant move. But what’s even more interesting is the structure of the last two candlesticks—
The first six candlesticks had a good match between price and volume, especially the sixth: the price surged to a high of 0.01766, while trading volume exploded to about 1.1 billion. This suggests that at the time, a large amount of capital was chasing the breakout and buying.
But immediately after that, the next two candlesticks show the price quickly dropping from 0.01715 down to the current 0.01597, and the trading volume shrank dramatically, to only around 30 million.
So what does this indicate? It means those who bought at the top are now trapped above. The candlestick that spiked higher attracted many people to chase in, but after that, fewer and fewer buyers kept stepping in—so the price couldn’t hold up and started moving downward.
Let’s also look at the long/short ratio: 44% long vs 56% short. Right now, there are actually more shorts—which implies that some people have already bet that this rally is over, and have started flipping to bet on a drop.
From the current perspective, the 0.015 level is a key point. If the subsequent volume doesn’t show any clear rebound, the price may continue drifting toward that area.
If you’re a short-term participant, I would pay close attention to whether trading volume can expand again around the current price. If volume doesn’t come back, people who bought at higher levels may exit at any time to cut losses.
$HEMI #暴涨后缩量 #26%
Click the small card below to quickly check the market trend👇
In the past 24 hours, it’s up nearly 26%—and that’s already a significant move. But what’s even more interesting is the structure of the last two candlesticks—
The first six candlesticks had a good match between price and volume, especially the sixth: the price surged to a high of 0.01766, while trading volume exploded to about 1.1 billion. This suggests that at the time, a large amount of capital was chasing the breakout and buying.
But immediately after that, the next two candlesticks show the price quickly dropping from 0.01715 down to the current 0.01597, and the trading volume shrank dramatically, to only around 30 million.
So what does this indicate? It means those who bought at the top are now trapped above. The candlestick that spiked higher attracted many people to chase in, but after that, fewer and fewer buyers kept stepping in—so the price couldn’t hold up and started moving downward.
Let’s also look at the long/short ratio: 44% long vs 56% short. Right now, there are actually more shorts—which implies that some people have already bet that this rally is over, and have started flipping to bet on a drop.
From the current perspective, the 0.015 level is a key point. If the subsequent volume doesn’t show any clear rebound, the price may continue drifting toward that area.
If you’re a short-term participant, I would pay close attention to whether trading volume can expand again around the current price. If volume doesn’t come back, people who bought at higher levels may exit at any time to cut losses.
$HEMI #暴涨后缩量 #26%
Click the small card below to quickly check the market trend👇

$BLESS This drop has gotten a little “serious.”
In just 15 minutes, it broke through the lower bound of the range covered by nearly 20 five-minute candlesticks. Trading volume expanded to 1.55x, and the volatility Z-score surged to 2.5—this isn’t the kind of slow, grinding bearish move that wears you down. What’s even more worth noting is that while the price is moving down, OI is still rising slightly; yet the contract notional changes are seeing a large outflow. Plainly put, it looks more like newly added leveraged shorts are entering and smashing the market, rather than just retail panic selling.
Aggressive trade delta is down 32.4%, the buy/sell ratio is 0.51—shorts are indeed driving the tempo. In the past 24 hours there’s also $26 million in trading value, meaning liquidity hasn’t dried up; it suggests there are still people in this pool, it’s just that for now the direction is being controlled by the shorts.
Abnormal ranking for the whole pool: #16; notional change: #26. The capital flow direction really does have a clear bias. Friends holding positions, watch the 1-hour OI as well—it’s starting to pull back. If, in the short term, there’s a rebound back near the lower bound of the range, that could be a pressure-test location.
Not a call—just that the chart looks a bit interesting. Logging it here.
In just 15 minutes, it broke through the lower bound of the range covered by nearly 20 five-minute candlesticks. Trading volume expanded to 1.55x, and the volatility Z-score surged to 2.5—this isn’t the kind of slow, grinding bearish move that wears you down. What’s even more worth noting is that while the price is moving down, OI is still rising slightly; yet the contract notional changes are seeing a large outflow. Plainly put, it looks more like newly added leveraged shorts are entering and smashing the market, rather than just retail panic selling.
Aggressive trade delta is down 32.4%, the buy/sell ratio is 0.51—shorts are indeed driving the tempo. In the past 24 hours there’s also $26 million in trading value, meaning liquidity hasn’t dried up; it suggests there are still people in this pool, it’s just that for now the direction is being controlled by the shorts.
Abnormal ranking for the whole pool: #16; notional change: #26. The capital flow direction really does have a clear bias. Friends holding positions, watch the 1-hour OI as well—it’s starting to pull back. If, in the short term, there’s a rebound back near the lower bound of the range, that could be a pressure-test location.
Not a call—just that the chart looks a bit interesting. Logging it here.

$MOVR This 15-minute candlestick is quite interesting. It dropped nearly 2%, while the trading volume surged straight to 2.66 times the usual level. The volatility Z-score is 2.88, and the order book clearly doesn’t look like retail traders are playing it.
More importantly, the contract open interest is shrinking in sync: within 15 minutes -1.72%, and on the 1-hour basis it’s down -3.13%. Price is falling while OI is dropping—this is textbook deleveraging by longs. There’s a lot of passive stop-outs or active cut positions involved. The nominal change ranks #26 in the pool; we’ve verified the depth too, so it’s not a false signal.
The funding rate is still hovering at a high level. After this kind of long “clean-out,” it actually releases a fair amount of previously crowded risk.
In the past 24 hours, trading value was $224 million. Turnover isn’t small. Passive sell orders are in an advantage position (buy/sell ratio 0.81). With volume like this, the price dropping like that implies short-term momentum still exists—but after OI has been washed out for a round, the rebound’s order/position structure looks cleaner instead.
Keep an eye on whether it can quickly reclaim the 15-minute opening price next. If it can’t, the duration of the weak consolidation could be extended.
More importantly, the contract open interest is shrinking in sync: within 15 minutes -1.72%, and on the 1-hour basis it’s down -3.13%. Price is falling while OI is dropping—this is textbook deleveraging by longs. There’s a lot of passive stop-outs or active cut positions involved. The nominal change ranks #26 in the pool; we’ve verified the depth too, so it’s not a false signal.
The funding rate is still hovering at a high level. After this kind of long “clean-out,” it actually releases a fair amount of previously crowded risk.
In the past 24 hours, trading value was $224 million. Turnover isn’t small. Passive sell orders are in an advantage position (buy/sell ratio 0.81). With volume like this, the price dropping like that implies short-term momentum still exists—but after OI has been washed out for a round, the rebound’s order/position structure looks cleaner instead.
Keep an eye on whether it can quickly reclaim the 15-minute opening price next. If it can’t, the duration of the weak consolidation could be extended.


🎓 Every day a coin — understand the market, not just buy and go
Today: Litecoin ($LTC ) — #26 by market value
🏗️ One of the oldest coins (2011) — a faster and cheaper version of Bitcoin made for everyday payments, running non-stop for over 13 years.
💪 Clean operating record from one of the longest runs in the market + actually accepted as a payment method.
⚠️ No major new development for years — it lives more on its reputation than on innovation.
📊 Price: $52.060 · Market cap: $4.0B
7 days: +17.9% · 30 days: +13.2%
📈 Resistances: $55.350 | Supports: $43.640 · $43.370$
(Historical stop zones from 90-day candles — not targets or recommendations)
What’s the most interesting thing about Litecoin for you? Write your opinion 👇 $LTC
💛 Join Abu Malk Team: Register on Binance with code ABOMALAK — permanent discount on trading fees and benefiting from our services and offers
#26 #LTC #Altcoins
⚠️ Educational content — not investment advice
Today: Litecoin ($LTC ) — #26 by market value
🏗️ One of the oldest coins (2011) — a faster and cheaper version of Bitcoin made for everyday payments, running non-stop for over 13 years.
💪 Clean operating record from one of the longest runs in the market + actually accepted as a payment method.
⚠️ No major new development for years — it lives more on its reputation than on innovation.
📊 Price: $52.060 · Market cap: $4.0B
7 days: +17.9% · 30 days: +13.2%
📈 Resistances: $55.350 | Supports: $43.640 · $43.370$
(Historical stop zones from 90-day candles — not targets or recommendations)
What’s the most interesting thing about Litecoin for you? Write your opinion 👇 $LTC
💛 Join Abu Malk Team: Register on Binance with code ABOMALAK — permanent discount on trading fees and benefiting from our services and offers
#26 #LTC #Altcoins
⚠️ Educational content — not investment advice


💎 USD1 Market Analysis: Price action and market trends
On August 24, 2026, USD1 $$USD1 has been trading at $0.9999 over the past 24 hours, showing a 0.02% change. With a market capitalization of $4.00B, USD1 holds rank #26 among all cryptocurrencies.
Daily trading volume reached $90.40B, indicating active market participation. The 0.02% 24-hour movement reflects ongoing market sentiment and trader activity across global exchanges.
📌 Key Takeaway:
USD1 continues to demonstrate 0.02% volatility, reinforcing its position as a leading digital asset. Market participants should DYOR and monitor on-chain metrics for additional context.
#$USD1 #$HYPE
#BinanceAlphaAlert
On August 24, 2026, USD1 $$USD1 has been trading at $0.9999 over the past 24 hours, showing a 0.02% change. With a market capitalization of $4.00B, USD1 holds rank #26 among all cryptocurrencies.
Daily trading volume reached $90.40B, indicating active market participation. The 0.02% 24-hour movement reflects ongoing market sentiment and trader activity across global exchanges.
📌 Key Takeaway:
USD1 continues to demonstrate 0.02% volatility, reinforcing its position as a leading digital asset. Market participants should DYOR and monitor on-chain metrics for additional context.
#$USD1 #$HYPE
#BinanceAlphaAlert
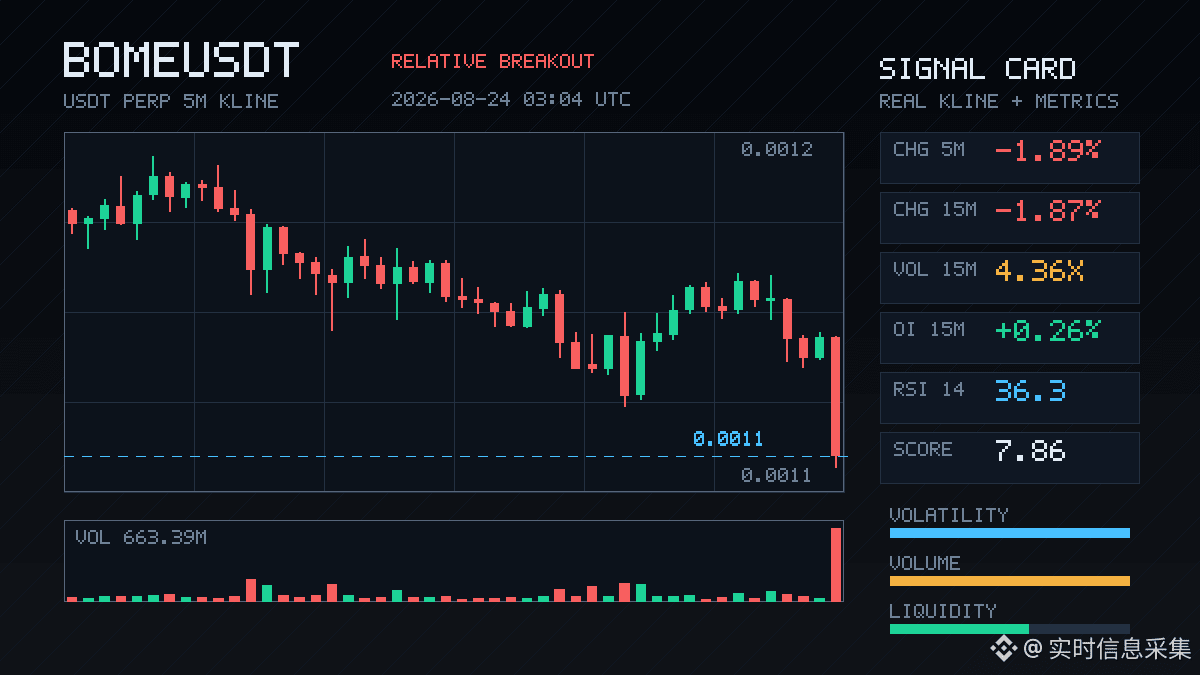
BOME, this pullback is kind of interesting. In just 15 minutes it dropped 1.87%, and the trading volume surged to 4.36x. The volatility Z-value is 4.05. It has already completely broken through the lower bound of the most recent ~20 five-minute K-line range.
But what really makes me wary is the OI data: the price is falling, yet OI is still rising—and it’s the kind of play where “new leveraged shorts” are coming in to participate. The contract nominal value change is -1.52%, and the funding rate is also sitting at a high percentile recently. This chart looks a lot like shorts are adding positions in batches to push price downward.
Aggressive trade gap is -35.6%, buy-sell ratio is 0.47—almost an all-sell market. The O I anomaly percentile has reached 82.9%, with the whole pool ranking #18 for anomalies, and nominal change ranking #26. None of this looks like a quiet, passive drift lower—someone is actively stirring things up inside.
In plain terms: the direction seems right, but I don’t want to chase from a spot that’s crowded with high-leverage shorts. I’ll first look for an opportunity to confirm with a rebound, or wait until the shorts loosen their grip on their own.
But what really makes me wary is the OI data: the price is falling, yet OI is still rising—and it’s the kind of play where “new leveraged shorts” are coming in to participate. The contract nominal value change is -1.52%, and the funding rate is also sitting at a high percentile recently. This chart looks a lot like shorts are adding positions in batches to push price downward.
Aggressive trade gap is -35.6%, buy-sell ratio is 0.47—almost an all-sell market. The O I anomaly percentile has reached 82.9%, with the whole pool ranking #18 for anomalies, and nominal change ranking #26. None of this looks like a quiet, passive drift lower—someone is actively stirring things up inside.
In plain terms: the direction seems right, but I don’t want to chase from a spot that’s crowded with high-leverage shorts. I’ll first look for an opportunity to confirm with a rebound, or wait until the shorts loosen their grip on their own.
I just took a look at SPK’s trend—it’s kind of interesting.
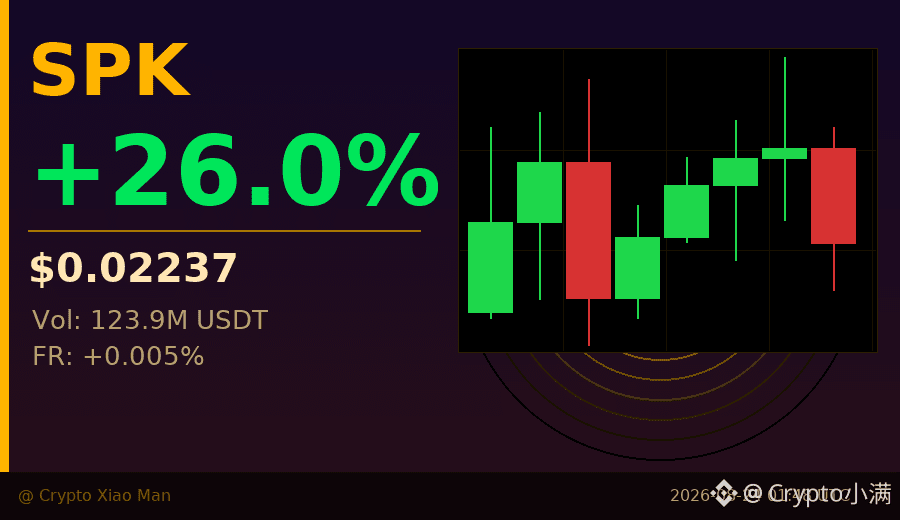
Today it’s up 26%, peaking at 0.0241, but what I care more about is the change in trading volume.
At the beginning, a few K-lines had extremely high volume—the highest one was close to 1 billion USDT. That suggests the incoming capital was very aggressive, with a large amount of chips rotating while the price was at high levels.
But in the following K-lines, the volume clearly shrank to only about a quarter of the peak, and the price also pulled back from the high and consolidated.
This kind of move is actually quite common: a fast surge → turnover at high levels → volume contraction → short-term range trading.
Right now, the long-vs-short ratio is about 51% longs vs 49% shorts—almost split evenly. This indicates the market has a lot of disagreement at this level, with no obvious bias.
The funding rate is 0.005%, which is very normal. The leveraged funds don’t appear to be excessively tilted toward either side—this is actually a relatively healthy signal.
I noticed the current price is 0.0224, about 7% below the high. If anyone bought near the top, they’re currently in a small unrealized loss.
Everyone can keep an eye on this: whether the volume can expand again at low levels is one of the key reference points for judging the next move.
$SPK #量能萎缩 #26% surge followed by consolidation
Click the small card below to quickly check the chart 👇
Today it’s up 26%, peaking at 0.0241, but what I care more about is the change in trading volume.
At the beginning, a few K-lines had extremely high volume—the highest one was close to 1 billion USDT. That suggests the incoming capital was very aggressive, with a large amount of chips rotating while the price was at high levels.
But in the following K-lines, the volume clearly shrank to only about a quarter of the peak, and the price also pulled back from the high and consolidated.
This kind of move is actually quite common: a fast surge → turnover at high levels → volume contraction → short-term range trading.
Right now, the long-vs-short ratio is about 51% longs vs 49% shorts—almost split evenly. This indicates the market has a lot of disagreement at this level, with no obvious bias.
The funding rate is 0.005%, which is very normal. The leveraged funds don’t appear to be excessively tilted toward either side—this is actually a relatively healthy signal.
I noticed the current price is 0.0224, about 7% below the high. If anyone bought near the top, they’re currently in a small unrealized loss.
Everyone can keep an eye on this: whether the volume can expand again at low levels is one of the key reference points for judging the next move.
$SPK #量能萎缩 #26% surge followed by consolidation
Click the small card below to quickly check the chart 👇
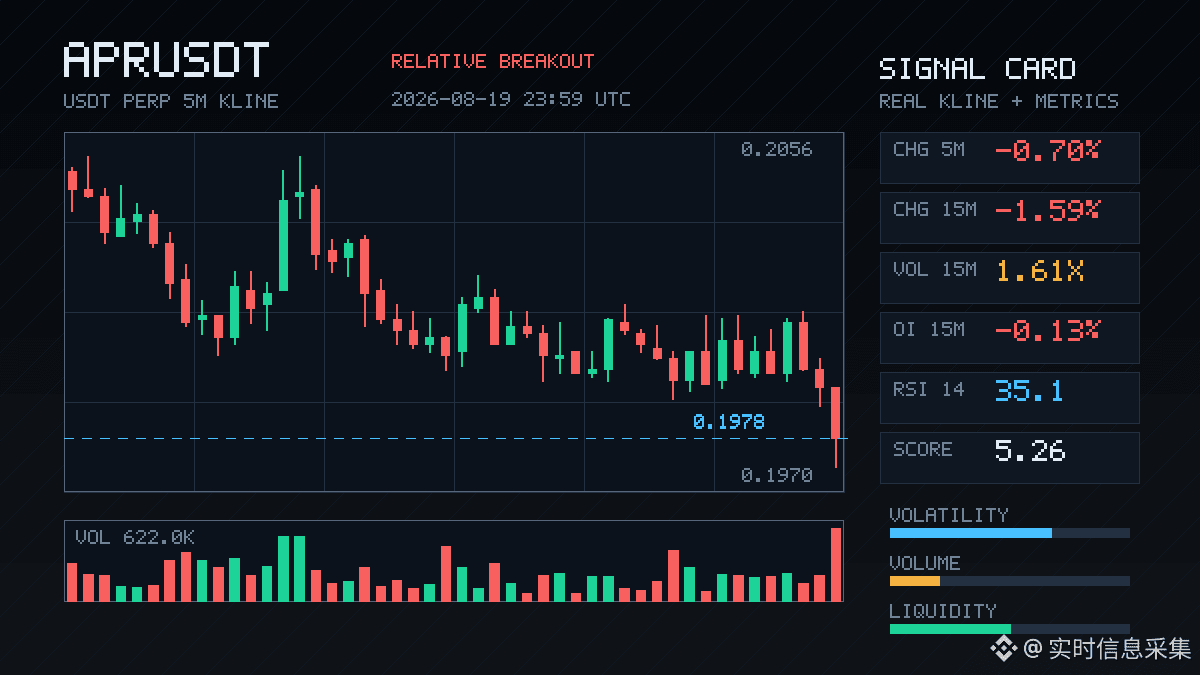
$APR This drop is quite straightforward. In just 15 minutes, it cut through the lower edge of the range covered by nearly 20 five-minute K-line candles. Trading volume expanded to 1.6 times the normal level. There is clear aggressive selling pressure, and the buy-to-sell ratio is 0.58. The shorts didn’t hold back.
What’s interesting is that open interest actually shrank: OI over 15 minutes is -0.13%, with a notional change of -181K. This doesn’t look like a pure incremental sell-off; it’s more like longs de-leveraging and exiting via stop-losses. The abnormal volume ranking across the whole pool is near the top (#26), and the notional change also ranks within the top 20. With this kind of volume-price coordination breaking down, the short-term trend is likely to continue with a momentum-driven dip.
Still, when it falls to this level, don’t rush to chase. The volatility Z of 2.69 is already quite high, and the market needs to let off steam. Watch whether a rebound can reclaim the lower edge of the range. If it can’t get back, weakness will likely persist. With this volatility of $APR , position management matters more than direction.
What’s interesting is that open interest actually shrank: OI over 15 minutes is -0.13%, with a notional change of -181K. This doesn’t look like a pure incremental sell-off; it’s more like longs de-leveraging and exiting via stop-losses. The abnormal volume ranking across the whole pool is near the top (#26), and the notional change also ranks within the top 20. With this kind of volume-price coordination breaking down, the short-term trend is likely to continue with a momentum-driven dip.
Still, when it falls to this level, don’t rush to chase. The volatility Z of 2.69 is already quite high, and the market needs to let off steam. Watch whether a rebound can reclaim the lower edge of the range. If it can’t get back, weakness will likely persist. With this volatility of $APR , position management matters more than direction.

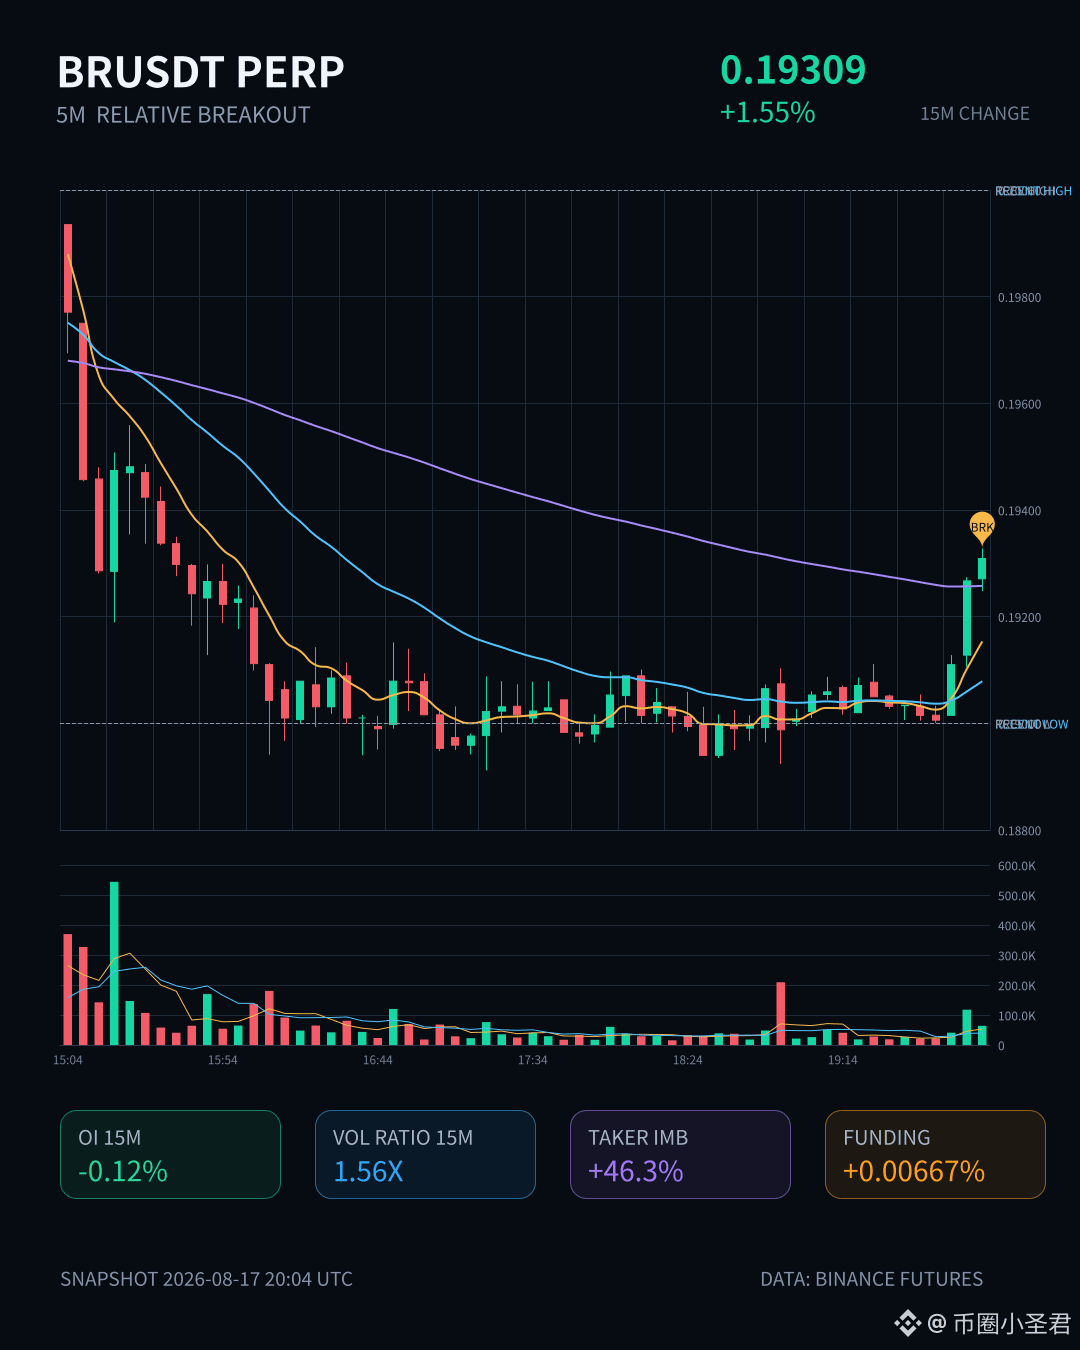
$BR In the early hours, this surge is a bit something.
In just 15 minutes it pushed straight up 1.55%, with volume expanding to 1.56x. The volatility Z hit 3.59, and at the close it forcefully drove through the highs on the latest nearly 20 consecutive 5m candles. Most importantly, that part was the aggressive trading—buy/sell ratio at 2.72, with an aggressive imbalance of -46.3%. This definitely isn’t something retail traders “mess around” to create; there really is money fighting for the order book on the board.
As for OI, it’s interesting: the 15-minute futures position size actually shrank by 0.12%, and the 1-hour one shrank as well. While price is rising, positions are decreasing, and the notional is still expanding—plainly the script of shorts covering while passive followers pile in. The funds didn’t really leave; they just rotated turnover. This structure is tougher than a pure volume-push rally.
$BR ranks #12 in the abnormal pool, with notional change at #26. In the last 24 hours, turnover is 12.56 million U; in a pool of this size, the activity is already among the top tier. This cycle has consecutive abnormal moves—it's not just a single jump and then over. The percentile at 84.7% also shows the depth is still there.
But honestly, with a move this fast upward, you still need to be careful. A short-covering-start rally kicks off quickly, but its staying power may not keep up. If you don’t have a position, think twice before chasing. If you do have one, keep an eye on whether pullbacks can be defended.
In just 15 minutes it pushed straight up 1.55%, with volume expanding to 1.56x. The volatility Z hit 3.59, and at the close it forcefully drove through the highs on the latest nearly 20 consecutive 5m candles. Most importantly, that part was the aggressive trading—buy/sell ratio at 2.72, with an aggressive imbalance of -46.3%. This definitely isn’t something retail traders “mess around” to create; there really is money fighting for the order book on the board.
As for OI, it’s interesting: the 15-minute futures position size actually shrank by 0.12%, and the 1-hour one shrank as well. While price is rising, positions are decreasing, and the notional is still expanding—plainly the script of shorts covering while passive followers pile in. The funds didn’t really leave; they just rotated turnover. This structure is tougher than a pure volume-push rally.
$BR ranks #12 in the abnormal pool, with notional change at #26. In the last 24 hours, turnover is 12.56 million U; in a pool of this size, the activity is already among the top tier. This cycle has consecutive abnormal moves—it's not just a single jump and then over. The percentile at 84.7% also shows the depth is still there.
But honestly, with a move this fast upward, you still need to be careful. A short-covering-start rally kicks off quickly, but its staying power may not keep up. If you don’t have a position, think twice before chasing. If you do have one, keep an eye on whether pullbacks can be defended.

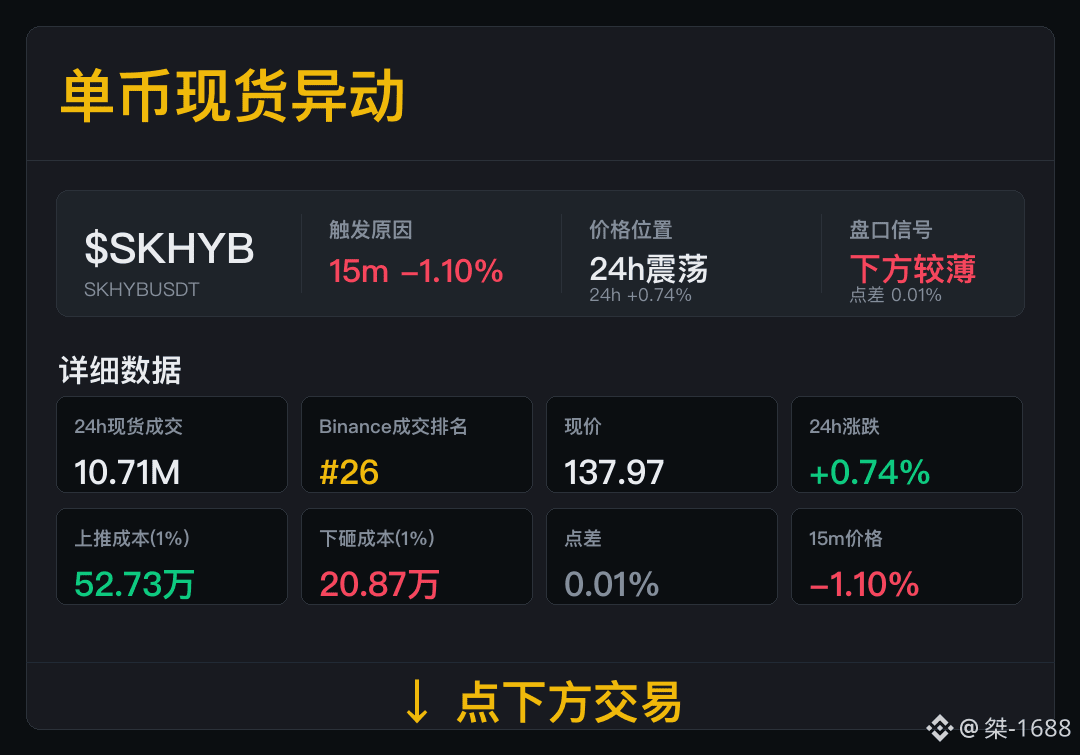
$SKHYB short-term price has changed—first, look at real turnover.
Spot trades 10.71M, Binance spot trading rank #26. The spot volume provides the participation base; as for continuity, we still need to watch subsequent volume strength.
Now 24h change +0.74%; spread 0.01%, cost for pushing up 520,700, and cost for pulling down 208,700. Going forward, if the spread stays at the current level and trading remains active, executing short-term trades will be smoother.
In the next round, focus on confirming both volume and the spread. Only when both stay stable should we continue tracking.
Spot trades 10.71M, Binance spot trading rank #26. The spot volume provides the participation base; as for continuity, we still need to watch subsequent volume strength.
Now 24h change +0.74%; spread 0.01%, cost for pushing up 520,700, and cost for pulling down 208,700. Going forward, if the spread stays at the current level and trading remains active, executing short-term trades will be smoother.
In the next round, focus on confirming both volume and the spread. Only when both stay stable should we continue tracking.

$BULLA This move is pretty straightforward—within 15 minutes it surged to up 2.37% directly. The trading volume was pushed to 6.9x, which clearly isn’t the kind of slow, indecisive grind higher. Still, the details are worth savoring: OI is falling while the price is climbing—what does that imply? Most likely, shorts are bailing out and covering is what’s driving the price up, rather than fresh long positions flooding in in a big way.
On top of that, it has broken above the highs of nearly 20 candlesticks, and the aggressive buy-side is stronger (buy/sell ratio 1.69). On the short-term horizon, the bulls still seem to control the situation. But don’t get too optimistic yet: a structure like “rising while positions decline” usually depends on whether follow-through involves fresh incremental capital stepping in to take the baton. Now BULLA is ranked #16 on the abnormal activity board, and its nominal change is also #26—basically a player everyone in the market is watching. Amplified volatility is the norm here, so watch out for wick spikes.
With a 24-hour float of less than 8 million U, this kind of size tends to be fast in and fast out. If you’re chasing, make sure you set a proper stop-loss.
On top of that, it has broken above the highs of nearly 20 candlesticks, and the aggressive buy-side is stronger (buy/sell ratio 1.69). On the short-term horizon, the bulls still seem to control the situation. But don’t get too optimistic yet: a structure like “rising while positions decline” usually depends on whether follow-through involves fresh incremental capital stepping in to take the baton. Now BULLA is ranked #16 on the abnormal activity board, and its nominal change is also #26—basically a player everyone in the market is watching. Amplified volatility is the norm here, so watch out for wick spikes.
With a 24-hour float of less than 8 million U, this kind of size tends to be fast in and fast out. If you’re chasing, make sure you set a proper stop-loss.
$BANK Morning session: this volatility is a bit interesting 🔥
In just 15 minutes, price ripped through the upper bound of the recent range of nearly 20 5m candles. Trading volume hit 1.87x the usual level, and the volatility Z soared to 3.03—this isn’t that kind of sloppy, fake breakout.
Most importantly, OI is rising in sync. The 15-minute contract is up +0.35%, the 1-hour timeframe is +1%. Notional changes from 206K to 278K. This isn’t the kind of reduced-volume bounce from short-covering—this is solid new leveraged long exposure actually entering the market.
Aggressive volume is up 11.8%, the buy/sell ratio is 1.27, and buyers are in the lead with no real disagreement. Abnormal pool rank #21, notional change rank #26—one of those quiet setups where capital is already watching.
Over the past 24 hours, turnover is $104 million, and liquidity is sufficient. If you want to chase it in the short term, focus on whether this breakout retest can hold and stay above the upper end of the range. Don’t rush to go all-in—first see if volume can support it.
In just 15 minutes, price ripped through the upper bound of the recent range of nearly 20 5m candles. Trading volume hit 1.87x the usual level, and the volatility Z soared to 3.03—this isn’t that kind of sloppy, fake breakout.
Most importantly, OI is rising in sync. The 15-minute contract is up +0.35%, the 1-hour timeframe is +1%. Notional changes from 206K to 278K. This isn’t the kind of reduced-volume bounce from short-covering—this is solid new leveraged long exposure actually entering the market.
Aggressive volume is up 11.8%, the buy/sell ratio is 1.27, and buyers are in the lead with no real disagreement. Abnormal pool rank #21, notional change rank #26—one of those quiet setups where capital is already watching.
Over the past 24 hours, turnover is $104 million, and liquidity is sufficient. If you want to chase it in the short term, focus on whether this breakout retest can hold and stay above the upper end of the range. Don’t rush to go all-in—first see if volume can support it.

The market’s valuation of the hardware supply chain has a very clear offset: it’s not that whoever has the biggest story gets a premium. Instead, whoever stands on the line of “data transmission and compute connectivity” is more likely to be repriced by capital first. Whether it’s AI or cloud infrastructure, once you look at actual deployment, it invariably comes down to components and links like optical modules and network upgrades. I’ll place Applied Optoelectronics on this track.
I’m more bullish—not because it’s only up +0.77% today, but because once a stock like this returns to the view of actively traded capital, its upside elasticity usually won’t be small. On Binance, the perpetuals contract ranks it at #16 on the gainers list and #26 on the trading volume list, which indicates it’s not some obscure, ignored product. Its current price is $135.85, with a 24-hour range of $133.0 to $136.96. The price hasn’t strayed too far above the upper end of the range, suggesting there’s some momentum-chasing sentiment, but it hasn’t spiraled out of control.
More importantly, there’s no “overheated” flavor on the contracts side. The funding rate is +0.0110%—bullish, but not crowded. Open positions are 51,930 lots, and together with a 24-hour trading volume of $4.26M USDT, at least that shows this stock has already been seriously noticed by trading capital in the TradFi space. To me, that matters more than how much it rose in a single day. If nobody is watching it, even the logic is great, it’s hard to maintain continuity.
On the company level, I won’t invent details, but based on its name and how the market categorizes it, it still broadly belongs to the optical communications and optical components line. The advantage of this theme is very direct: as upstream compute capacity expands, data center interconnects, and bandwidth demand keeps rising, the related links will consistently have the soil for revaluation. The downside is just as direct: the hardware chain is never driven by narrative alone. If the industry’s order expectations and overall business conditions slow down, volatility can be ruthless.
My own approach is: I don’t chase in the spot market. In the contracts market, I’ll only use a very light position and wait for a pullback toward the lower end of the range. Around the $133 area, I’ll try a 3% position; if it breaks below, I’ll exit. I’m not short from here, for a simple reason: capital is already looking at it, and the funding rate hasn’t reached the point where you’d need to go against the flow. $AAOI #US Stocks
The market can turn on a dime—leave some room in the portfolio.
I’m more bullish—not because it’s only up +0.77% today, but because once a stock like this returns to the view of actively traded capital, its upside elasticity usually won’t be small. On Binance, the perpetuals contract ranks it at #16 on the gainers list and #26 on the trading volume list, which indicates it’s not some obscure, ignored product. Its current price is $135.85, with a 24-hour range of $133.0 to $136.96. The price hasn’t strayed too far above the upper end of the range, suggesting there’s some momentum-chasing sentiment, but it hasn’t spiraled out of control.
More importantly, there’s no “overheated” flavor on the contracts side. The funding rate is +0.0110%—bullish, but not crowded. Open positions are 51,930 lots, and together with a 24-hour trading volume of $4.26M USDT, at least that shows this stock has already been seriously noticed by trading capital in the TradFi space. To me, that matters more than how much it rose in a single day. If nobody is watching it, even the logic is great, it’s hard to maintain continuity.
On the company level, I won’t invent details, but based on its name and how the market categorizes it, it still broadly belongs to the optical communications and optical components line. The advantage of this theme is very direct: as upstream compute capacity expands, data center interconnects, and bandwidth demand keeps rising, the related links will consistently have the soil for revaluation. The downside is just as direct: the hardware chain is never driven by narrative alone. If the industry’s order expectations and overall business conditions slow down, volatility can be ruthless.
My own approach is: I don’t chase in the spot market. In the contracts market, I’ll only use a very light position and wait for a pullback toward the lower end of the range. Around the $133 area, I’ll try a 3% position; if it breaks below, I’ll exit. I’m not short from here, for a simple reason: capital is already looking at it, and the funding rate hasn’t reached the point where you’d need to go against the flow. $AAOI #US Stocks
The market can turn on a dime—leave some room in the portfolio.

$AAOI I’m fairly bullish on this—not because it’s up a lot today. Rather, it’s rising in a way that isn’t over-the-top, and the chart looks relatively steady.
Last night I worked overtime revising the manuscript until very late. When I got home, my delivery food had already gone cold. While eating, I was scrolling through Binance’s U.S. stock perpetuals leaderboard and saw it ranked #15 on the gainers list and #26 on the trading volume list. My first reaction was: people are continuously paying attention to this, not just passing by to take a quick look.
My understanding of a name like Applied Optoelectronics is that, at least on the big picture, it’s still tilted toward polarization/optical communication and optical modules.
For companies like this, the easiest thing for them to benefit from isn’t a single, short-lived theme sentiment. It’s more long-term factors—data traffic, compute capacity build-out, and network upgrade demand.
Honestly, the market currently has more patience for companies that “sell shovels to the infrastructure” than for many pure-concept names.
As long as upstream capital expenditures haven’t completely shut off, there will always be people willing to revisit and research this direction repeatedly, even if the middle stages can be painfully choppy.
On the chart, I also don’t think it’s all that “hollow.”
At the current price of $135.88, over the last 24 hours it’s only up +0.85%. But it did touch a high of $136.96, which indicates it’s not completely ignored or nobody’s buying. This isn’t the kind of sudden vertical spike—nor is it in a state of totally going nowhere. Personally, I’d be more willing to take another look.
Another factor that makes me less resistant is the funding rate, which is only +0.0098%.
That number isn’t scary. At least I don’t smell that vibe of “everyone in the whole room piling into the same side.”
If anything, it feels like a stage where sentiment has just started to get hot, but it hasn’t gotten hot enough to make me uneasy.
Of course, I’m not blindly optimistic either.
Once a stock like this gets exposure to a high-boom, high-visibility growth sector, valuation expectations can get amplified. And when the market starts to scrutinize, the volatility can become very intense.
Also, today’s 24h high and low are between $136.96 and $133.0, which suggests there’s still plenty of back-and-forth in the short term. If you chase too aggressively, you can easily lose your nerve 😭
So my stance is very clear: I’m bullish, but I don’t want to chase momentum driven by emotion.
I think it’s better to treat it as an observation list item—supported by the sector and with funds clearly watching it—then wait for a more comfortable entry, or wait for the market to keep confirming.
I might be wrong; it’s just my judgment. $AAOI #U.S. stocks
Last night I worked overtime revising the manuscript until very late. When I got home, my delivery food had already gone cold. While eating, I was scrolling through Binance’s U.S. stock perpetuals leaderboard and saw it ranked #15 on the gainers list and #26 on the trading volume list. My first reaction was: people are continuously paying attention to this, not just passing by to take a quick look.
My understanding of a name like Applied Optoelectronics is that, at least on the big picture, it’s still tilted toward polarization/optical communication and optical modules.
For companies like this, the easiest thing for them to benefit from isn’t a single, short-lived theme sentiment. It’s more long-term factors—data traffic, compute capacity build-out, and network upgrade demand.
Honestly, the market currently has more patience for companies that “sell shovels to the infrastructure” than for many pure-concept names.
As long as upstream capital expenditures haven’t completely shut off, there will always be people willing to revisit and research this direction repeatedly, even if the middle stages can be painfully choppy.
On the chart, I also don’t think it’s all that “hollow.”
At the current price of $135.88, over the last 24 hours it’s only up +0.85%. But it did touch a high of $136.96, which indicates it’s not completely ignored or nobody’s buying. This isn’t the kind of sudden vertical spike—nor is it in a state of totally going nowhere. Personally, I’d be more willing to take another look.
Another factor that makes me less resistant is the funding rate, which is only +0.0098%.
That number isn’t scary. At least I don’t smell that vibe of “everyone in the whole room piling into the same side.”
If anything, it feels like a stage where sentiment has just started to get hot, but it hasn’t gotten hot enough to make me uneasy.
Of course, I’m not blindly optimistic either.
Once a stock like this gets exposure to a high-boom, high-visibility growth sector, valuation expectations can get amplified. And when the market starts to scrutinize, the volatility can become very intense.
Also, today’s 24h high and low are between $136.96 and $133.0, which suggests there’s still plenty of back-and-forth in the short term. If you chase too aggressively, you can easily lose your nerve 😭
So my stance is very clear: I’m bullish, but I don’t want to chase momentum driven by emotion.
I think it’s better to treat it as an observation list item—supported by the sector and with funds clearly watching it—then wait for a more comfortable entry, or wait for the market to keep confirming.
I might be wrong; it’s just my judgment. $AAOI #U.S. stocks

From $0.131 all the way down to $0.091, $CC has already given back about three tenths—honestly, it does make people’s hands itch. But the dilemma of observers and would-be buyers who missed the move has never been about the price itself; it’s about fear: fear that buying in now means catching the falling knife, and fear that once it stabilizes, it will just run away higher.
The order book is very honest: over the past 30 days there have been virtually no meaningful rebounds. Every time there’s increased volume, it’s accompanied by declines. On August 5, volume expanded to 17M—result: it broke down directly from $0.114. Today it’s down another 12%, sliding along the prior low. This kind of structure suggests there’s still no desire from capital to build a position—at least not right now.
What I care about more is that $CC ’s market cap ranks at #26, still 53% away from ATH. In theory, this is not a place short of people who want to see a reversal. But the current problem is that the drop has been too smooth—there’s no confirmation signal at all. Anyone trying to bottom-fish has to think first: if you buy at $0.09, and it breaks $0.085, how much room for buffer is there below? Conversely, if the trading volume ramps back up and it reclaims $0.10—that’s the first reason to participate on the left side. Until both conditions are met, the costs of chasing versus not chasing aren’t symmetric: missing out might cost you at most one rebound, while catching the knife could mean having to hold through another stretch of slow, bearish drift.
Here’s a choice question for you: for $CC right now, are you going to test with a small position, or wait for it to put volume back and reclaim $0.10 before acting? Tell me your reasoning.
The order book is very honest: over the past 30 days there have been virtually no meaningful rebounds. Every time there’s increased volume, it’s accompanied by declines. On August 5, volume expanded to 17M—result: it broke down directly from $0.114. Today it’s down another 12%, sliding along the prior low. This kind of structure suggests there’s still no desire from capital to build a position—at least not right now.
What I care about more is that $CC ’s market cap ranks at #26, still 53% away from ATH. In theory, this is not a place short of people who want to see a reversal. But the current problem is that the drop has been too smooth—there’s no confirmation signal at all. Anyone trying to bottom-fish has to think first: if you buy at $0.09, and it breaks $0.085, how much room for buffer is there below? Conversely, if the trading volume ramps back up and it reclaims $0.10—that’s the first reason to participate on the left side. Until both conditions are met, the costs of chasing versus not chasing aren’t symmetric: missing out might cost you at most one rebound, while catching the knife could mean having to hold through another stretch of slow, bearish drift.
Here’s a choice question for you: for $CC right now, are you going to test with a small position, or wait for it to put volume back and reclaim $0.10 before acting? Tell me your reasoning.
The chart of $GRAM : traders actually have two prices in their minds. One is the current price at $1.38, and the other is the ATH at $8.25. The 83% gap is right there. People looking forward think there’s nowhere left to fall, while those looking back can only see that over the past year it has already dropped 59%. Between these two anchors is where the disagreement lies.
The real trouble is the slow grind lower itself. Over 30 days, it slid from $1.78 to $1.38. It wasn’t that there were no volume spikes—in the July 11 trade, a $208M volume dump hit the market, but the price still couldn’t even hold above $1.65. This suggests some capital tried to step in, yet the sell pressure overhead has been more decisive than the willingness to enter. Right now, daily trading volume of $60M is propping up a market-cap ranking of #26 ; there’s no panic and no consensus.
What I care about more is that every time dip-buying capital has tried to catch the bottom, it has turned into sell-side relief inventory for those above—meaning what’s building below $1.38 isn’t support, but disappointment. If it rebounds toward $1.45 and then pulls back on lower volume, that would just be another repetition. But only if volume keeps expanding and the price re-establishes itself in that range will the slow-grind structure be considered broken.
What do the ones who wait for confirmation need to see to be satisfied? And those who take the risk early—are they betting that $1.38 is the bottom itself, or betting that the rebound will be fast enough that they won’t have to worry about that 83% distance? These two choices each carry their own costs right now, and they’re not small.
The real trouble is the slow grind lower itself. Over 30 days, it slid from $1.78 to $1.38. It wasn’t that there were no volume spikes—in the July 11 trade, a $208M volume dump hit the market, but the price still couldn’t even hold above $1.65. This suggests some capital tried to step in, yet the sell pressure overhead has been more decisive than the willingness to enter. Right now, daily trading volume of $60M is propping up a market-cap ranking of #26 ; there’s no panic and no consensus.
What I care about more is that every time dip-buying capital has tried to catch the bottom, it has turned into sell-side relief inventory for those above—meaning what’s building below $1.38 isn’t support, but disappointment. If it rebounds toward $1.45 and then pulls back on lower volume, that would just be another repetition. But only if volume keeps expanding and the price re-establishes itself in that range will the slow-grind structure be considered broken.
What do the ones who wait for confirmation need to see to be satisfied? And those who take the risk early—are they betting that $1.38 is the bottom itself, or betting that the rebound will be fast enough that they won’t have to worry about that 83% distance? These two choices each carry their own costs right now, and they’re not small.
刚泡完一杯黑咖啡,翻到美股永续榜的时候,我把 $BABA 多看了两眼。不是因为它一天涨了多少,而是这种名字一旦重新挤进成交和涨幅前排,通常说明资金开始回头看“平台型资产”了,不只是在追最热的单一题材。
阿里这票我偏看多,先说最直接的一点:它属于那种市场很熟、业务触角也够广的平台公司。据我了解,大致还是围绕电商、商家生态、云这几个方向在走。这个类型的公司有个好处,情绪冷的时候会被一起压,情绪回来的时候也容易被一起重估。现在永续现价 $127.16,24h 从 $122.28 拉到最高 $128.06,最后还稳在高位附近,说明这波不是冲一下就散。
我更在意的是合约这边没有过热。资金费率还是 +0.0000%,但 24h 成交额已经到 $8.64M USDT,持仓量 59,638 张。价格涨了 +3.94%,费率却没飘,这种盘面对多头更友好一点,至少不是一堆人追着把杠杆顶满。很多票最难做的不是不涨,是涨的时候已经太挤,后面全看谁跑得快。$BABA 这组数据还没到那个阶段。
还有个点,阿里这种票的优势不在“新”,而在它够大、够有辨识度。市场一旦从只炒高弹性名字,切回到更愿意给大市值平台估值,资金会先挑流动性好、叙事又不陌生的标的。它今天能排到美股永续涨幅榜 #6、成交额榜 #26,至少说明关注度在回升。
我自己不会在这种 24h 高点附近追,127 上方我没开仓。我挂的是回踩 124 附近试多,仓位 3%,跌破 122 我出。这个位置能看的前提,是它后面别走成单日情绪脉冲;如果美股整体风险偏好转弱,或者中概平台又被宏观情绪压估值,再好的结构也会先被砸回去。$BABA #美股
这是我的看法,你的钱你做主。
阿里这票我偏看多,先说最直接的一点:它属于那种市场很熟、业务触角也够广的平台公司。据我了解,大致还是围绕电商、商家生态、云这几个方向在走。这个类型的公司有个好处,情绪冷的时候会被一起压,情绪回来的时候也容易被一起重估。现在永续现价 $127.16,24h 从 $122.28 拉到最高 $128.06,最后还稳在高位附近,说明这波不是冲一下就散。
我更在意的是合约这边没有过热。资金费率还是 +0.0000%,但 24h 成交额已经到 $8.64M USDT,持仓量 59,638 张。价格涨了 +3.94%,费率却没飘,这种盘面对多头更友好一点,至少不是一堆人追着把杠杆顶满。很多票最难做的不是不涨,是涨的时候已经太挤,后面全看谁跑得快。$BABA 这组数据还没到那个阶段。
还有个点,阿里这种票的优势不在“新”,而在它够大、够有辨识度。市场一旦从只炒高弹性名字,切回到更愿意给大市值平台估值,资金会先挑流动性好、叙事又不陌生的标的。它今天能排到美股永续涨幅榜 #6、成交额榜 #26,至少说明关注度在回升。
我自己不会在这种 24h 高点附近追,127 上方我没开仓。我挂的是回踩 124 附近试多,仓位 3%,跌破 122 我出。这个位置能看的前提,是它后面别走成单日情绪脉冲;如果美股整体风险偏好转弱,或者中概平台又被宏观情绪压估值,再好的结构也会先被砸回去。$BABA #美股
这是我的看法,你的钱你做主。
My take on $MRVL is pretty direct: this ticket is now being placed on the “highly upbeat/strong-demand computing power supply chain” watch list by funds. The pullback isn’t getting heavy, and the hype hasn’t faded.
First, look at the order-book/market snapshot. On Binance’s US stocks perpetuals gainers list, it ranks #26 by price increase, and #22 by trading volume. That suggests there are people watching, but it hasn’t crowded into the most packed tier. Current price is $185.22; over the past 24h it only pulled back -0.59%, ranging from $183.3 to $187.69. I won’t chase here. I’ll set a long near $183.8 with a 3% position size. If it breaks below the intraday low, I’ll exit.
The funding rate is still +0.0000%, and open interest is 141,464 contracts. That tells me there isn’t “hot” sentiment building on the futures side—at least not the kind of structure where a bunch of people rush in despite high funding.
I’m bullish, not because it’s down less today, but because once a stock like this is still in funds’ line of sight, pullbacks are often first used as a way to test/scale in. A lot of US funds are still looking for names that have both “industry positioning” and can absorb/benefit from the computing-power narrative. Marvell broadly fits this direction, based on what I understand. It’s not a pure-concept company; it’s more tied to demand like data centers, networking, and infrastructure upgrades. As long as the market is still trading AI-related capex and computing power expansion, these kinds of names usually aren’t quickly forgotten.
One more detail I pay closer attention to: today’s 24h trading value is $6.82M USDT, but the price hasn’t fallen below the intraday lows for too long. That indicates there’s disagreement, but selling pressure hasn’t turned into a stampede. For someone like me who trades, that matters more than how much it rose on a single day. If you want to name the key variable, it’s very clear: once sector rotation moves on, or if funds start recognizing only the most core/leading names, the more “peripheral” tickers’ upside/swing will likely get compressed first. My approach is simple: test with a small position and don’t use leverage to bet on the story.
This is a stock I would put on my watchlist—especially suitable for using pullbacks to reposition, not for chasing emotionally.
$MRVL #US stocks
I could be wrong too—my judgment may be off.
First, look at the order-book/market snapshot. On Binance’s US stocks perpetuals gainers list, it ranks #26 by price increase, and #22 by trading volume. That suggests there are people watching, but it hasn’t crowded into the most packed tier. Current price is $185.22; over the past 24h it only pulled back -0.59%, ranging from $183.3 to $187.69. I won’t chase here. I’ll set a long near $183.8 with a 3% position size. If it breaks below the intraday low, I’ll exit.
The funding rate is still +0.0000%, and open interest is 141,464 contracts. That tells me there isn’t “hot” sentiment building on the futures side—at least not the kind of structure where a bunch of people rush in despite high funding.
I’m bullish, not because it’s down less today, but because once a stock like this is still in funds’ line of sight, pullbacks are often first used as a way to test/scale in. A lot of US funds are still looking for names that have both “industry positioning” and can absorb/benefit from the computing-power narrative. Marvell broadly fits this direction, based on what I understand. It’s not a pure-concept company; it’s more tied to demand like data centers, networking, and infrastructure upgrades. As long as the market is still trading AI-related capex and computing power expansion, these kinds of names usually aren’t quickly forgotten.
One more detail I pay closer attention to: today’s 24h trading value is $6.82M USDT, but the price hasn’t fallen below the intraday lows for too long. That indicates there’s disagreement, but selling pressure hasn’t turned into a stampede. For someone like me who trades, that matters more than how much it rose on a single day. If you want to name the key variable, it’s very clear: once sector rotation moves on, or if funds start recognizing only the most core/leading names, the more “peripheral” tickers’ upside/swing will likely get compressed first. My approach is simple: test with a small position and don’t use leverage to bet on the story.
This is a stock I would put on my watchlist—especially suitable for using pullbacks to reposition, not for chasing emotionally.
$MRVL #US stocks
I could be wrong too—my judgment may be off.
Log in to explore more content