

桀-1688
4.4k Posts

桀-1688
 Square Verified
Report
Block User
盯盘不追高,数据说人话。关注我,用数据拆行情,用白话讲市场。
High-Frequency Trader
9.1 Years
106 Following
11.3K+ Followers
2.5K+ Liked
Posts
·
--
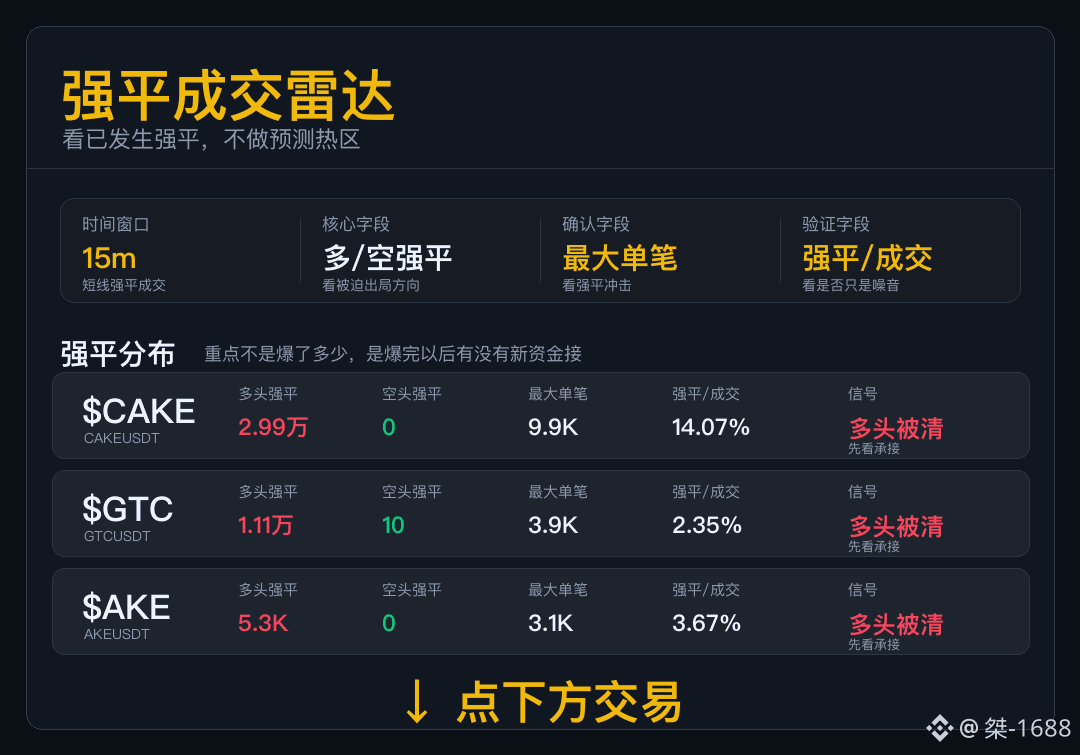
Liquidation Radar
When it comes to liquidation data, first look at who was forced out.
$CAKE Long leverage was hit first. Whether the rebound can hold depends on whether trading volume picks up.
$GTC Longs took a heavier hit here. First, watch for buyers to step in and push the price back up.
$AKE When long liquidations dominate, don't rush to buy the first dip. Wait and see who steps in after the liquidations are cleared.
If the price continues to weaken after the liquidations, it means new selling pressure has absorbed the forced selling.
Liquidation Radar
When it comes to liquidation data, first look at who was forced out.
$CAKE Long leverage was hit first. Whether the rebound can hold depends on whether trading volume picks up.
$GTC Longs took a heavier hit here. First, watch for buyers to step in and push the price back up.
$AKE When long liquidations dominate, don't rush to buy the first dip. Wait and see who steps in after the liquidations are cleared.
If the price continues to weaken after the liquidations, it means new selling pressure has absorbed the forced selling.
When it comes to liquidation data, first look at who was forced out.
$CAKE Long leverage was hit first. Whether the rebound can hold depends on whether trading volume picks up.
$GTC Longs took a heavier hit here. First, watch for buyers to step in and push the price back up.
$AKE When long liquidations dominate, don't rush to buy the first dip. Wait and see who steps in after the liquidations are cleared.
If the price continues to weaken after the liquidations, it means new selling pressure has absorbed the forced selling.
1
103
·
--
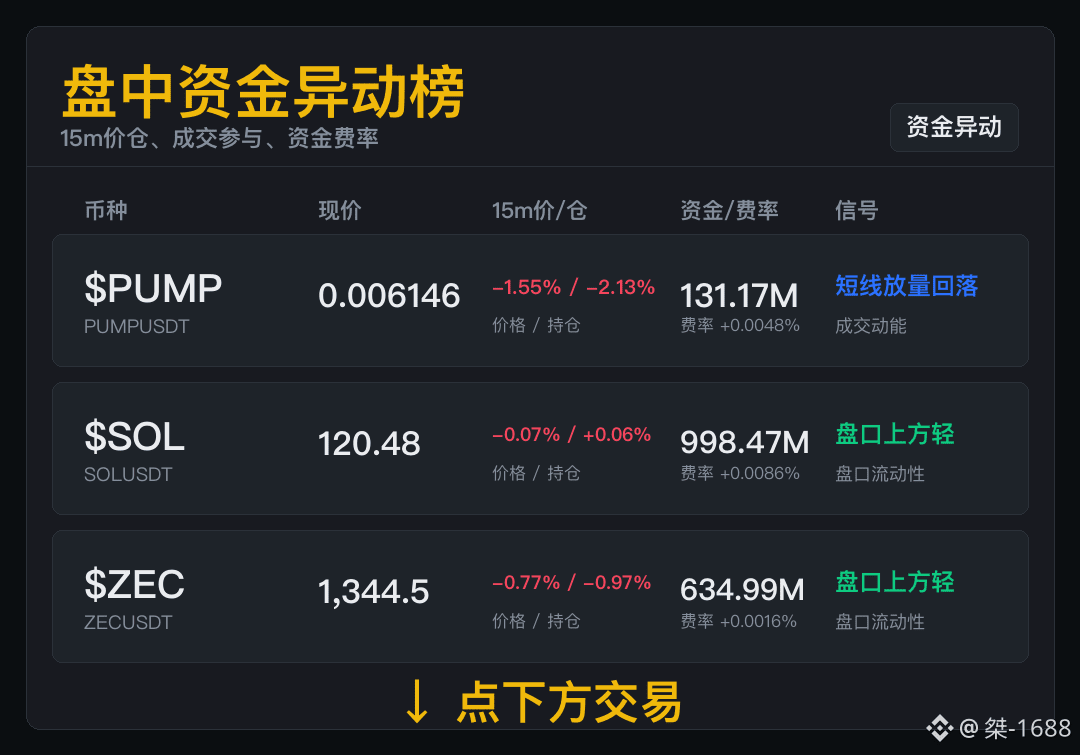
There are plenty of intraday signals; let’s start with the ones backed by data.
$PUMP First, check participation intraday: 15m volume is 5.26M, aggressive buys account for 30.9%, and price/OI are -1.55% / -2.13%. It’s fine to watch the action in the community, but traders should take a closer look at whether volume can hold. Volume ranking near the top shows that buyers are stepping in, but we still need the market to show us the direction.
$SOL 15m price/OI are -0.07% / +0.06%, open interest is 998.47M, and the funding rate is +0.0086%. Thin liquidity overhead is a condition, not a promise—don’t finish the market’s sentence for it. Low push costs are just road conditions; follow-through in volume is the accelerator.
$ZEC 15m price/OI are -0.77% / -0.97%, volume is 12.17M, and aggressive buys account for 64.9%. If you’re already in, watch the pullback; only if support holds does the order-book advantage become real. An easy road is just a condition—whether price moves still depends on aggressive trading.
There are plenty of intraday signals; let’s start with the ones backed by data.
$PUMP First, check participation intraday: 15m volume is 5.26M, aggressive buys account for 30.9%, and price/OI are -1.55% / -2.13%. It’s fine to watch the action in the community, but traders should take a closer look at whether volume can hold. Volume ranking near the top shows that buyers are stepping in, but we still need the market to show us the direction.
$SOL 15m price/OI are -0.07% / +0.06%, open interest is 998.47M, and the funding rate is +0.0086%. Thin liquidity overhead is a condition, not a promise—don’t finish the market’s sentence for it. Low push costs are just road conditions; follow-through in volume is the accelerator.
$ZEC 15m price/OI are -0.77% / -0.97%, volume is 12.17M, and aggressive buys account for 64.9%. If you’re already in, watch the pullback; only if support holds does the order-book advantage become real. An easy road is just a condition—whether price moves still depends on aggressive trading.
$PUMP First, check participation intraday: 15m volume is 5.26M, aggressive buys account for 30.9%, and price/OI are -1.55% / -2.13%. It’s fine to watch the action in the community, but traders should take a closer look at whether volume can hold. Volume ranking near the top shows that buyers are stepping in, but we still need the market to show us the direction.
$SOL 15m price/OI are -0.07% / +0.06%, open interest is 998.47M, and the funding rate is +0.0086%. Thin liquidity overhead is a condition, not a promise—don’t finish the market’s sentence for it. Low push costs are just road conditions; follow-through in volume is the accelerator.
$ZEC 15m price/OI are -0.77% / -0.97%, volume is 12.17M, and aggressive buys account for 64.9%. If you’re already in, watch the pullback; only if support holds does the order-book advantage become real. An easy road is just a condition—whether price moves still depends on aggressive trading.
175
·
--
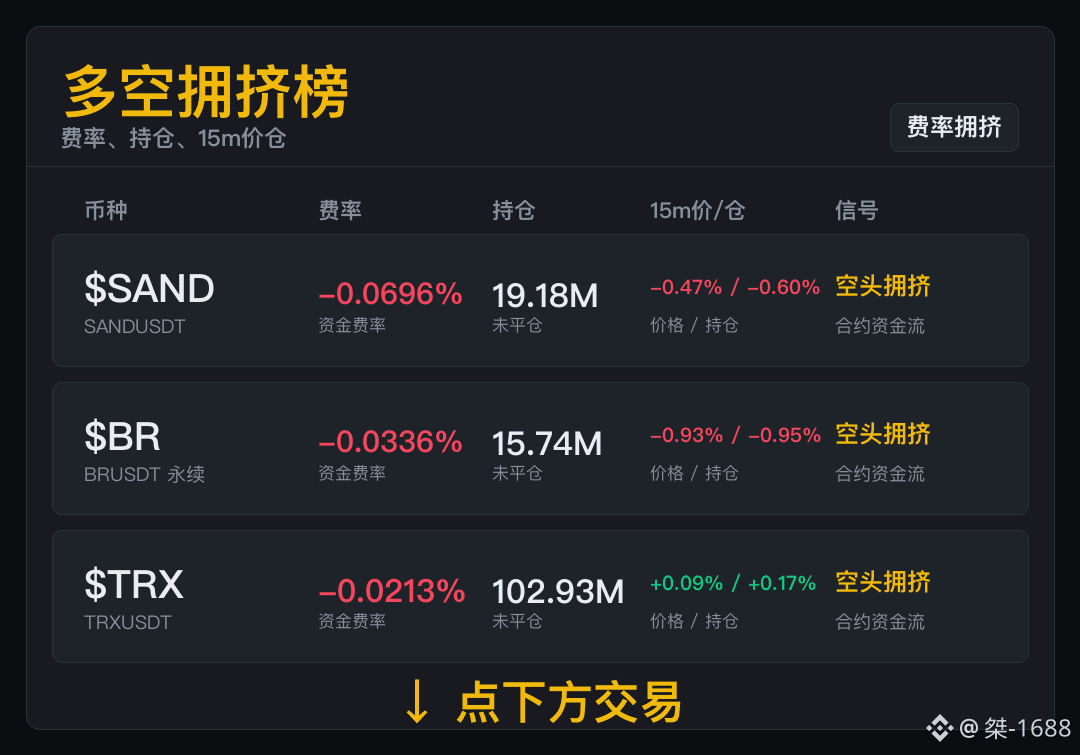
Don’t let price moves set the tone first—funding rates and open interest reveal sentiment earlier.
$SAND Funding rate: -0.0696%, with open interest at 19.18M. The key thing to watch here is whether positions keep building. If you’re looking to catch a rebound, check trading volume first; don’t rely on a negative funding rate alone. There are plenty of shorts, but if they can’t push the price down, they’ll start to feel uncomfortable.
$BR Here’s the derivatives market temperature: funding rate -0.0336%, open interest 15.74M, and short-term price/OI changes of -0.93% / -0.95%. When shorts are paying to hold their positions, even a slight price hold can put them under pressure. It’s not that you can’t be bearish, but chasing shorts is no longer so easy.
$TRX Here’s the derivatives market temperature: funding rate -0.0213%, open interest 102.93M, and short-term price/OI changes of +0.09% / +0.17%. If you’re short, first see whether you can still keep the price down. If not, don’t stubbornly fight the carrying costs. When too many people turn bearish, the biggest risk is that the price stops falling.
Don’t let price moves set the tone first—funding rates and open interest reveal sentiment earlier.
$SAND Funding rate: -0.0696%, with open interest at 19.18M. The key thing to watch here is whether positions keep building. If you’re looking to catch a rebound, check trading volume first; don’t rely on a negative funding rate alone. There are plenty of shorts, but if they can’t push the price down, they’ll start to feel uncomfortable.
$BR Here’s the derivatives market temperature: funding rate -0.0336%, open interest 15.74M, and short-term price/OI changes of -0.93% / -0.95%. When shorts are paying to hold their positions, even a slight price hold can put them under pressure. It’s not that you can’t be bearish, but chasing shorts is no longer so easy.
$TRX Here’s the derivatives market temperature: funding rate -0.0213%, open interest 102.93M, and short-term price/OI changes of +0.09% / +0.17%. If you’re short, first see whether you can still keep the price down. If not, don’t stubbornly fight the carrying costs. When too many people turn bearish, the biggest risk is that the price stops falling.
$SAND Funding rate: -0.0696%, with open interest at 19.18M. The key thing to watch here is whether positions keep building. If you’re looking to catch a rebound, check trading volume first; don’t rely on a negative funding rate alone. There are plenty of shorts, but if they can’t push the price down, they’ll start to feel uncomfortable.
$BR Here’s the derivatives market temperature: funding rate -0.0336%, open interest 15.74M, and short-term price/OI changes of -0.93% / -0.95%. When shorts are paying to hold their positions, even a slight price hold can put them under pressure. It’s not that you can’t be bearish, but chasing shorts is no longer so easy.
$TRX Here’s the derivatives market temperature: funding rate -0.0213%, open interest 102.93M, and short-term price/OI changes of +0.09% / +0.17%. If you’re short, first see whether you can still keep the price down. If not, don’t stubbornly fight the carrying costs. When too many people turn bearish, the biggest risk is that the price stops falling.
146
·
--
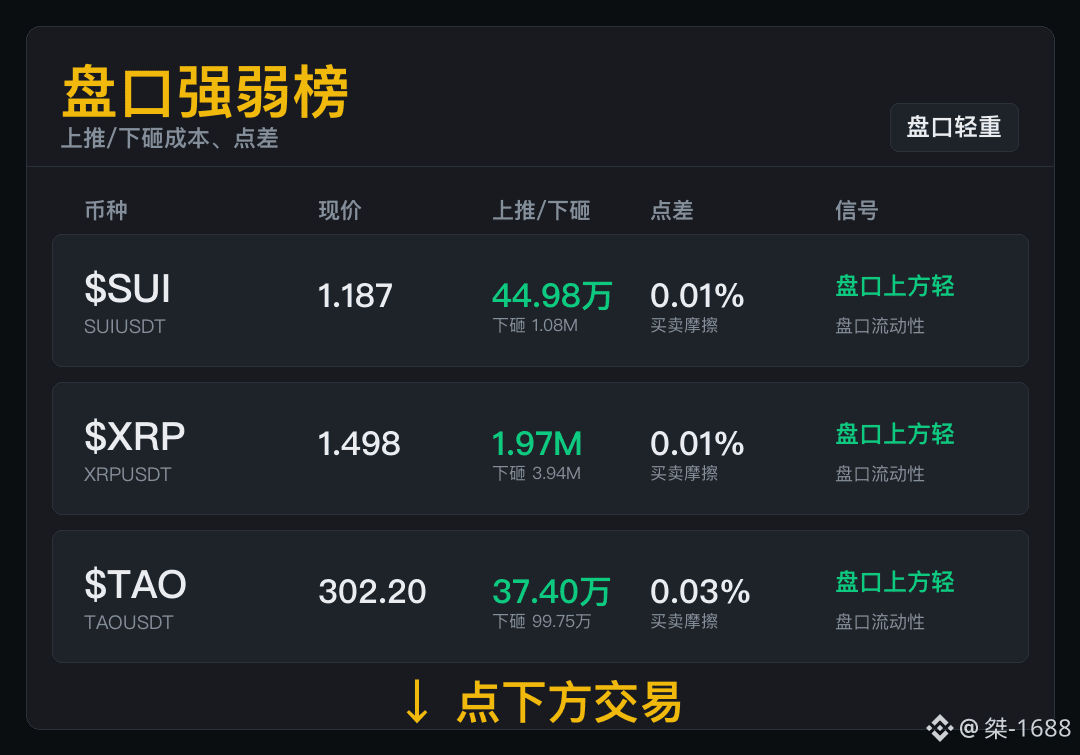
Before deciding whether short-term trading looks promising, check the order-book conditions.
$SUI Spot turnover: 65.81M; cost to push the price up / drive it down: 449.8K / 1.08M. If you're thinking of chasing, check aggressive buying first—don't just look at how clear the path seems. Thin sell-side liquidity means conditions are favorable; it doesn't mean the price has already moved up.
$XRP Cost to push the price up: 1.97M; cost to drive it down: 3.94M; spread: 0.01%. When the order book is thin, the biggest risk is acting too quickly. Check volume before placing an order. A thin order book can tempt you to act fast, but sustained trading is what gives you a reason to keep watching.
$TAO Spread: 0.03%; cost to push the price up: 374K. First, see whether trading volume can follow through. If you're already holding a position, watch the pullback—a pullback with volume is more reassuring. Check the spread before chasing: once it widens, even a low-cost move up can get expensive.
Before deciding whether short-term trading looks promising, check the order-book conditions.
$SUI Spot turnover: 65.81M; cost to push the price up / drive it down: 449.8K / 1.08M. If you're thinking of chasing, check aggressive buying first—don't just look at how clear the path seems. Thin sell-side liquidity means conditions are favorable; it doesn't mean the price has already moved up.
$XRP Cost to push the price up: 1.97M; cost to drive it down: 3.94M; spread: 0.01%. When the order book is thin, the biggest risk is acting too quickly. Check volume before placing an order. A thin order book can tempt you to act fast, but sustained trading is what gives you a reason to keep watching.
$TAO Spread: 0.03%; cost to push the price up: 374K. First, see whether trading volume can follow through. If you're already holding a position, watch the pullback—a pullback with volume is more reassuring. Check the spread before chasing: once it widens, even a low-cost move up can get expensive.
$SUI Spot turnover: 65.81M; cost to push the price up / drive it down: 449.8K / 1.08M. If you're thinking of chasing, check aggressive buying first—don't just look at how clear the path seems. Thin sell-side liquidity means conditions are favorable; it doesn't mean the price has already moved up.
$XRP Cost to push the price up: 1.97M; cost to drive it down: 3.94M; spread: 0.01%. When the order book is thin, the biggest risk is acting too quickly. Check volume before placing an order. A thin order book can tempt you to act fast, but sustained trading is what gives you a reason to keep watching.
$TAO Spread: 0.03%; cost to push the price up: 374K. First, see whether trading volume can follow through. If you're already holding a position, watch the pullback—a pullback with volume is more reassuring. Check the spread before chasing: once it widens, even a low-cost move up can get expensive.
189
·
--
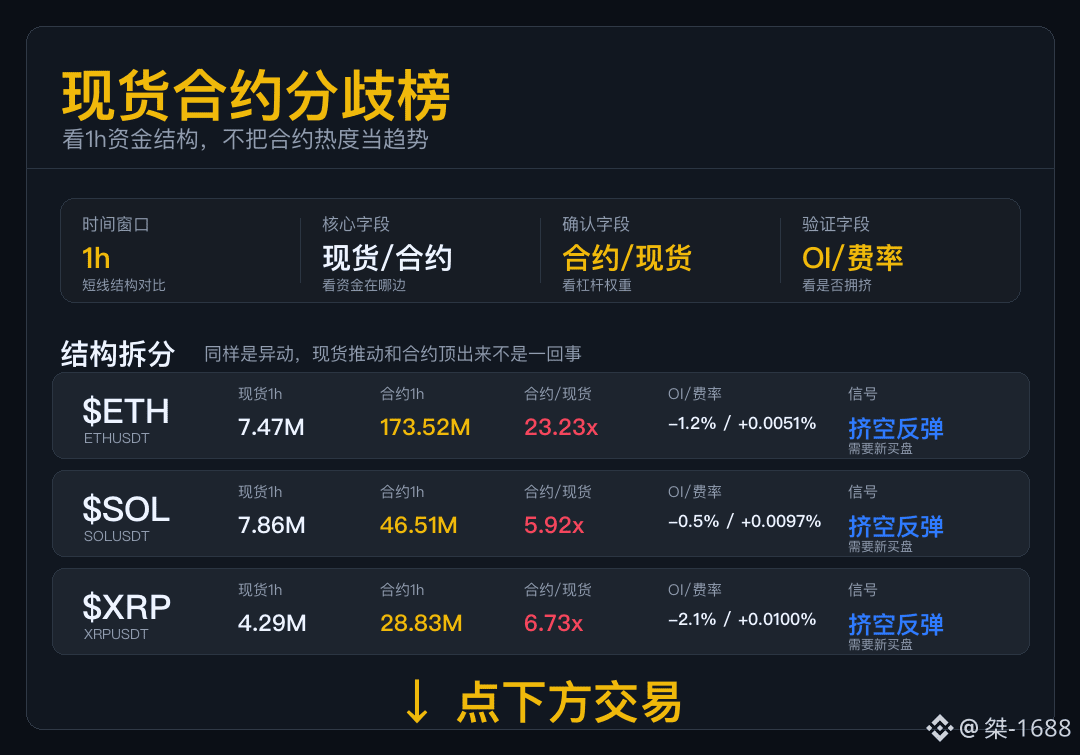
Spot–Futures Divergence Ranking
Over the past hour, first separate the sources of buying pressure: is spot following through, or are futures driving the pace?
$ETH Short-covering explains the speed of this move, but for it to continue, we’ll need to see whether spot buying and new positions step in.
$SOL Positions are declining while prices rebound, which looks more like shorts covering first. Without fresh buying afterward, the momentum could easily fade.
$XRP This rebound has some short-covering behind it; it can’t go far on short-covering alone.
Shorts covering first explains the speed. Whether prices can hold from here depends on continued buying support.
Spot–Futures Divergence Ranking
Over the past hour, first separate the sources of buying pressure: is spot following through, or are futures driving the pace?
$ETH Short-covering explains the speed of this move, but for it to continue, we’ll need to see whether spot buying and new positions step in.
$SOL Positions are declining while prices rebound, which looks more like shorts covering first. Without fresh buying afterward, the momentum could easily fade.
$XRP This rebound has some short-covering behind it; it can’t go far on short-covering alone.
Shorts covering first explains the speed. Whether prices can hold from here depends on continued buying support.
Over the past hour, first separate the sources of buying pressure: is spot following through, or are futures driving the pace?
$ETH Short-covering explains the speed of this move, but for it to continue, we’ll need to see whether spot buying and new positions step in.
$SOL Positions are declining while prices rebound, which looks more like shorts covering first. Without fresh buying afterward, the momentum could easily fade.
$XRP This rebound has some short-covering behind it; it can’t go far on short-covering alone.
Shorts covering first explains the speed. Whether prices can hold from here depends on continued buying support.
229
·
--
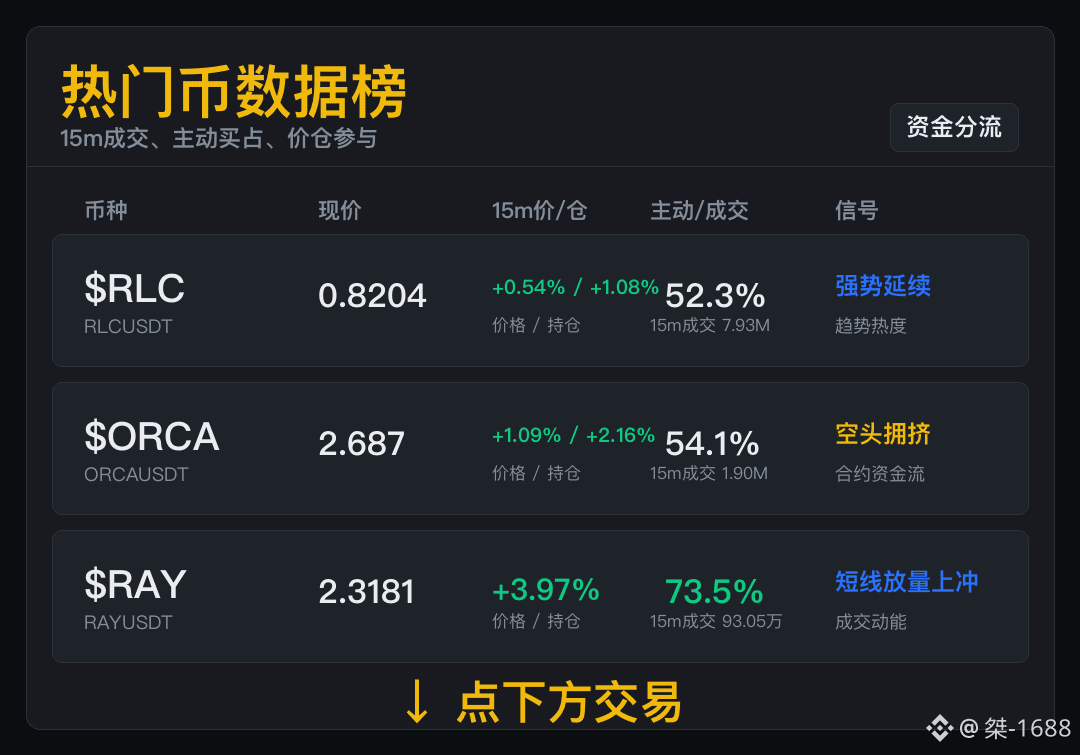
There’s plenty of intraday buzz, so let’s start with a few picks backed by solid data.
$RLC : The focus this round is 15m participation: volume was 7.93M, taker buys accounted for 52.3%, and price/open interest were +0.54% / +1.08%. Setups like this can make you regret not buying—and can also tempt you to chase right at the top. There’s active trading now; whether it can continue depends on whether buyers are still willing to step in during the next leg.
$ORCA : Funding rate is -0.0539%, open interest is 11.04M, and 15m volume is 1.90M. If you’re chasing a short, first see whether it can break lower. If it can’t, don’t stubbornly fight the cost of your position. A negative funding rate isn’t a reason to buy the dip, but it does mean short sellers need to be more selective about their entry.
$RAY : The focus this round is 15m participation: volume was 930,500, taker buys accounted for 73.5%, and the 15m price change was +3.97%. It’s normal to notice the buzz, but the next leg needs to have volume behind it—not just noise. Leading in volume suggests liquidity is there; next, watch whether the capital sticks around.
There’s plenty of intraday buzz, so let’s start with a few picks backed by solid data.
$RLC : The focus this round is 15m participation: volume was 7.93M, taker buys accounted for 52.3%, and price/open interest were +0.54% / +1.08%. Setups like this can make you regret not buying—and can also tempt you to chase right at the top. There’s active trading now; whether it can continue depends on whether buyers are still willing to step in during the next leg.
$ORCA : Funding rate is -0.0539%, open interest is 11.04M, and 15m volume is 1.90M. If you’re chasing a short, first see whether it can break lower. If it can’t, don’t stubbornly fight the cost of your position. A negative funding rate isn’t a reason to buy the dip, but it does mean short sellers need to be more selective about their entry.
$RAY : The focus this round is 15m participation: volume was 930,500, taker buys accounted for 73.5%, and the 15m price change was +3.97%. It’s normal to notice the buzz, but the next leg needs to have volume behind it—not just noise. Leading in volume suggests liquidity is there; next, watch whether the capital sticks around.
$RLC : The focus this round is 15m participation: volume was 7.93M, taker buys accounted for 52.3%, and price/open interest were +0.54% / +1.08%. Setups like this can make you regret not buying—and can also tempt you to chase right at the top. There’s active trading now; whether it can continue depends on whether buyers are still willing to step in during the next leg.
$ORCA : Funding rate is -0.0539%, open interest is 11.04M, and 15m volume is 1.90M. If you’re chasing a short, first see whether it can break lower. If it can’t, don’t stubbornly fight the cost of your position. A negative funding rate isn’t a reason to buy the dip, but it does mean short sellers need to be more selective about their entry.
$RAY : The focus this round is 15m participation: volume was 930,500, taker buys accounted for 73.5%, and the 15m price change was +3.97%. It’s normal to notice the buzz, but the next leg needs to have volume behind it—not just noise. Leading in volume suggests liquidity is there; next, watch whether the capital sticks around.
192
·
--
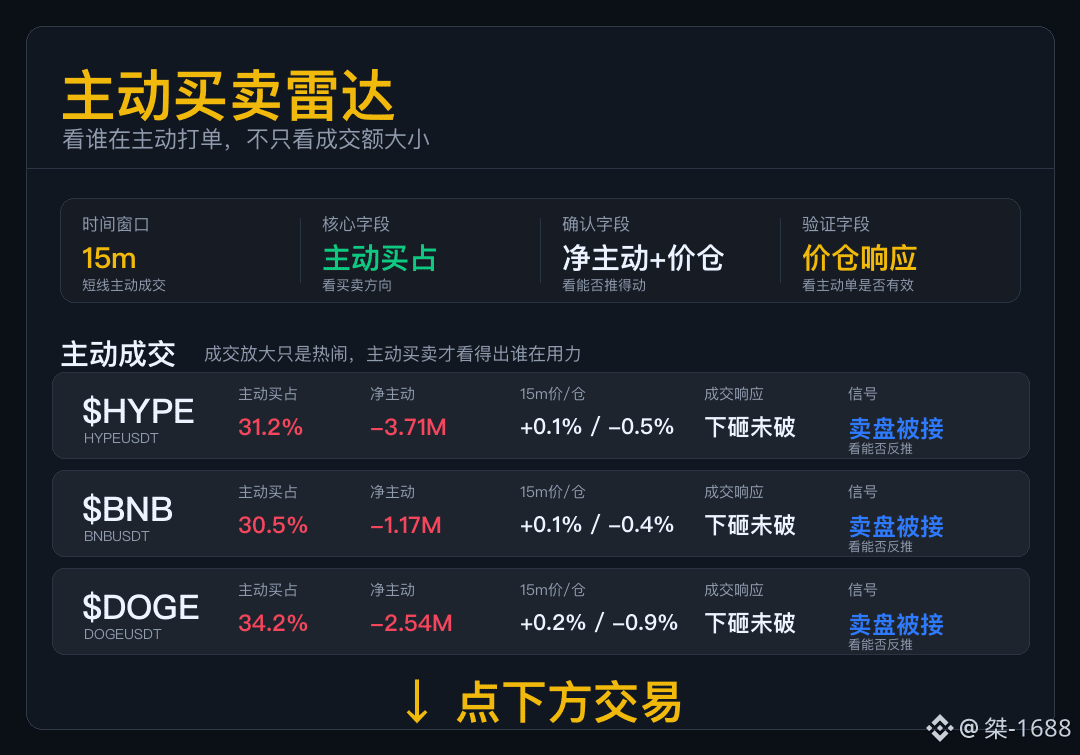
Aggressive Buy/Sell Radar
Don’t just look at trading volume. Today, this set focuses on whether aggressive orders are moving the market.
$HYPE Sellers pushed hard but failed to break through. For now, expect short-term consolidation and absorption; don’t rush to treat it as a breakdown.
$BNB The market held steady after sell orders hit. The short-term trend isn’t one-sidedly weak; next, watch whether buyers can push back.
$DOGE Sell orders hit but failed to break through, suggesting there’s still buying support below. Take it slow before chasing shorts.
Sell orders drove the price down but failed to break through, suggesting buyers are stepping in below. Next, watch whether that support can push back.
Aggressive Buy/Sell Radar
Don’t just look at trading volume. Today, this set focuses on whether aggressive orders are moving the market.
$HYPE Sellers pushed hard but failed to break through. For now, expect short-term consolidation and absorption; don’t rush to treat it as a breakdown.
$BNB The market held steady after sell orders hit. The short-term trend isn’t one-sidedly weak; next, watch whether buyers can push back.
$DOGE Sell orders hit but failed to break through, suggesting there’s still buying support below. Take it slow before chasing shorts.
Sell orders drove the price down but failed to break through, suggesting buyers are stepping in below. Next, watch whether that support can push back.
Don’t just look at trading volume. Today, this set focuses on whether aggressive orders are moving the market.
$HYPE Sellers pushed hard but failed to break through. For now, expect short-term consolidation and absorption; don’t rush to treat it as a breakdown.
$BNB The market held steady after sell orders hit. The short-term trend isn’t one-sidedly weak; next, watch whether buyers can push back.
$DOGE Sell orders hit but failed to break through, suggesting there’s still buying support below. Take it slow before chasing shorts.
Sell orders drove the price down but failed to break through, suggesting buyers are stepping in below. Next, watch whether that support can push back.
177
·
--
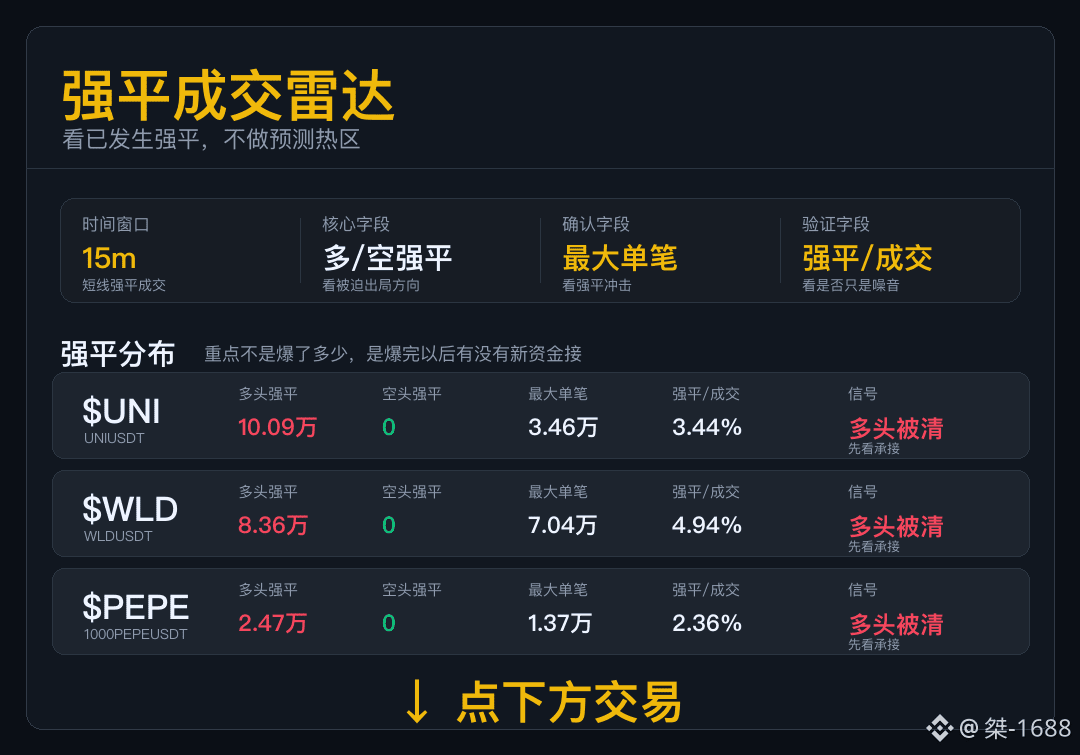
Liquidation Trading Radar
With liquidation data, first look at who was forced out.
$UNI Longs were hit harder. First, watch whether buyers step in later to catch the price.
$WLD Long liquidations dominated. First, see whether buyers step in after the drop to bring the price back up. Don’t rush to treat the first bounce as a recovery.
$PEPE Long liquidations show that leverage was flushed out first. Whether the price can stabilize depends on buying support after the liquidations.
After longs are wiped out, whether the rebound can hold depends on whether new buyers step in.
Liquidation Trading Radar
With liquidation data, first look at who was forced out.
$UNI Longs were hit harder. First, watch whether buyers step in later to catch the price.
$WLD Long liquidations dominated. First, see whether buyers step in after the drop to bring the price back up. Don’t rush to treat the first bounce as a recovery.
$PEPE Long liquidations show that leverage was flushed out first. Whether the price can stabilize depends on buying support after the liquidations.
After longs are wiped out, whether the rebound can hold depends on whether new buyers step in.
With liquidation data, first look at who was forced out.
$UNI Longs were hit harder. First, watch whether buyers step in later to catch the price.
$WLD Long liquidations dominated. First, see whether buyers step in after the drop to bring the price back up. Don’t rush to treat the first bounce as a recovery.
$PEPE Long liquidations show that leverage was flushed out first. Whether the price can stabilize depends on buying support after the liquidations.
After longs are wiped out, whether the rebound can hold depends on whether new buyers step in.
1
246
·
--
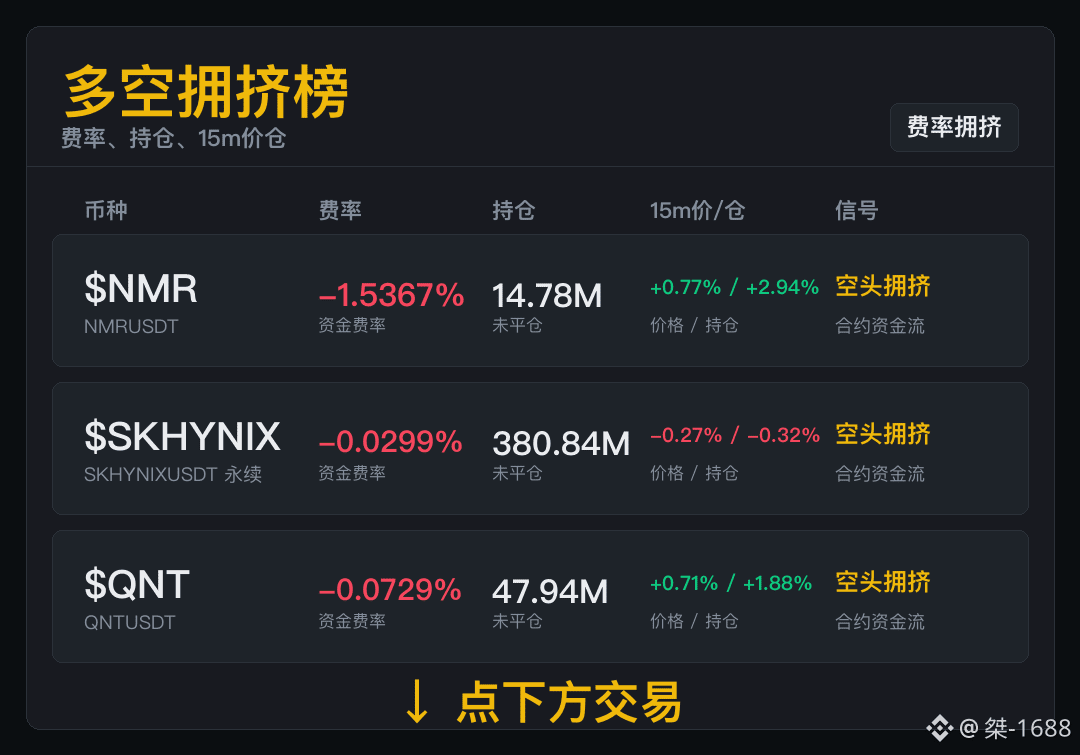
For futures sentiment, first look at who’s paying.
$NMR funding rate: -1.5367%, open interest: 14.78M, 15m price/OI: +0.77% / +2.94%. When the market looks like this, short covering is usually swift once it starts. That doesn’t mean an immediate reversal, but shorts are already having a harder time.
$SKHYNIX For crowding, first look at three things: funding rate: -0.0299%, open interest: 380.84M, 15m price/OI: -0.27% / -0.32%. Those looking to buy the rebound shouldn’t rush either—first see whether the price can really hold. If shorts stop pressing, their positions will start to feel the strain too.
$QNT Funding rate: -0.0729%, 15m futures volume: 5.18M. First see whether crowding continues to build. Anyone chasing shorts should calculate the cost first; as the trade gets more crowded, there’s less room for error. Shorts are paying to hold their positions. If the price doesn’t break down, they’ll feel increasingly uncomfortable.
For futures sentiment, first look at who’s paying.
$NMR funding rate: -1.5367%, open interest: 14.78M, 15m price/OI: +0.77% / +2.94%. When the market looks like this, short covering is usually swift once it starts. That doesn’t mean an immediate reversal, but shorts are already having a harder time.
$SKHYNIX For crowding, first look at three things: funding rate: -0.0299%, open interest: 380.84M, 15m price/OI: -0.27% / -0.32%. Those looking to buy the rebound shouldn’t rush either—first see whether the price can really hold. If shorts stop pressing, their positions will start to feel the strain too.
$QNT Funding rate: -0.0729%, 15m futures volume: 5.18M. First see whether crowding continues to build. Anyone chasing shorts should calculate the cost first; as the trade gets more crowded, there’s less room for error. Shorts are paying to hold their positions. If the price doesn’t break down, they’ll feel increasingly uncomfortable.
$NMR funding rate: -1.5367%, open interest: 14.78M, 15m price/OI: +0.77% / +2.94%. When the market looks like this, short covering is usually swift once it starts. That doesn’t mean an immediate reversal, but shorts are already having a harder time.
$SKHYNIX For crowding, first look at three things: funding rate: -0.0299%, open interest: 380.84M, 15m price/OI: -0.27% / -0.32%. Those looking to buy the rebound shouldn’t rush either—first see whether the price can really hold. If shorts stop pressing, their positions will start to feel the strain too.
$QNT Funding rate: -0.0729%, 15m futures volume: 5.18M. First see whether crowding continues to build. Anyone chasing shorts should calculate the cost first; as the trade gets more crowded, there’s less room for error. Shorts are paying to hold their positions. If the price doesn’t break down, they’ll feel increasingly uncomfortable.
253
·
--
Liquidation Volume Radar
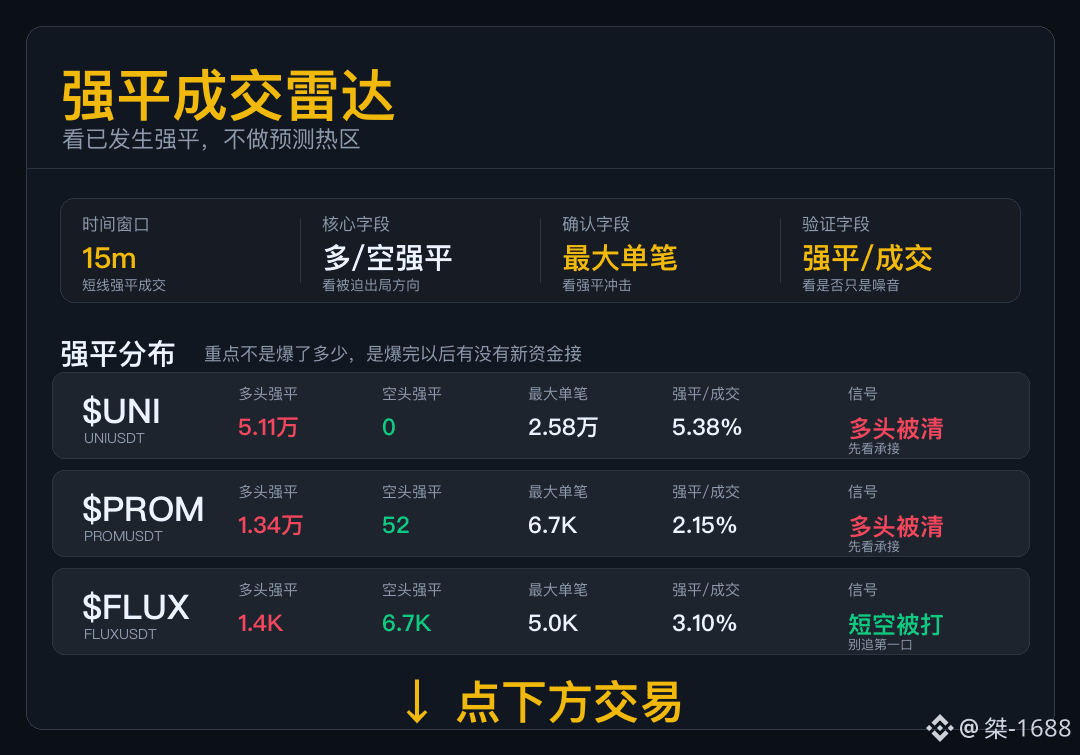
With liquidation data, first look at who was forced out.
$UNI : Longs took heavier losses. Next, watch for buyers to step in and catch the price.
$PROM : Long positions accounted for most of the liquidations. The higher liquidations are as a share of trading volume, the more directly they affect price during that period.
$FLUX : Shorts were forced out in concentrated fashion. We can say a squeeze occurred, but shouldn’t describe it outright as the start of a trend.
When liquidation patterns diverge, watch how trading on each side recovers afterward; it’s not something that can be summed up in one sentence.
Liquidation Volume Radar
With liquidation data, first look at who was forced out.
$UNI : Longs took heavier losses. Next, watch for buyers to step in and catch the price.
$PROM : Long positions accounted for most of the liquidations. The higher liquidations are as a share of trading volume, the more directly they affect price during that period.
$FLUX : Shorts were forced out in concentrated fashion. We can say a squeeze occurred, but shouldn’t describe it outright as the start of a trend.
When liquidation patterns diverge, watch how trading on each side recovers afterward; it’s not something that can be summed up in one sentence.
With liquidation data, first look at who was forced out.
$UNI : Longs took heavier losses. Next, watch for buyers to step in and catch the price.
$PROM : Long positions accounted for most of the liquidations. The higher liquidations are as a share of trading volume, the more directly they affect price during that period.
$FLUX : Shorts were forced out in concentrated fashion. We can say a squeeze occurred, but shouldn’t describe it outright as the start of a trend.
When liquidation patterns diverge, watch how trading on each side recovers afterward; it’s not something that can be summed up in one sentence.
1
291
·
--
Spot–Contract Divergence Rankings
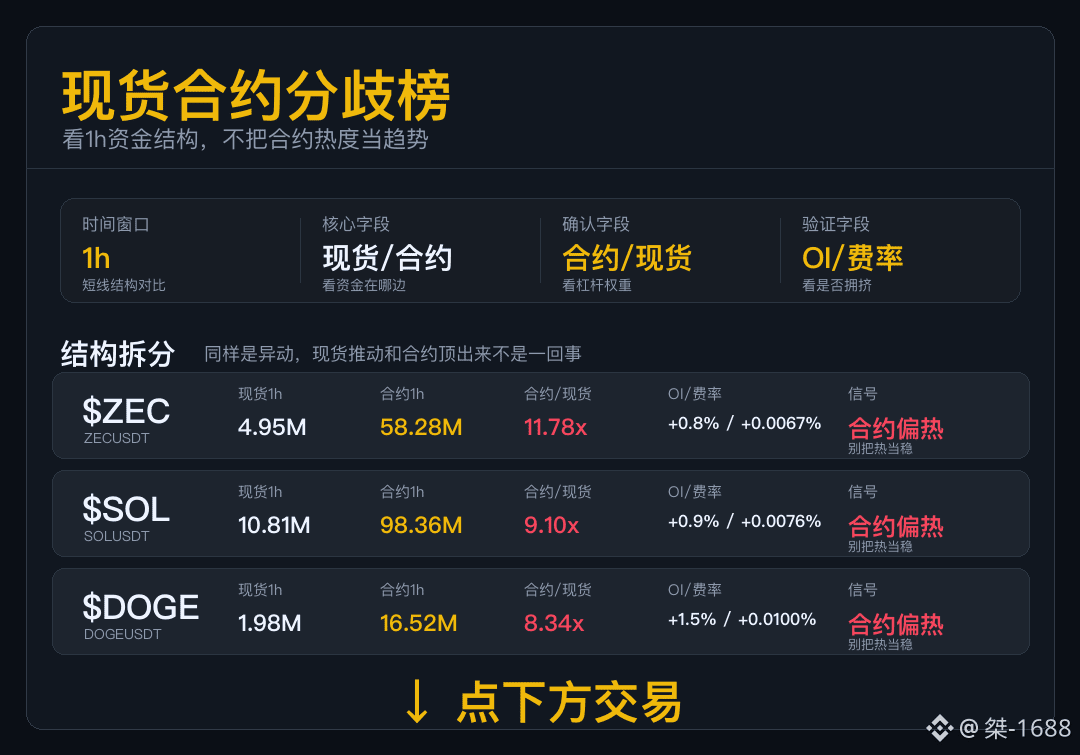
Over the past 1 hour, first break down where the capital is coming from: is spot following, or are contracts setting the pace?
$ZEC The contract market got trading volume moving first, while spot participation was relatively limited. The initial burst showed more speed than stability.
$SOL This move looks more like contracts taking an early lead. There’s short-term momentum, but we’ll need to see whether spot trading volume can sustain the pace.
$DOGE Contract-market activity has picked up. The question isn’t whether prices can move, but whether spot buyers are joining in.
Rising funding rates indicate that holding costs are changing; trading activity will confirm the price direction.
Spot–Contract Divergence Rankings
Over the past 1 hour, first break down where the capital is coming from: is spot following, or are contracts setting the pace?
$ZEC The contract market got trading volume moving first, while spot participation was relatively limited. The initial burst showed more speed than stability.
$SOL This move looks more like contracts taking an early lead. There’s short-term momentum, but we’ll need to see whether spot trading volume can sustain the pace.
$DOGE Contract-market activity has picked up. The question isn’t whether prices can move, but whether spot buyers are joining in.
Rising funding rates indicate that holding costs are changing; trading activity will confirm the price direction.
Over the past 1 hour, first break down where the capital is coming from: is spot following, or are contracts setting the pace?
$ZEC The contract market got trading volume moving first, while spot participation was relatively limited. The initial burst showed more speed than stability.
$SOL This move looks more like contracts taking an early lead. There’s short-term momentum, but we’ll need to see whether spot trading volume can sustain the pace.
$DOGE Contract-market activity has picked up. The question isn’t whether prices can move, but whether spot buyers are joining in.
Rising funding rates indicate that holding costs are changing; trading activity will confirm the price direction.
244
·
--
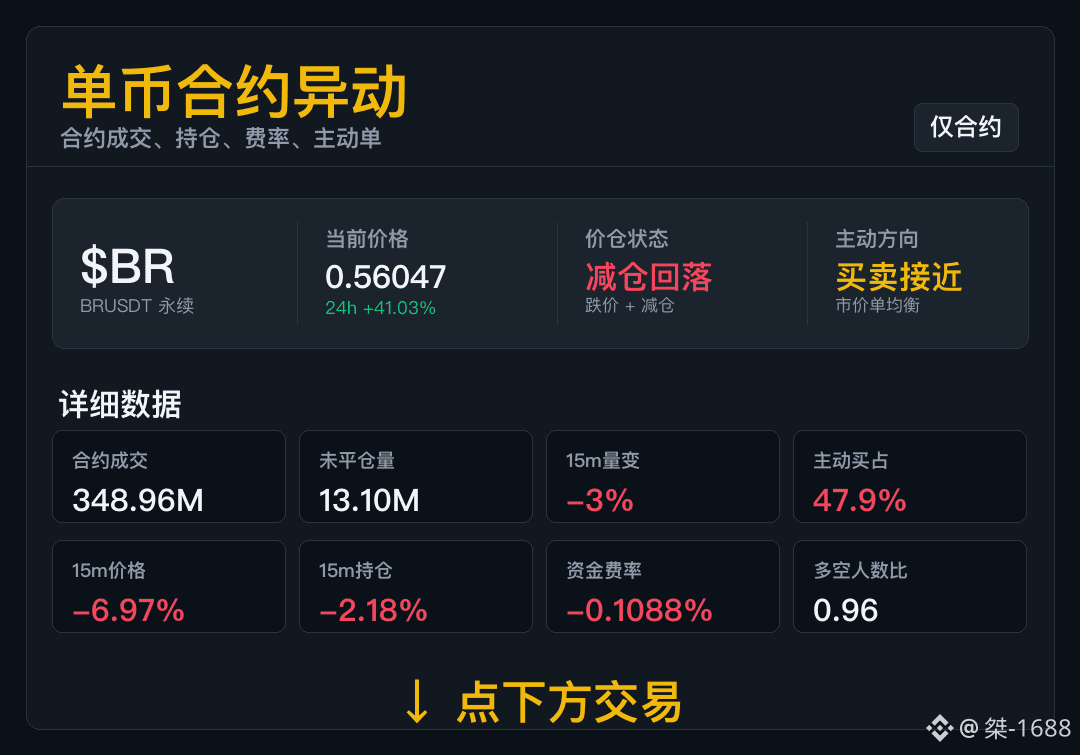
$BR Set the price move aside for a moment and look at who’s adding positions and who’s pulling out.
15m price: -6.97%; open interest: -2.18%. This looks more like a pullback driven by position reduction: open interest has fallen noticeably, while the price remains weak. The futures market is still digesting positions built up earlier.
Aggressive buys account for 47.9%, so the active order flow isn’t particularly extreme. The funding rate is notably bearish, but continued short pressure comes at a cost.
Next, watch for positions being added again as prices fall. A decline without growing open interest looks more like positions being closed than a fresh short attack.
$BR Set the price move aside for a moment and look at who’s adding positions and who’s pulling out.
15m price: -6.97%; open interest: -2.18%. This looks more like a pullback driven by position reduction: open interest has fallen noticeably, while the price remains weak. The futures market is still digesting positions built up earlier.
Aggressive buys account for 47.9%, so the active order flow isn’t particularly extreme. The funding rate is notably bearish, but continued short pressure comes at a cost.
Next, watch for positions being added again as prices fall. A decline without growing open interest looks more like positions being closed than a fresh short attack.
15m price: -6.97%; open interest: -2.18%. This looks more like a pullback driven by position reduction: open interest has fallen noticeably, while the price remains weak. The futures market is still digesting positions built up earlier.
Aggressive buys account for 47.9%, so the active order flow isn’t particularly extreme. The funding rate is notably bearish, but continued short pressure comes at a cost.
Next, watch for positions being added again as prices fall. A decline without growing open interest looks more like positions being closed than a fresh short attack.
163
·
--
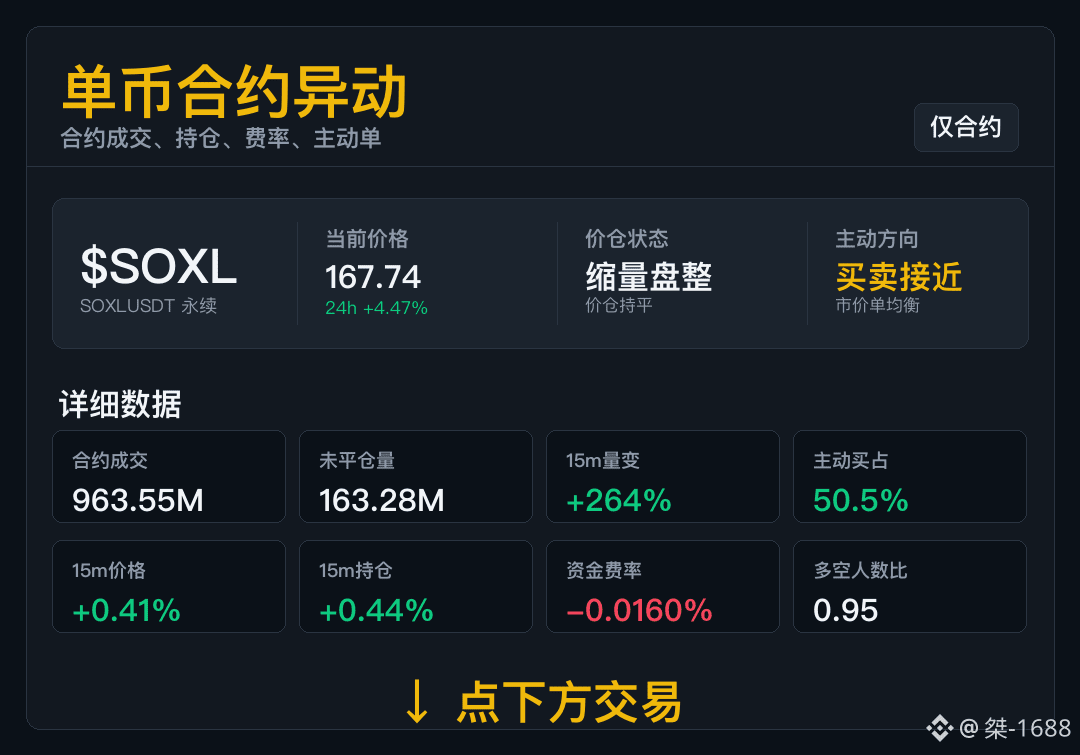
$SOXL Unusual activity has appeared in the contract market. First, let’s see whether price or open interest is driving the move.
Over 15m, price is up 0.41% and open interest is up 0.44%. For now, this looks more like low-volume consolidation: the market hasn’t given a strong signal yet, so don’t read too much into small moves.
Taker buys account for 50.5%, with buying and selling nearly balanced. The long-to-short ratio is 0.95, suggesting some bias in sentiment, but nothing extreme yet.
While the market is still range-bound, focus less on the ups and downs and wait for a genuine surge in volume.
$SOXL Unusual activity has appeared in the contract market. First, let’s see whether price or open interest is driving the move.
Over 15m, price is up 0.41% and open interest is up 0.44%. For now, this looks more like low-volume consolidation: the market hasn’t given a strong signal yet, so don’t read too much into small moves.
Taker buys account for 50.5%, with buying and selling nearly balanced. The long-to-short ratio is 0.95, suggesting some bias in sentiment, but nothing extreme yet.
While the market is still range-bound, focus less on the ups and downs and wait for a genuine surge in volume.
Over 15m, price is up 0.41% and open interest is up 0.44%. For now, this looks more like low-volume consolidation: the market hasn’t given a strong signal yet, so don’t read too much into small moves.
Taker buys account for 50.5%, with buying and selling nearly balanced. The long-to-short ratio is 0.95, suggesting some bias in sentiment, but nothing extreme yet.
While the market is still range-bound, focus less on the ups and downs and wait for a genuine surge in volume.
171
·
--
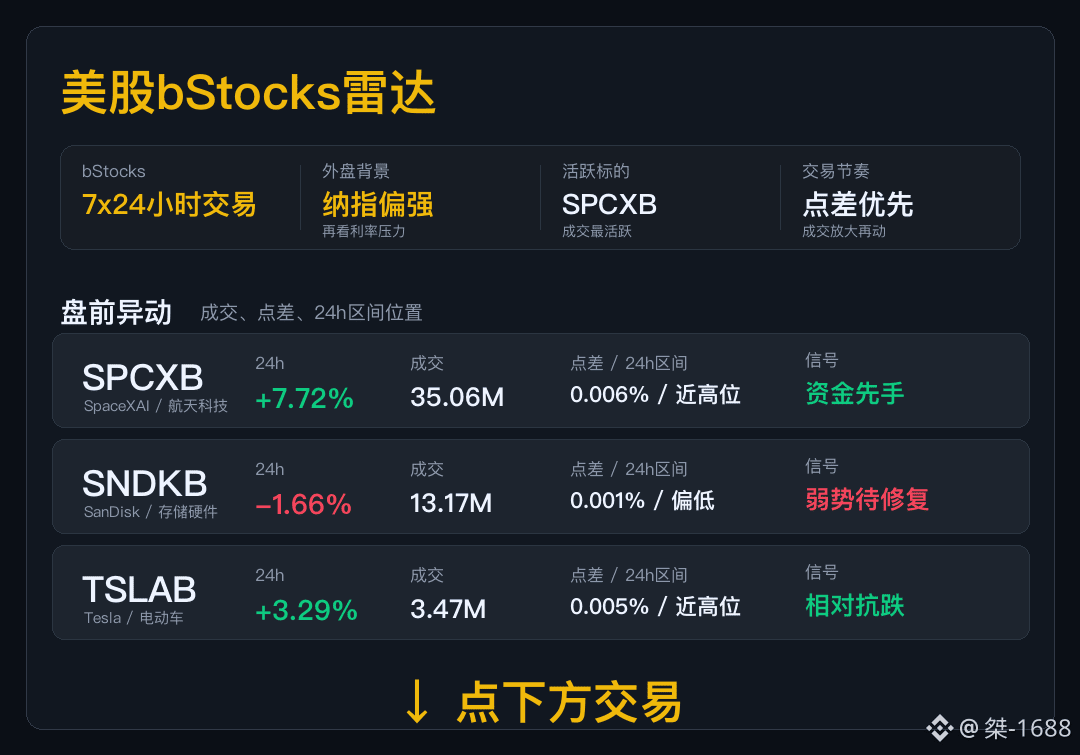
U.S. Stocks bStocks Radar
Macro first: Nasdaq futures +0.60%, VIX 15.3, and 10-year U.S. Treasury yields around 5.28%. The broader market backdrop looks somewhat warmer tonight, with risk appetite recovering, but we still need to see whether trading activity broadens.
Main trading theme: Money is moving first into the SpaceX AI tech theme. The first thing to watch is whether trading volume in this theme continues to expand.
$SPCXB had the most active premarket trading, with buyers already stepping in early. The price is near its 24-hour high, and volume is also solid. Turnover at elevated levels is more worth watching than the percentage gain.
$SNDKB has yet to show a premarket recovery, so don't mistake a low price for an opportunity. Premarket volume is still there, but don't focus only on the buzz—the subsequent direction will determine whether the move can continue.
$TSLAB showed premarket strength, but check for support before chasing. Volume remains elevated, and the market isn't cold, but the risk-reward profile is already different from that at lower levels.
U.S. Stocks bStocks Radar
Macro first: Nasdaq futures +0.60%, VIX 15.3, and 10-year U.S. Treasury yields around 5.28%. The broader market backdrop looks somewhat warmer tonight, with risk appetite recovering, but we still need to see whether trading activity broadens.
Main trading theme: Money is moving first into the SpaceX AI tech theme. The first thing to watch is whether trading volume in this theme continues to expand.
$SPCXB had the most active premarket trading, with buyers already stepping in early. The price is near its 24-hour high, and volume is also solid. Turnover at elevated levels is more worth watching than the percentage gain.
$SNDKB has yet to show a premarket recovery, so don't mistake a low price for an opportunity. Premarket volume is still there, but don't focus only on the buzz—the subsequent direction will determine whether the move can continue.
$TSLAB showed premarket strength, but check for support before chasing. Volume remains elevated, and the market isn't cold, but the risk-reward profile is already different from that at lower levels.
Macro first: Nasdaq futures +0.60%, VIX 15.3, and 10-year U.S. Treasury yields around 5.28%. The broader market backdrop looks somewhat warmer tonight, with risk appetite recovering, but we still need to see whether trading activity broadens.
Main trading theme: Money is moving first into the SpaceX AI tech theme. The first thing to watch is whether trading volume in this theme continues to expand.
$SPCXB had the most active premarket trading, with buyers already stepping in early. The price is near its 24-hour high, and volume is also solid. Turnover at elevated levels is more worth watching than the percentage gain.
$SNDKB has yet to show a premarket recovery, so don't mistake a low price for an opportunity. Premarket volume is still there, but don't focus only on the buzz—the subsequent direction will determine whether the move can continue.
$TSLAB showed premarket strength, but check for support before chasing. Volume remains elevated, and the market isn't cold, but the risk-reward profile is already different from that at lower levels.
268
·
--
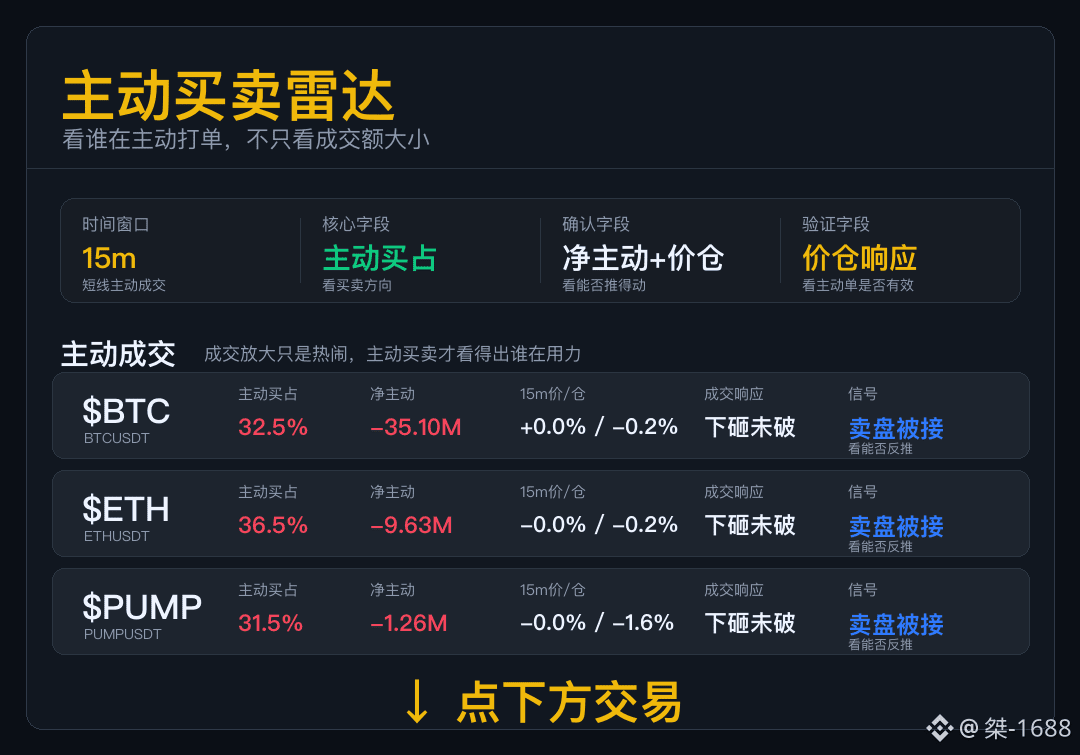
Aggressive Order Flow Radar
Don’t just look at trading volume. Today’s focus is whether aggressive orders are moving the market.
$BTC Sell orders came in, but the price held, suggesting there’s support below. Don’t rush to go short; wait for confirmation in the next move.
$ETH Selling pressure emerged, but the price didn’t break lower, suggesting support is still there. Be careful chasing shorts in this kind of market—you could get caught in a rebound.
$PUMP Sellers are very aggressive, but their selling is having little impact. For now, the market has withstood the pressure.
Sell orders hit the market but were absorbed, suggesting there’s real support below. Next, watch to see whether buyers can strike back.
Aggressive Order Flow Radar
Don’t just look at trading volume. Today’s focus is whether aggressive orders are moving the market.
$BTC Sell orders came in, but the price held, suggesting there’s support below. Don’t rush to go short; wait for confirmation in the next move.
$ETH Selling pressure emerged, but the price didn’t break lower, suggesting support is still there. Be careful chasing shorts in this kind of market—you could get caught in a rebound.
$PUMP Sellers are very aggressive, but their selling is having little impact. For now, the market has withstood the pressure.
Sell orders hit the market but were absorbed, suggesting there’s real support below. Next, watch to see whether buyers can strike back.
Don’t just look at trading volume. Today’s focus is whether aggressive orders are moving the market.
$BTC Sell orders came in, but the price held, suggesting there’s support below. Don’t rush to go short; wait for confirmation in the next move.
$ETH Selling pressure emerged, but the price didn’t break lower, suggesting support is still there. Be careful chasing shorts in this kind of market—you could get caught in a rebound.
$PUMP Sellers are very aggressive, but their selling is having little impact. For now, the market has withstood the pressure.
Sell orders hit the market but were absorbed, suggesting there’s real support below. Next, watch to see whether buyers can strike back.
1
56
·
--
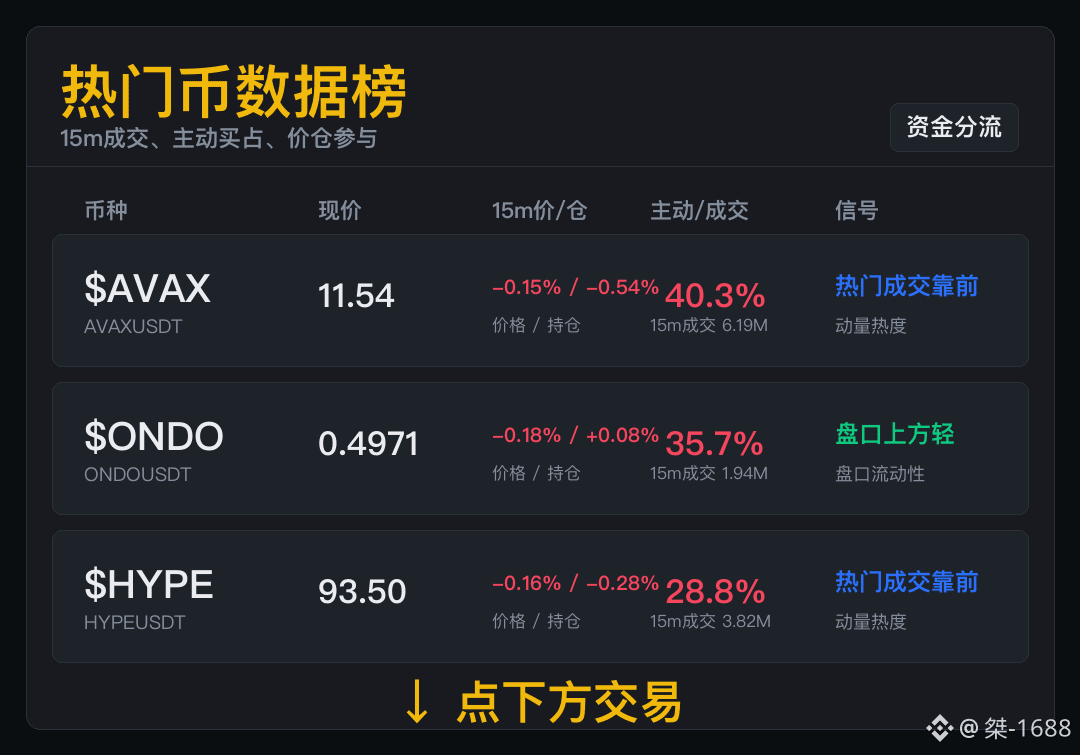
Everything on the screen is moving. Start with the ones showing stronger participation from capital.
$AVAX 15m volume: 6.19M, aggressive buys: 40.3%, price/OI: -0.15% / -0.54%. It’s worth watching this popular market, but don’t let the hype make the decision for you. The buzz is real; what matters next is whether capital keeps flowing in.
$ONDO The focus this time is 15m participation: volume 1.94M, aggressive buys: 35.7%, price/OI: -0.18% / +0.08%. In a market like this, watch aggressive orders instead of just counting limit orders. If volume dries up, the advantage of lighter offers above will be the first to fade.
$HYPE The focus this time is 15m participation: volume 3.82M, aggressive buys: 28.8%, price/OI: -0.16% / -0.28%. Popular coins are great at drawing you in, so look at volume before you look at the comments. Keep an eye on it for the short term, but don’t mistake popularity for certainty.
Everything on the screen is moving. Start with the ones showing stronger participation from capital.
$AVAX 15m volume: 6.19M, aggressive buys: 40.3%, price/OI: -0.15% / -0.54%. It’s worth watching this popular market, but don’t let the hype make the decision for you. The buzz is real; what matters next is whether capital keeps flowing in.
$ONDO The focus this time is 15m participation: volume 1.94M, aggressive buys: 35.7%, price/OI: -0.18% / +0.08%. In a market like this, watch aggressive orders instead of just counting limit orders. If volume dries up, the advantage of lighter offers above will be the first to fade.
$HYPE The focus this time is 15m participation: volume 3.82M, aggressive buys: 28.8%, price/OI: -0.16% / -0.28%. Popular coins are great at drawing you in, so look at volume before you look at the comments. Keep an eye on it for the short term, but don’t mistake popularity for certainty.
$AVAX 15m volume: 6.19M, aggressive buys: 40.3%, price/OI: -0.15% / -0.54%. It’s worth watching this popular market, but don’t let the hype make the decision for you. The buzz is real; what matters next is whether capital keeps flowing in.
$ONDO The focus this time is 15m participation: volume 1.94M, aggressive buys: 35.7%, price/OI: -0.18% / +0.08%. In a market like this, watch aggressive orders instead of just counting limit orders. If volume dries up, the advantage of lighter offers above will be the first to fade.
$HYPE The focus this time is 15m participation: volume 3.82M, aggressive buys: 28.8%, price/OI: -0.16% / -0.28%. Popular coins are great at drawing you in, so look at volume before you look at the comments. Keep an eye on it for the short term, but don’t mistake popularity for certainty.
62
·
--
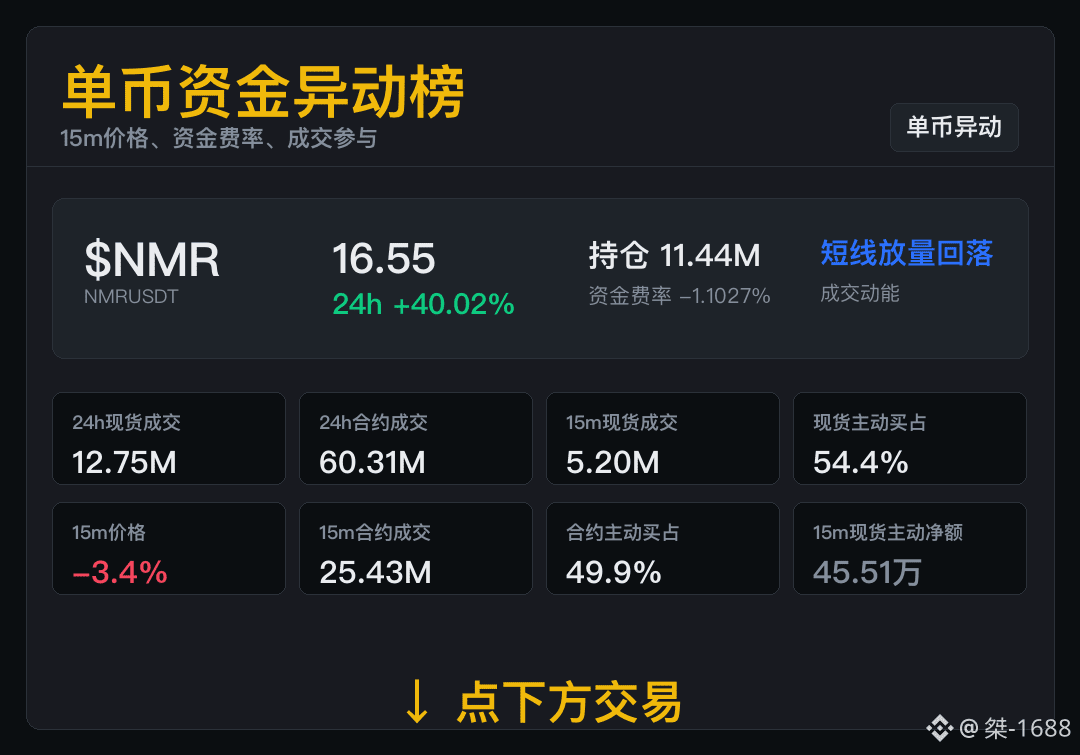
$NMR Short-term volatility is picking up, so spot and futures trading volumes should be considered together.
24-hour change: +40.02%; spot volume: 12.75M; current open interest: 11.44M.
Futures costs are on the short side. First, check the strength of trading volume in the next leg.
In the next review, check whether trading volume continues; don’t draw conclusions from price movement alone.
$NMR Short-term volatility is picking up, so spot and futures trading volumes should be considered together.
24-hour change: +40.02%; spot volume: 12.75M; current open interest: 11.44M.
Futures costs are on the short side. First, check the strength of trading volume in the next leg.
In the next review, check whether trading volume continues; don’t draw conclusions from price movement alone.
24-hour change: +40.02%; spot volume: 12.75M; current open interest: 11.44M.
Futures costs are on the short side. First, check the strength of trading volume in the next leg.
In the next review, check whether trading volume continues; don’t draw conclusions from price movement alone.
228
·
--
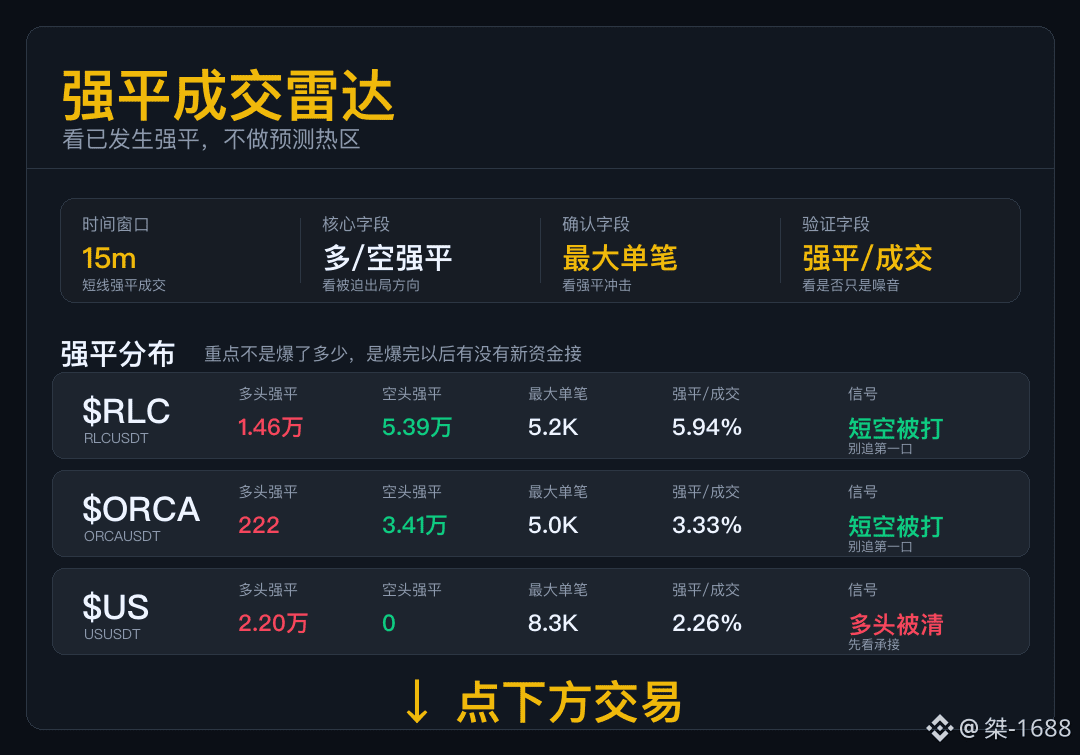
Liquidation Radar
With liquidation data, first look at who is being forced out.
$RLC 15m Short liquidations are clearly higher than long liquidations, so leveraged shorts are being forced to buy back.
$ORCA There are more short liquidations, suggesting a short-term short got hit. Don’t rush to chase the first move; only if it holds on the pullback does that show buyers are still stepping in.
$US Longs were liquidated first in this stretch. If trading volume doesn’t follow through afterward, the rebound could turn into a weak recovery.
Liquidation directions in this group aren’t aligned. Look at each coin individually to see which still has follow-through after the liquidations.
Liquidation Radar
With liquidation data, first look at who is being forced out.
$RLC 15m Short liquidations are clearly higher than long liquidations, so leveraged shorts are being forced to buy back.
$ORCA There are more short liquidations, suggesting a short-term short got hit. Don’t rush to chase the first move; only if it holds on the pullback does that show buyers are still stepping in.
$US Longs were liquidated first in this stretch. If trading volume doesn’t follow through afterward, the rebound could turn into a weak recovery.
Liquidation directions in this group aren’t aligned. Look at each coin individually to see which still has follow-through after the liquidations.
With liquidation data, first look at who is being forced out.
$RLC 15m Short liquidations are clearly higher than long liquidations, so leveraged shorts are being forced to buy back.
$ORCA There are more short liquidations, suggesting a short-term short got hit. Don’t rush to chase the first move; only if it holds on the pullback does that show buyers are still stepping in.
$US Longs were liquidated first in this stretch. If trading volume doesn’t follow through afterward, the rebound could turn into a weak recovery.
Liquidation directions in this group aren’t aligned. Look at each coin individually to see which still has follow-through after the liquidations.
112
·
--
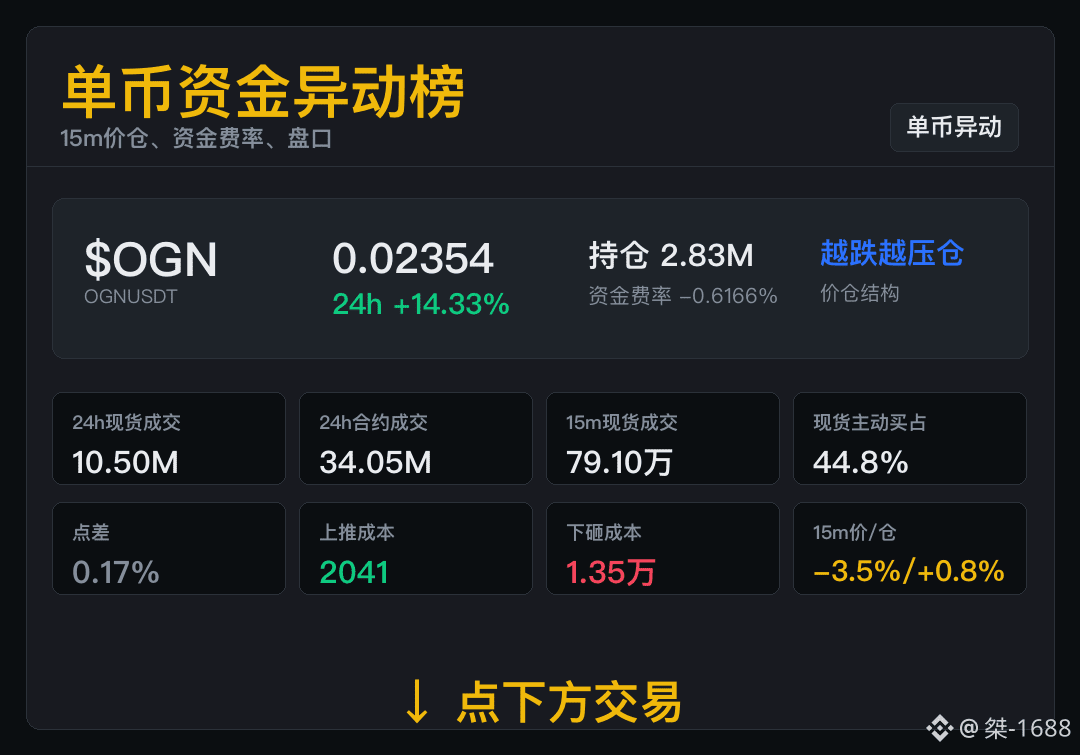
$OGN Price is falling while open interest is rising, and intraday participation is increasing.
15m price/OI: -3.52% / +0.76%; current open interest: 2.83M; funding rate: -0.6166%.
New participation is entering a downturn phase, so the possibility of increased volatility cannot be ignored.
Until the price stabilizes, the expansion in open interest should be monitored closely.
$OGN Price is falling while open interest is rising, and intraday participation is increasing.
15m price/OI: -3.52% / +0.76%; current open interest: 2.83M; funding rate: -0.6166%.
New participation is entering a downturn phase, so the possibility of increased volatility cannot be ignored.
Until the price stabilizes, the expansion in open interest should be monitored closely.
15m price/OI: -3.52% / +0.76%; current open interest: 2.83M; funding rate: -0.6166%.
New participation is entering a downturn phase, so the possibility of increased volatility cannot be ignored.
Until the price stabilizes, the expansion in open interest should be monitored closely.
160
·
--
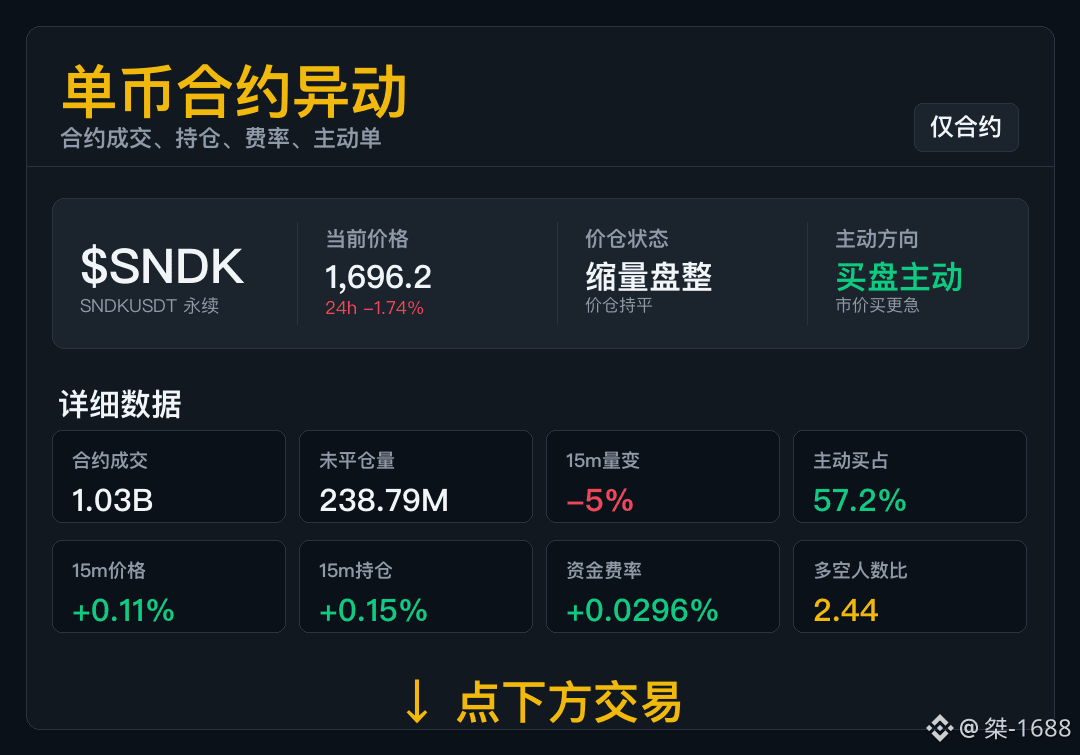
$SNDK Don’t just look at the candlesticks now—open interest and trading behavior can tell you more.
The 15m price is up 0.11%, and open interest is up 0.15%. This looks more like “low-volume consolidation”: the price hasn’t moved much, and positions aren’t leaning either way. For now, it looks like the market is waiting for the next surge in volume.
Aggressive buys account for 57.2%, suggesting buyers are more willing to chase trades. The long/short account ratio is 2.44, so sentiment skews bullish, but funding rates aren’t extreme yet.
While the market is still grinding sideways, pay less attention to price swings and wait for a genuine surge in volume.
$SNDK Don’t just look at the candlesticks now—open interest and trading behavior can tell you more.
The 15m price is up 0.11%, and open interest is up 0.15%. This looks more like “low-volume consolidation”: the price hasn’t moved much, and positions aren’t leaning either way. For now, it looks like the market is waiting for the next surge in volume.
Aggressive buys account for 57.2%, suggesting buyers are more willing to chase trades. The long/short account ratio is 2.44, so sentiment skews bullish, but funding rates aren’t extreme yet.
While the market is still grinding sideways, pay less attention to price swings and wait for a genuine surge in volume.
The 15m price is up 0.11%, and open interest is up 0.15%. This looks more like “low-volume consolidation”: the price hasn’t moved much, and positions aren’t leaning either way. For now, it looks like the market is waiting for the next surge in volume.
Aggressive buys account for 57.2%, suggesting buyers are more willing to chase trades. The long/short account ratio is 2.44, so sentiment skews bullish, but funding rates aren’t extreme yet.
While the market is still grinding sideways, pay less attention to price swings and wait for a genuine surge in volume.
218
Log in to explore more content
Join global crypto users on Binance Square
⚡️ Get latest and useful information about crypto.
💬 Trusted by the world’s largest crypto exchange.
👍 Discover real insights from verified creators.
Email / Phone number