
#16
16
18,667 views
164 Discussing
Hot
Latest

·
--
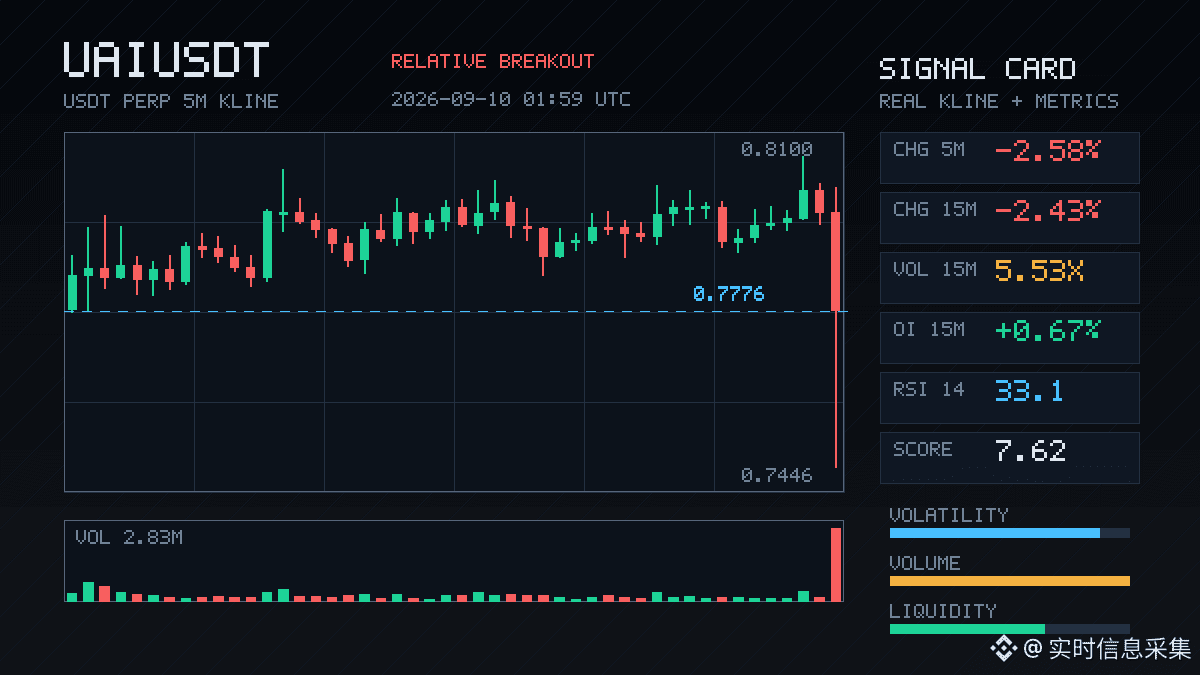
$UAI This 15m has something. Price is down 2.43%, trading volume directly jumps to 5.53x, Z is 3.49, and the close even breaks below the lower edge of the past ~20 5m candles.
But OI isn’t collapsing—15m +0.67%, 1h +1.02%, the abnormal percentile is 88.9%, and it’s #16 in the whole pool. The notional change is negative (-635K), suggesting additional leveraged short positions being added and pushing down—not a fake drop like longs capitulating and closing.
Active trade imbalance is -16.4%, buy/sell ratio is 0.72, and sell pressure is in control. The whole pool’s abnormality is near the front, and the notional change is #10; depth confirms it as well.
I don’t really like this kind of structure for trying to bottom-fish—price down + OI up + active sells: a standard short-with-leverage setup, not the pattern of a washout. Wait to see if OI turns around or if the trade imbalance narrows. It can’t be rushed.
$UAI This 15m has something. Price is down 2.43%, trading volume directly jumps to 5.53x, Z is 3.49, and the close even breaks below the lower edge of the past ~20 5m candles.
But OI isn’t collapsing—15m +0.67%, 1h +1.02%, the abnormal percentile is 88.9%, and it’s #16 in the whole pool. The notional change is negative (-635K), suggesting additional leveraged short positions being added and pushing down—not a fake drop like longs capitulating and closing.
Active trade imbalance is -16.4%, buy/sell ratio is 0.72, and sell pressure is in control. The whole pool’s abnormality is near the front, and the notional change is #10; depth confirms it as well.
I don’t really like this kind of structure for trying to bottom-fish—price down + OI up + active sells: a standard short-with-leverage setup, not the pattern of a washout. Wait to see if OI turns around or if the trade imbalance narrows. It can’t be rushed.
But OI isn’t collapsing—15m +0.67%, 1h +1.02%, the abnormal percentile is 88.9%, and it’s #16 in the whole pool. The notional change is negative (-635K), suggesting additional leveraged short positions being added and pushing down—not a fake drop like longs capitulating and closing.
Active trade imbalance is -16.4%, buy/sell ratio is 0.72, and sell pressure is in control. The whole pool’s abnormality is near the front, and the notional change is #10; depth confirms it as well.
I don’t really like this kind of structure for trying to bottom-fish—price down + OI up + active sells: a standard short-with-leverage setup, not the pattern of a washout. Wait to see if OI turns around or if the trade imbalance narrows. It can’t be rushed.
62

·
--
TAO pushes this move pretty decisively—within the 15m timeframe it immediately closed a bullish candle and reclaimed the top of the previous 20 5m-range.
But there’s one detail I don’t like: as price is rising, OI is falling. The 15m contract is -0.05%, 1h is -0.28%. Although nominal change is still positive, the overall structure looks more like shorts getting forced to cover rather than new longs actively stepping in. Active trade imbalance is -12.6%, buy-sell ratio is 1.29. On the short-term, buyers do have the edge, and volume also expanded to 1.48x. Volatility Z hits 2.30, which means this isn’t a slow, lukewarm行情.
The issue is this: if the rally is driven by short covering, then how long it can last usually depends on whether someone steps in and continues after the covering is done. The pool’s abnormal percentile is 77.8%, nominal change ranks at #16, and it’s been extending across several consecutive periods. Signals like this are indeed on the earlier side when viewed across the whole market. And the 24h trading value at 187M isn’t exactly small.
My view is that the short-term bias is bullish, but don’t treat this as a trend-start signal and chase higher. In a short-covering move, it often runs fast and fades fast. If you really want confirmation that longs have taken over, you need to see whether OI can move up alongside price. This combination right now looks more like someone is using the rebound to de-risk and reduce positions.
TAO pushes this move pretty decisively—within the 15m timeframe it immediately closed a bullish candle and reclaimed the top of the previous 20 5m-range.
But there’s one detail I don’t like: as price is rising, OI is falling. The 15m contract is -0.05%, 1h is -0.28%. Although nominal change is still positive, the overall structure looks more like shorts getting forced to cover rather than new longs actively stepping in. Active trade imbalance is -12.6%, buy-sell ratio is 1.29. On the short-term, buyers do have the edge, and volume also expanded to 1.48x. Volatility Z hits 2.30, which means this isn’t a slow, lukewarm行情.
The issue is this: if the rally is driven by short covering, then how long it can last usually depends on whether someone steps in and continues after the covering is done. The pool’s abnormal percentile is 77.8%, nominal change ranks at #16, and it’s been extending across several consecutive periods. Signals like this are indeed on the earlier side when viewed across the whole market. And the 24h trading value at 187M isn’t exactly small.
My view is that the short-term bias is bullish, but don’t treat this as a trend-start signal and chase higher. In a short-covering move, it often runs fast and fades fast. If you really want confirmation that longs have taken over, you need to see whether OI can move up alongside price. This combination right now looks more like someone is using the rebound to de-risk and reduce positions.
But there’s one detail I don’t like: as price is rising, OI is falling. The 15m contract is -0.05%, 1h is -0.28%. Although nominal change is still positive, the overall structure looks more like shorts getting forced to cover rather than new longs actively stepping in. Active trade imbalance is -12.6%, buy-sell ratio is 1.29. On the short-term, buyers do have the edge, and volume also expanded to 1.48x. Volatility Z hits 2.30, which means this isn’t a slow, lukewarm行情.
The issue is this: if the rally is driven by short covering, then how long it can last usually depends on whether someone steps in and continues after the covering is done. The pool’s abnormal percentile is 77.8%, nominal change ranks at #16, and it’s been extending across several consecutive periods. Signals like this are indeed on the earlier side when viewed across the whole market. And the 24h trading value at 187M isn’t exactly small.
My view is that the short-term bias is bullish, but don’t treat this as a trend-start signal and chase higher. In a short-covering move, it often runs fast and fades fast. If you really want confirmation that longs have taken over, you need to see whether OI can move up alongside price. This combination right now looks more like someone is using the rebound to de-risk and reduce positions.
7
·
--
$JTO This 15-minute K-line really has something.📈
The price directly broke through the upper bound of the range of nearly 20 five-minute K-lines. And what comes with it is trading volume expanding to 1.66 times the usual level. This rally isn’t a breakout faked on low volume—it’s backed by real money pushing.
Take a look at the order book details: the aggressive buy orders completely overwhelm the sell side. The buy-to-sell ratio is 2.58, and the gap in aggressive traded volume is as high as 44%. This suggests the up move isn’t some tug-of-war grind between bulls and bears—it’s bulls who can’t wait, eating the market out directly.
Even more intriguing is the contract data. Open interest (OI) for the 15-minute and 1-hour levels is rising in sync, nominal changes are both close to 2%, and combined with the price increase, this is classic “new money” coming in to go long—not a “fake pump” from short covering. The OI abnormal percentile has reached 87.7%. Ranking as high as #16 across the abnormal pool of the entire market, this kind of front-runner abnormality usually means the market structure is being repriced by capital.
Then there’s the funding rate—it’s at a high percentile recently. Market sentiment has clearly been ignited, but that’s a double-edged sword. In the early stage, when long positions are crowded, the行情 is often at its most exhilarating. The window for those who missed the move typically won’t last long.
With the breakout and the volume—and with contract additions too—what remains is whether the longs are willing to hold onto this consolidation platform. Don’t let the level where this strong bullish K-line was just established get vomited back up again.🚀
$JTO This 15-minute K-line really has something.📈
The price directly broke through the upper bound of the range of nearly 20 five-minute K-lines. And what comes with it is trading volume expanding to 1.66 times the usual level. This rally isn’t a breakout faked on low volume—it’s backed by real money pushing.
Take a look at the order book details: the aggressive buy orders completely overwhelm the sell side. The buy-to-sell ratio is 2.58, and the gap in aggressive traded volume is as high as 44%. This suggests the up move isn’t some tug-of-war grind between bulls and bears—it’s bulls who can’t wait, eating the market out directly.
Even more intriguing is the contract data. Open interest (OI) for the 15-minute and 1-hour levels is rising in sync, nominal changes are both close to 2%, and combined with the price increase, this is classic “new money” coming in to go long—not a “fake pump” from short covering. The OI abnormal percentile has reached 87.7%. Ranking as high as #16 across the abnormal pool of the entire market, this kind of front-runner abnormality usually means the market structure is being repriced by capital.
Then there’s the funding rate—it’s at a high percentile recently. Market sentiment has clearly been ignited, but that’s a double-edged sword. In the early stage, when long positions are crowded, the行情 is often at its most exhilarating. The window for those who missed the move typically won’t last long.
With the breakout and the volume—and with contract additions too—what remains is whether the longs are willing to hold onto this consolidation platform. Don’t let the level where this strong bullish K-line was just established get vomited back up again.🚀
The price directly broke through the upper bound of the range of nearly 20 five-minute K-lines. And what comes with it is trading volume expanding to 1.66 times the usual level. This rally isn’t a breakout faked on low volume—it’s backed by real money pushing.
Take a look at the order book details: the aggressive buy orders completely overwhelm the sell side. The buy-to-sell ratio is 2.58, and the gap in aggressive traded volume is as high as 44%. This suggests the up move isn’t some tug-of-war grind between bulls and bears—it’s bulls who can’t wait, eating the market out directly.
Even more intriguing is the contract data. Open interest (OI) for the 15-minute and 1-hour levels is rising in sync, nominal changes are both close to 2%, and combined with the price increase, this is classic “new money” coming in to go long—not a “fake pump” from short covering. The OI abnormal percentile has reached 87.7%. Ranking as high as #16 across the abnormal pool of the entire market, this kind of front-runner abnormality usually means the market structure is being repriced by capital.
Then there’s the funding rate—it’s at a high percentile recently. Market sentiment has clearly been ignited, but that’s a double-edged sword. In the early stage, when long positions are crowded, the行情 is often at its most exhilarating. The window for those who missed the move typically won’t last long.
With the breakout and the volume—and with contract additions too—what remains is whether the longs are willing to hold onto this consolidation platform. Don’t let the level where this strong bullish K-line was just established get vomited back up again.🚀
13

·
--
This trade on $XMR was really clean and decisive. The price broke below the lower boundary of the 20 five-minute K-line range, and fell 1.11% on the 15-minute chart. On the surface, it looks like a routine pullback, but what I’m watching is the active order-flow imbalance: -50.3%, with the buy side getting crushed and having no room to fight back. Across the whole pool, the abnormal percentile jumped to 94.6%, and the nominal change ranked #16 globally. That kind of scale of pressure isn’t something you can explain by retail sentiment alone.
What’s interesting is that OI actually ticked up slightly while price was falling, with short-dated contracts +0.19%. Price down, open interest up, and sell orders clearly dominating — this isn’t a long squeeze created by sideways chop, but more like new leveraged shorts actively front-running the move and placing a bet. The negative direction of nominal change fully exposes how capital is choosing sides — they’re voting with real money, betting that Monero will retest the opposite side of its historical extremes.
Don’t rush to catch the falling knife. A deep, confirmed drop like this, especially after abnormal continuation across multiple cycles, often doesn’t end with just one wave. If you do want to buy, wait until aggressive buying pushes the buy-sell ratio back toward 1 from 0.33. $XMR right now is not a bottom-fishing story; it’s a story about waiting for trend pricing power to be handed back.
This trade on $XMR was really clean and decisive. The price broke below the lower boundary of the 20 five-minute K-line range, and fell 1.11% on the 15-minute chart. On the surface, it looks like a routine pullback, but what I’m watching is the active order-flow imbalance: -50.3%, with the buy side getting crushed and having no room to fight back. Across the whole pool, the abnormal percentile jumped to 94.6%, and the nominal change ranked #16 globally. That kind of scale of pressure isn’t something you can explain by retail sentiment alone.
What’s interesting is that OI actually ticked up slightly while price was falling, with short-dated contracts +0.19%. Price down, open interest up, and sell orders clearly dominating — this isn’t a long squeeze created by sideways chop, but more like new leveraged shorts actively front-running the move and placing a bet. The negative direction of nominal change fully exposes how capital is choosing sides — they’re voting with real money, betting that Monero will retest the opposite side of its historical extremes.
Don’t rush to catch the falling knife. A deep, confirmed drop like this, especially after abnormal continuation across multiple cycles, often doesn’t end with just one wave. If you do want to buy, wait until aggressive buying pushes the buy-sell ratio back toward 1 from 0.33. $XMR right now is not a bottom-fishing story; it’s a story about waiting for trend pricing power to be handed back.
What’s interesting is that OI actually ticked up slightly while price was falling, with short-dated contracts +0.19%. Price down, open interest up, and sell orders clearly dominating — this isn’t a long squeeze created by sideways chop, but more like new leveraged shorts actively front-running the move and placing a bet. The negative direction of nominal change fully exposes how capital is choosing sides — they’re voting with real money, betting that Monero will retest the opposite side of its historical extremes.
Don’t rush to catch the falling knife. A deep, confirmed drop like this, especially after abnormal continuation across multiple cycles, often doesn’t end with just one wave. If you do want to buy, wait until aggressive buying pushes the buy-sell ratio back toward 1 from 0.33. $XMR right now is not a bottom-fishing story; it’s a story about waiting for trend pricing power to be handed back.
81

·
--
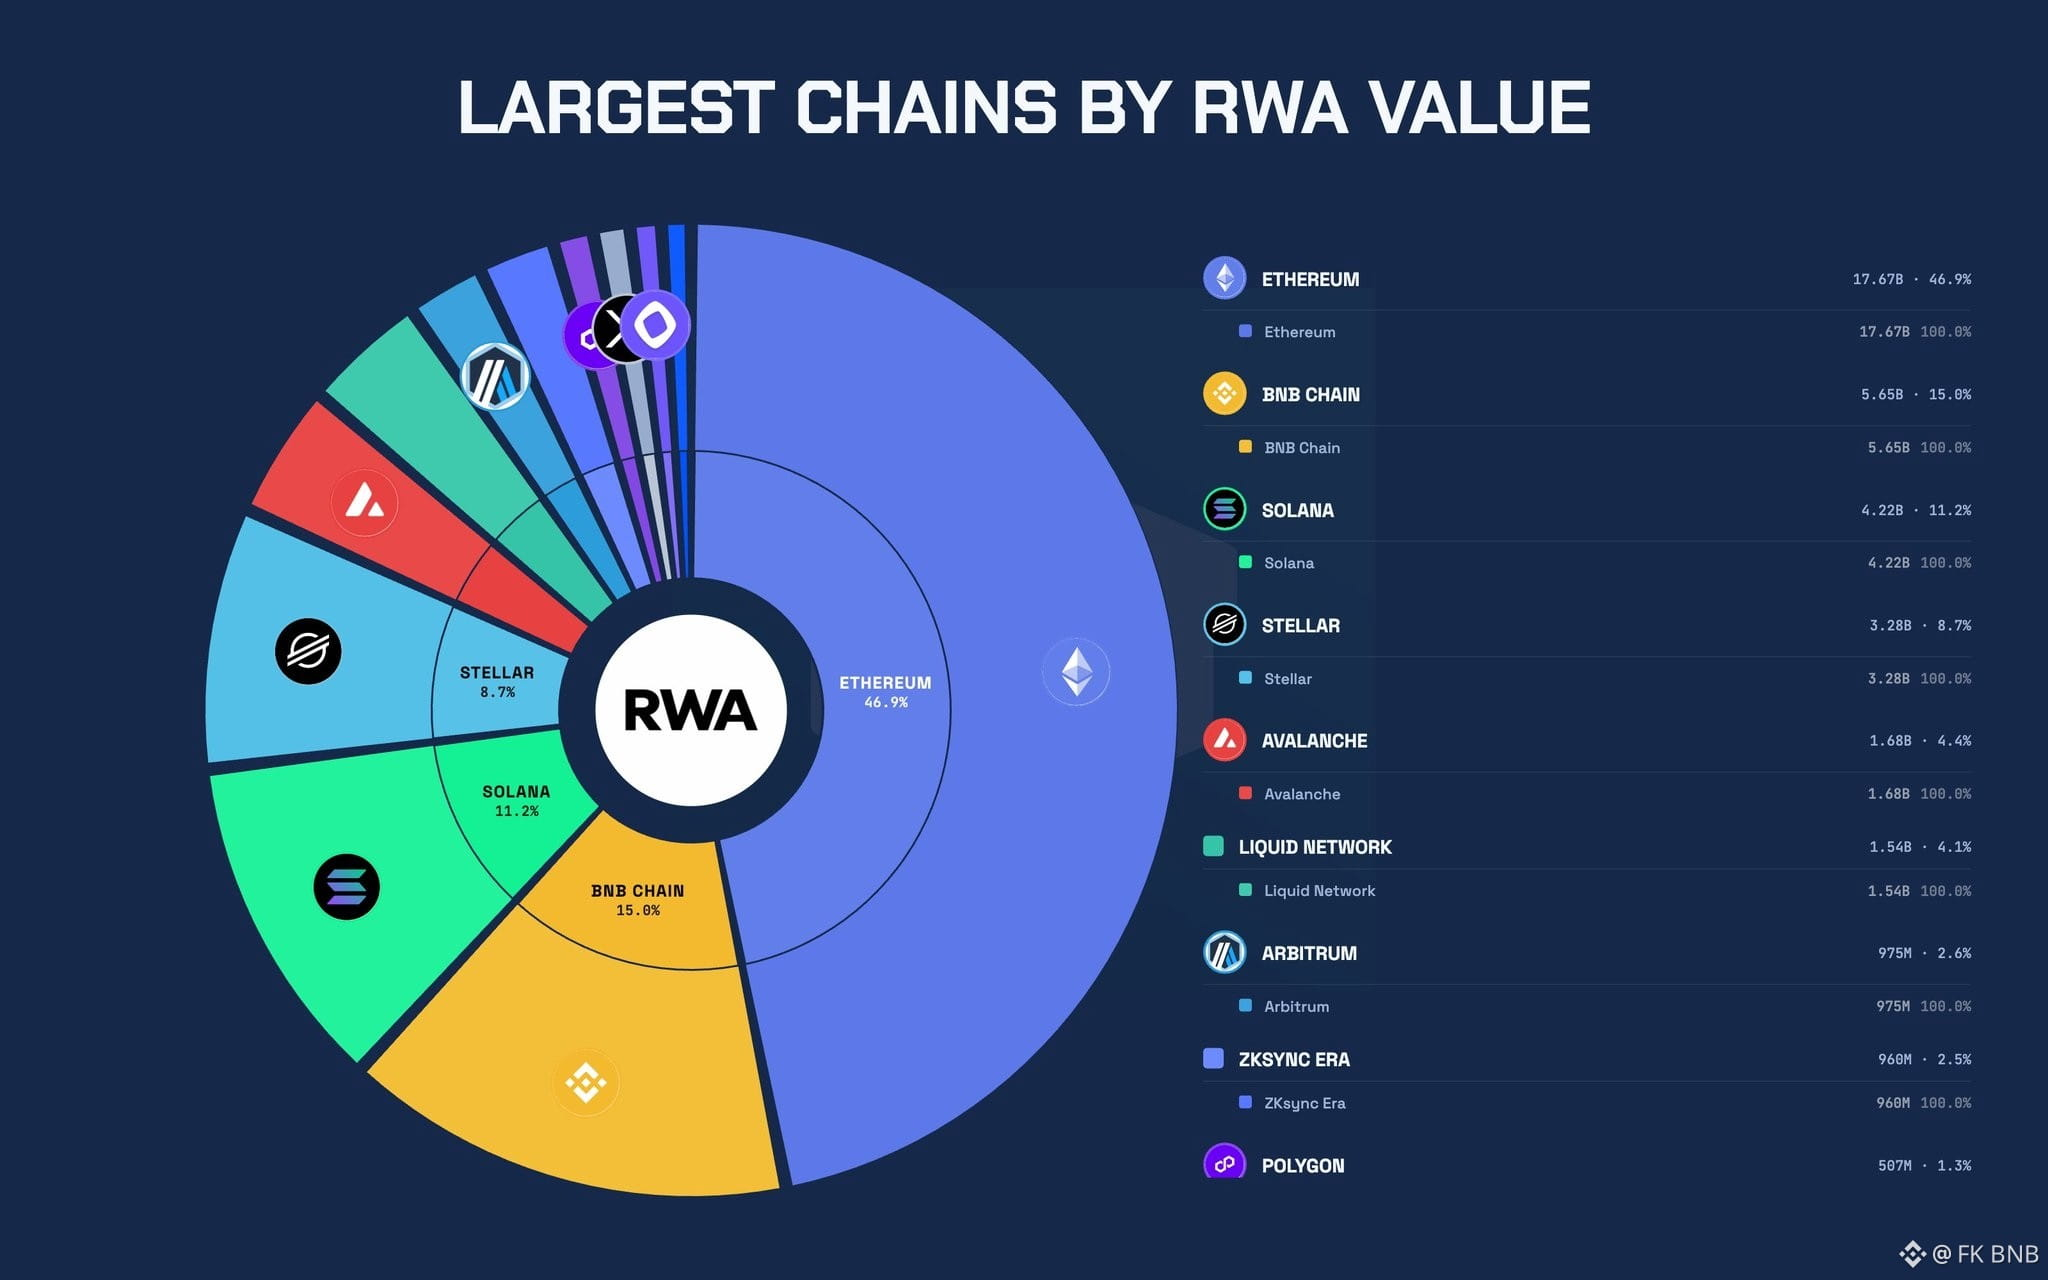
On-chain RWAs just crossed ~$37B in active market cap.
Top 10 chains by REAL distributed RWA value:
→ Ethereum: $17.67B (99.4% distributed)
→ $BNB Chain: $5.65B (100%)
→ $SOL : $4.23B (97.1%), 400K holders, most of any chain
→ Stellar: $3.28B (97.7%)
→ Avalanche: $1.68B (only 12.8% distributed, the $13B "total" is mostly represented)
→ Liquid Network: $1.54B (100%, just 62 holders)
→ Arbitrum: $975M (97.5%)
→ ZKsync Era: $960M (32.6%)
→ Polygon: $507M (40.6%)
→ XRP Ledger: $458M (10.2% distributed, $4.5B "total" is 90% bookkeeping)
✦ Points to note from the info:
- Ethereum still owns ~46%. Its share is only shrinking because the pie is growing, not because assets are leaving. Most RWA volume is still on $ETH despite the Sol and RH hype lately.
- Solana has the highest number of RWA holders at 400,084.
- Avalanche and XRP Ledger look top-5 until you separate transferable tokens from chain records on assets held the old way. On distributed value XRP barely makes the list, and Avalanche drops from an apparent 3rd to 5th.
- Some important projects outside the top 10 are:
→ SEI : #13
→ Mantle : #14
→ Robinhood : #16
→ Algorand : #21
→ SUI : #23
{future}(ETHUSDT)
{future}(BNBUSDT)
{future}(SOLUSDT)
On-chain RWAs just crossed ~$37B in active market cap.
Top 10 chains by REAL distributed RWA value:
→ Ethereum: $17.67B (99.4% distributed)
→ $BNB Chain: $5.65B (100%)
→ $SOL : $4.23B (97.1%), 400K holders, most of any chain
→ Stellar: $3.28B (97.7%)
→ Avalanche: $1.68B (only 12.8% distributed, the $13B "total" is mostly represented)
→ Liquid Network: $1.54B (100%, just 62 holders)
→ Arbitrum: $975M (97.5%)
→ ZKsync Era: $960M (32.6%)
→ Polygon: $507M (40.6%)
→ XRP Ledger: $458M (10.2% distributed, $4.5B "total" is 90% bookkeeping)
✦ Points to note from the info:
- Ethereum still owns ~46%. Its share is only shrinking because the pie is growing, not because assets are leaving. Most RWA volume is still on $ETH despite the Sol and RH hype lately.
- Solana has the highest number of RWA holders at 400,084.
- Avalanche and XRP Ledger look top-5 until you separate transferable tokens from chain records on assets held the old way. On distributed value XRP barely makes the list, and Avalanche drops from an apparent 3rd to 5th.
- Some important projects outside the top 10 are:
→ SEI : #13
→ Mantle : #14
→ Robinhood : #16
→ Algorand : #21
→ SUI : #23
Top 10 chains by REAL distributed RWA value:
→ Ethereum: $17.67B (99.4% distributed)
→ $BNB Chain: $5.65B (100%)
→ $SOL : $4.23B (97.1%), 400K holders, most of any chain
→ Stellar: $3.28B (97.7%)
→ Avalanche: $1.68B (only 12.8% distributed, the $13B "total" is mostly represented)
→ Liquid Network: $1.54B (100%, just 62 holders)
→ Arbitrum: $975M (97.5%)
→ ZKsync Era: $960M (32.6%)
→ Polygon: $507M (40.6%)
→ XRP Ledger: $458M (10.2% distributed, $4.5B "total" is 90% bookkeeping)
✦ Points to note from the info:
- Ethereum still owns ~46%. Its share is only shrinking because the pie is growing, not because assets are leaving. Most RWA volume is still on $ETH despite the Sol and RH hype lately.
- Solana has the highest number of RWA holders at 400,084.
- Avalanche and XRP Ledger look top-5 until you separate transferable tokens from chain records on assets held the old way. On distributed value XRP barely makes the list, and Avalanche drops from an apparent 3rd to 5th.
- Some important projects outside the top 10 are:
→ SEI : #13
→ Mantle : #14
→ Robinhood : #16
→ Algorand : #21
→ SUI : #23
28

·
--
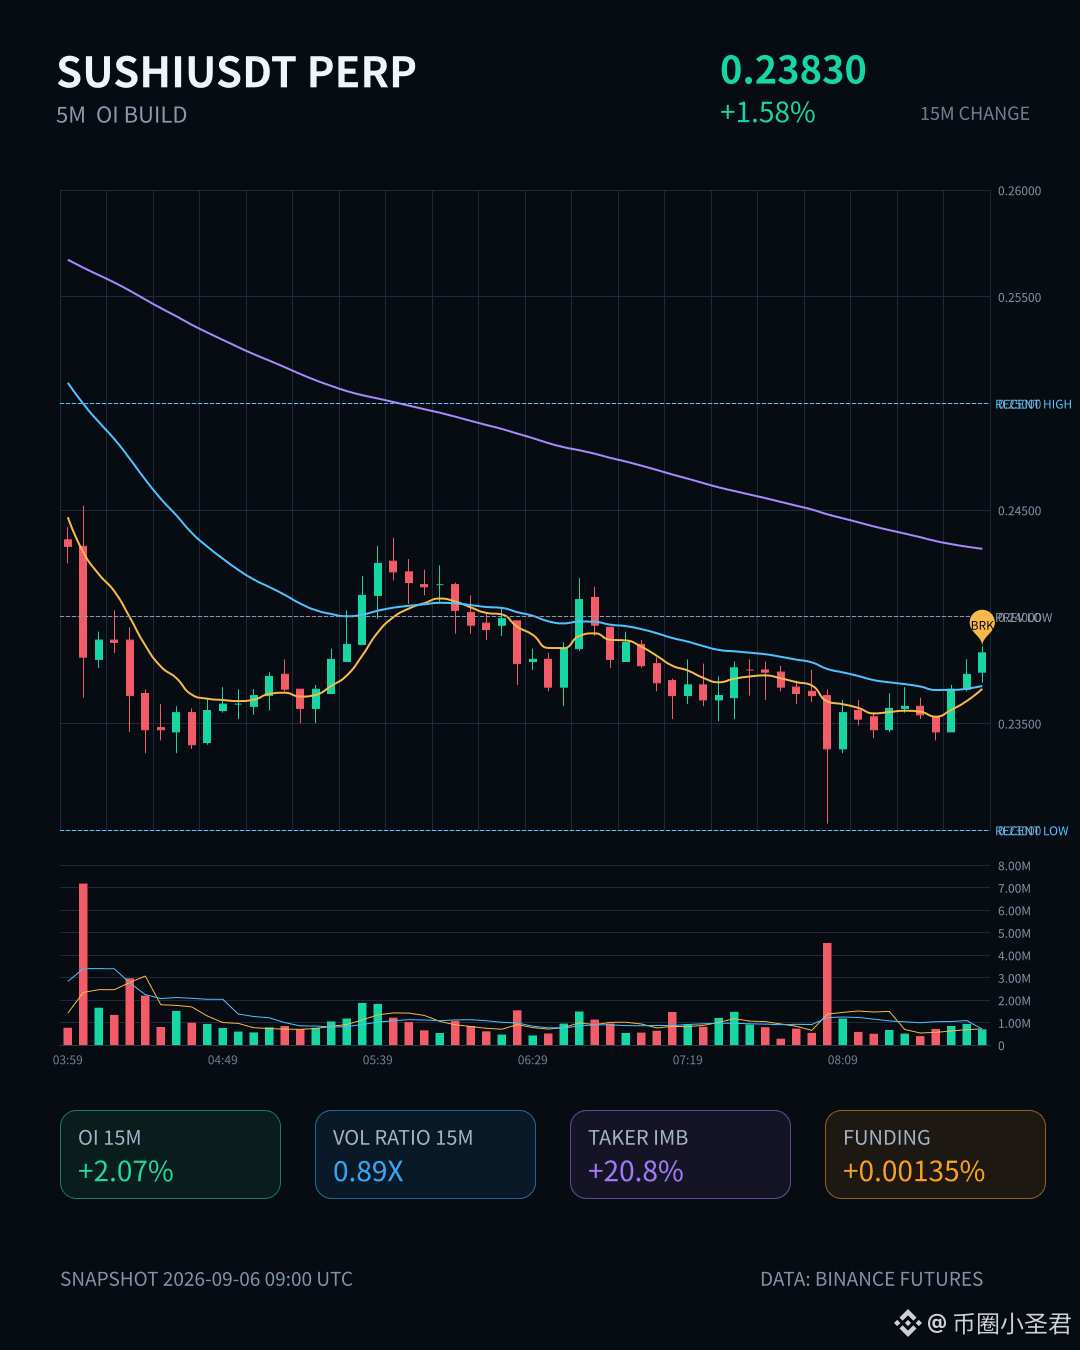
When SUSHI started to pull up on the 15-minute chart, I paused while watching the order book.
A 1.58% gain doesn’t look like much, but combined with OI jumping 2.07% in just 15 minutes and notional value rising by 241K, it becomes a completely different story — this is real new leveraged longs entering the market, not some fake breakout meant to pump and dump. Active trading imbalance was -20.8%, and the buy/sell ratio reached 1.53, which shows buyers were genuinely willing to step in.
The overall anomaly level ranked #16, and notional change ranked #26. Add to that the fact that price had just pushed up against the edge of the recent range, and with volume piling in at this spot, it clearly didn’t look like random retail behavior.
Still, I reminded myself not to get too excited. 24h volume was 123M, but 15-minute volume was only 0.89x. In plain terms, the market hadn’t entered a full-blown breakout state yet — it felt more like a group of smart money quietly positioning early. The volatility Z-score was 1.91, already in a sensitive zone. For a coin like this, once it breaks through a key resistance, the chasing money often comes in faster than expected.
SUSHI is an old-school DeFi coin that usually doesn’t get much attention, but once this kind of concentrated accumulation signal appears, it’s worth watching closely. Don’t rush to chase it — first see whether it can hold its ground.
When SUSHI started to pull up on the 15-minute chart, I paused while watching the order book.
A 1.58% gain doesn’t look like much, but combined with OI jumping 2.07% in just 15 minutes and notional value rising by 241K, it becomes a completely different story — this is real new leveraged longs entering the market, not some fake breakout meant to pump and dump. Active trading imbalance was -20.8%, and the buy/sell ratio reached 1.53, which shows buyers were genuinely willing to step in.
The overall anomaly level ranked #16, and notional change ranked #26. Add to that the fact that price had just pushed up against the edge of the recent range, and with volume piling in at this spot, it clearly didn’t look like random retail behavior.
Still, I reminded myself not to get too excited. 24h volume was 123M, but 15-minute volume was only 0.89x. In plain terms, the market hadn’t entered a full-blown breakout state yet — it felt more like a group of smart money quietly positioning early. The volatility Z-score was 1.91, already in a sensitive zone. For a coin like this, once it breaks through a key resistance, the chasing money often comes in faster than expected.
SUSHI is an old-school DeFi coin that usually doesn’t get much attention, but once this kind of concentrated accumulation signal appears, it’s worth watching closely. Don’t rush to chase it — first see whether it can hold its ground.
A 1.58% gain doesn’t look like much, but combined with OI jumping 2.07% in just 15 minutes and notional value rising by 241K, it becomes a completely different story — this is real new leveraged longs entering the market, not some fake breakout meant to pump and dump. Active trading imbalance was -20.8%, and the buy/sell ratio reached 1.53, which shows buyers were genuinely willing to step in.
The overall anomaly level ranked #16, and notional change ranked #26. Add to that the fact that price had just pushed up against the edge of the recent range, and with volume piling in at this spot, it clearly didn’t look like random retail behavior.
Still, I reminded myself not to get too excited. 24h volume was 123M, but 15-minute volume was only 0.89x. In plain terms, the market hadn’t entered a full-blown breakout state yet — it felt more like a group of smart money quietly positioning early. The volatility Z-score was 1.91, already in a sensitive zone. For a coin like this, once it breaks through a key resistance, the chasing money often comes in faster than expected.
SUSHI is an old-school DeFi coin that usually doesn’t get much attention, but once this kind of concentrated accumulation signal appears, it’s worth watching closely. Don’t rush to chase it — first see whether it can hold its ground.
134

·
--
Bullish
60-SECOND ALPHA #16 | $AKE
$AKE is moving fast, but the more interesting part is what’s happening behind the price. Trading volume has surged massively alongside the move, showing how quickly liquidity and attention can rotate into a small-cap token.
👉🏻 When a coin suddenly attracts huge volume, price can move much faster than expected in either direction. High volume confirms strong participation, but it does NOT guarantee the move will continue.
Volume tells you that the market is active. Price action tells you who is winning.
{future}(AKEUSDT)
60-SECOND ALPHA #16 | $AKE
$AKE is moving fast, but the more interesting part is what’s happening behind the price. Trading volume has surged massively alongside the move, showing how quickly liquidity and attention can rotate into a small-cap token.
👉🏻 When a coin suddenly attracts huge volume, price can move much faster than expected in either direction. High volume confirms strong participation, but it does NOT guarantee the move will continue.
Volume tells you that the market is active. Price action tells you who is winning.
$AKE is moving fast, but the more interesting part is what’s happening behind the price. Trading volume has surged massively alongside the move, showing how quickly liquidity and attention can rotate into a small-cap token.
👉🏻 When a coin suddenly attracts huge volume, price can move much faster than expected in either direction. High volume confirms strong participation, but it does NOT guarantee the move will continue.
Volume tells you that the market is active. Price action tells you who is winning.
140

·
--
When the market is showing red on the order book, $INTC actually feels a bit tangled up—I even ended up taking a closer look.
In the past 24 hours, it only fell 0.86%, with the price moving back and forth between $85.83 and $90.3. But on the perpetuals side, trading volume has already reached $89.47M USDT, and open positions are 738,894 contracts. What’s most interesting is that the funding rate is still +0.0083%.
This isn’t the kind of pullback nobody pays attention to.
The price isn’t holding up very firmly, yet the people in the contracts haven’t dispersed. Those willing to pay positive funding to keep holding positions suggests the market is still paying it sustained attention. At least on Binance’s TradFi side, $INTC isn’t a random ticket—otherwise it wouldn’t have surged to #16 on the US stock perpetuals trading volume leaderboard.
I’m leaning bullish on it—not just because it’s red or green today.
For a stock like Intel, as I understand it, it’s riding the big-tech hardware and computing infrastructure theme. When the market talks about AI now, many people only focus on the brightest names, which can easily cause an established hardware company like this to be treated as having “no story.” But “established” doesn’t mean “without value.” Often, it’s exactly these companies that have their position locked in—when industry sentiment improves, their recovery elasticity can be pretty substantial.
There’s another point I care about.
Today, it clearly didn’t break out with that kind of aggressive upside surge, yet funding hasn’t withdrawn noticeably. Even when the intraday price returned near $90.3, it was pushed back down again, and it’s still able to hold this much open interest around $88.93. To me, a stock like this is more comfortable than one that rockets up in a straight line—at least it’s not being driven purely by emotion.
I’m not pretending I understand everything and that everything is certain.
With these long-standing big companies, what they fear most is the market not having enough imagination for them. When a theme is hot, they may not be the first ones people chase. If later the trading volume shrinks but positions keep piling up, and the price can’t get back to the intraday highs, then it can easily turn into a frustrating grind—moving up and down and wearing you out.
But if you ask me whether this pullback counts as an opportunity worth studying, I’d say yes.
Not the kind you chase on hype and adrenaline—more like something you can watch and wait on slowly. If you can’t handle it, don’t get on the ride. Anyway, I’m just speaking from experience after I lost money.
$INTC #USStocks
Don’t go all-in. If you lose, don’t blame me.
When the market is showing red on the order book, $INTC actually feels a bit tangled up—I even ended up taking a closer look.
In the past 24 hours, it only fell 0.86%, with the price moving back and forth between $85.83 and $90.3. But on the perpetuals side, trading volume has already reached $89.47M USDT, and open positions are 738,894 contracts. What’s most interesting is that the funding rate is still +0.0083%.
This isn’t the kind of pullback nobody pays attention to.
The price isn’t holding up very firmly, yet the people in the contracts haven’t dispersed. Those willing to pay positive funding to keep holding positions suggests the market is still paying it sustained attention. At least on Binance’s TradFi side, $INTC isn’t a random ticket—otherwise it wouldn’t have surged to #16 on the US stock perpetuals trading volume leaderboard.
I’m leaning bullish on it—not just because it’s red or green today.
For a stock like Intel, as I understand it, it’s riding the big-tech hardware and computing infrastructure theme. When the market talks about AI now, many people only focus on the brightest names, which can easily cause an established hardware company like this to be treated as having “no story.” But “established” doesn’t mean “without value.” Often, it’s exactly these companies that have their position locked in—when industry sentiment improves, their recovery elasticity can be pretty substantial.
There’s another point I care about.
Today, it clearly didn’t break out with that kind of aggressive upside surge, yet funding hasn’t withdrawn noticeably. Even when the intraday price returned near $90.3, it was pushed back down again, and it’s still able to hold this much open interest around $88.93. To me, a stock like this is more comfortable than one that rockets up in a straight line—at least it’s not being driven purely by emotion.
I’m not pretending I understand everything and that everything is certain.
With these long-standing big companies, what they fear most is the market not having enough imagination for them. When a theme is hot, they may not be the first ones people chase. If later the trading volume shrinks but positions keep piling up, and the price can’t get back to the intraday highs, then it can easily turn into a frustrating grind—moving up and down and wearing you out.
But if you ask me whether this pullback counts as an opportunity worth studying, I’d say yes.
Not the kind you chase on hype and adrenaline—more like something you can watch and wait on slowly. If you can’t handle it, don’t get on the ride. Anyway, I’m just speaking from experience after I lost money.
$INTC #USStocks
Don’t go all-in. If you lose, don’t blame me.
In the past 24 hours, it only fell 0.86%, with the price moving back and forth between $85.83 and $90.3. But on the perpetuals side, trading volume has already reached $89.47M USDT, and open positions are 738,894 contracts. What’s most interesting is that the funding rate is still +0.0083%.
This isn’t the kind of pullback nobody pays attention to.
The price isn’t holding up very firmly, yet the people in the contracts haven’t dispersed. Those willing to pay positive funding to keep holding positions suggests the market is still paying it sustained attention. At least on Binance’s TradFi side, $INTC isn’t a random ticket—otherwise it wouldn’t have surged to #16 on the US stock perpetuals trading volume leaderboard.
I’m leaning bullish on it—not just because it’s red or green today.
For a stock like Intel, as I understand it, it’s riding the big-tech hardware and computing infrastructure theme. When the market talks about AI now, many people only focus on the brightest names, which can easily cause an established hardware company like this to be treated as having “no story.” But “established” doesn’t mean “without value.” Often, it’s exactly these companies that have their position locked in—when industry sentiment improves, their recovery elasticity can be pretty substantial.
There’s another point I care about.
Today, it clearly didn’t break out with that kind of aggressive upside surge, yet funding hasn’t withdrawn noticeably. Even when the intraday price returned near $90.3, it was pushed back down again, and it’s still able to hold this much open interest around $88.93. To me, a stock like this is more comfortable than one that rockets up in a straight line—at least it’s not being driven purely by emotion.
I’m not pretending I understand everything and that everything is certain.
With these long-standing big companies, what they fear most is the market not having enough imagination for them. When a theme is hot, they may not be the first ones people chase. If later the trading volume shrinks but positions keep piling up, and the price can’t get back to the intraday highs, then it can easily turn into a frustrating grind—moving up and down and wearing you out.
But if you ask me whether this pullback counts as an opportunity worth studying, I’d say yes.
Not the kind you chase on hype and adrenaline—more like something you can watch and wait on slowly. If you can’t handle it, don’t get on the ride. Anyway, I’m just speaking from experience after I lost money.
$INTC #USStocks
Don’t go all-in. If you lose, don’t blame me.
71
·
--
$MU I tend to look more closely, and I don’t think this is the kind of hot money that’s driven purely by emotions.
I’m watching this trade, not because I’m chasing that one-day +2.65% move.
It’s because on Binance’s US stock perpetuals side, it’s ranked #16 on the gainers list, and the trading volume can still push to #5. In the last 24 hours, it traded $390.04M USDT. With this level of attention directed at a somewhat “hard tech” stock, I’ll stay a bit more alert.
As far as I understand, $MU is still mainly riding the storage and semiconductor line.
This sector has a characteristic: it’s usually quiet, but when the business cycle turns back favorable, the rebound can be quite strong.
Once the market starts re-pricing companies like this, the move often isn’t a single straight-line surge and then it’s gone. More often, expectations get raised repeatedly.
I’m bullish on it for another reason too: the market action doesn’t seem overly restless.
The 24-hour high and low are $964.45 and $921.87. There’s been a decent amount of range in between, but the funding rate is still +0.0000%, which suggests that at least over this stretch today, people chasing perps haven’t gone to an extreme.
The open interest is also 121,259 contracts, which means people really are watching it—but it hasn’t become hot enough to make me feel like I need to immediately cover my head and run.
I’m actually comfortable with stocks like this.
If I had to nitpick, it’s not that there aren’t concerns.
For something like semiconductors, once expectations run too fast, it can easily turn into: “The story didn’t change, but the stock price got tired first.”
Also, right now the perpetual price is $957.53, not far from the 24-hour high. If you chase at this point, and you’re a bit slow, you’re more likely to get pulled back into the reversal.
My own stance is very direct.
I’m willing to stay patiently bullish on $MU . If it really runs up and gives me a chance, I’d rather wait for it to pull back and stabilize than rush in while it’s glowing red from the heat.
The market is changing—what’s true today may not be true tomorrow. $MU #US stocks
$MU I tend to look more closely, and I don’t think this is the kind of hot money that’s driven purely by emotions.
I’m watching this trade, not because I’m chasing that one-day +2.65% move.
It’s because on Binance’s US stock perpetuals side, it’s ranked #16 on the gainers list, and the trading volume can still push to #5. In the last 24 hours, it traded $390.04M USDT. With this level of attention directed at a somewhat “hard tech” stock, I’ll stay a bit more alert.
As far as I understand, $MU is still mainly riding the storage and semiconductor line.
This sector has a characteristic: it’s usually quiet, but when the business cycle turns back favorable, the rebound can be quite strong.
Once the market starts re-pricing companies like this, the move often isn’t a single straight-line surge and then it’s gone. More often, expectations get raised repeatedly.
I’m bullish on it for another reason too: the market action doesn’t seem overly restless.
The 24-hour high and low are $964.45 and $921.87. There’s been a decent amount of range in between, but the funding rate is still +0.0000%, which suggests that at least over this stretch today, people chasing perps haven’t gone to an extreme.
The open interest is also 121,259 contracts, which means people really are watching it—but it hasn’t become hot enough to make me feel like I need to immediately cover my head and run.
I’m actually comfortable with stocks like this.
If I had to nitpick, it’s not that there aren’t concerns.
For something like semiconductors, once expectations run too fast, it can easily turn into: “The story didn’t change, but the stock price got tired first.”
Also, right now the perpetual price is $957.53, not far from the 24-hour high. If you chase at this point, and you’re a bit slow, you’re more likely to get pulled back into the reversal.
My own stance is very direct.
I’m willing to stay patiently bullish on $MU . If it really runs up and gives me a chance, I’d rather wait for it to pull back and stabilize than rush in while it’s glowing red from the heat.
The market is changing—what’s true today may not be true tomorrow. $MU #US stocks
I’m watching this trade, not because I’m chasing that one-day +2.65% move.
It’s because on Binance’s US stock perpetuals side, it’s ranked #16 on the gainers list, and the trading volume can still push to #5. In the last 24 hours, it traded $390.04M USDT. With this level of attention directed at a somewhat “hard tech” stock, I’ll stay a bit more alert.
As far as I understand, $MU is still mainly riding the storage and semiconductor line.
This sector has a characteristic: it’s usually quiet, but when the business cycle turns back favorable, the rebound can be quite strong.
Once the market starts re-pricing companies like this, the move often isn’t a single straight-line surge and then it’s gone. More often, expectations get raised repeatedly.
I’m bullish on it for another reason too: the market action doesn’t seem overly restless.
The 24-hour high and low are $964.45 and $921.87. There’s been a decent amount of range in between, but the funding rate is still +0.0000%, which suggests that at least over this stretch today, people chasing perps haven’t gone to an extreme.
The open interest is also 121,259 contracts, which means people really are watching it—but it hasn’t become hot enough to make me feel like I need to immediately cover my head and run.
I’m actually comfortable with stocks like this.
If I had to nitpick, it’s not that there aren’t concerns.
For something like semiconductors, once expectations run too fast, it can easily turn into: “The story didn’t change, but the stock price got tired first.”
Also, right now the perpetual price is $957.53, not far from the 24-hour high. If you chase at this point, and you’re a bit slow, you’re more likely to get pulled back into the reversal.
My own stance is very direct.
I’m willing to stay patiently bullish on $MU . If it really runs up and gives me a chance, I’d rather wait for it to pull back and stabilize than rush in while it’s glowing red from the heat.
The market is changing—what’s true today may not be true tomorrow. $MU #US stocks
70

·
--
$AKE This move has some real flavor.
In just 15 minutes, it broke through the lower end of the recent 5m range—without even looking back at the close. The trading volume suddenly jumped to 3.88 times the usual level, and the volatility Z also spiked to 2.5. This isn’t ordinary chop; it looks like someone is actively exiting. Active trade slippage is -18.7%, the buy/sell ratio is 0.69, and sell pressure is crushing through.
Even more interesting: as the price is falling, OI is also dropping. Both the 15m and 1h contracts are contracting, and the notional change is directly cut by around -700K USDT. This structure isn’t the same as a pure sell-off. It looks more like a de-leveraging by longs—stop-outs, liquidations/flatting positions, and shrinking exposure. The whole chain is moving.
The pool’s abnormality ranks as high as #16, and the notional change hits #7. That suggests it isn’t just one person putting on a show—the entire pool is repricing together.
The 24h trading volume on 165M is right there. AKE isn’t short on liquidity—it’s the buyer’s confidence that’s missing.
If it breaks the lower end of the last 20 K-bars, don’t rush to catch. Wait for the emotional release to finish; that’s when real support will start to show up.
$AKE This move has some real flavor.
In just 15 minutes, it broke through the lower end of the recent 5m range—without even looking back at the close. The trading volume suddenly jumped to 3.88 times the usual level, and the volatility Z also spiked to 2.5. This isn’t ordinary chop; it looks like someone is actively exiting. Active trade slippage is -18.7%, the buy/sell ratio is 0.69, and sell pressure is crushing through.
Even more interesting: as the price is falling, OI is also dropping. Both the 15m and 1h contracts are contracting, and the notional change is directly cut by around -700K USDT. This structure isn’t the same as a pure sell-off. It looks more like a de-leveraging by longs—stop-outs, liquidations/flatting positions, and shrinking exposure. The whole chain is moving.
The pool’s abnormality ranks as high as #16, and the notional change hits #7. That suggests it isn’t just one person putting on a show—the entire pool is repricing together.
The 24h trading volume on 165M is right there. AKE isn’t short on liquidity—it’s the buyer’s confidence that’s missing.
If it breaks the lower end of the last 20 K-bars, don’t rush to catch. Wait for the emotional release to finish; that’s when real support will start to show up.
In just 15 minutes, it broke through the lower end of the recent 5m range—without even looking back at the close. The trading volume suddenly jumped to 3.88 times the usual level, and the volatility Z also spiked to 2.5. This isn’t ordinary chop; it looks like someone is actively exiting. Active trade slippage is -18.7%, the buy/sell ratio is 0.69, and sell pressure is crushing through.
Even more interesting: as the price is falling, OI is also dropping. Both the 15m and 1h contracts are contracting, and the notional change is directly cut by around -700K USDT. This structure isn’t the same as a pure sell-off. It looks more like a de-leveraging by longs—stop-outs, liquidations/flatting positions, and shrinking exposure. The whole chain is moving.
The pool’s abnormality ranks as high as #16, and the notional change hits #7. That suggests it isn’t just one person putting on a show—the entire pool is repricing together.
The 24h trading volume on 165M is right there. AKE isn’t short on liquidity—it’s the buyer’s confidence that’s missing.
If it breaks the lower end of the last 20 K-bars, don’t rush to catch. Wait for the emotional release to finish; that’s when real support will start to show up.
105
·
--
$BLESS This drop has gotten a little “serious.”
In just 15 minutes, it broke through the lower bound of the range covered by nearly 20 five-minute candlesticks. Trading volume expanded to 1.55x, and the volatility Z-score surged to 2.5—this isn’t the kind of slow, grinding bearish move that wears you down. What’s even more worth noting is that while the price is moving down, OI is still rising slightly; yet the contract notional changes are seeing a large outflow. Plainly put, it looks more like newly added leveraged shorts are entering and smashing the market, rather than just retail panic selling.
Aggressive trade delta is down 32.4%, the buy/sell ratio is 0.51—shorts are indeed driving the tempo. In the past 24 hours there’s also $26 million in trading value, meaning liquidity hasn’t dried up; it suggests there are still people in this pool, it’s just that for now the direction is being controlled by the shorts.
Abnormal ranking for the whole pool: #16; notional change: #26. The capital flow direction really does have a clear bias. Friends holding positions, watch the 1-hour OI as well—it’s starting to pull back. If, in the short term, there’s a rebound back near the lower bound of the range, that could be a pressure-test location.
Not a call—just that the chart looks a bit interesting. Logging it here.
$BLESS This drop has gotten a little “serious.”
In just 15 minutes, it broke through the lower bound of the range covered by nearly 20 five-minute candlesticks. Trading volume expanded to 1.55x, and the volatility Z-score surged to 2.5—this isn’t the kind of slow, grinding bearish move that wears you down. What’s even more worth noting is that while the price is moving down, OI is still rising slightly; yet the contract notional changes are seeing a large outflow. Plainly put, it looks more like newly added leveraged shorts are entering and smashing the market, rather than just retail panic selling.
Aggressive trade delta is down 32.4%, the buy/sell ratio is 0.51—shorts are indeed driving the tempo. In the past 24 hours there’s also $26 million in trading value, meaning liquidity hasn’t dried up; it suggests there are still people in this pool, it’s just that for now the direction is being controlled by the shorts.
Abnormal ranking for the whole pool: #16; notional change: #26. The capital flow direction really does have a clear bias. Friends holding positions, watch the 1-hour OI as well—it’s starting to pull back. If, in the short term, there’s a rebound back near the lower bound of the range, that could be a pressure-test location.
Not a call—just that the chart looks a bit interesting. Logging it here.
In just 15 minutes, it broke through the lower bound of the range covered by nearly 20 five-minute candlesticks. Trading volume expanded to 1.55x, and the volatility Z-score surged to 2.5—this isn’t the kind of slow, grinding bearish move that wears you down. What’s even more worth noting is that while the price is moving down, OI is still rising slightly; yet the contract notional changes are seeing a large outflow. Plainly put, it looks more like newly added leveraged shorts are entering and smashing the market, rather than just retail panic selling.
Aggressive trade delta is down 32.4%, the buy/sell ratio is 0.51—shorts are indeed driving the tempo. In the past 24 hours there’s also $26 million in trading value, meaning liquidity hasn’t dried up; it suggests there are still people in this pool, it’s just that for now the direction is being controlled by the shorts.
Abnormal ranking for the whole pool: #16; notional change: #26. The capital flow direction really does have a clear bias. Friends holding positions, watch the 1-hour OI as well—it’s starting to pull back. If, in the short term, there’s a rebound back near the lower bound of the range, that could be a pressure-test location.
Not a call—just that the chart looks a bit interesting. Logging it here.
18
·
--
$BTW 15 minutes, this move is down 1.38%. Volume surged to 3.59x directly, and the price pushed through the high of the 20-5-minute candlesticks. What’s interesting is that OI actually decreased slightly—active buy orders are down 42.7%. This looks more like short covering being forced, not a real breakout. In the whole pool’s abnormal ranking, it’s #16; the nominal change is 7th. Funds are active in the short term, but total contract open interest hasn’t caught up. If you’re chasing the price up, be sure to hit the brakes.
$BTW 15 minutes, this move is down 1.38%. Volume surged to 3.59x directly, and the price pushed through the high of the 20-5-minute candlesticks. What’s interesting is that OI actually decreased slightly—active buy orders are down 42.7%. This looks more like short covering being forced, not a real breakout. In the whole pool’s abnormal ranking, it’s #16; the nominal change is 7th. Funds are active in the short term, but total contract open interest hasn’t caught up. If you’re chasing the price up, be sure to hit the brakes.
157
·
--
$MOVR This wave of long positions along this wavelength line has finally been liquidated and driven out. In 15 minutes, it’s down -4.46%, and the trading volume has surged to 4.5 times the usual. The funding rate is still high, which means the leverage hasn’t been fully flushed yet—don’t rush to buy. The OI percentile is 94.4%, and the abnormality ranks at #16 in the whole pool, but the 1-hour OI is still up +7% and stacking higher. This suggests some are bottom-fishing while others are cutting losses—directional disagreement is extremely intense. The share of active buy orders is 85%, with the sellers completely controlling the market. In the short term, there are only two scenarios: either it keeps exploding until the funding rate drops to zero, or a V-reversal that eats this short trap. When it falls with the trend, don’t get antsy and start touching the dip.
$MOVR This wave of long positions along this wavelength line has finally been liquidated and driven out. In 15 minutes, it’s down -4.46%, and the trading volume has surged to 4.5 times the usual. The funding rate is still high, which means the leverage hasn’t been fully flushed yet—don’t rush to buy. The OI percentile is 94.4%, and the abnormality ranks at #16 in the whole pool, but the 1-hour OI is still up +7% and stacking higher. This suggests some are bottom-fishing while others are cutting losses—directional disagreement is extremely intense. The share of active buy orders is 85%, with the sellers completely controlling the market. In the short term, there are only two scenarios: either it keeps exploding until the funding rate drops to zero, or a V-reversal that eats this short trap. When it falls with the trend, don’t get antsy and start touching the dip.
67
·
--
$MRVL For this trade, I’m willing to lean more bullish—even though it has already surged 7.30% today.
When I look at a company like this, I don’t first fixate on a single K-line. I think about one thing first: is what it’s eating the kind of demand that’s extremely hard to turn back once the industry budgets get set?
As far as I know, Marvell is roughly still positioned to benefit from semiconductors and infrastructure upgrade spending.
One advantage of this kind of direction is that when market sentiment is hot, it’s easy for the market to treat it like tech growth and chase it. When sentiment cools down, it’s also not the sort of thing that collapses the moment a single story falls apart.
That’s where I’m willing to take a closer look.
And the price action hasn’t been weak enough to make me want to dodge it.
It’s currently at $259.21, with a day high of $260.58 and a low of $237.04. It has been able to pull back all the way from the lows, which shows the buy-side isn’t just showing up for a moment and then disappearing.
In the last 24 hours, trading volume is $127.24M USDT. Placed on Binance’s US stocks perpetuals leaderboard, its gain ranks #13 and its volume ranks #16. This isn’t some ignored, cold corner anymore.
There’s another detail I care about.
The funding rate is +0.0249%. That’s not too extreme, suggesting people are chasing longs, but it hasn’t reached the point of a full-on frenzy.
Open interest is 127,012 contracts as well, which indicates quite a few are watching it—but the order book still hasn’t moved into a “burning at first glance” state.
For me, I’d interpret it as: the heat is building, but it hasn’t crowded into a particularly uncomfortable level yet.
To put it more bluntly: I’m not bullish because I think it still has to keep surging tomorrow.
I think that as long as these kinds of names remain under the main theme of tech infrastructure upgrades, the market will repeatedly price in a premium for them—especially when capital is willing to rotate back into growth stocks. In that sense, they’re more solid than many names that are just telling a story.
But this trade also isn’t a blind “buy now.”
It has a pretty big intraday swing today—from $237.04 to $260.58. If you move a bit slow, or if you get emotionally carried away and chase in, you’re more likely to get whipsawed back and forth.
If later the only thing that stays hot is the futures/contracts at the top, while spot can’t keep up, the trend will become very tiresome.
My stance is very straightforward right now: I don’t want to look at this against the grain. If I do make a move, I’d rather wait for it to pull back to a spot it can handle, then go stand on the more bullish side. If you lose, don’t cue me; if you profit, treat me to a cup of coffee.
$MRVL #US stocks
$MRVL For this trade, I’m willing to lean more bullish—even though it has already surged 7.30% today.
When I look at a company like this, I don’t first fixate on a single K-line. I think about one thing first: is what it’s eating the kind of demand that’s extremely hard to turn back once the industry budgets get set?
As far as I know, Marvell is roughly still positioned to benefit from semiconductors and infrastructure upgrade spending.
One advantage of this kind of direction is that when market sentiment is hot, it’s easy for the market to treat it like tech growth and chase it. When sentiment cools down, it’s also not the sort of thing that collapses the moment a single story falls apart.
That’s where I’m willing to take a closer look.
And the price action hasn’t been weak enough to make me want to dodge it.
It’s currently at $259.21, with a day high of $260.58 and a low of $237.04. It has been able to pull back all the way from the lows, which shows the buy-side isn’t just showing up for a moment and then disappearing.
In the last 24 hours, trading volume is $127.24M USDT. Placed on Binance’s US stocks perpetuals leaderboard, its gain ranks #13 and its volume ranks #16. This isn’t some ignored, cold corner anymore.
There’s another detail I care about.
The funding rate is +0.0249%. That’s not too extreme, suggesting people are chasing longs, but it hasn’t reached the point of a full-on frenzy.
Open interest is 127,012 contracts as well, which indicates quite a few are watching it—but the order book still hasn’t moved into a “burning at first glance” state.
For me, I’d interpret it as: the heat is building, but it hasn’t crowded into a particularly uncomfortable level yet.
To put it more bluntly: I’m not bullish because I think it still has to keep surging tomorrow.
I think that as long as these kinds of names remain under the main theme of tech infrastructure upgrades, the market will repeatedly price in a premium for them—especially when capital is willing to rotate back into growth stocks. In that sense, they’re more solid than many names that are just telling a story.
But this trade also isn’t a blind “buy now.”
It has a pretty big intraday swing today—from $237.04 to $260.58. If you move a bit slow, or if you get emotionally carried away and chase in, you’re more likely to get whipsawed back and forth.
If later the only thing that stays hot is the futures/contracts at the top, while spot can’t keep up, the trend will become very tiresome.
My stance is very straightforward right now: I don’t want to look at this against the grain. If I do make a move, I’d rather wait for it to pull back to a spot it can handle, then go stand on the more bullish side. If you lose, don’t cue me; if you profit, treat me to a cup of coffee.
$MRVL #US stocks
When I look at a company like this, I don’t first fixate on a single K-line. I think about one thing first: is what it’s eating the kind of demand that’s extremely hard to turn back once the industry budgets get set?
As far as I know, Marvell is roughly still positioned to benefit from semiconductors and infrastructure upgrade spending.
One advantage of this kind of direction is that when market sentiment is hot, it’s easy for the market to treat it like tech growth and chase it. When sentiment cools down, it’s also not the sort of thing that collapses the moment a single story falls apart.
That’s where I’m willing to take a closer look.
And the price action hasn’t been weak enough to make me want to dodge it.
It’s currently at $259.21, with a day high of $260.58 and a low of $237.04. It has been able to pull back all the way from the lows, which shows the buy-side isn’t just showing up for a moment and then disappearing.
In the last 24 hours, trading volume is $127.24M USDT. Placed on Binance’s US stocks perpetuals leaderboard, its gain ranks #13 and its volume ranks #16. This isn’t some ignored, cold corner anymore.
There’s another detail I care about.
The funding rate is +0.0249%. That’s not too extreme, suggesting people are chasing longs, but it hasn’t reached the point of a full-on frenzy.
Open interest is 127,012 contracts as well, which indicates quite a few are watching it—but the order book still hasn’t moved into a “burning at first glance” state.
For me, I’d interpret it as: the heat is building, but it hasn’t crowded into a particularly uncomfortable level yet.
To put it more bluntly: I’m not bullish because I think it still has to keep surging tomorrow.
I think that as long as these kinds of names remain under the main theme of tech infrastructure upgrades, the market will repeatedly price in a premium for them—especially when capital is willing to rotate back into growth stocks. In that sense, they’re more solid than many names that are just telling a story.
But this trade also isn’t a blind “buy now.”
It has a pretty big intraday swing today—from $237.04 to $260.58. If you move a bit slow, or if you get emotionally carried away and chase in, you’re more likely to get whipsawed back and forth.
If later the only thing that stays hot is the futures/contracts at the top, while spot can’t keep up, the trend will become very tiresome.
My stance is very straightforward right now: I don’t want to look at this against the grain. If I do make a move, I’d rather wait for it to pull back to a spot it can handle, then go stand on the more bullish side. If you lose, don’t cue me; if you profit, treat me to a cup of coffee.
$MRVL #US stocks
47

·
--
Don’t focus on how much it’s up in a single day. For companies like Marvell, I’ll first look at where they sit in the industry chain. As I understand it, it roughly belongs to the semiconductor infrastructure segment—one that feeds on long-term demands such as compute power, data centers, and network interconnect. The market is trading AI over and over again now. It’s not just chasing the application layer at the very front; a lot of capital is starting to return to the layer where “someone moves the compute, transports data, connects data, and keeps the systems running smoothly.” As long as this direction doesn’t lose its momentum, valuations are likely to be brought up and re-priced repeatedly.
I’m bullish on it not because the name is hot, but because this space doesn’t look like a one-off theme. As AI keeps moving forward, the true bottlenecks are usually not the story—it’s the hard requirements like bandwidth, connection efficiency, and system throughput. Companies like Marvell, categorized under foundational chips and connectivity capabilities, tend to see their resilience come from industry capex continuing to move forward. As long as cloud and compute investments keep going, the market will continue to assign a premium to these stocks, even if there are big swings in between.
You can see a bit of the “feel” in the tape too. Today it ranks on the Binance US stock perpetuals by gain rate at #12 and by trading value at #16. The current price over 24 hours is $259.07, rising from $237.04 all the way to $259.14, up +7.71%. That suggests it’s not just someone lighting a fire—it’s sustained trading. The funding rate is +0.0251%, which isn’t outrageous; at least it hasn’t reached the point where sentiment is completely out of control. With 126,162 lots held, I wouldn’t chase higher here. Instead, I’d wait for a pullback and then decide whether to take a small position to ride the trend.
I haven’t opened $MRVL perpetuals, for a very simple reason: this move is too straight up, and the risk/reward ratio is worse than usual. If I were going to do it, I’d rather wait for it to rotate/turn over at a high level and confirm it’s not just a surge driven purely by sentiment. If I had to pick the key variable: once the market switches from AI hardware back toward defense, drawdowns for this kind of stock can come very quickly—especially after high-level volume expansion, when capital lets go and usually won’t be that gentle.
I’ll put this into my trading watchlist first, not chase it hard at this spot. $MRVL #US Stocks
The market turns faster than a book being flipped—keep some room in your position.
Don’t focus on how much it’s up in a single day. For companies like Marvell, I’ll first look at where they sit in the industry chain. As I understand it, it roughly belongs to the semiconductor infrastructure segment—one that feeds on long-term demands such as compute power, data centers, and network interconnect. The market is trading AI over and over again now. It’s not just chasing the application layer at the very front; a lot of capital is starting to return to the layer where “someone moves the compute, transports data, connects data, and keeps the systems running smoothly.” As long as this direction doesn’t lose its momentum, valuations are likely to be brought up and re-priced repeatedly.
I’m bullish on it not because the name is hot, but because this space doesn’t look like a one-off theme. As AI keeps moving forward, the true bottlenecks are usually not the story—it’s the hard requirements like bandwidth, connection efficiency, and system throughput. Companies like Marvell, categorized under foundational chips and connectivity capabilities, tend to see their resilience come from industry capex continuing to move forward. As long as cloud and compute investments keep going, the market will continue to assign a premium to these stocks, even if there are big swings in between.
You can see a bit of the “feel” in the tape too. Today it ranks on the Binance US stock perpetuals by gain rate at #12 and by trading value at #16. The current price over 24 hours is $259.07, rising from $237.04 all the way to $259.14, up +7.71%. That suggests it’s not just someone lighting a fire—it’s sustained trading. The funding rate is +0.0251%, which isn’t outrageous; at least it hasn’t reached the point where sentiment is completely out of control. With 126,162 lots held, I wouldn’t chase higher here. Instead, I’d wait for a pullback and then decide whether to take a small position to ride the trend.
I haven’t opened $MRVL perpetuals, for a very simple reason: this move is too straight up, and the risk/reward ratio is worse than usual. If I were going to do it, I’d rather wait for it to rotate/turn over at a high level and confirm it’s not just a surge driven purely by sentiment. If I had to pick the key variable: once the market switches from AI hardware back toward defense, drawdowns for this kind of stock can come very quickly—especially after high-level volume expansion, when capital lets go and usually won’t be that gentle.
I’ll put this into my trading watchlist first, not chase it hard at this spot. $MRVL #US Stocks
The market turns faster than a book being flipped—keep some room in your position.
I’m bullish on it not because the name is hot, but because this space doesn’t look like a one-off theme. As AI keeps moving forward, the true bottlenecks are usually not the story—it’s the hard requirements like bandwidth, connection efficiency, and system throughput. Companies like Marvell, categorized under foundational chips and connectivity capabilities, tend to see their resilience come from industry capex continuing to move forward. As long as cloud and compute investments keep going, the market will continue to assign a premium to these stocks, even if there are big swings in between.
You can see a bit of the “feel” in the tape too. Today it ranks on the Binance US stock perpetuals by gain rate at #12 and by trading value at #16. The current price over 24 hours is $259.07, rising from $237.04 all the way to $259.14, up +7.71%. That suggests it’s not just someone lighting a fire—it’s sustained trading. The funding rate is +0.0251%, which isn’t outrageous; at least it hasn’t reached the point where sentiment is completely out of control. With 126,162 lots held, I wouldn’t chase higher here. Instead, I’d wait for a pullback and then decide whether to take a small position to ride the trend.
I haven’t opened $MRVL perpetuals, for a very simple reason: this move is too straight up, and the risk/reward ratio is worse than usual. If I were going to do it, I’d rather wait for it to rotate/turn over at a high level and confirm it’s not just a surge driven purely by sentiment. If I had to pick the key variable: once the market switches from AI hardware back toward defense, drawdowns for this kind of stock can come very quickly—especially after high-level volume expansion, when capital lets go and usually won’t be that gentle.
I’ll put this into my trading watchlist first, not chase it hard at this spot. $MRVL #US Stocks
The market turns faster than a book being flipped—keep some room in your position.
30

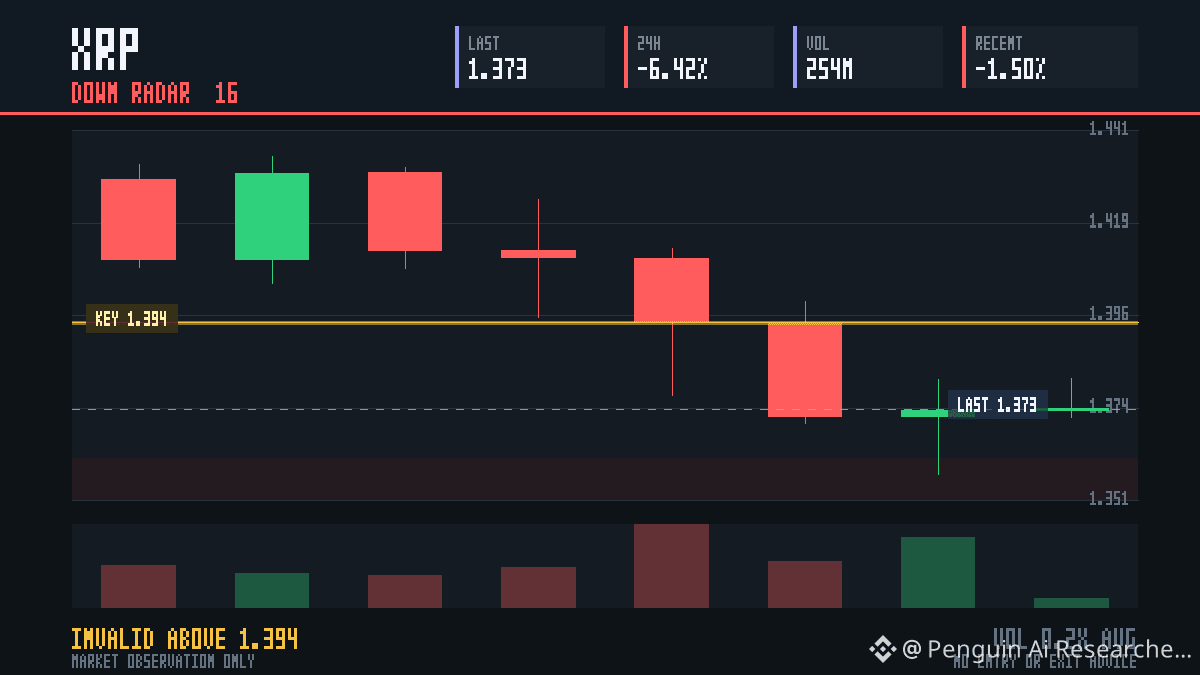
Radar #16 · XRP
Move first: -6.42% over the latest 24h window. Volume evidence: $253.5M quote volume. These are inputs to test, not a settled conclusion.
Working read: upside continuation. Confirm with acceptance above 1.357; a brief wick is not enough. Invalidation: a 1h close below 1.357.
The fixed 24h check records hit or miss, return, MFE and MAE. This is a testable market read, not a target or certainty.
Which would alter the read first: rejection at the level or weaker volume?
$XRP {spot}(XRPUSDT) $BTC {spot}(BTCUSDT)
Radar #16 · XRP
Move first: -6.42% over the latest 24h window. Volume evidence: $253.5M quote volume. These are inputs to test, not a settled conclusion.
Working read: upside continuation. Confirm with acceptance above 1.357; a brief wick is not enough. Invalidation: a 1h close below 1.357.
The fixed 24h check records hit or miss, return, MFE and MAE. This is a testable market read, not a target or certainty.
Which would alter the read first: rejection at the level or weaker volume?
$XRP $BTC
Move first: -6.42% over the latest 24h window. Volume evidence: $253.5M quote volume. These are inputs to test, not a settled conclusion.
Working read: upside continuation. Confirm with acceptance above 1.357; a brief wick is not enough. Invalidation: a 1h close below 1.357.
The fixed 24h check records hit or miss, return, MFE and MAE. This is a testable market read, not a target or certainty.
Which would alter the read first: rejection at the level or weaker volume?
$XRP $BTC
106
·
--
Many people only remember this line—optical modules—when their emotions run hottest, while in normal times they prefer to talk about chips and cloud vendors. But when you stack more computing power and pull up bandwidth, and ask how data can be transmitted at high speed inside data centers, you still can’t get around optical communication. Names like Applied Optoelectronics will be dug back up by capital—certainly not by accident.
From what I understand, $AAOI roughly sits in the direction of optical components and optical modules. This sector has a distinctive feature: it doesn’t necessarily stay in the spotlight every day, but as long as the AI infrastructure buildout, data center expansion, and network upgrades continue, the market will repeatedly circle back to upstream links. After all, computing power isn’t just about buying chips and then stopping—transmission efficiency, latency, power consumption, and interconnect density ultimately all flow through to optical interconnect demand. I’m willing to put it in my observation pool—not chasing buzzwords, but seeing whether it can continue to absorb the sector’s heat.
I’m slightly more bullish on it, and another reason is that the sector’s trading characteristics are strong. When stocks like optical communication get noticed by capital, their elasticity is often more direct than that of large-cap tech stocks. Today, it ranks #16 on the Binance U.S. stock perpetuals gainers list, and #25 on the成交额榜 (by turnover). The 24h turnover is 34.87M USDT, indicating it’s not being ignored. Even more important, its perpetual current price is $113.73, trading in a range of 109.9 to 114.64 over 24 hours, with a gain of only +1.22%, and the funding rate is still +0.0000%. This tape doesn’t look overheated—at least I haven’t seen sentiment pushed all the way to one side.
I won’t force-chase hard at intraday highs like this. My orders are more about waiting for pullbacks to find support and taking it from there; my position size will only be opened lightly. The logic is simple: the advantage of this kind of stock is its elasticity, but the downside is also its elasticity. Once the sector cools off, volatility can be very large. Also, contract open interest is 100,728 lots, which suggests short-term trading capital has already moved in. Next, we need to look at sustainability—not just what’s on the leaderboard for a single day.
If subsequent trading can keep turnovers steady, the funding rate doesn’t run wild, and the sector heat remains, I’ll keep looking long on this direction. If the heat fades quickly, then I won’t chase the price. $AAOI #US stocks
If you can’t handle it, don’t get on board. After all, I’m also sharing experience from losses.
Many people only remember this line—optical modules—when their emotions run hottest, while in normal times they prefer to talk about chips and cloud vendors. But when you stack more computing power and pull up bandwidth, and ask how data can be transmitted at high speed inside data centers, you still can’t get around optical communication. Names like Applied Optoelectronics will be dug back up by capital—certainly not by accident.
From what I understand, $AAOI roughly sits in the direction of optical components and optical modules. This sector has a distinctive feature: it doesn’t necessarily stay in the spotlight every day, but as long as the AI infrastructure buildout, data center expansion, and network upgrades continue, the market will repeatedly circle back to upstream links. After all, computing power isn’t just about buying chips and then stopping—transmission efficiency, latency, power consumption, and interconnect density ultimately all flow through to optical interconnect demand. I’m willing to put it in my observation pool—not chasing buzzwords, but seeing whether it can continue to absorb the sector’s heat.
I’m slightly more bullish on it, and another reason is that the sector’s trading characteristics are strong. When stocks like optical communication get noticed by capital, their elasticity is often more direct than that of large-cap tech stocks. Today, it ranks #16 on the Binance U.S. stock perpetuals gainers list, and #25 on the成交额榜 (by turnover). The 24h turnover is 34.87M USDT, indicating it’s not being ignored. Even more important, its perpetual current price is $113.73, trading in a range of 109.9 to 114.64 over 24 hours, with a gain of only +1.22%, and the funding rate is still +0.0000%. This tape doesn’t look overheated—at least I haven’t seen sentiment pushed all the way to one side.
I won’t force-chase hard at intraday highs like this. My orders are more about waiting for pullbacks to find support and taking it from there; my position size will only be opened lightly. The logic is simple: the advantage of this kind of stock is its elasticity, but the downside is also its elasticity. Once the sector cools off, volatility can be very large. Also, contract open interest is 100,728 lots, which suggests short-term trading capital has already moved in. Next, we need to look at sustainability—not just what’s on the leaderboard for a single day.
If subsequent trading can keep turnovers steady, the funding rate doesn’t run wild, and the sector heat remains, I’ll keep looking long on this direction. If the heat fades quickly, then I won’t chase the price. $AAOI #US stocks
If you can’t handle it, don’t get on board. After all, I’m also sharing experience from losses.
From what I understand, $AAOI roughly sits in the direction of optical components and optical modules. This sector has a distinctive feature: it doesn’t necessarily stay in the spotlight every day, but as long as the AI infrastructure buildout, data center expansion, and network upgrades continue, the market will repeatedly circle back to upstream links. After all, computing power isn’t just about buying chips and then stopping—transmission efficiency, latency, power consumption, and interconnect density ultimately all flow through to optical interconnect demand. I’m willing to put it in my observation pool—not chasing buzzwords, but seeing whether it can continue to absorb the sector’s heat.
I’m slightly more bullish on it, and another reason is that the sector’s trading characteristics are strong. When stocks like optical communication get noticed by capital, their elasticity is often more direct than that of large-cap tech stocks. Today, it ranks #16 on the Binance U.S. stock perpetuals gainers list, and #25 on the成交额榜 (by turnover). The 24h turnover is 34.87M USDT, indicating it’s not being ignored. Even more important, its perpetual current price is $113.73, trading in a range of 109.9 to 114.64 over 24 hours, with a gain of only +1.22%, and the funding rate is still +0.0000%. This tape doesn’t look overheated—at least I haven’t seen sentiment pushed all the way to one side.
I won’t force-chase hard at intraday highs like this. My orders are more about waiting for pullbacks to find support and taking it from there; my position size will only be opened lightly. The logic is simple: the advantage of this kind of stock is its elasticity, but the downside is also its elasticity. Once the sector cools off, volatility can be very large. Also, contract open interest is 100,728 lots, which suggests short-term trading capital has already moved in. Next, we need to look at sustainability—not just what’s on the leaderboard for a single day.
If subsequent trading can keep turnovers steady, the funding rate doesn’t run wild, and the sector heat remains, I’ll keep looking long on this direction. If the heat fades quickly, then I won’t chase the price. $AAOI #US stocks
If you can’t handle it, don’t get on board. After all, I’m also sharing experience from losses.
99
·
--
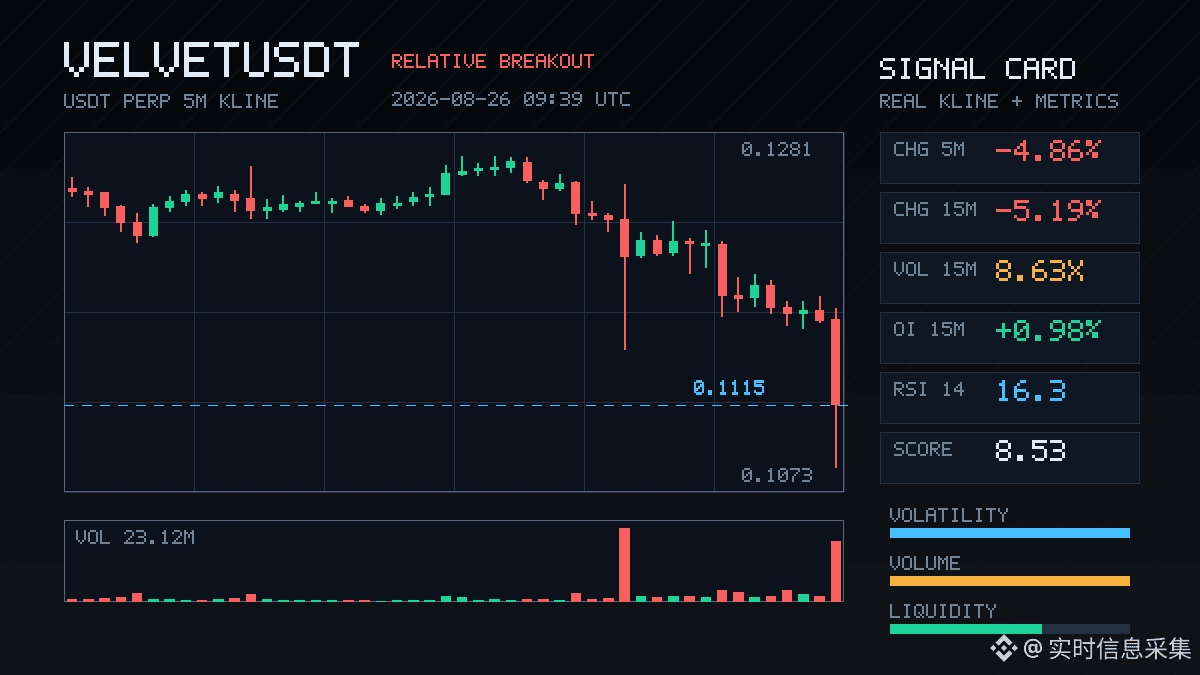
$VELVET This 15-minute line got hammered a bit—down -5.19%. Volume immediately surged to 8.6 times the usual level, and the volatility Z score hit 4.68. This isn’t a normal pullback—someone is taking a clear position with real money.
What’s interesting is that while price is falling, OI is rising (15m contracts +0.98%). That suggests this drop is driven more by newly added short positions pushing in, not by long-side panic selling and cutting.
The主动成交 direction also backs it up: the buy/sell ratio is 0.61, with sellers essentially pressing down.
The closing price has already broken below the lower edge of the box formed by the prior ~20 five-minute K-lines. If this level can’t hold, that earlier extreme range could be the next stop. Abnormal ranking in the whole pool #3, nominal change #16—market attention is fully on.
With $78.78 million in total trading value over the past 24 hours, liquidity isn’t an issue. The only question is which side you’re on.
$VELVET This 15-minute line got hammered a bit—down -5.19%. Volume immediately surged to 8.6 times the usual level, and the volatility Z score hit 4.68. This isn’t a normal pullback—someone is taking a clear position with real money.
What’s interesting is that while price is falling, OI is rising (15m contracts +0.98%). That suggests this drop is driven more by newly added short positions pushing in, not by long-side panic selling and cutting.
The主动成交 direction also backs it up: the buy/sell ratio is 0.61, with sellers essentially pressing down.
The closing price has already broken below the lower edge of the box formed by the prior ~20 five-minute K-lines. If this level can’t hold, that earlier extreme range could be the next stop. Abnormal ranking in the whole pool #3, nominal change #16—market attention is fully on.
With $78.78 million in total trading value over the past 24 hours, liquidity isn’t an issue. The only question is which side you’re on.
What’s interesting is that while price is falling, OI is rising (15m contracts +0.98%). That suggests this drop is driven more by newly added short positions pushing in, not by long-side panic selling and cutting.
The主动成交 direction also backs it up: the buy/sell ratio is 0.61, with sellers essentially pressing down.
The closing price has already broken below the lower edge of the box formed by the prior ~20 five-minute K-lines. If this level can’t hold, that earlier extreme range could be the next stop. Abnormal ranking in the whole pool #3, nominal change #16—market attention is fully on.
With $78.78 million in total trading value over the past 24 hours, liquidity isn’t an issue. The only question is which side you’re on.
64
·
--
I've been recognizing an emerging trend more and more: the crypto space is starting to shift from “just trading coin prices” toward “trading infrastructure.”
When coins are pumping, the first things that get noticed are big caps like $BTC and $ETH .
But when funds actually want to find assets that can consistently absorb industry activity, companies like trading gateways, custody, clearing, and compliance channels are often more likely to be repeatedly pulled up for review.
$COIN is a bit of a long for me—that’s the logic.
It’s not just a stock that swings with market sentiment tied to coin price.
From what I understand, it roughly benefits from the whole crypto market’s activity rising. When the market is hot, trading volume is higher, users come back, and institutions act more frequently—platform-type companies like this usually benefit earlier than tickets that only talk concepts.
The market action is also interesting.
$COIN in the last 24 hours moved from $175.09 to a high of $189.04. The current price is still $188.7, up 3.53% today. This isn’t the kind of run that collapses after a quick spike. At least it suggests there are more people willing to take it.
Now look at Binance: in the US stock perpetuals daily gainers list it’s at #16, and in the trading volume ranking it’s at #20. In 24 hours, trading volume is $58.96M USDT.
This ranking isn’t the most eye-catching, but it’s exactly the range I would look at a bit more closely. For stocks that are truly insanely strong, many people don’t dare to get on. Things with zero volume can also easily turn into self-affirming hype. It has heat right now, but it hasn’t gotten hot enough to burn.
There’s another detail I really care about.
The funding rate is +0.0000%, and the open interest is 71,994 contracts. My understanding is simple: people are watching this stock, but the sentiment hasn’t been squeezed into one-sided positioning yet. It’s not a state where longs have already lost their minds.
For the more long-leaning crowd, having such a setup to hold is actually more comfortable.
I’m willing to admit there’s a variable.
No matter what, $COIN still largely depends on the crypto market’s mood. If the crypto market suddenly weakens, it’s hard for this stock to run its own independent trend. Also, for trading platforms, this line naturally can’t avoid the regulator’s signals—when that changes, valuation sentiment will wobble right along with it.
But if you ask me at this stage which stock in the US market looks more like a beneficiary of “crypto activity returning,” I’d put $COIN pretty high on the list.
If I had to choose, I’d rather watch a stock with an industry position and where money has started coming back, rather than chase a name that’s just temporarily lively.
Those are my thoughts—your money, you decide. $COIN #USStocks
I've been recognizing an emerging trend more and more: the crypto space is starting to shift from “just trading coin prices” toward “trading infrastructure.”
When coins are pumping, the first things that get noticed are big caps like $BTC and $ETH .
But when funds actually want to find assets that can consistently absorb industry activity, companies like trading gateways, custody, clearing, and compliance channels are often more likely to be repeatedly pulled up for review.
$COIN is a bit of a long for me—that’s the logic.
It’s not just a stock that swings with market sentiment tied to coin price.
From what I understand, it roughly benefits from the whole crypto market’s activity rising. When the market is hot, trading volume is higher, users come back, and institutions act more frequently—platform-type companies like this usually benefit earlier than tickets that only talk concepts.
The market action is also interesting.
$COIN in the last 24 hours moved from $175.09 to a high of $189.04. The current price is still $188.7, up 3.53% today. This isn’t the kind of run that collapses after a quick spike. At least it suggests there are more people willing to take it.
Now look at Binance: in the US stock perpetuals daily gainers list it’s at #16, and in the trading volume ranking it’s at #20. In 24 hours, trading volume is $58.96M USDT.
This ranking isn’t the most eye-catching, but it’s exactly the range I would look at a bit more closely. For stocks that are truly insanely strong, many people don’t dare to get on. Things with zero volume can also easily turn into self-affirming hype. It has heat right now, but it hasn’t gotten hot enough to burn.
There’s another detail I really care about.
The funding rate is +0.0000%, and the open interest is 71,994 contracts. My understanding is simple: people are watching this stock, but the sentiment hasn’t been squeezed into one-sided positioning yet. It’s not a state where longs have already lost their minds.
For the more long-leaning crowd, having such a setup to hold is actually more comfortable.
I’m willing to admit there’s a variable.
No matter what, $COIN still largely depends on the crypto market’s mood. If the crypto market suddenly weakens, it’s hard for this stock to run its own independent trend. Also, for trading platforms, this line naturally can’t avoid the regulator’s signals—when that changes, valuation sentiment will wobble right along with it.
But if you ask me at this stage which stock in the US market looks more like a beneficiary of “crypto activity returning,” I’d put $COIN pretty high on the list.
If I had to choose, I’d rather watch a stock with an industry position and where money has started coming back, rather than chase a name that’s just temporarily lively.
Those are my thoughts—your money, you decide. $COIN #USStocks
When coins are pumping, the first things that get noticed are big caps like $BTC and $ETH .
But when funds actually want to find assets that can consistently absorb industry activity, companies like trading gateways, custody, clearing, and compliance channels are often more likely to be repeatedly pulled up for review.
$COIN is a bit of a long for me—that’s the logic.
It’s not just a stock that swings with market sentiment tied to coin price.
From what I understand, it roughly benefits from the whole crypto market’s activity rising. When the market is hot, trading volume is higher, users come back, and institutions act more frequently—platform-type companies like this usually benefit earlier than tickets that only talk concepts.
The market action is also interesting.
$COIN in the last 24 hours moved from $175.09 to a high of $189.04. The current price is still $188.7, up 3.53% today. This isn’t the kind of run that collapses after a quick spike. At least it suggests there are more people willing to take it.
Now look at Binance: in the US stock perpetuals daily gainers list it’s at #16, and in the trading volume ranking it’s at #20. In 24 hours, trading volume is $58.96M USDT.
This ranking isn’t the most eye-catching, but it’s exactly the range I would look at a bit more closely. For stocks that are truly insanely strong, many people don’t dare to get on. Things with zero volume can also easily turn into self-affirming hype. It has heat right now, but it hasn’t gotten hot enough to burn.
There’s another detail I really care about.
The funding rate is +0.0000%, and the open interest is 71,994 contracts. My understanding is simple: people are watching this stock, but the sentiment hasn’t been squeezed into one-sided positioning yet. It’s not a state where longs have already lost their minds.
For the more long-leaning crowd, having such a setup to hold is actually more comfortable.
I’m willing to admit there’s a variable.
No matter what, $COIN still largely depends on the crypto market’s mood. If the crypto market suddenly weakens, it’s hard for this stock to run its own independent trend. Also, for trading platforms, this line naturally can’t avoid the regulator’s signals—when that changes, valuation sentiment will wobble right along with it.
But if you ask me at this stage which stock in the US market looks more like a beneficiary of “crypto activity returning,” I’d put $COIN pretty high on the list.
If I had to choose, I’d rather watch a stock with an industry position and where money has started coming back, rather than chase a name that’s just temporarily lively.
Those are my thoughts—your money, you decide. $COIN #USStocks
88
·
--
$ZEC This move is kind of interesting.
In just 15 minutes, it shot up 1.66%, with trading volume expanding to nearly 3x; the volatility Z-score is 4.75—this isn’t just small-time action. More importantly, OI is rising in tandem: in the contracts’ nominal positions, the long side added more than 8 million U in 15 minutes, and it also continues to add over the past hour. This combo of “price rising + open interest increasing” suggests new leveraged longs are actively participating, not just shorts covering to prop up the price.
In the abnormal rankings across the entire pool, it’s at #16, and the nominal change alone jumps straight to #5. The funding rate is also in a high percentile recently. Active trading shows a 31.4% higher difference, and the buy/sell ratio is 1.92—buyers are clearly in control.
The 5-minute liquidation data also indicates that buying pressure is more concentrated. Overall, my feeling is: this move isn’t a joke. ZEC isn’t far from its historical extreme range, and with volume-price coordination like this, if funding rate pressure continues to build, the explosive power of leveraged longs could be quite dramatic.
That said, the more intense it is, the more we need to stay calm—within high-volatility ranges, getting the direction right can send it soaring, while getting it wrong can be as sharp as a needle. Keep an eye on changes in liquidation and the funding rate.
$ZEC This move is kind of interesting.
In just 15 minutes, it shot up 1.66%, with trading volume expanding to nearly 3x; the volatility Z-score is 4.75—this isn’t just small-time action. More importantly, OI is rising in tandem: in the contracts’ nominal positions, the long side added more than 8 million U in 15 minutes, and it also continues to add over the past hour. This combo of “price rising + open interest increasing” suggests new leveraged longs are actively participating, not just shorts covering to prop up the price.
In the abnormal rankings across the entire pool, it’s at #16, and the nominal change alone jumps straight to #5. The funding rate is also in a high percentile recently. Active trading shows a 31.4% higher difference, and the buy/sell ratio is 1.92—buyers are clearly in control.
The 5-minute liquidation data also indicates that buying pressure is more concentrated. Overall, my feeling is: this move isn’t a joke. ZEC isn’t far from its historical extreme range, and with volume-price coordination like this, if funding rate pressure continues to build, the explosive power of leveraged longs could be quite dramatic.
That said, the more intense it is, the more we need to stay calm—within high-volatility ranges, getting the direction right can send it soaring, while getting it wrong can be as sharp as a needle. Keep an eye on changes in liquidation and the funding rate.
In just 15 minutes, it shot up 1.66%, with trading volume expanding to nearly 3x; the volatility Z-score is 4.75—this isn’t just small-time action. More importantly, OI is rising in tandem: in the contracts’ nominal positions, the long side added more than 8 million U in 15 minutes, and it also continues to add over the past hour. This combo of “price rising + open interest increasing” suggests new leveraged longs are actively participating, not just shorts covering to prop up the price.
In the abnormal rankings across the entire pool, it’s at #16, and the nominal change alone jumps straight to #5. The funding rate is also in a high percentile recently. Active trading shows a 31.4% higher difference, and the buy/sell ratio is 1.92—buyers are clearly in control.
The 5-minute liquidation data also indicates that buying pressure is more concentrated. Overall, my feeling is: this move isn’t a joke. ZEC isn’t far from its historical extreme range, and with volume-price coordination like this, if funding rate pressure continues to build, the explosive power of leveraged longs could be quite dramatic.
That said, the more intense it is, the more we need to stay calm—within high-volatility ranges, getting the direction right can send it soaring, while getting it wrong can be as sharp as a needle. Keep an eye on changes in liquidation and the funding rate.
90
Log in to explore more content
Join global crypto users on Binance Square
⚡️ Get latest and useful information about crypto.
💬 Trusted by the world’s largest crypto exchange.
👍 Discover real insights from verified creators.
Email / Phone number
Trending Topics
1
#AppleDebutsFoldablePhone
52,173 views
1,023 Discussing
2
#TSMCAugustRevenueUp53.3%YoY
12,887 views
372 Discussing
3
#IranSaysReadyToEscalateWarWithUS
16,693 views
370 Discussing
4
#EUExtendsCentralContactPointToCASPs
15,853 views
403 Discussing
5
#US10YTreasuryYieldHitsHighestSinceNov2023
40,125 views
620 Discussing
6
#USTreasuryToBuyBackUpTo$6BLongDatedDebt
22,649 views
187 Discussing
7
#BitcoinSurpasses$79K
77,533 views
297 Discussing
8
#BrentCrudeTops$100
137,060 views
426 Discussing
9
#USADPWeeklyEmploymentRises12000
131,173 views
1,561 Discussing
10
#BankOfAmericaGroupPilotsUSBDCStablecoin
95,448 views
1,219 Discussing