
#25
25
38,999 views
123 Discussing
Hot
Latest

·
--
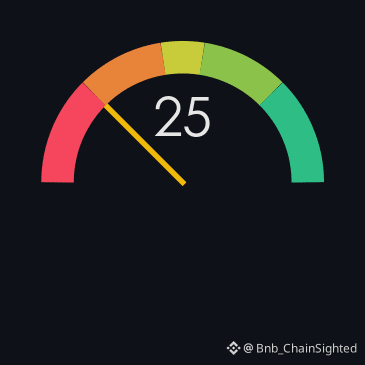
Extreme fear. That's the crypto fear-greed index at 25/100 - and it hasn’t moved in 24 hours.
Yet, over the past week, fear has climbed 8.7%.
It’s like the market is holding its breath, waiting for a trigger.
Meanwhile, Ethereum is doing something strange.
It’s down ↓2.44% in the last 24 hours, but its 7-day return is ↑6.4%.
That’s a classic case of short-term pain, long-term gain.
It’s not breaking out, but it’s not falling apart either.
It’s holding its ground - and that’s not typical when the mood is this low.
—
Not financial advice. DYOR.
📌 Fear & Greed · #25 · #FearAndGreed #CryptoSighted
Extreme fear. That's the crypto fear-greed index at 25/100 - and it hasn’t moved in 24 hours.
Yet, over the past week, fear has climbed 8.7%.
It’s like the market is holding its breath, waiting for a trigger.
Meanwhile, Ethereum is doing something strange.
It’s down ↓2.44% in the last 24 hours, but its 7-day return is ↑6.4%.
That’s a classic case of short-term pain, long-term gain.
It’s not breaking out, but it’s not falling apart either.
It’s holding its ground - and that’s not typical when the mood is this low.
—
Not financial advice. DYOR.
📌 Fear & Greed · #25 · #FearAndGreed #CryptoSighted
Yet, over the past week, fear has climbed 8.7%.
It’s like the market is holding its breath, waiting for a trigger.
Meanwhile, Ethereum is doing something strange.
It’s down ↓2.44% in the last 24 hours, but its 7-day return is ↑6.4%.
That’s a classic case of short-term pain, long-term gain.
It’s not breaking out, but it’s not falling apart either.
It’s holding its ground - and that’s not typical when the mood is this low.
—
Not financial advice. DYOR.
📌 Fear & Greed · #25 · #FearAndGreed #CryptoSighted
90

·
--
** AVAX rockets 14.57% while ETH slides 2.45% – is the tide turning?Avalanche (AVAXUSDT) is trending right now!
Rank: #25
** AVAX just exploded **14.57%** to **0.38** in 24h! 🎯 Meanwhile slipped to **,575.35**, a **‑2.449%** dip, and is down **‑2.013%**. I think the pull
#bitcoin #ethereum #crypto
** AVAX rockets 14.57% while ETH slides 2.45% – is the tide turning?
36

·
--
$S 15 minutes, it rose 2.34%, but OI has been falling continuously in both the 15m and 1h windows, -2.84%/-4.93%, and notional has decreased by nearly 600k U. Price is up while open interest is down—typical short-covering. The buy/sell ratio for active orders is 1.68, and the trade spread is down 25.2%, with the bids clearly dominant. The abnormal percentile is 92.1%, the full pool #25. This level is worth watching to see whether there’s follow-through.
$S 15 minutes, it rose 2.34%, but OI has been falling continuously in both the 15m and 1h windows, -2.84%/-4.93%, and notional has decreased by nearly 600k U. Price is up while open interest is down—typical short-covering. The buy/sell ratio for active orders is 1.68, and the trade spread is down 25.2%, with the bids clearly dominant. The abnormal percentile is 92.1%, the full pool #25. This level is worth watching to see whether there’s follow-through.
6

·
--
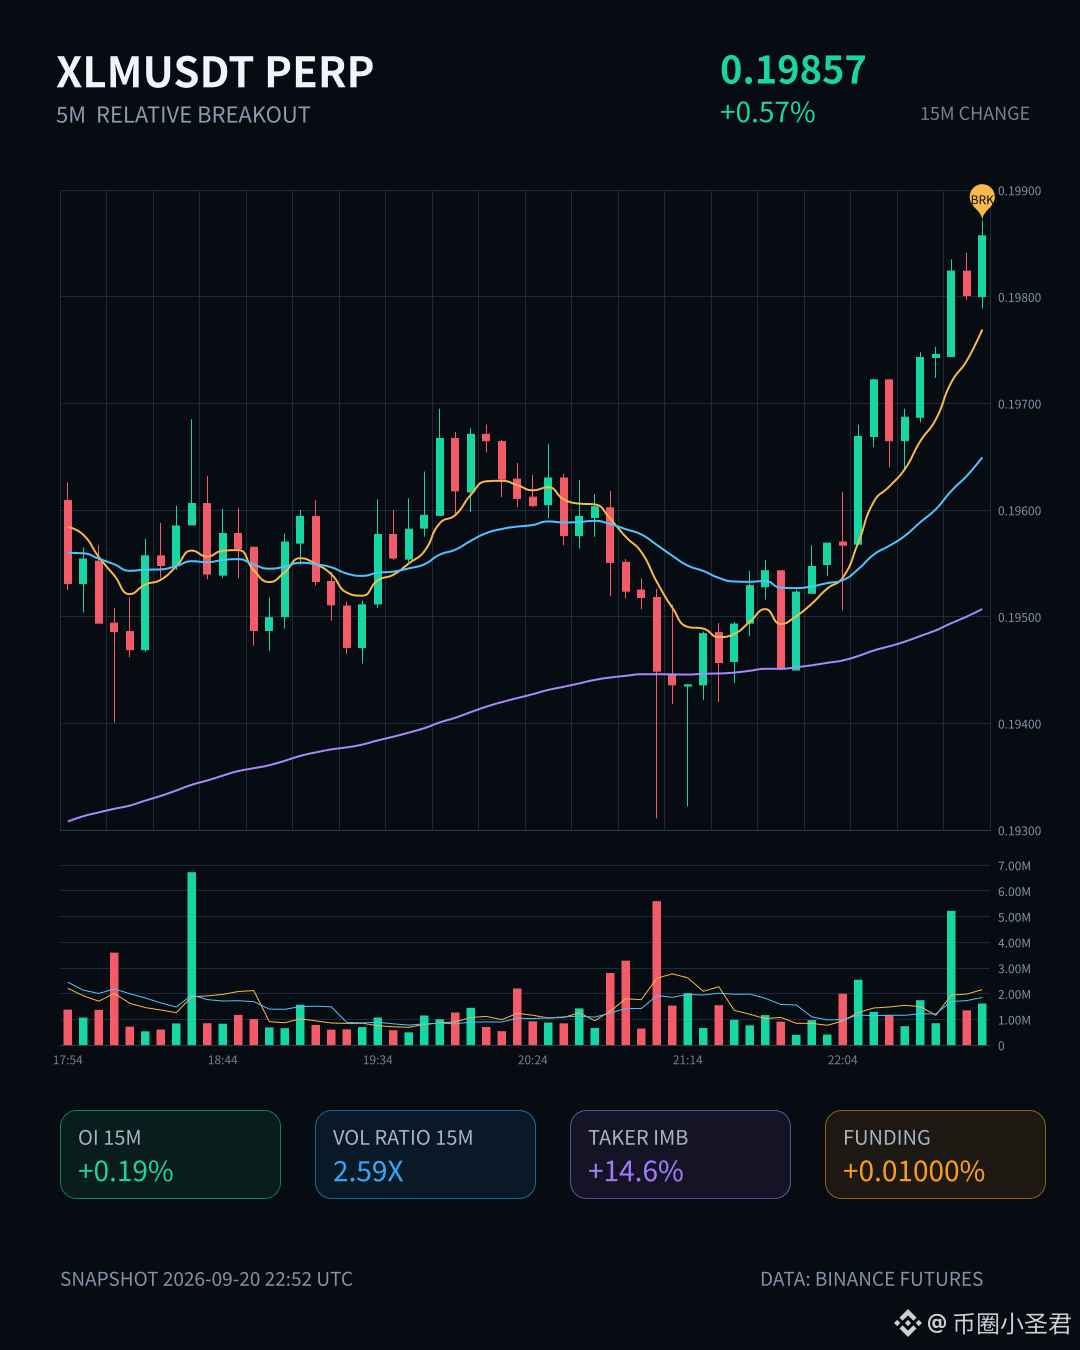
$XLM This 15m is kind of interesting: the price only rose by 0.57%, but the volume directly jumped to 2.59x. The close also broke through the upper bound of the recent 20 or so 5m candles.
More importantly, OI: 15m +0.19%, 1h +1.00%. The notional change totals over a million U; the abnormal percentile is 81.3%, and the whole pool ranks at #25. This isn’t just spot pushing—it looks more like fresh leveraged long positions are entering.
The active trade imbalance is -14.6%, buy/sell ratio is 1.34, and the funding rate has also reached a recent high percentile. The breakout is real, but leverage has definitely been stacked as well.
With this kind of structure, you can chase the breakout, but you need to keep an eye on OI—don’t let it keep surging like this, or it’s basically planting a landmine for what comes next.
$XLM This 15m is kind of interesting: the price only rose by 0.57%, but the volume directly jumped to 2.59x. The close also broke through the upper bound of the recent 20 or so 5m candles.
More importantly, OI: 15m +0.19%, 1h +1.00%. The notional change totals over a million U; the abnormal percentile is 81.3%, and the whole pool ranks at #25. This isn’t just spot pushing—it looks more like fresh leveraged long positions are entering.
The active trade imbalance is -14.6%, buy/sell ratio is 1.34, and the funding rate has also reached a recent high percentile. The breakout is real, but leverage has definitely been stacked as well.
With this kind of structure, you can chase the breakout, but you need to keep an eye on OI—don’t let it keep surging like this, or it’s basically planting a landmine for what comes next.
More importantly, OI: 15m +0.19%, 1h +1.00%. The notional change totals over a million U; the abnormal percentile is 81.3%, and the whole pool ranks at #25. This isn’t just spot pushing—it looks more like fresh leveraged long positions are entering.
The active trade imbalance is -14.6%, buy/sell ratio is 1.34, and the funding rate has also reached a recent high percentile. The breakout is real, but leverage has definitely been stacked as well.
With this kind of structure, you can chase the breakout, but you need to keep an eye on OI—don’t let it keep surging like this, or it’s basically planting a landmine for what comes next.
21

·
--
$PUMP This move is a bit interesting.
In the 15m timeframe, it gained nearly 1%, volume and activity at 1.59x, and the Z value is 2.29. It’s not violent, but it clearly shows someone has been making moves here. The closing price directly broke through the upper edge of nearly 20 consecutive 5m candles. Active buy-side turnover minus active sell-side turnover is +5.1%, and the buy/sell ratio is 1.11. The bulls are pushing in with market orders.
What’s even more worth watching is OI—both the 15m and 1h show increases. The notional change ranks #25 across the whole pool, the percentile is 51% (an abnormal percentile), and the funding rate is still stuck in the high percentile recently. Price is rising along with OI—this structure isn’t short-covering; it’s newly added leveraged longs entering the market. Over the past 24h, trading value is 122.91M, and the order book depth is sufficient; it’s not the kind of flurry where nobody comes to take it after the push.
Of course, a high funding-rate percentile is a double-edged sword. When longs are crowded, the opposite side can hurt the most. Whether the breakout can hold depends on whether the next few 5m candles can defend this upper edge—if it can’t, it’s the classic fake-breakout script.
Keep an eye on it first; don’t rush to chase.
$PUMP This move is a bit interesting.
In the 15m timeframe, it gained nearly 1%, volume and activity at 1.59x, and the Z value is 2.29. It’s not violent, but it clearly shows someone has been making moves here. The closing price directly broke through the upper edge of nearly 20 consecutive 5m candles. Active buy-side turnover minus active sell-side turnover is +5.1%, and the buy/sell ratio is 1.11. The bulls are pushing in with market orders.
What’s even more worth watching is OI—both the 15m and 1h show increases. The notional change ranks #25 across the whole pool, the percentile is 51% (an abnormal percentile), and the funding rate is still stuck in the high percentile recently. Price is rising along with OI—this structure isn’t short-covering; it’s newly added leveraged longs entering the market. Over the past 24h, trading value is 122.91M, and the order book depth is sufficient; it’s not the kind of flurry where nobody comes to take it after the push.
Of course, a high funding-rate percentile is a double-edged sword. When longs are crowded, the opposite side can hurt the most. Whether the breakout can hold depends on whether the next few 5m candles can defend this upper edge—if it can’t, it’s the classic fake-breakout script.
Keep an eye on it first; don’t rush to chase.
In the 15m timeframe, it gained nearly 1%, volume and activity at 1.59x, and the Z value is 2.29. It’s not violent, but it clearly shows someone has been making moves here. The closing price directly broke through the upper edge of nearly 20 consecutive 5m candles. Active buy-side turnover minus active sell-side turnover is +5.1%, and the buy/sell ratio is 1.11. The bulls are pushing in with market orders.
What’s even more worth watching is OI—both the 15m and 1h show increases. The notional change ranks #25 across the whole pool, the percentile is 51% (an abnormal percentile), and the funding rate is still stuck in the high percentile recently. Price is rising along with OI—this structure isn’t short-covering; it’s newly added leveraged longs entering the market. Over the past 24h, trading value is 122.91M, and the order book depth is sufficient; it’s not the kind of flurry where nobody comes to take it after the push.
Of course, a high funding-rate percentile is a double-edged sword. When longs are crowded, the opposite side can hurt the most. Whether the breakout can hold depends on whether the next few 5m candles can defend this upper edge—if it can’t, it’s the classic fake-breakout script.
Keep an eye on it first; don’t rush to chase.
8

·
--
NEAR SURGES AS AI NODE DEMAND SKYROCKETS 🚀📈
The $NEAR spot chart ripped through the $3.1075 mid‑range, vaulting 31.02% in 24 hours and carving a clear path toward the $3.5541 resistance zone 🚀. Volume surged past $310 M, underscoring aggressive capital inflows as the token ranked #25 on CoinGecko 📈. The breakout erased the previous low‑ball $2.6430 floor, establishing a new support band just above $2.6562. Market sentiment is overwhelmingly bullish, with 89% of participants flagging $NEAR as a top‑play in the AI sector.
Underlying drivers stem from soaring AI‑compute demand, where $NEAR’s sharding architecture fuels node utilization rates that have climbed into double‑digit growth 🤖. Institutional players are loading up on staking contracts to lock in network fees, reinforcing the upward pressure. If the token holds the $3.4000‑$3.5000 corridor, a clean break of $3.5541 could trigger a swing toward $3.80, extending the rally. Conversely, a retest of $2.6562 would merely provide a fresh buying platform, keeping the momentum intact.
DYOR
Follow for Updates
#NEAR #AI #CryptoTrending #BinanceSquare
NEAR SURGES AS AI NODE DEMAND SKYROCKETS 🚀📈
The $NEAR spot chart ripped through the $3.1075 mid‑range, vaulting 31.02% in 24 hours and carving a clear path toward the $3.5541 resistance zone 🚀. Volume surged past $310 M, underscoring aggressive capital inflows as the token ranked #25 on CoinGecko 📈. The breakout erased the previous low‑ball $2.6430 floor, establishing a new support band just above $2.6562. Market sentiment is overwhelmingly bullish, with 89% of participants flagging $NEAR as a top‑play in the AI sector.
Underlying drivers stem from soaring AI‑compute demand, where $NEAR ’s sharding architecture fuels node utilization rates that have climbed into double‑digit growth 🤖. Institutional players are loading up on staking contracts to lock in network fees, reinforcing the upward pressure. If the token holds the $3.4000‑$3.5000 corridor, a clean break of $3.5541 could trigger a swing toward $3.80, extending the rally. Conversely, a retest of $2.6562 would merely provide a fresh buying platform, keeping the momentum intact.
DYOR
Follow for Updates
#NEAR #AI #CryptoTrending #BinanceSquare
The $NEAR spot chart ripped through the $3.1075 mid‑range, vaulting 31.02% in 24 hours and carving a clear path toward the $3.5541 resistance zone 🚀. Volume surged past $310 M, underscoring aggressive capital inflows as the token ranked #25 on CoinGecko 📈. The breakout erased the previous low‑ball $2.6430 floor, establishing a new support band just above $2.6562. Market sentiment is overwhelmingly bullish, with 89% of participants flagging $NEAR as a top‑play in the AI sector.
Underlying drivers stem from soaring AI‑compute demand, where $NEAR ’s sharding architecture fuels node utilization rates that have climbed into double‑digit growth 🤖. Institutional players are loading up on staking contracts to lock in network fees, reinforcing the upward pressure. If the token holds the $3.4000‑$3.5000 corridor, a clean break of $3.5541 could trigger a swing toward $3.80, extending the rally. Conversely, a retest of $2.6562 would merely provide a fresh buying platform, keeping the momentum intact.
DYOR
Follow for Updates
#NEAR #AI #CryptoTrending #BinanceSquare
37

·
--
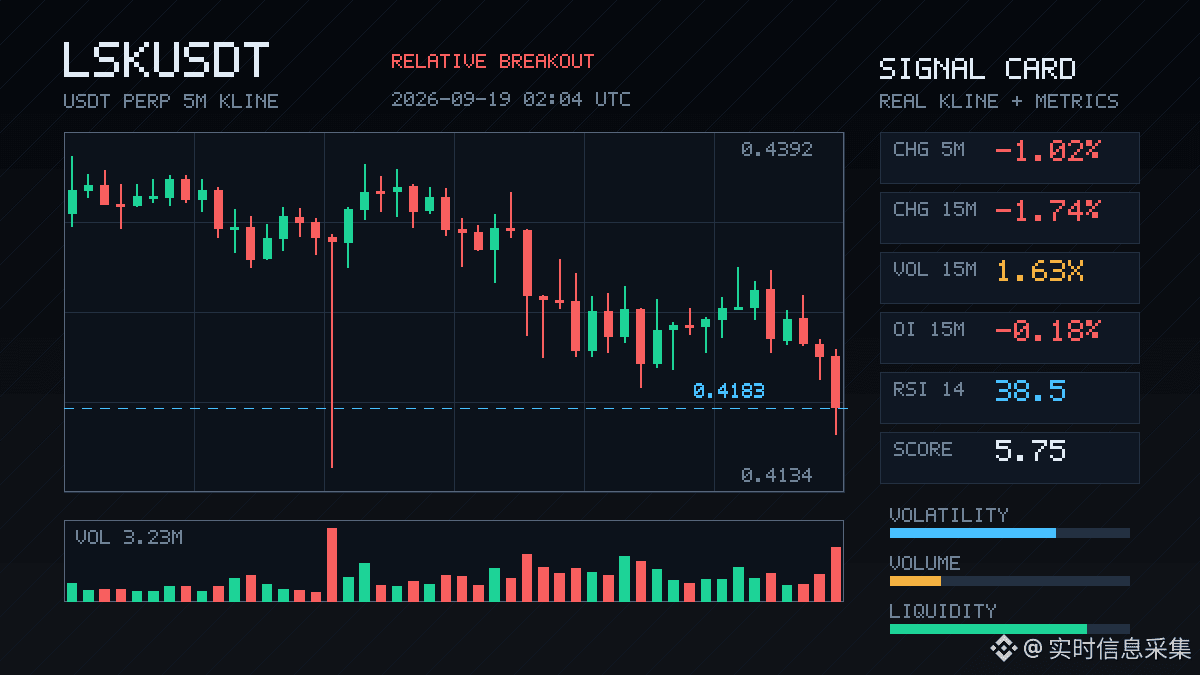
The 15-minute drop in stock $LSK was quite decisive. While the -1.74% drop isn't large, the volume of 1.63 times the base and the volatility Z of 2.75, coupled with the closing price breaking below the lower edge of nearly 20 5-minute trading ranges, indicate a genuine breakdown in the short-term structure.
More interestingly, the OI (On-the-Spot Index) shows a 15-minute -0.18% change, while the 1-hour chart shows a +0.59% change, with both nominal changes being negative. This isn't the typical short-selling strategy; it resembles a long position deleveraging, with strong signs of stop-loss orders and passive position reduction. The active trading volume difference is -14.4%, and the buy-sell ratio is 0.75, indicating a clear bias towards selling pressure.
The stock is at the 84.1% abnormal percentile, ranking as anomaly#28and nominal change #25. While not among the most explosive, it's still worth watching. The 24-hour trading volume is still 287.70 million, indicating decent liquidity. If the price continues to fall, the question is where the support will be.
My current view is: this isn't panic selling, it's a contraction of positions. Let's see when this deleveraging stops before rushing to buy. Wait for the selling pressure to subside.
The 15-minute drop in stock $LSK was quite decisive. While the -1.74% drop isn't large, the volume of 1.63 times the base and the volatility Z of 2.75, coupled with the closing price breaking below the lower edge of nearly 20 5-minute trading ranges, indicate a genuine breakdown in the short-term structure.
More interestingly, the OI (On-the-Spot Index) shows a 15-minute -0.18% change, while the 1-hour chart shows a +0.59% change, with both nominal changes being negative. This isn't the typical short-selling strategy; it resembles a long position deleveraging, with strong signs of stop-loss orders and passive position reduction. The active trading volume difference is -14.4%, and the buy-sell ratio is 0.75, indicating a clear bias towards selling pressure.
The stock is at the 84.1% abnormal percentile, ranking as anomaly#28and nominal change #25. While not among the most explosive, it's still worth watching. The 24-hour trading volume is still 287.70 million, indicating decent liquidity. If the price continues to fall, the question is where the support will be.
My current view is: this isn't panic selling, it's a contraction of positions. Let's see when this deleveraging stops before rushing to buy. Wait for the selling pressure to subside.
More interestingly, the OI (On-the-Spot Index) shows a 15-minute -0.18% change, while the 1-hour chart shows a +0.59% change, with both nominal changes being negative. This isn't the typical short-selling strategy; it resembles a long position deleveraging, with strong signs of stop-loss orders and passive position reduction. The active trading volume difference is -14.4%, and the buy-sell ratio is 0.75, indicating a clear bias towards selling pressure.
The stock is at the 84.1% abnormal percentile, ranking as anomaly#28and nominal change #25. While not among the most explosive, it's still worth watching. The 24-hour trading volume is still 287.70 million, indicating decent liquidity. If the price continues to fall, the question is where the support will be.
My current view is: this isn't panic selling, it's a contraction of positions. Let's see when this deleveraging stops before rushing to buy. Wait for the selling pressure to subside.
265

·
--
$CAP This move is kind of interesting.
In 15m, it jumped 2.72%. The volume even reached 2.06x, and the closing price broke above the upper bound of nearly 20 consecutive 5m candles—but OI is falling. In 15m it’s -0.11%, and in 1h it’s -0.81%. Price is rising while positions are shrinking. This doesn’t look like new money entering; it looks more like old shorts being carried up—heavy short covering vibes.
The aggressive trade volume is down -7.3%, and the buy/sell ratio is 0.86. That suggests the rally isn’t pushed by aggressive buying; it’s more like being lifted passively by short liquidation/covering. This kind of structure won’t go far unless real fresh capital follows through.
That said, OI is at a very high percentile—93.5%. In the whole pool, #5; nominal change #25. The price is already sitting right against its own historical extreme range. At this location, it’s either the eve of a breakout, or a fake breakout that traps people.
Over 24h, the turnover is 20M—depth is still decent to judge. My approach is to wait for confirmation rather than chase this candle. In a market driven by short covering, the pullback is the real opportunity; jumping in to catch the falling knife is basically becoming the counterparty to whoever’s covering.
$CAP Watch the upper edge of the 5m range. If it breaks and can’t hold, get out.
$CAP This move is kind of interesting.
In 15m, it jumped 2.72%. The volume even reached 2.06x, and the closing price broke above the upper bound of nearly 20 consecutive 5m candles—but OI is falling. In 15m it’s -0.11%, and in 1h it’s -0.81%. Price is rising while positions are shrinking. This doesn’t look like new money entering; it looks more like old shorts being carried up—heavy short covering vibes.
The aggressive trade volume is down -7.3%, and the buy/sell ratio is 0.86. That suggests the rally isn’t pushed by aggressive buying; it’s more like being lifted passively by short liquidation/covering. This kind of structure won’t go far unless real fresh capital follows through.
That said, OI is at a very high percentile—93.5%. In the whole pool, #5; nominal change #25. The price is already sitting right against its own historical extreme range. At this location, it’s either the eve of a breakout, or a fake breakout that traps people.
Over 24h, the turnover is 20M—depth is still decent to judge. My approach is to wait for confirmation rather than chase this candle. In a market driven by short covering, the pullback is the real opportunity; jumping in to catch the falling knife is basically becoming the counterparty to whoever’s covering.
$CAP Watch the upper edge of the 5m range. If it breaks and can’t hold, get out.
In 15m, it jumped 2.72%. The volume even reached 2.06x, and the closing price broke above the upper bound of nearly 20 consecutive 5m candles—but OI is falling. In 15m it’s -0.11%, and in 1h it’s -0.81%. Price is rising while positions are shrinking. This doesn’t look like new money entering; it looks more like old shorts being carried up—heavy short covering vibes.
The aggressive trade volume is down -7.3%, and the buy/sell ratio is 0.86. That suggests the rally isn’t pushed by aggressive buying; it’s more like being lifted passively by short liquidation/covering. This kind of structure won’t go far unless real fresh capital follows through.
That said, OI is at a very high percentile—93.5%. In the whole pool, #5; nominal change #25. The price is already sitting right against its own historical extreme range. At this location, it’s either the eve of a breakout, or a fake breakout that traps people.
Over 24h, the turnover is 20M—depth is still decent to judge. My approach is to wait for confirmation rather than chase this candle. In a market driven by short covering, the pullback is the real opportunity; jumping in to catch the falling knife is basically becoming the counterparty to whoever’s covering.
$CAP Watch the upper edge of the 5m range. If it breaks and can’t hold, get out.
30
·
--
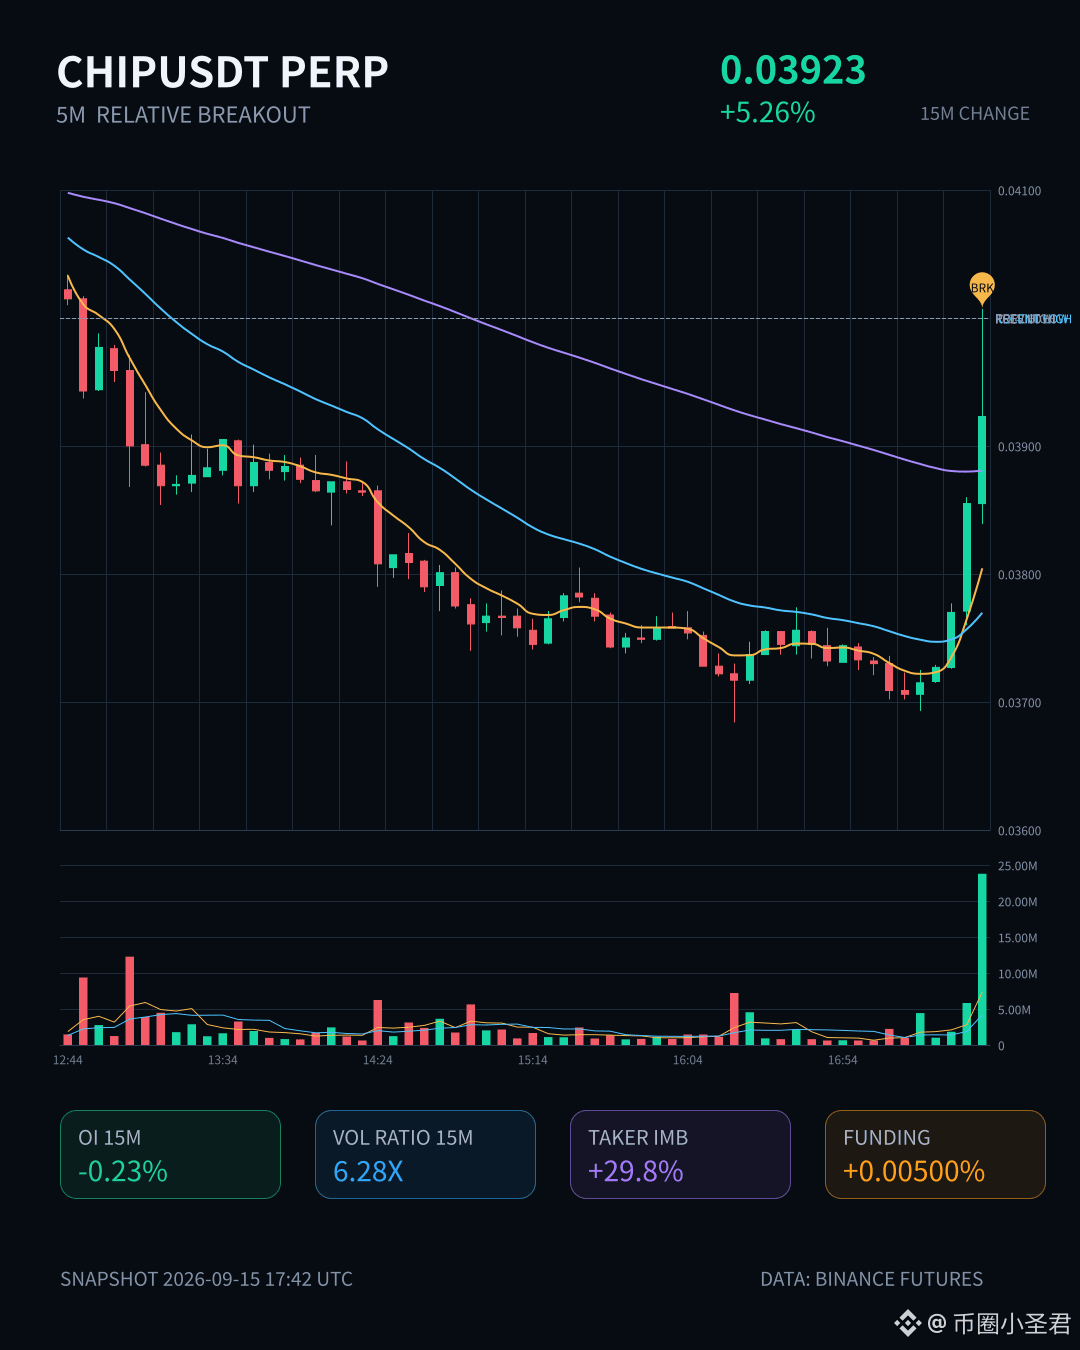
$CHIP This 15m has some interesting stuff.
The price is up 5.26%, and the volume directly surges to 6.28 times the usual level. Volatility (Z) also spikes to 7.28—this isn’t just some random twitch; there really are people moving it. But look at OI: 15m -0.23%, 1h -0.36%. As the price trends up, positions are actually being reduced.
I know this structure well. It smells strongly of short covering. This isn’t fresh long positions being pushed in—it’s shorts getting hurt and being forced to flatten. Active trade difference +29.8%, buy/sell ratio 1.85, and it closes at the upper edge of the last 20 five-minute range—meaning the buy side is genuinely eating orders.
But don’t get carried away.
The OI percentile is 100%. It’s ranked #1 in the entire pool for abnormality, and the nominal change ranks only #25. In other words: this spike is the most eye-catching one in terms of “abnormality,” but the absolute capital volume isn’t that large. Trading value over 24h is 11.44M, and the pool isn’t deep. Funding rate has already reached the high percentile recently—longs are starting to pay.
With multiple consecutive periods continuing + deep confirmation, short-term momentum still has inertia. But in a market driven by short covering: once the covering is done, who will be the one to take over? That’s what to watch next.
Not calling trades—just making a note.
$CHIP This 15m has some interesting stuff.
The price is up 5.26%, and the volume directly surges to 6.28 times the usual level. Volatility (Z) also spikes to 7.28—this isn’t just some random twitch; there really are people moving it. But look at OI: 15m -0.23%, 1h -0.36%. As the price trends up, positions are actually being reduced.
I know this structure well. It smells strongly of short covering. This isn’t fresh long positions being pushed in—it’s shorts getting hurt and being forced to flatten. Active trade difference +29.8%, buy/sell ratio 1.85, and it closes at the upper edge of the last 20 five-minute range—meaning the buy side is genuinely eating orders.
But don’t get carried away.
The OI percentile is 100%. It’s ranked #1 in the entire pool for abnormality, and the nominal change ranks only #25. In other words: this spike is the most eye-catching one in terms of “abnormality,” but the absolute capital volume isn’t that large. Trading value over 24h is 11.44M, and the pool isn’t deep. Funding rate has already reached the high percentile recently—longs are starting to pay.
With multiple consecutive periods continuing + deep confirmation, short-term momentum still has inertia. But in a market driven by short covering: once the covering is done, who will be the one to take over? That’s what to watch next.
Not calling trades—just making a note.
The price is up 5.26%, and the volume directly surges to 6.28 times the usual level. Volatility (Z) also spikes to 7.28—this isn’t just some random twitch; there really are people moving it. But look at OI: 15m -0.23%, 1h -0.36%. As the price trends up, positions are actually being reduced.
I know this structure well. It smells strongly of short covering. This isn’t fresh long positions being pushed in—it’s shorts getting hurt and being forced to flatten. Active trade difference +29.8%, buy/sell ratio 1.85, and it closes at the upper edge of the last 20 five-minute range—meaning the buy side is genuinely eating orders.
But don’t get carried away.
The OI percentile is 100%. It’s ranked #1 in the entire pool for abnormality, and the nominal change ranks only #25. In other words: this spike is the most eye-catching one in terms of “abnormality,” but the absolute capital volume isn’t that large. Trading value over 24h is 11.44M, and the pool isn’t deep. Funding rate has already reached the high percentile recently—longs are starting to pay.
With multiple consecutive periods continuing + deep confirmation, short-term momentum still has inertia. But in a market driven by short covering: once the covering is done, who will be the one to take over? That’s what to watch next.
Not calling trades—just making a note.
5
·
--
$XPL This move is kind of interesting.
The 15m price dropped 0.93%. It doesn’t look like much, but the close broke directly below the lower band of the past nearly 20 5m candles. Volume surged to 1.69x, aggressive trade imbalance is -16%, and the buy/sell ratio is 0.72—selling pressure is pushing, not a low-volume, grinding bearish drift.
But what really made me take a second look is OI. In the 1h contracts, OI decreased by 0.14%, with notional falling by 819K; on the 15m, notional also dropped by 330K. The price is falling, yet OI is only contracting slightly—not the kind of structure where “price falls + OI spikes” and new shorts keep piling in. In other words, it looks more like downside with position reduction, not shorts stacking orders to smash it lower.
The abnormal quantile is 89.1%, whole pool #16, notional change #25. The signal has been consistently continued for several consecutive periods, so it’s relatively clean. 24h turnover is 33.68M, and the depth is sufficient—not a board that can be blown up with just tens of thousands.
I’ll keep an eye on how this structure plays out: if OI continues to shrink while price keeps bleeding lower, it could mean longs are gradually giving up. But if OI suddenly turns to increase and price accelerates downward, then it becomes a new round of short succession—and the nature of the move changes.
For now, I’ll just observe—no rush.
$XPL This move is kind of interesting.
The 15m price dropped 0.93%. It doesn’t look like much, but the close broke directly below the lower band of the past nearly 20 5m candles. Volume surged to 1.69x, aggressive trade imbalance is -16%, and the buy/sell ratio is 0.72—selling pressure is pushing, not a low-volume, grinding bearish drift.
But what really made me take a second look is OI. In the 1h contracts, OI decreased by 0.14%, with notional falling by 819K; on the 15m, notional also dropped by 330K. The price is falling, yet OI is only contracting slightly—not the kind of structure where “price falls + OI spikes” and new shorts keep piling in. In other words, it looks more like downside with position reduction, not shorts stacking orders to smash it lower.
The abnormal quantile is 89.1%, whole pool #16, notional change #25. The signal has been consistently continued for several consecutive periods, so it’s relatively clean. 24h turnover is 33.68M, and the depth is sufficient—not a board that can be blown up with just tens of thousands.
I’ll keep an eye on how this structure plays out: if OI continues to shrink while price keeps bleeding lower, it could mean longs are gradually giving up. But if OI suddenly turns to increase and price accelerates downward, then it becomes a new round of short succession—and the nature of the move changes.
For now, I’ll just observe—no rush.
The 15m price dropped 0.93%. It doesn’t look like much, but the close broke directly below the lower band of the past nearly 20 5m candles. Volume surged to 1.69x, aggressive trade imbalance is -16%, and the buy/sell ratio is 0.72—selling pressure is pushing, not a low-volume, grinding bearish drift.
But what really made me take a second look is OI. In the 1h contracts, OI decreased by 0.14%, with notional falling by 819K; on the 15m, notional also dropped by 330K. The price is falling, yet OI is only contracting slightly—not the kind of structure where “price falls + OI spikes” and new shorts keep piling in. In other words, it looks more like downside with position reduction, not shorts stacking orders to smash it lower.
The abnormal quantile is 89.1%, whole pool #16, notional change #25. The signal has been consistently continued for several consecutive periods, so it’s relatively clean. 24h turnover is 33.68M, and the depth is sufficient—not a board that can be blown up with just tens of thousands.
I’ll keep an eye on how this structure plays out: if OI continues to shrink while price keeps bleeding lower, it could mean longs are gradually giving up. But if OI suddenly turns to increase and price accelerates downward, then it becomes a new round of short succession—and the nature of the move changes.
For now, I’ll just observe—no rush.
6


·
--
BTW anomaly analysisBTW this alert is pretty interesting—over the past 24h it’s up 22.3%. And it’s labeled as a continuation signal that was pushed 2.8 hours ago, which suggests this move isn’t just a single bullish candle that’s finished; it has follow-through. But note: this is the 2nd same-direction continuation within 24h—in other words, the train is already underway.
First, look at sentiment. On X there are 14 discussions with 0 KOLs involved. BSQ ranks 25th with 305, and the retail 24h long/short ratio is 2.8x favoring longs, but things have been cooling off recently. Put together, this means: retail has already piled in, while the smart money hasn’t really moved. The discussion section has 107 mentions but 0 KOLs—there’s quite a lot of disagreement. Hasnain Nadeem 786, AI Researcher_Hub, and Shiguang1913 are all calling for 5x shorts near 0.65, expecting a bearish breakdown below 0.55-0.62. On the other side, DRACO CHAIN directly calls for a target of 2.50. Analyst Yu Fei says the 1-hour volatility is compressing and price action is leaning toward accumulating energy for an upside breakout. With the longs and shorts arguing like this, it shows the current position is a real battleground.
BTW anomaly analysis
BTW this alert is pretty interesting—over the past 24h it’s up 22.3%. And it’s labeled as a continuation signal that was pushed 2.8 hours ago, which suggests this move isn’t just a single bullish candle that’s finished; it has follow-through. But note: this is the 2nd same-direction continuation within 24h—in other words, the train is already underway.
First, look at sentiment. On X there are 14 discussions with 0 KOLs involved. BSQ ranks 25th with 305, and the retail 24h long/short ratio is 2.8x favoring longs, but things have been cooling off recently. Put together, this means: retail has already piled in, while the smart money hasn’t really moved. The discussion section has 107 mentions but 0 KOLs—there’s quite a lot of disagreement. Hasnain Nadeem 786, AI Researcher_Hub, and Shiguang1913 are all calling for 5x shorts near 0.65, expecting a bearish breakdown below 0.55-0.62. On the other side, DRACO CHAIN directly calls for a target of 2.50. Analyst Yu Fei says the 1-hour volatility is compressing and price action is leaning toward accumulating energy for an upside breakout. With the longs and shorts arguing like this, it shows the current position is a real battleground.
First, look at sentiment. On X there are 14 discussions with 0 KOLs involved. BSQ ranks 25th with 305, and the retail 24h long/short ratio is 2.8x favoring longs, but things have been cooling off recently. Put together, this means: retail has already piled in, while the smart money hasn’t really moved. The discussion section has 107 mentions but 0 KOLs—there’s quite a lot of disagreement. Hasnain Nadeem 786, AI Researcher_Hub, and Shiguang1913 are all calling for 5x shorts near 0.65, expecting a bearish breakdown below 0.55-0.62. On the other side, DRACO CHAIN directly calls for a target of 2.50. Analyst Yu Fei says the 1-hour volatility is compressing and price action is leaning toward accumulating energy for an upside breakout. With the longs and shorts arguing like this, it shows the current position is a real battleground.
1
217
·
--
$PONS This one is a bit interesting.
Price at the 15m timeframe is down 2%, but volume has surged to 3x. The active buy/sell ratio is 0.60, and the sell pressure is quite明显 (noticeable). The key point is that while it’s falling, OI is still rising—this 1h contract is up +1.48%. This doesn’t look like long-side holders digging themselves out and getting buried; it looks more like a new short is adding leverage into the move.
It just broke below the lower boundary of the recent 20 five-minute candles. Over the last 24h, turnover is 82M. The depth is sufficient and volume has kept up, so this breakdown doesn’t feel like a fakeout.
Pool abnormality #25 and notional change #10 are both showing. This pattern has been continuing across several consecutive periods. Keep an eye on this structure: if the new shorts keep pushing, there may be another leg lower. But if volume shrinks and OI turns back down, then this short move would be the fuel to burn off.
Don’t rush to enter—first figure out whether it’s a real vacuum breakdown or just a fake fall.
$PONS This one is a bit interesting.
Price at the 15m timeframe is down 2%, but volume has surged to 3x. The active buy/sell ratio is 0.60, and the sell pressure is quite明显 (noticeable). The key point is that while it’s falling, OI is still rising—this 1h contract is up +1.48%. This doesn’t look like long-side holders digging themselves out and getting buried; it looks more like a new short is adding leverage into the move.
It just broke below the lower boundary of the recent 20 five-minute candles. Over the last 24h, turnover is 82M. The depth is sufficient and volume has kept up, so this breakdown doesn’t feel like a fakeout.
Pool abnormality #25 and notional change #10 are both showing. This pattern has been continuing across several consecutive periods. Keep an eye on this structure: if the new shorts keep pushing, there may be another leg lower. But if volume shrinks and OI turns back down, then this short move would be the fuel to burn off.
Don’t rush to enter—first figure out whether it’s a real vacuum breakdown or just a fake fall.
Price at the 15m timeframe is down 2%, but volume has surged to 3x. The active buy/sell ratio is 0.60, and the sell pressure is quite明显 (noticeable). The key point is that while it’s falling, OI is still rising—this 1h contract is up +1.48%. This doesn’t look like long-side holders digging themselves out and getting buried; it looks more like a new short is adding leverage into the move.
It just broke below the lower boundary of the recent 20 five-minute candles. Over the last 24h, turnover is 82M. The depth is sufficient and volume has kept up, so this breakdown doesn’t feel like a fakeout.
Pool abnormality #25 and notional change #10 are both showing. This pattern has been continuing across several consecutive periods. Keep an eye on this structure: if the new shorts keep pushing, there may be another leg lower. But if volume shrinks and OI turns back down, then this short move would be the fuel to burn off.
Don’t rush to enter—first figure out whether it’s a real vacuum breakdown or just a fake fall.
48
·
--
** How to Follow Trends on Binance Square and Take Profits? 📈🎯Uniswap (UNIUSDT) is trending right now!
Rank: #25
** --- ### 1️⃣ Market Observation – “Why is it important?” **Step:** Log in to the platform and, from the **Home > Market** tab, check the latest prices. **Example:** Data dated 13 September 2026: - = **2477.51 USDT** (‑2.29 % in 24 hours) - = **715.80 USDT** (‑2.91 % in 24 hours) - = **1.006 USDT** (‑3.82 % in 24 hours) **Why is it important?** These figures show overall market sentiment. A decline of 2–3% can be a “short-term correction” signal; within an uptrend, it can be evaluated as a **buying opportunity** (dip). --- ### 2️⃣ Draw the Trend Line (Chart Pattern) – “Why is it important?” **Step:** Open a **15-minute** or **1-hour /USDT** chart. - **Lower Trend Line:** Connect the dip points (e.g., 2450 USDT → 2440 USDT → 2435 USDT). - **Upper Trend Line:** Connect the peak points (e.g., 2500 USDT → 2515 USDT). **Visual Clue:** If the lower trend line is trending upward, it forms a “**rising dip**” pattern—this is a strong signal for buying. **Why is it important?** Trend lines show where the price **finds support** and **meets resistance**. These levels become the main reference for setting stop-loss and take-profit points. --- ### 3️⃣ Determine Support/Resistance Levels – “Why is it important?” **Step:** Mark the critical levels on the daily chart: | Pair | Support (USDT) | Resistance (USDT) | |------|---------------|---------------| | | **2420** | **2550** | | | **700** | **740** | | | **0.99** | **1.07** | Prati
** How to Follow Trends on Binance Square and Take Profits? 📈🎯
Uniswap (UNIUSDT) is trending right now!
Rank: #25
** --- ### 1️⃣ Market Observation – “Why is it important?” **Step:** Log in to the platform and, from the **Home > Market** tab, check the latest prices. **Example:** Data dated 13 September 2026: - = **2477.51 USDT** (‑2.29 % in 24 hours) - = **715.80 USDT** (‑2.91 % in 24 hours) - = **1.006 USDT** (‑3.82 % in 24 hours) **Why is it important?** These figures show overall market sentiment. A decline of 2–3% can be a “short-term correction” signal; within an uptrend, it can be evaluated as a **buying opportunity** (dip). --- ### 2️⃣ Draw the Trend Line (Chart Pattern) – “Why is it important?” **Step:** Open a **15-minute** or **1-hour /USDT** chart. - **Lower Trend Line:** Connect the dip points (e.g., 2450 USDT → 2440 USDT → 2435 USDT). - **Upper Trend Line:** Connect the peak points (e.g., 2500 USDT → 2515 USDT). **Visual Clue:** If the lower trend line is trending upward, it forms a “**rising dip**” pattern—this is a strong signal for buying. **Why is it important?** Trend lines show where the price **finds support** and **meets resistance**. These levels become the main reference for setting stop-loss and take-profit points. --- ### 3️⃣ Determine Support/Resistance Levels – “Why is it important?” **Step:** Mark the critical levels on the daily chart: | Pair | Support (USDT) | Resistance (USDT) | |------|---------------|---------------| | | **2420** | **2550** | | | **700** | **740** | | | **0.99** | **1.07** | Prati
Rank: #25
** --- ### 1️⃣ Market Observation – “Why is it important?” **Step:** Log in to the platform and, from the **Home > Market** tab, check the latest prices. **Example:** Data dated 13 September 2026: - = **2477.51 USDT** (‑2.29 % in 24 hours) - = **715.80 USDT** (‑2.91 % in 24 hours) - = **1.006 USDT** (‑3.82 % in 24 hours) **Why is it important?** These figures show overall market sentiment. A decline of 2–3% can be a “short-term correction” signal; within an uptrend, it can be evaluated as a **buying opportunity** (dip). --- ### 2️⃣ Draw the Trend Line (Chart Pattern) – “Why is it important?” **Step:** Open a **15-minute** or **1-hour /USDT** chart. - **Lower Trend Line:** Connect the dip points (e.g., 2450 USDT → 2440 USDT → 2435 USDT). - **Upper Trend Line:** Connect the peak points (e.g., 2500 USDT → 2515 USDT). **Visual Clue:** If the lower trend line is trending upward, it forms a “**rising dip**” pattern—this is a strong signal for buying. **Why is it important?** Trend lines show where the price **finds support** and **meets resistance**. These levels become the main reference for setting stop-loss and take-profit points. --- ### 3️⃣ Determine Support/Resistance Levels – “Why is it important?” **Step:** Mark the critical levels on the daily chart: | Pair | Support (USDT) | Resistance (USDT) | |------|---------------|---------------| | | **2420** | **2550** | | | **700** | **740** | | | **0.99** | **1.07** | Prati
12
·
--
APT This 15m move is kind of interesting.
The price only moved up 0.67%, but the trading volume directly jumped to 3.28x. The closing price also broke above the upper band of nearly 20 5m candles—this kind of volume-price coordination doesn’t look like something a retail trader would push on a whim.
OI: +0.75% over 1h. Notional increased by 354K, and the 15m timeframe is rising in sync too. Price up while OI up—this is a classic leveraged long entry structure, not the passive squeeze that longs get from shorts getting forced.
Active trades are down 6.2%, buy/sell ratio is 1.13, and the buy side is dominating.
Abnormal entries in the full pool: #8; notional change: #25. It’s not among the most explosive batches, but the depth confirmation is solid—volume is higher than usual, and it just happens to hit the edge of the range. In this position, it’s either they truly want to push higher, or they’re luring liquidity and then flipping.
Over 24h, turnover is 59M. The pool isn’t particularly deep; a notional change of 166K can already put it near the top of the abnormal list, suggesting that ordinarily there isn’t much big money paying attention here.
First, see whether it can hold above this upper band. If it can’t, then it’s a false breakout.
APT This 15m move is kind of interesting.
The price only moved up 0.67%, but the trading volume directly jumped to 3.28x. The closing price also broke above the upper band of nearly 20 5m candles—this kind of volume-price coordination doesn’t look like something a retail trader would push on a whim.
OI: +0.75% over 1h. Notional increased by 354K, and the 15m timeframe is rising in sync too. Price up while OI up—this is a classic leveraged long entry structure, not the passive squeeze that longs get from shorts getting forced.
Active trades are down 6.2%, buy/sell ratio is 1.13, and the buy side is dominating.
Abnormal entries in the full pool: #8; notional change: #25. It’s not among the most explosive batches, but the depth confirmation is solid—volume is higher than usual, and it just happens to hit the edge of the range. In this position, it’s either they truly want to push higher, or they’re luring liquidity and then flipping.
Over 24h, turnover is 59M. The pool isn’t particularly deep; a notional change of 166K can already put it near the top of the abnormal list, suggesting that ordinarily there isn’t much big money paying attention here.
First, see whether it can hold above this upper band. If it can’t, then it’s a false breakout.
The price only moved up 0.67%, but the trading volume directly jumped to 3.28x. The closing price also broke above the upper band of nearly 20 5m candles—this kind of volume-price coordination doesn’t look like something a retail trader would push on a whim.
OI: +0.75% over 1h. Notional increased by 354K, and the 15m timeframe is rising in sync too. Price up while OI up—this is a classic leveraged long entry structure, not the passive squeeze that longs get from shorts getting forced.
Active trades are down 6.2%, buy/sell ratio is 1.13, and the buy side is dominating.
Abnormal entries in the full pool: #8; notional change: #25. It’s not among the most explosive batches, but the depth confirmation is solid—volume is higher than usual, and it just happens to hit the edge of the range. In this position, it’s either they truly want to push higher, or they’re luring liquidity and then flipping.
Over 24h, turnover is 59M. The pool isn’t particularly deep; a notional change of 166K can already put it near the top of the abnormal list, suggesting that ordinarily there isn’t much big money paying attention here.
First, see whether it can hold above this upper band. If it can’t, then it’s a false breakout.
171
·
--
So this order book setup, there’s something to it.
On the 15m timeframe, one candle moved up 1.59% with the volume directly jumping to 5.22x. This isn’t something random retail can just trigger with a couple taps. Open interest (OI) is rising in sync: 15m is up +2.21%, and 1h is continuing as well. The notional change across both sides has rolled in over a million U—this is newly added leveraged longs, not that kind of inflated balance from shorts covering.
The percentile is at an abnormal 85.3%. The whole pool ranks at #25 by volume, while the notional change is even more forward at #9. Across several consecutive intervals, you can see the same structure carrying on, and the trading activity is higher than usual—depth checks out as confirmable.
Buy/sell ratio is 1.02, with an active-side difference of 0.8%. It’s relatively neutral right now; it hasn’t reached the level of FOMO. But this kind of volume-price + OI resonance pattern usually isn’t just a one-off move that ends immediately.
In the past 24h, trading value is 329 million U. The pool is deep enough that it’s not easy to get crushed right through once you pull it up.
A few things to watch: leveraged longs are building up, and if this turns into a short squeeze, the upside room isn’t small. But if, in the opposite direction, it breaks below key levels, the OI pile-up also becomes fuel that accelerates the selloff. Don’t only look at the bullish side—manage your positioning yourself.
So this order book setup, there’s something to it.
On the 15m timeframe, one candle moved up 1.59% with the volume directly jumping to 5.22x. This isn’t something random retail can just trigger with a couple taps. Open interest (OI) is rising in sync: 15m is up +2.21%, and 1h is continuing as well. The notional change across both sides has rolled in over a million U—this is newly added leveraged longs, not that kind of inflated balance from shorts covering.
The percentile is at an abnormal 85.3%. The whole pool ranks at #25 by volume, while the notional change is even more forward at #9. Across several consecutive intervals, you can see the same structure carrying on, and the trading activity is higher than usual—depth checks out as confirmable.
Buy/sell ratio is 1.02, with an active-side difference of 0.8%. It’s relatively neutral right now; it hasn’t reached the level of FOMO. But this kind of volume-price + OI resonance pattern usually isn’t just a one-off move that ends immediately.
In the past 24h, trading value is 329 million U. The pool is deep enough that it’s not easy to get crushed right through once you pull it up.
A few things to watch: leveraged longs are building up, and if this turns into a short squeeze, the upside room isn’t small. But if, in the opposite direction, it breaks below key levels, the OI pile-up also becomes fuel that accelerates the selloff. Don’t only look at the bullish side—manage your positioning yourself.
On the 15m timeframe, one candle moved up 1.59% with the volume directly jumping to 5.22x. This isn’t something random retail can just trigger with a couple taps. Open interest (OI) is rising in sync: 15m is up +2.21%, and 1h is continuing as well. The notional change across both sides has rolled in over a million U—this is newly added leveraged longs, not that kind of inflated balance from shorts covering.
The percentile is at an abnormal 85.3%. The whole pool ranks at #25 by volume, while the notional change is even more forward at #9. Across several consecutive intervals, you can see the same structure carrying on, and the trading activity is higher than usual—depth checks out as confirmable.
Buy/sell ratio is 1.02, with an active-side difference of 0.8%. It’s relatively neutral right now; it hasn’t reached the level of FOMO. But this kind of volume-price + OI resonance pattern usually isn’t just a one-off move that ends immediately.
In the past 24h, trading value is 329 million U. The pool is deep enough that it’s not easy to get crushed right through once you pull it up.
A few things to watch: leveraged longs are building up, and if this turns into a short squeeze, the upside room isn’t small. But if, in the opposite direction, it breaks below key levels, the OI pile-up also becomes fuel that accelerates the selloff. Don’t only look at the bullish side—manage your positioning yourself.
8
·
--
$KAT This drop is a bit interesting: the price fell 1.44%, and the OI dropped as well. The 15m contract is -2.33%, and the 1h is even worse at -3.50%. The notional change is -220K. This doesn’t look like fresh shorts entering; it feels more like longs are being gradually squeezed out—stop-losses or主动减仓 (active de-risking) rather than a new wave of selling.
The aggressive trade difference is -17%, the buy/sell ratio is 0.71, and sell pressure is dominant. The funding rate is still in the higher range recently, which suggests the longs were indeed crowded before, and now we’re in a deleveraging phase. Trading volume is only 0.49x, volatility Z is 0.68—not panic liquidation, more like a dull blade cutting the position slowly.
The OI percentile is abnormally high at 82.5%; overall pool anomaly is #14, notional change #25. In terms of data it’s definitely among the top, but the order book hasn’t shown the kind of breakdown-style volume yet. Let’s see when this deleveraging wave finally stops—don’t rush to catch the falling knife.
$KAT This drop is a bit interesting: the price fell 1.44%, and the OI dropped as well. The 15m contract is -2.33%, and the 1h is even worse at -3.50%. The notional change is -220K. This doesn’t look like fresh shorts entering; it feels more like longs are being gradually squeezed out—stop-losses or主动减仓 (active de-risking) rather than a new wave of selling.
The aggressive trade difference is -17%, the buy/sell ratio is 0.71, and sell pressure is dominant. The funding rate is still in the higher range recently, which suggests the longs were indeed crowded before, and now we’re in a deleveraging phase. Trading volume is only 0.49x, volatility Z is 0.68—not panic liquidation, more like a dull blade cutting the position slowly.
The OI percentile is abnormally high at 82.5%; overall pool anomaly is #14, notional change #25. In terms of data it’s definitely among the top, but the order book hasn’t shown the kind of breakdown-style volume yet. Let’s see when this deleveraging wave finally stops—don’t rush to catch the falling knife.
The aggressive trade difference is -17%, the buy/sell ratio is 0.71, and sell pressure is dominant. The funding rate is still in the higher range recently, which suggests the longs were indeed crowded before, and now we’re in a deleveraging phase. Trading volume is only 0.49x, volatility Z is 0.68—not panic liquidation, more like a dull blade cutting the position slowly.
The OI percentile is abnormally high at 82.5%; overall pool anomaly is #14, notional change #25. In terms of data it’s definitely among the top, but the order book hasn’t shown the kind of breakdown-style volume yet. Let’s see when this deleveraging wave finally stops—don’t rush to catch the falling knife.
121

·
--
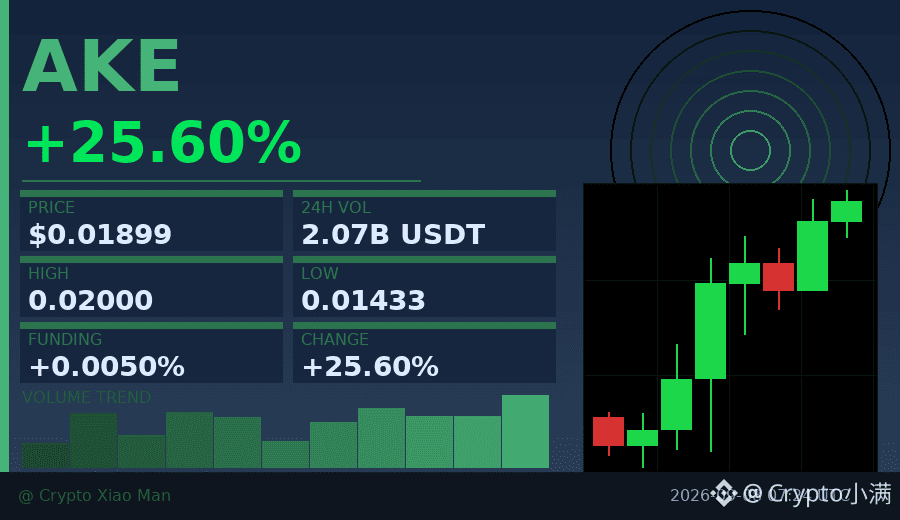
A 25% surge, but the funding rate is only 0.005%—what does that mean?
Today, AKE saw heavy volume of 207 million USDT. The price moved from 0.014 to 0.019, with consecutive green candles on the hourly chart.
Interestingly, the long/short ratio is 46% to 54%, with shorts slightly in the lead, yet the price is still pushing higher.
This kind of divergence usually suggests: shorts are testing the market with tentative positioning, but buy pressure is stronger—every pullback gets absorbed.
If funding stays low while the price continues to break above 0.02, it may trigger a wave of short covering.
The key is whether the next 2–3 hourly candles can hold above 0.0185.
$AKE #资金费率背离 #25%涨幅
Click the small card below to quickly check the market trend👇
A 25% surge, but the funding rate is only 0.005%—what does that mean?
Today, AKE saw heavy volume of 207 million USDT. The price moved from 0.014 to 0.019, with consecutive green candles on the hourly chart.
Interestingly, the long/short ratio is 46% to 54%, with shorts slightly in the lead, yet the price is still pushing higher.
This kind of divergence usually suggests: shorts are testing the market with tentative positioning, but buy pressure is stronger—every pullback gets absorbed.
If funding stays low while the price continues to break above 0.02, it may trigger a wave of short covering.
The key is whether the next 2–3 hourly candles can hold above 0.0185.
$AKE #资金费率背离 #25%涨幅
Click the small card below to quickly check the market trend👇
Today, AKE saw heavy volume of 207 million USDT. The price moved from 0.014 to 0.019, with consecutive green candles on the hourly chart.
Interestingly, the long/short ratio is 46% to 54%, with shorts slightly in the lead, yet the price is still pushing higher.
This kind of divergence usually suggests: shorts are testing the market with tentative positioning, but buy pressure is stronger—every pullback gets absorbed.
If funding stays low while the price continues to break above 0.02, it may trigger a wave of short covering.
The key is whether the next 2–3 hourly candles can hold above 0.0185.
$AKE #资金费率背离 #25%涨幅
Click the small card below to quickly check the market trend👇
1
26
·
--
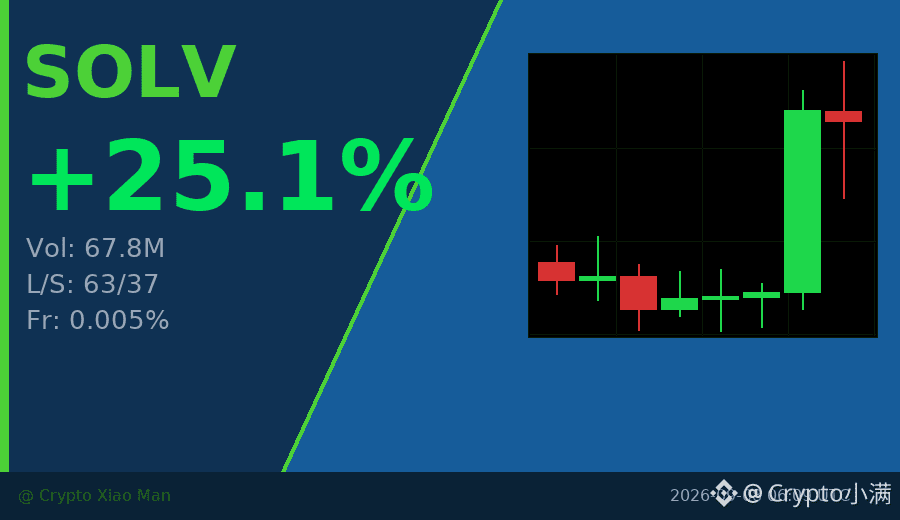
25% price increase, but the funding rate is only 0.005%—what does that mean?
Today SOLV rose 25.08%, with trading volume of 67.8 million USDT. The long-to-short ratio is 63% vs 37%, which looks bullish overall. But the key is in the details: over the past 8 hours, the price kept strengthening, and the last big bullish candle pushed it up by nearly 10% straight away. Trading volume was more than 3 times the usual.
This combination of rising volume and price plus a low funding rate usually means it’s not a leveraged bull run, but real money moving in. The shorts haven’t been squeezed yet, and the funding hasn’t spiked. If volume continues, there may still be room ahead.
That said, don’t chase too urgently—waiting for a pullback near 0.0046 is safer.
$SOLV #小市值爆发 #25%
Click the small card below to quickly check the market 👇
25% price increase, but the funding rate is only 0.005%—what does that mean?
Today SOLV rose 25.08%, with trading volume of 67.8 million USDT. The long-to-short ratio is 63% vs 37%, which looks bullish overall. But the key is in the details: over the past 8 hours, the price kept strengthening, and the last big bullish candle pushed it up by nearly 10% straight away. Trading volume was more than 3 times the usual.
This combination of rising volume and price plus a low funding rate usually means it’s not a leveraged bull run, but real money moving in. The shorts haven’t been squeezed yet, and the funding hasn’t spiked. If volume continues, there may still be room ahead.
That said, don’t chase too urgently—waiting for a pullback near 0.0046 is safer.
$SOLV #小市值爆发 #25%
Click the small card below to quickly check the market 👇
Today SOLV rose 25.08%, with trading volume of 67.8 million USDT. The long-to-short ratio is 63% vs 37%, which looks bullish overall. But the key is in the details: over the past 8 hours, the price kept strengthening, and the last big bullish candle pushed it up by nearly 10% straight away. Trading volume was more than 3 times the usual.
This combination of rising volume and price plus a low funding rate usually means it’s not a leveraged bull run, but real money moving in. The shorts haven’t been squeezed yet, and the funding hasn’t spiked. If volume continues, there may still be room ahead.
That said, don’t chase too urgently—waiting for a pullback near 0.0046 is safer.
$SOLV #小市值爆发 #25%
Click the small card below to quickly check the market 👇
39

·
--
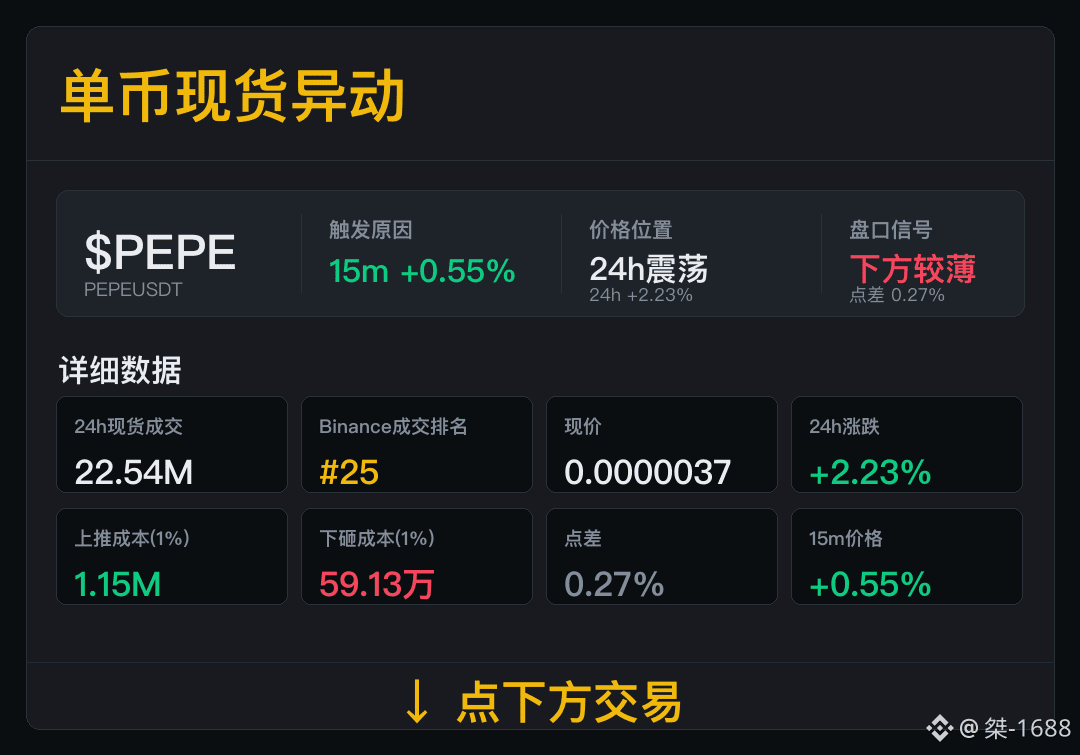
$PEPE 15m Volatility has already appeared, with trade quality placed first.
Spot trades: 22.54M, Binance trade ranking #25. The trade ranking shows the current market position, and we’ll continue to watch for volume strength going forward.
Currently 24h change +2.23%; spread 0.27%, push-up cost 1.15M, sell-down cost 590.13K. Going forward, there isn’t an obvious weakening in trading; only short-term anomalies may continue.
Next, we’ll watch two things: whether trading can keep going, and whether the spread suddenly widens.
$PEPE 15m Volatility has already appeared, with trade quality placed first.
Spot trades: 22.54M, Binance trade ranking #25. The trade ranking shows the current market position, and we’ll continue to watch for volume strength going forward.
Currently 24h change +2.23%; spread 0.27%, push-up cost 1.15M, sell-down cost 590.13K. Going forward, there isn’t an obvious weakening in trading; only short-term anomalies may continue.
Next, we’ll watch two things: whether trading can keep going, and whether the spread suddenly widens.
Spot trades: 22.54M, Binance trade ranking #25. The trade ranking shows the current market position, and we’ll continue to watch for volume strength going forward.
Currently 24h change +2.23%; spread 0.27%, push-up cost 1.15M, sell-down cost 590.13K. Going forward, there isn’t an obvious weakening in trading; only short-term anomalies may continue.
Next, we’ll watch two things: whether trading can keep going, and whether the spread suddenly widens.
143

24h Check #25 · BTC
Original read: upside continuation. Move evidence: +0.11% over the latest 24h window. Volume evidence: $669.1M quote volume.
Confirmation required acceptance above 79641. Invalidation: a 1h close below 79641.
Result: HIT. Return -0.27%; MFE n/a; MAE 0.88%.
The fixed-horizon close supports the stated direction. MFE and MAE retain the path risk, so the close is not the whole record.
For the next read, was level acceptance or persistent volume more informative?
$BTC {spot}(BTCUSDT) $ETH {spot}(ETHUSDT)
24h Check #25 · BTC
Original read: upside continuation. Move evidence: +0.11% over the latest 24h window. Volume evidence: $669.1M quote volume.
Confirmation required acceptance above 79641. Invalidation: a 1h close below 79641.
Result: HIT. Return -0.27%; MFE n/a; MAE 0.88%.
The fixed-horizon close supports the stated direction. MFE and MAE retain the path risk, so the close is not the whole record.
For the next read, was level acceptance or persistent volume more informative?
$BTC $ETH
Original read: upside continuation. Move evidence: +0.11% over the latest 24h window. Volume evidence: $669.1M quote volume.
Confirmation required acceptance above 79641. Invalidation: a 1h close below 79641.
Result: HIT. Return -0.27%; MFE n/a; MAE 0.88%.
The fixed-horizon close supports the stated direction. MFE and MAE retain the path risk, so the close is not the whole record.
For the next read, was level acceptance or persistent volume more informative?
$BTC $ETH
78
Log in to explore more content
Join global crypto users on Binance Square
⚡️ Get latest and useful information about crypto.
💬 Trusted by the world’s largest crypto exchange.
👍 Discover real insights from verified creators.
Email / Phone number
Trending Topics
1
#AIStocksWhatNext
254,457 views
2,552 Discussing
2
#BitcoinBreaksAboveMayHighNears$86K
9,304 views
154 Discussing
3
#DogecoinRises15%
25,082 views
809 Discussing
4
#$14BBitcoinOptionsExpireFriday
1,848 views
69 Discussing
5
#BNBMarketCapPassesBNYMellon
18,017 views
606 Discussing
6
#CryptoMarketCapReclaims$3Trillion
2,366 views
61 Discussing
7
#MuseOvertakesChatGPTAsTopFreeIOSApp
11,375 views
467 Discussing
8
#TokenizedStockPlatformsCouldLaunchNextQuarter
17,868 views
531 Discussing
9
#StrategyAdds950Bitcoin
23,327 views
588 Discussing
10
#CardanoAddedToX402KitForADAPayments
23,316 views
610 Discussing