
#102
102
1,128 views
22 Discussing
Hot
Latest

·
--
Don’t keep staring at old bids that are pretending to be dead on the floor. $AERO is demonstrating what “quiet accumulation on the right side” looks like through the order book.
Over the past 30 days, $AERO has steadily captured a 77% rise, and is currently digesting liquidity around $0.56. Its market cap is nearing 540 million USD—right at the key threshold of being within the top 100 in the crypto market (#102). Revisiting the data from this period shows that in mid-June, it experienced a clear shift in capital: daily trading volume surged to the 80 million USD level, directly pulling the price out of the $0.3 swamp.
The logic behind this type of move isn’t complicated. As an asset that’s already listed on Binance contracts, it isn’t short on baseline liquidity. At this level, the “smart money” isn’t betting that it will immediately return to its ATH of $2.32 (there’s still a 75% deep drop to climb out of). Instead, it’s placing a bet on the ecosystem narrative it’s backed by and the protocol’s own ability to generate yield—using steady, moderate volume. Early panic-position supply was washed clean, and the chart has formed a clear structure with higher lows.
But trading can’t only look at the bright side—risk often hides in volume–price divergences. In the last two days, $AERO ’s trading volume has fallen back to around 25 million USD, and there are signs that upward momentum is slowing. If the upcoming chop-and-pullback can’t effectively hold the $0.48–$0.50 zone (a previously tightly traded area), then profit-taking from the underlying positions will likely still trigger a deeper adjustment, where chasing becomes very poor value.
In a weak market, watch sentiment; in a trend change, watch structure. Assets that can truly survive the entire cycle are often the ones that quietly break away from the bottom before most people even react. Do you think this wave for $AERO can firmly establish itself in the market-cap top 100—or is it just an oversold bounce powered by abundant liquidity?💡
Don’t keep staring at old bids that are pretending to be dead on the floor. $AERO is demonstrating what “quiet accumulation on the right side” looks like through the order book.
Over the past 30 days, $AERO has steadily captured a 77% rise, and is currently digesting liquidity around $0.56. Its market cap is nearing 540 million USD—right at the key threshold of being within the top 100 in the crypto market (#102). Revisiting the data from this period shows that in mid-June, it experienced a clear shift in capital: daily trading volume surged to the 80 million USD level, directly pulling the price out of the $0.3 swamp.
The logic behind this type of move isn’t complicated. As an asset that’s already listed on Binance contracts, it isn’t short on baseline liquidity. At this level, the “smart money” isn’t betting that it will immediately return to its ATH of $2.32 (there’s still a 75% deep drop to climb out of). Instead, it’s placing a bet on the ecosystem narrative it’s backed by and the protocol’s own ability to generate yield—using steady, moderate volume. Early panic-position supply was washed clean, and the chart has formed a clear structure with higher lows.
But trading can’t only look at the bright side—risk often hides in volume–price divergences. In the last two days, $AERO ’s trading volume has fallen back to around 25 million USD, and there are signs that upward momentum is slowing. If the upcoming chop-and-pullback can’t effectively hold the $0.48–$0.50 zone (a previously tightly traded area), then profit-taking from the underlying positions will likely still trigger a deeper adjustment, where chasing becomes very poor value.
In a weak market, watch sentiment; in a trend change, watch structure. Assets that can truly survive the entire cycle are often the ones that quietly break away from the bottom before most people even react. Do you think this wave for $AERO can firmly establish itself in the market-cap top 100—or is it just an oversold bounce powered by abundant liquidity?💡
Over the past 30 days, $AERO has steadily captured a 77% rise, and is currently digesting liquidity around $0.56. Its market cap is nearing 540 million USD—right at the key threshold of being within the top 100 in the crypto market (#102). Revisiting the data from this period shows that in mid-June, it experienced a clear shift in capital: daily trading volume surged to the 80 million USD level, directly pulling the price out of the $0.3 swamp.
The logic behind this type of move isn’t complicated. As an asset that’s already listed on Binance contracts, it isn’t short on baseline liquidity. At this level, the “smart money” isn’t betting that it will immediately return to its ATH of $2.32 (there’s still a 75% deep drop to climb out of). Instead, it’s placing a bet on the ecosystem narrative it’s backed by and the protocol’s own ability to generate yield—using steady, moderate volume. Early panic-position supply was washed clean, and the chart has formed a clear structure with higher lows.
But trading can’t only look at the bright side—risk often hides in volume–price divergences. In the last two days, $AERO ’s trading volume has fallen back to around 25 million USD, and there are signs that upward momentum is slowing. If the upcoming chop-and-pullback can’t effectively hold the $0.48–$0.50 zone (a previously tightly traded area), then profit-taking from the underlying positions will likely still trigger a deeper adjustment, where chasing becomes very poor value.
In a weak market, watch sentiment; in a trend change, watch structure. Assets that can truly survive the entire cycle are often the ones that quietly break away from the bottom before most people even react. Do you think this wave for $AERO can firmly establish itself in the market-cap top 100—or is it just an oversold bounce powered by abundant liquidity?💡
17

·
--
102% price increase, but the funding rate is only 0.005%?
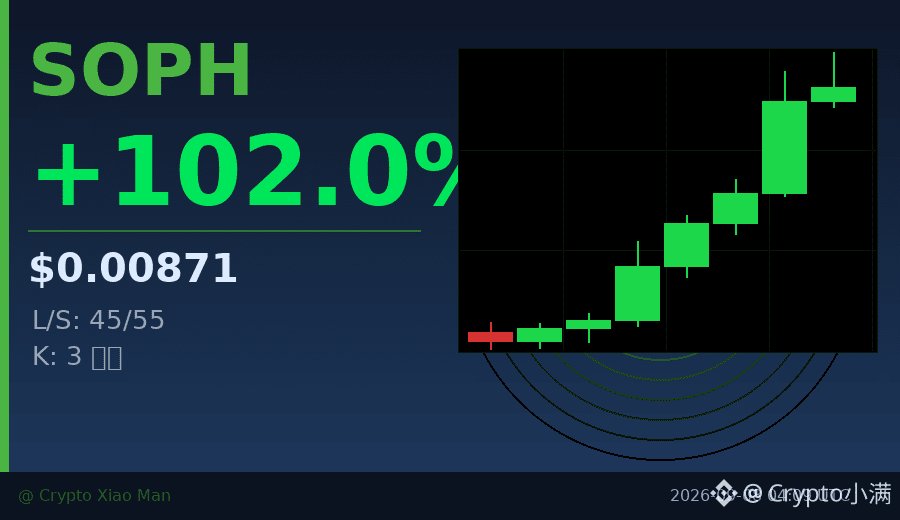
Today, SOPH’s trading volume surged to 272 million USDT. The price moved from 0.0043 to 0.0091, and the hourly candles have been closing green consecutively. Interestingly, the long-to-short ratio is 45% vs. 55%, with shorts slightly in the lead—but the price is still pushing higher, which is typical of a short-squeeze scenario.
This kind of volume-price divergence usually points to one of two things: either large players are quietly accumulating, or shorts are being forced to cover, driving the price up. Judging from the K-line structure, each pullback is bought back quickly, indicating strong support underneath.
That said, don’t chase—wait for a retest around 0.0075 for a steadier setup.
$SOPH #空头挤压 #102%
Click the small card below to quickly check the market👇
102% price increase, but the funding rate is only 0.005%?
Today, SOPH’s trading volume surged to 272 million USDT. The price moved from 0.0043 to 0.0091, and the hourly candles have been closing green consecutively. Interestingly, the long-to-short ratio is 45% vs. 55%, with shorts slightly in the lead—but the price is still pushing higher, which is typical of a short-squeeze scenario.
This kind of volume-price divergence usually points to one of two things: either large players are quietly accumulating, or shorts are being forced to cover, driving the price up. Judging from the K-line structure, each pullback is bought back quickly, indicating strong support underneath.
That said, don’t chase—wait for a retest around 0.0075 for a steadier setup.
$SOPH #空头挤压 #102%
Click the small card below to quickly check the market👇
Today, SOPH’s trading volume surged to 272 million USDT. The price moved from 0.0043 to 0.0091, and the hourly candles have been closing green consecutively. Interestingly, the long-to-short ratio is 45% vs. 55%, with shorts slightly in the lead—but the price is still pushing higher, which is typical of a short-squeeze scenario.
This kind of volume-price divergence usually points to one of two things: either large players are quietly accumulating, or shorts are being forced to cover, driving the price up. Judging from the K-line structure, each pullback is bought back quickly, indicating strong support underneath.
That said, don’t chase—wait for a retest around 0.0075 for a steadier setup.
$SOPH #空头挤压 #102%
Click the small card below to quickly check the market👇
33

·
--
🚀 NEAR Leads the Pack!Official Trump (TRUMPUSDT) is trending right now!
Rank: #102
NEARUSDT is on fire! 🚀 It's pumping **14.426%** in just 24 hours, reaching **.681**! I think this surge is due to growing interest in DeFi and scalability solutions. DOTUSDT follows closely with a **9.777%** gain, hitting **.033**. UNIUSDT also sees a **4.605%** increase, now at **.678**. What's driving this sudden altcoin rally? Is it a sign of a broader market shift?
#bitcoin #ethereum #crypto
🚀 NEAR Leads the Pack!
Official Trump (TRUMPUSDT) is trending right now!
Rank: #102
NEARUSDT is on fire! 🚀 It's pumping **14.426%** in just 24 hours, reaching **.681**! I think this surge is due to growing interest in DeFi and scalability solutions. DOTUSDT follows closely with a **9.777%** gain, hitting **.033**. UNIUSDT also sees a **4.605%** increase, now at **.678**. What's driving this sudden altcoin rally? Is it a sign of a broader market shift?
#bitcoin #ethereum #crypto
Rank: #102
NEARUSDT is on fire! 🚀 It's pumping **14.426%** in just 24 hours, reaching **.681**! I think this surge is due to growing interest in DeFi and scalability solutions. DOTUSDT follows closely with a **9.777%** gain, hitting **.033**. UNIUSDT also sees a **4.605%** increase, now at **.678**. What's driving this sudden altcoin rally? Is it a sign of a broader market shift?
#bitcoin #ethereum #crypto
106
·
--
Crypto Market UpdateOfficial Trump (TRUMPUSDT) is trending right now!
Rank: #102
**THE DANGEROUS INCONSISTENCY IN BITCOIN'S 76,000 DOLLAR RANGE** I think you shouldn’t let Bitcoin’s 6,144 price fool you right now. At first glance, a 0.27% daily increase and trading volume of over $30.9 billion can create the impression that the crypto market is healthy and stable. But when you look closer, some concerning signs emerge. For example, 's price has been stuck in the $76,000 range for the past few days. This tight-range consolidation is a classic sign of market stagnation—often a harbinger of a storm. So how can we take advantage of this? In my view, the calm movement of ' around $2,400 is also worth paying attention to. A daily increase of 0.13% may be disappointing for many investors, but I think this situation should be treated as an opportunity. Trading volume is at the $16.3 billion level, showing that the market still has strong liquidity. We should always stay alert in the crypto market. Personally, when analyzing the current state of the market, I like to focus on opposing viewpoints. While everyone agrees that ' is headed toward $80,000, I still believe that a corrective move may be possible. What do you think? Does consolidation at the 6,144 level represent a buying opportunity or a sell signal? ı ı
Crypto Market Update
Official Trump (TRUMPUSDT) is trending right now!
Rank: #102
**THE DANGEROUS INCONSISTENCY IN BITCOIN'S 76,000 DOLLAR RANGE** I think you shouldn’t let Bitcoin’s 6,144 price fool you right now. At first glance, a 0.27% daily increase and trading volume of over $30.9 billion can create the impression that the crypto market is healthy and stable. But when you look closer, some concerning signs emerge. For example, 's price has been stuck in the $76,000 range for the past few days. This tight-range consolidation is a classic sign of market stagnation—often a harbinger of a storm. So how can we take advantage of this? In my view, the calm movement of ' around $2,400 is also worth paying attention to. A daily increase of 0.13% may be disappointing for many investors, but I think this situation should be treated as an opportunity. Trading volume is at the $16.3 billion level, showing that the market still has strong liquidity. We should always stay alert in the crypto market. Personally, when analyzing the current state of the market, I like to focus on opposing viewpoints. While everyone agrees that ' is headed toward $80,000, I still believe that a corrective move may be possible. What do you think? Does consolidation at the 6,144 level represent a buying opportunity or a sell signal? ı ı
Rank: #102
**THE DANGEROUS INCONSISTENCY IN BITCOIN'S 76,000 DOLLAR RANGE** I think you shouldn’t let Bitcoin’s 6,144 price fool you right now. At first glance, a 0.27% daily increase and trading volume of over $30.9 billion can create the impression that the crypto market is healthy and stable. But when you look closer, some concerning signs emerge. For example, 's price has been stuck in the $76,000 range for the past few days. This tight-range consolidation is a classic sign of market stagnation—often a harbinger of a storm. So how can we take advantage of this? In my view, the calm movement of ' around $2,400 is also worth paying attention to. A daily increase of 0.13% may be disappointing for many investors, but I think this situation should be treated as an opportunity. Trading volume is at the $16.3 billion level, showing that the market still has strong liquidity. We should always stay alert in the crypto market. Personally, when analyzing the current state of the market, I like to focus on opposing viewpoints. While everyone agrees that ' is headed toward $80,000, I still believe that a corrective move may be possible. What do you think? Does consolidation at the 6,144 level represent a buying opportunity or a sell signal? ı ı
101


·
--
I’ve been tracking the CoinGecko trending list and noticed a few stand‑outs. Uniswap (UNI) is up +7.2% today, pushing it solidly into the top‑30. Lighter (LIT) follows with a +5.4% surge, and Artificial Inu (AI) surprises with a +4.9% jump. 🚀
I’m also keeping an eye on the mid‑range movers. Pons (PONS) climbs +3.1% despite a #118 rank, while Pudgy Penguins (PENGU) nudges +2.8% at #102. MarsCoin (MARSCOIN) shows a modest +2.3% gain, holding #288.
Finally, The Index (INDEX) rounds out the list with a +1.9% tick at #445, reminding me that even lower‑rank tokens can surprise. I’ll keep you posted as these trends evolve – stay tuned for the next swing! 😊
$HEMI, $EGLD, $AKE
I’ve been tracking the CoinGecko trending list and noticed a few stand‑outs. Uniswap (UNI) is up +7.2% today, pushing it solidly into the top‑30. Lighter (LIT) follows with a +5.4% surge, and Artificial Inu (AI) surprises with a +4.9% jump. 🚀
I’m also keeping an eye on the mid‑range movers. Pons (PONS) climbs +3.1% despite a #118 rank, while Pudgy Penguins (PENGU) nudges +2.8% at #102. MarsCoin (MARSCOIN) shows a modest +2.3% gain, holding #288.
Finally, The Index (INDEX) rounds out the list with a +1.9% tick at #445, reminding me that even lower‑rank tokens can surprise. I’ll keep you posted as these trends evolve – stay tuned for the next swing! 😊
$HEMI , $EGLD , $AKE
I’m also keeping an eye on the mid‑range movers. Pons (PONS) climbs +3.1% despite a #118 rank, while Pudgy Penguins (PENGU) nudges +2.8% at #102. MarsCoin (MARSCOIN) shows a modest +2.3% gain, holding #288.
Finally, The Index (INDEX) rounds out the list with a +1.9% tick at #445, reminding me that even lower‑rank tokens can surprise. I’ll keep you posted as these trends evolve – stay tuned for the next swing! 😊
$HEMI , $EGLD , $AKE
293
·
--
** How to Spot Short‑Term Momentum Using Binance Square’s Top Movers Data – A Step‑by‑Step Guide forPudgy Penguins (PENGUUSDT) is trending right now!
Rank: #102
** 🚀 **Why this works:** Binance Square’s “Top Movers” list shows the biggest % price changes and trading volume in real time. When a coin jumps **>2%** with a noticeable volume spike, it often signals short‑term momentum that you can ride for a quick scalp or swing trade. 📊 **Step‑by‑Step Process (using today’s data – 2026‑09‑03):** 1. **Open the Top Movers table** on Binance Square (or the API snapshot you just saw). 2. **Filter for gainers** – look at the “gainers” array. - Example: **ADAUSDT** is the top gainer: - Price: **/bin/sh.2021** - 24h change: **+2.537%** - Quote volume: **≈ 19.49 M USDT** - This tells us ADA is buying pressure is strong right now. 3. **Check volume confirmation** – a genuine move needs volume. - Compare ADA’s quote volume (19.49 M) to its 24‑h average (you can view the “volume” field in the main ticker: 100.56 B for BTC, 685 M for ETH). - ADA’s volume is **~ 0.03 %** of BTC’s but **~ 2.8 %** of its own 24‑h average (you’ll see this if you pull the full ticker). A spike above its usual range confirms interest. 4. **Apply a simple momentum rule:** - **If** price change ≥ +2 % **AND** quote volume ≥ 1.5 × the coin’s average 24‑h volume → **Consider a long entry**. - For ADA today, both conditions are met → potential long. 5. **Set your entry & risk parameters:** - **Entry:** Use the current ask price or wait for a small pullback to the VWAP (≈ /bin/sh.199‑/bin/sh.200). - **Stop‑loss:** Plac
** How to Spot Short‑Term Momentum Using Binance Square’s Top Movers Data – A Step‑by‑Step Guide for
Pudgy Penguins (PENGUUSDT) is trending right now!
Rank: #102
** 🚀 **Why this works:** Binance Square’s “Top Movers” list shows the biggest % price changes and trading volume in real time. When a coin jumps **>2%** with a noticeable volume spike, it often signals short‑term momentum that you can ride for a quick scalp or swing trade. 📊 **Step‑by‑Step Process (using today’s data – 2026‑09‑03):** 1. **Open the Top Movers table** on Binance Square (or the API snapshot you just saw). 2. **Filter for gainers** – look at the “gainers” array. - Example: **ADAUSDT** is the top gainer: - Price: **/bin/sh.2021** - 24h change: **+2.537%** - Quote volume: **≈ 19.49 M USDT** - This tells us ADA is buying pressure is strong right now. 3. **Check volume confirmation** – a genuine move needs volume. - Compare ADA’s quote volume (19.49 M) to its 24‑h average (you can view the “volume” field in the main ticker: 100.56 B for BTC, 685 M for ETH). - ADA’s volume is **~ 0.03 %** of BTC’s but **~ 2.8 %** of its own 24‑h average (you’ll see this if you pull the full ticker). A spike above its usual range confirms interest. 4. **Apply a simple momentum rule:** - **If** price change ≥ +2 % **AND** quote volume ≥ 1.5 × the coin’s average 24‑h volume → **Consider a long entry**. - For ADA today, both conditions are met → potential long. 5. **Set your entry & risk parameters:** - **Entry:** Use the current ask price or wait for a small pullback to the VWAP (≈ /bin/sh.199‑/bin/sh.200). - **Stop‑loss:** Plac
Rank: #102
** 🚀 **Why this works:** Binance Square’s “Top Movers” list shows the biggest % price changes and trading volume in real time. When a coin jumps **>2%** with a noticeable volume spike, it often signals short‑term momentum that you can ride for a quick scalp or swing trade. 📊 **Step‑by‑Step Process (using today’s data – 2026‑09‑03):** 1. **Open the Top Movers table** on Binance Square (or the API snapshot you just saw). 2. **Filter for gainers** – look at the “gainers” array. - Example: **ADAUSDT** is the top gainer: - Price: **/bin/sh.2021** - 24h change: **+2.537%** - Quote volume: **≈ 19.49 M USDT** - This tells us ADA is buying pressure is strong right now. 3. **Check volume confirmation** – a genuine move needs volume. - Compare ADA’s quote volume (19.49 M) to its 24‑h average (you can view the “volume” field in the main ticker: 100.56 B for BTC, 685 M for ETH). - ADA’s volume is **~ 0.03 %** of BTC’s but **~ 2.8 %** of its own 24‑h average (you’ll see this if you pull the full ticker). A spike above its usual range confirms interest. 4. **Apply a simple momentum rule:** - **If** price change ≥ +2 % **AND** quote volume ≥ 1.5 × the coin’s average 24‑h volume → **Consider a long entry**. - For ADA today, both conditions are met → potential long. 5. **Set your entry & risk parameters:** - **Entry:** Use the current ask price or wait for a small pullback to the VWAP (≈ /bin/sh.199‑/bin/sh.200). - **Stop‑loss:** Plac
114

·
--
I’m keeping an eye on Hyperliquid (HYPE) +12% and Uniswap (UNI) +8% as they dominate the top‑10 spots. Bitcoin (BTC) still leads with a modest +3% gain, proving its resilience.
I’ve also spotted Cash Cat (CASHCAT) +15% and Pons (PONS) +9% climbing quickly, while Secret (SCRT) shows a steady +4% bounce.
Pudgy Penguins (PENGU) +7% and the under‑ranked token at #102, plus a surprise pop from the #142 token, keep the list fresh 🚀. I love watching these shifts!
$T, $FF, $T
I’m keeping an eye on Hyperliquid (HYPE) +12% and Uniswap (UNI) +8% as they dominate the top‑10 spots. Bitcoin (BTC) still leads with a modest +3% gain, proving its resilience.
I’ve also spotted Cash Cat (CASHCAT) +15% and Pons (PONS) +9% climbing quickly, while Secret (SCRT) shows a steady +4% bounce.
Pudgy Penguins (PENGU) +7% and the under‑ranked token at #102, plus a surprise pop from the #142 token, keep the list fresh 🚀. I love watching these shifts!
$T , $FF , $T
I’ve also spotted Cash Cat (CASHCAT) +15% and Pons (PONS) +9% climbing quickly, while Secret (SCRT) shows a steady +4% bounce.
Pudgy Penguins (PENGU) +7% and the under‑ranked token at #102, plus a surprise pop from the #142 token, keep the list fresh 🚀. I love watching these shifts!
$T , $FF , $T
526

·
--
That was a shift.
Binance has launched multiple USDⓈ-Margined TradFi perpetual contracts in rapid succession, including GIGADEVUSDT, GRVTUSDT, and a range of bStocks tokenized securities as collateral - all within the last 30 days. This isn’t a one-off. It’s a trend. And it’s happening while most other major exchanges remain silent on similar products.
$BNB has been quietly tracking this shift. The longer-term momentum is still there, but the short-term conviction is fading.
defense or offense - one word
—
For educational purposes only. Not financial advice.
📌 Crypto 101 · #102 · #CryptoEducation #CryptoSighted $BNB
That was a shift.
Binance has launched multiple USDⓈ-Margined TradFi perpetual contracts in rapid succession, including GIGADEVUSDT, GRVTUSDT, and a range of bStocks tokenized securities as collateral - all within the last 30 days. This isn’t a one-off. It’s a trend. And it’s happening while most other major exchanges remain silent on similar products.
$BNB has been quietly tracking this shift. The longer-term momentum is still there, but the short-term conviction is fading.
defense or offense - one word
—
For educational purposes only. Not financial advice.
📌 Crypto 101 · #102 · #CryptoEducation #CryptoSighted $BNB
Binance has launched multiple USDⓈ-Margined TradFi perpetual contracts in rapid succession, including GIGADEVUSDT, GRVTUSDT, and a range of bStocks tokenized securities as collateral - all within the last 30 days. This isn’t a one-off. It’s a trend. And it’s happening while most other major exchanges remain silent on similar products.
$BNB has been quietly tracking this shift. The longer-term momentum is still there, but the short-term conviction is fading.
defense or offense - one word
—
For educational purposes only. Not financial advice.
📌 Crypto 101 · #102 · #CryptoEducation #CryptoSighted $BNB
195
·
--
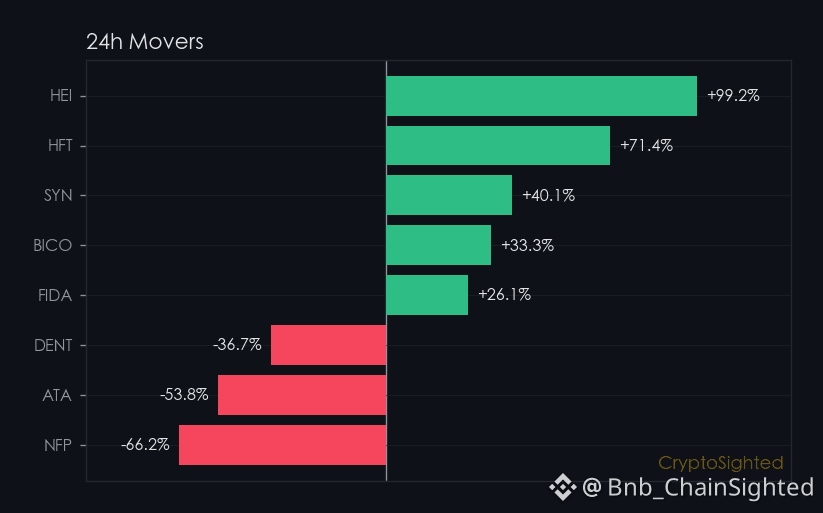
7.4% - that’s the 24-hour jump in $UNI’s price, but the story goes deeper.
UNI is up 30% over the past 30 days, yet its 24-hour price movement is just ↑5.82%, and its funding rate remains locked near equilibrium at ↑0.0004%.
That’s a curious gap - long-term gains without leverage pushing the price higher.
Meanwhile, the DeFi sector is split. UNI is up ↑6.6% in 24 hours, while Layer1 projects are only ↑1.0%, and meme tokens are down ↓1.4%.
That’s a sector divergence - UNI is moving, but not in lockstep with others.
—
Not financial advice. DYOR.
📌 Gainers Radar · #102 · #Gainers #CryptoSighted $UNI
7.4% - that’s the 24-hour jump in $UNI ’s price, but the story goes deeper.
UNI is up 30% over the past 30 days, yet its 24-hour price movement is just ↑5.82%, and its funding rate remains locked near equilibrium at ↑0.0004%.
That’s a curious gap - long-term gains without leverage pushing the price higher.
Meanwhile, the DeFi sector is split. UNI is up ↑6.6% in 24 hours, while Layer1 projects are only ↑1.0%, and meme tokens are down ↓1.4%.
That’s a sector divergence - UNI is moving, but not in lockstep with others.
—
Not financial advice. DYOR.
📌 Gainers Radar · #102 · #Gainers #CryptoSighted $UNI
UNI is up 30% over the past 30 days, yet its 24-hour price movement is just ↑5.82%, and its funding rate remains locked near equilibrium at ↑0.0004%.
That’s a curious gap - long-term gains without leverage pushing the price higher.
Meanwhile, the DeFi sector is split. UNI is up ↑6.6% in 24 hours, while Layer1 projects are only ↑1.0%, and meme tokens are down ↓1.4%.
That’s a sector divergence - UNI is moving, but not in lockstep with others.
—
Not financial advice. DYOR.
📌 Gainers Radar · #102 · #Gainers #CryptoSighted $UNI
548
·
--
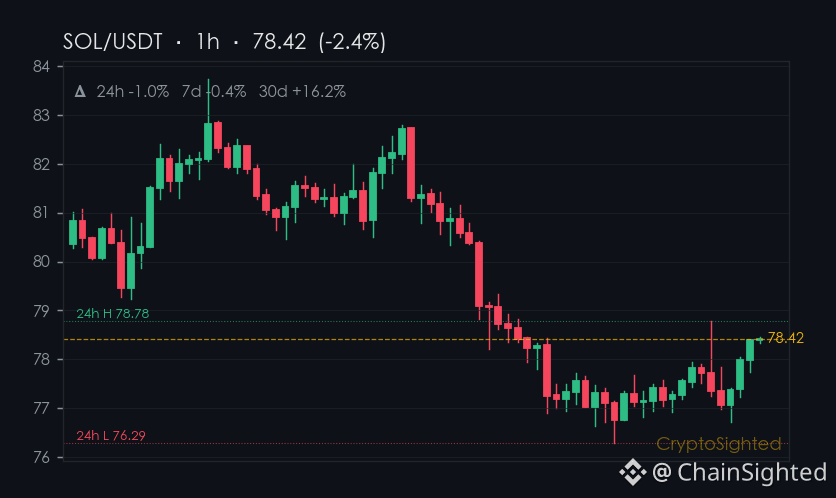
1.0% of $SOL traded at $78.32 with just a 0.18% 24-hour move.
That’s not much - but it’s enough to make the quietest of market watchers sit up.
Solana’s 7-day change is ↓2.7%, and its 30-day change is ↑23.9%.
The short-term dip contrasts with a much stronger long-term trend.
It’s not a panic, but it’s not a surge either - it’s a pause in a broader climb.
I’ve seen this pattern before - and it’s usually the start of something. But the rest is your call.
—
Not financial advice. DYOR.
📌 Hotspot Watch · #102 · #CryptoTrends #CryptoSighted $SOL
1.0% of $SOL traded at $78.32 with just a 0.18% 24-hour move.
That’s not much - but it’s enough to make the quietest of market watchers sit up.
Solana’s 7-day change is ↓2.7%, and its 30-day change is ↑23.9%.
The short-term dip contrasts with a much stronger long-term trend.
It’s not a panic, but it’s not a surge either - it’s a pause in a broader climb.
I’ve seen this pattern before - and it’s usually the start of something. But the rest is your call.
—
Not financial advice. DYOR.
📌 Hotspot Watch · #102 · #CryptoTrends #CryptoSighted $SOL
That’s not much - but it’s enough to make the quietest of market watchers sit up.
Solana’s 7-day change is ↓2.7%, and its 30-day change is ↑23.9%.
The short-term dip contrasts with a much stronger long-term trend.
It’s not a panic, but it’s not a surge either - it’s a pause in a broader climb.
I’ve seen this pattern before - and it’s usually the start of something. But the rest is your call.
—
Not financial advice. DYOR.
📌 Hotspot Watch · #102 · #CryptoTrends #CryptoSighted $SOL
1
78
·
--
It’s just one breath away from the threshold of the top 100 by market cap, yet it spent a full month giving itself a “precise half-cut.”
As a platform token already listed on Binance Futures, $VVV currently sits awkwardly at a market cap of #102 . Its data is quite interesting: looking over a full year, it is an absolute winner (+272%), but over the past 30 days it has undergone a long bleed, with the price falling from $15.7 to around the current $10.6, and drawing down about 52% from its ATH ($22.58). At the same time, daily trading volume has shrunk from $70 million at last month’s peak to just over $20 million today.
This kind of chart action is a classic cyclical shakeout structure. $VVV is not short on underlying liquidity; this month’s low-volume drift lower is essentially a battle between profit-taking by early bottom-fishers and stop-loss selling from trapped holders at higher levels. When a price is cut in half while volume drops to one-third, it often means selling pressure is being exhausted — nobody wants to sell anymore, but buyers still haven’t woken up. The round-number level near $10 is exactly the psychological support smart money likes to watch.
But being cheap does not mean it is immediately worth pulling the trigger. The risk now is that there is a lack of aggressive buying interest on the chart. If macro sentiment worsens even slightly and the price breaks below the $10 support zone on rising volume, there could be a temporary liquidity vacuum below. Before seeing a strong green candle with volume that fully absorbs the recent down candles, blindly catching the falling knife from the left side is extremely risky.
Strong-man coins top out with frenzy, while bottoms are formed in unnoticed dullness. Do you think $VVV ’s low-volume decline is nearing the end of a shakeout, or is it a pause within a larger-scale correction?
It’s just one breath away from the threshold of the top 100 by market cap, yet it spent a full month giving itself a “precise half-cut.”
As a platform token already listed on Binance Futures, $VVV currently sits awkwardly at a market cap of #102 . Its data is quite interesting: looking over a full year, it is an absolute winner (+272%), but over the past 30 days it has undergone a long bleed, with the price falling from $15.7 to around the current $10.6, and drawing down about 52% from its ATH ($22.58). At the same time, daily trading volume has shrunk from $70 million at last month’s peak to just over $20 million today.
This kind of chart action is a classic cyclical shakeout structure. $VVV is not short on underlying liquidity; this month’s low-volume drift lower is essentially a battle between profit-taking by early bottom-fishers and stop-loss selling from trapped holders at higher levels. When a price is cut in half while volume drops to one-third, it often means selling pressure is being exhausted — nobody wants to sell anymore, but buyers still haven’t woken up. The round-number level near $10 is exactly the psychological support smart money likes to watch.
But being cheap does not mean it is immediately worth pulling the trigger. The risk now is that there is a lack of aggressive buying interest on the chart. If macro sentiment worsens even slightly and the price breaks below the $10 support zone on rising volume, there could be a temporary liquidity vacuum below. Before seeing a strong green candle with volume that fully absorbs the recent down candles, blindly catching the falling knife from the left side is extremely risky.
Strong-man coins top out with frenzy, while bottoms are formed in unnoticed dullness. Do you think $VVV ’s low-volume decline is nearing the end of a shakeout, or is it a pause within a larger-scale correction?
As a platform token already listed on Binance Futures, $VVV currently sits awkwardly at a market cap of #102 . Its data is quite interesting: looking over a full year, it is an absolute winner (+272%), but over the past 30 days it has undergone a long bleed, with the price falling from $15.7 to around the current $10.6, and drawing down about 52% from its ATH ($22.58). At the same time, daily trading volume has shrunk from $70 million at last month’s peak to just over $20 million today.
This kind of chart action is a classic cyclical shakeout structure. $VVV is not short on underlying liquidity; this month’s low-volume drift lower is essentially a battle between profit-taking by early bottom-fishers and stop-loss selling from trapped holders at higher levels. When a price is cut in half while volume drops to one-third, it often means selling pressure is being exhausted — nobody wants to sell anymore, but buyers still haven’t woken up. The round-number level near $10 is exactly the psychological support smart money likes to watch.
But being cheap does not mean it is immediately worth pulling the trigger. The risk now is that there is a lack of aggressive buying interest on the chart. If macro sentiment worsens even slightly and the price breaks below the $10 support zone on rising volume, there could be a temporary liquidity vacuum below. Before seeing a strong green candle with volume that fully absorbs the recent down candles, blindly catching the falling knife from the left side is extremely risky.
Strong-man coins top out with frenzy, while bottoms are formed in unnoticed dullness. Do you think $VVV ’s low-volume decline is nearing the end of a shakeout, or is it a pause within a larger-scale correction?
147

·
--
We're excited to share the latest trending tokens on CoinGecko 🚀. Our community is always looking for new and exciting projects to explore. We're seeing a mix of established and newer tokens gaining traction, with market cap ranks ranging from #1 to #583.
Tokens like Bitcoin (BTC) and Solana (SOL) are holding strong, while others like Taiko (TAIKO) and Morpho (MORPHO) are making waves 🌟. We're also seeing notable market cap ranks from Lighter (LIT) at #102 and Venice Token (VVV) at #92.
We're confident that our community will find value in these trending tokens 💡. As we continue to monitor the market, we're eager to see how these tokens will perform in the future 📈.
$POND, $TLM, $TAIKO
We're excited to share the latest trending tokens on CoinGecko 🚀. Our community is always looking for new and exciting projects to explore. We're seeing a mix of established and newer tokens gaining traction, with market cap ranks ranging from #1 to #583.
Tokens like Bitcoin (BTC) and Solana (SOL) are holding strong, while others like Taiko (TAIKO) and Morpho (MORPHO) are making waves 🌟. We're also seeing notable market cap ranks from Lighter (LIT) at #102 and Venice Token (VVV) at #92.
We're confident that our community will find value in these trending tokens 💡. As we continue to monitor the market, we're eager to see how these tokens will perform in the future 📈.
$POND, $TLM , $TAIKO
Tokens like Bitcoin (BTC) and Solana (SOL) are holding strong, while others like Taiko (TAIKO) and Morpho (MORPHO) are making waves 🌟. We're also seeing notable market cap ranks from Lighter (LIT) at #102 and Venice Token (VVV) at #92.
We're confident that our community will find value in these trending tokens 💡. As we continue to monitor the market, we're eager to see how these tokens will perform in the future 📈.
$POND, $TLM , $TAIKO
23
·
--
We're excited to share the latest trending tokens with our community 🚀. According to CoinGecko, top tokens like Bitcoin and Solana are making waves. We're seeing a mix of established players and newcomers on the list.
Our analysis shows that tokens like LAB, Venice Token, and Pudgy Penguins are gaining traction, with market cap ranks of #22, #102, and #115 respectively. XRP and The Black Bull are also on the radar, with ranks #6 and #226. We're tracking these tokens closely to see how they perform in the coming days 💡.
As we continue to monitor the market, we're optimistic about the potential of these tokens to drive growth and innovation 💸. We're committed to providing our community with the latest insights and updates, and we look forward to seeing how these tokens evolve over time.
$VANRY, $RPL, $LAB
We're excited to share the latest trending tokens with our community 🚀. According to CoinGecko, top tokens like Bitcoin and Solana are making waves. We're seeing a mix of established players and newcomers on the list.
Our analysis shows that tokens like LAB, Venice Token, and Pudgy Penguins are gaining traction, with market cap ranks of #22, #102, and #115 respectively. XRP and The Black Bull are also on the radar, with ranks #6 and #226. We're tracking these tokens closely to see how they perform in the coming days 💡.
As we continue to monitor the market, we're optimistic about the potential of these tokens to drive growth and innovation 💸. We're committed to providing our community with the latest insights and updates, and we look forward to seeing how these tokens evolve over time.
$VANRY, $RPL , $LAB
Our analysis shows that tokens like LAB, Venice Token, and Pudgy Penguins are gaining traction, with market cap ranks of #22, #102, and #115 respectively. XRP and The Black Bull are also on the radar, with ranks #6 and #226. We're tracking these tokens closely to see how they perform in the coming days 💡.
As we continue to monitor the market, we're optimistic about the potential of these tokens to drive growth and innovation 💸. We're committed to providing our community with the latest insights and updates, and we look forward to seeing how these tokens evolve over time.
$VANRY, $RPL , $LAB
85
·
--
My intuition is that $APT being on Trending today is more like a pause during a downtrend than a reversal. What needs to be verified is whether that 2.49% gain has volume to back it up, and whether the $0.55–$0.57 range can hold.
In the past 7 days it’s down nearly 10%, and in the past 30 days it’s down 11.48%; it’s fallen 97% from ATH—market cap has dropped to #102, and daily trading volume is only 25M, clearly lower than the 40–50M two weeks ago. Over the last 30 days, the trend has been a gradual slope from 0.63 down to 0.55, and rebounds never last more than three days. What does this mean? It’s not that nobody is paying attention—it's that funds would rather wait on the sidelines for a lower price than step in here to take positions.
Right now, the market isn’t trading a narrative—it’s trading price inertia: the more it falls, the more people wait; the more it contracts in volume, the weaker the rebound tends to be. What I care about most is the $0.55 boundary: if it breaks, the next support will likely be around 0.50; if the rebound can return to 0.60+ with increased volume, then that’s the signal that warrants a fresh re-evaluation.
The conditions under which my view becomes invalid are quite specific: over the next two trading days, daily trading volume must return continuously to above 40M, and the close must be above 0.60. If both conditions are met, I’ll admit that this “breathing pause” has changed its nature. Until then, it’s better to watch those two numbers yourself—it's more reliable than trusting anyone else’s conclusion.
My intuition is that $APT being on Trending today is more like a pause during a downtrend than a reversal. What needs to be verified is whether that 2.49% gain has volume to back it up, and whether the $0.55–$0.57 range can hold.
In the past 7 days it’s down nearly 10%, and in the past 30 days it’s down 11.48%; it’s fallen 97% from ATH—market cap has dropped to #102, and daily trading volume is only 25M, clearly lower than the 40–50M two weeks ago. Over the last 30 days, the trend has been a gradual slope from 0.63 down to 0.55, and rebounds never last more than three days. What does this mean? It’s not that nobody is paying attention—it's that funds would rather wait on the sidelines for a lower price than step in here to take positions.
Right now, the market isn’t trading a narrative—it’s trading price inertia: the more it falls, the more people wait; the more it contracts in volume, the weaker the rebound tends to be. What I care about most is the $0.55 boundary: if it breaks, the next support will likely be around 0.50; if the rebound can return to 0.60+ with increased volume, then that’s the signal that warrants a fresh re-evaluation.
The conditions under which my view becomes invalid are quite specific: over the next two trading days, daily trading volume must return continuously to above 40M, and the close must be above 0.60. If both conditions are met, I’ll admit that this “breathing pause” has changed its nature. Until then, it’s better to watch those two numbers yourself—it's more reliable than trusting anyone else’s conclusion.
In the past 7 days it’s down nearly 10%, and in the past 30 days it’s down 11.48%; it’s fallen 97% from ATH—market cap has dropped to #102, and daily trading volume is only 25M, clearly lower than the 40–50M two weeks ago. Over the last 30 days, the trend has been a gradual slope from 0.63 down to 0.55, and rebounds never last more than three days. What does this mean? It’s not that nobody is paying attention—it's that funds would rather wait on the sidelines for a lower price than step in here to take positions.
Right now, the market isn’t trading a narrative—it’s trading price inertia: the more it falls, the more people wait; the more it contracts in volume, the weaker the rebound tends to be. What I care about most is the $0.55 boundary: if it breaks, the next support will likely be around 0.50; if the rebound can return to 0.60+ with increased volume, then that’s the signal that warrants a fresh re-evaluation.
The conditions under which my view becomes invalid are quite specific: over the next two trading days, daily trading volume must return continuously to above 40M, and the close must be above 0.60. If both conditions are met, I’ll admit that this “breathing pause” has changed its nature. Until then, it’s better to watch those two numbers yourself—it's more reliable than trusting anyone else’s conclusion.
77
·
--
We're taking a look at the latest trending tokens on CoinGecko, and we're excited to share our findings with our community. The list features a mix of established and emerging players in the crypto space. We're seeing a diverse range of tokens, from well-known names like Ethereum (ETH) and Chainlink (LINK), to newer projects like Pudgy Penguins (PENGU) and Fusionist (ACE).
Our analysis shows that these tokens have been making waves in the market, with some experiencing significant growth. For example, Ether.fi (ETHFI) has been gaining traction, while LAB (LAB) and Uniswap (UNI) continue to hold their own. We're also keeping an eye on the market cap rankings, which show Ether.fi (ETHFI) at #102 and Pudgy Penguins (PENGU) at #109. 📈
We're encouraged by the activity in the crypto market, and we're looking forward to seeing how these tokens continue to perform. With the market constantly evolving, we're staying up-to-date on the latest trends and developments. We're committed to providing our community with the latest insights and information, so stay tuned for more updates 🚀💰👍
$ACE, $ALICE, $ACE
We're taking a look at the latest trending tokens on CoinGecko, and we're excited to share our findings with our community. The list features a mix of established and emerging players in the crypto space. We're seeing a diverse range of tokens, from well-known names like Ethereum (ETH) and Chainlink (LINK), to newer projects like Pudgy Penguins (PENGU) and Fusionist (ACE).
Our analysis shows that these tokens have been making waves in the market, with some experiencing significant growth. For example, Ether.fi (ETHFI) has been gaining traction, while LAB (LAB) and Uniswap (UNI) continue to hold their own. We're also keeping an eye on the market cap rankings, which show Ether.fi (ETHFI) at #102 and Pudgy Penguins (PENGU) at #109. 📈
We're encouraged by the activity in the crypto market, and we're looking forward to seeing how these tokens continue to perform. With the market constantly evolving, we're staying up-to-date on the latest trends and developments. We're committed to providing our community with the latest insights and information, so stay tuned for more updates 🚀💰👍
$ACE , $ALICE , $ACE
Our analysis shows that these tokens have been making waves in the market, with some experiencing significant growth. For example, Ether.fi (ETHFI) has been gaining traction, while LAB (LAB) and Uniswap (UNI) continue to hold their own. We're also keeping an eye on the market cap rankings, which show Ether.fi (ETHFI) at #102 and Pudgy Penguins (PENGU) at #109. 📈
We're encouraged by the activity in the crypto market, and we're looking forward to seeing how these tokens continue to perform. With the market constantly evolving, we're staying up-to-date on the latest trends and developments. We're committed to providing our community with the latest insights and information, so stay tuned for more updates 🚀💰👍
$ACE , $ALICE , $ACE
119

·
--
Two folks in the group are asking if VIRTUAL is a good entry. I took a glance at the Trending spot. It's mid-range, not really bullish or bearish. To be honest, this kind of position is the trickiest to navigate. If I jump in, I worry about getting dumped on, but if I don't, I might miss the boat. MC #102 is kinda average—neither too big nor too small. The hype is just starting to build, that's true, but the AI + gaming narrative feels a bit played out lately. Whether it can sustain this momentum is anyone's guess. I'm opting to sit on the sidelines for now. Not all hype is worth chasing; some is just a flash in the pan.
Two folks in the group are asking if VIRTUAL is a good entry. I took a glance at the Trending spot. It's mid-range, not really bullish or bearish. To be honest, this kind of position is the trickiest to navigate. If I jump in, I worry about getting dumped on, but if I don't, I might miss the boat. MC #102 is kinda average—neither too big nor too small. The hype is just starting to build, that's true, but the AI + gaming narrative feels a bit played out lately. Whether it can sustain this momentum is anyone's guess. I'm opting to sit on the sidelines for now. Not all hype is worth chasing; some is just a flash in the pan.
110
·
--
How long does it take to fall halfway from the pedestal? For $VVV , that is to say, a long round of shrinking-volume, slow grind lower.
At the moment, $VVV is already nearly halved from its ATH (-49.4%). Over the past 30 days alone, it has dropped 29% like a frog being slowly boiled—price has retreated back to the $11.4 line. Seeing a platform token with a market cap over $500 million, stuck right around the top-100 threshold (#102), form this kind of pattern really makes it easy to lose patience.
But this is the usual norm for a cycle. Zoom out: over the past year, $VVV still has gained 323%. If you look closely at the volume-price structure in the last month, there was a rebound in mid-June with a single-day $140 million volume spike; after that, it slid lower all the way, as liquidity gradually dried up. This isn’t panic selling—it’s a typical clearing of profit-taking. During this stage of turnover where losses are cut slowly, “smart money” is usually watching from the sidelines.
The current risk isn’t just that price keeps dipping lower—it’s also the high opportunity cost of time. A shrinking-volume grind lower is worst when you keep waiting and waiting for bullish capital to break the trend. If the next move fails to break out with volume above the descending structure, or if even the range near $11 can’t be held, then blindly catching the falling knife from the left side is easy to get trapped.
Don’t try to predict the bottom—let the bottom reveal itself ☕️ In the crypto market, more often than not, buying at the right time beats buying early. When facing this kind of sideways-to-down washout, are you the type to build positions in batches on the left side, or do you prefer to wait for right-side, volume-confirmed confirmation before boarding?
How long does it take to fall halfway from the pedestal? For $VVV , that is to say, a long round of shrinking-volume, slow grind lower.
At the moment, $VVV is already nearly halved from its ATH (-49.4%). Over the past 30 days alone, it has dropped 29% like a frog being slowly boiled—price has retreated back to the $11.4 line. Seeing a platform token with a market cap over $500 million, stuck right around the top-100 threshold (#102), form this kind of pattern really makes it easy to lose patience.
But this is the usual norm for a cycle. Zoom out: over the past year, $VVV still has gained 323%. If you look closely at the volume-price structure in the last month, there was a rebound in mid-June with a single-day $140 million volume spike; after that, it slid lower all the way, as liquidity gradually dried up. This isn’t panic selling—it’s a typical clearing of profit-taking. During this stage of turnover where losses are cut slowly, “smart money” is usually watching from the sidelines.
The current risk isn’t just that price keeps dipping lower—it’s also the high opportunity cost of time. A shrinking-volume grind lower is worst when you keep waiting and waiting for bullish capital to break the trend. If the next move fails to break out with volume above the descending structure, or if even the range near $11 can’t be held, then blindly catching the falling knife from the left side is easy to get trapped.
Don’t try to predict the bottom—let the bottom reveal itself ☕️ In the crypto market, more often than not, buying at the right time beats buying early. When facing this kind of sideways-to-down washout, are you the type to build positions in batches on the left side, or do you prefer to wait for right-side, volume-confirmed confirmation before boarding?
At the moment, $VVV is already nearly halved from its ATH (-49.4%). Over the past 30 days alone, it has dropped 29% like a frog being slowly boiled—price has retreated back to the $11.4 line. Seeing a platform token with a market cap over $500 million, stuck right around the top-100 threshold (#102), form this kind of pattern really makes it easy to lose patience.
But this is the usual norm for a cycle. Zoom out: over the past year, $VVV still has gained 323%. If you look closely at the volume-price structure in the last month, there was a rebound in mid-June with a single-day $140 million volume spike; after that, it slid lower all the way, as liquidity gradually dried up. This isn’t panic selling—it’s a typical clearing of profit-taking. During this stage of turnover where losses are cut slowly, “smart money” is usually watching from the sidelines.
The current risk isn’t just that price keeps dipping lower—it’s also the high opportunity cost of time. A shrinking-volume grind lower is worst when you keep waiting and waiting for bullish capital to break the trend. If the next move fails to break out with volume above the descending structure, or if even the range near $11 can’t be held, then blindly catching the falling knife from the left side is easy to get trapped.
Don’t try to predict the bottom—let the bottom reveal itself ☕️ In the crypto market, more often than not, buying at the right time beats buying early. When facing this kind of sideways-to-down washout, are you the type to build positions in batches on the left side, or do you prefer to wait for right-side, volume-confirmed confirmation before boarding?
66
Log in to explore more content
Join global crypto users on Binance Square
⚡️ Get latest and useful information about crypto.
💬 Trusted by the world’s largest crypto exchange.
👍 Discover real insights from verified creators.
Email / Phone number
Trending Topics
1
#MemeLaunchpads82%OfArcDayOneVolume
2,111 views
102 Discussing
2
#OstiumLoanDisputeHearingSetInNYFederalCourt
3,952 views
110 Discussing
3
#SKPoliceRefer18PolymarketUsersToProsecutors
4,634 views
171 Discussing
4
#FedSEPProjects2026RateAt4.1%
10,779 views
256 Discussing
5
#USHouseAdvancesBitcoinReserveBill
6,470 views
193 Discussing
6
#AmazonGetsWarrantsToBuyGeneracStock
7,253 views
202 Discussing
7
#DotPlotSignalsOneMoreHikeIn2026
29,156 views
573 Discussing
8
#RobinhoodToSupportCircleArcNetwork
10,184 views
204 Discussing
9
#FedHikes25BpsUSStocksClose
42,152 views
485 Discussing
10
#AaveToLaunchRWAMarketOnAvalanche
9,818 views
201 Discussing