
#6
6
64,502 views
491 Discussing
Hot
Latest

·
--
$Q This one’s kind of interesting.
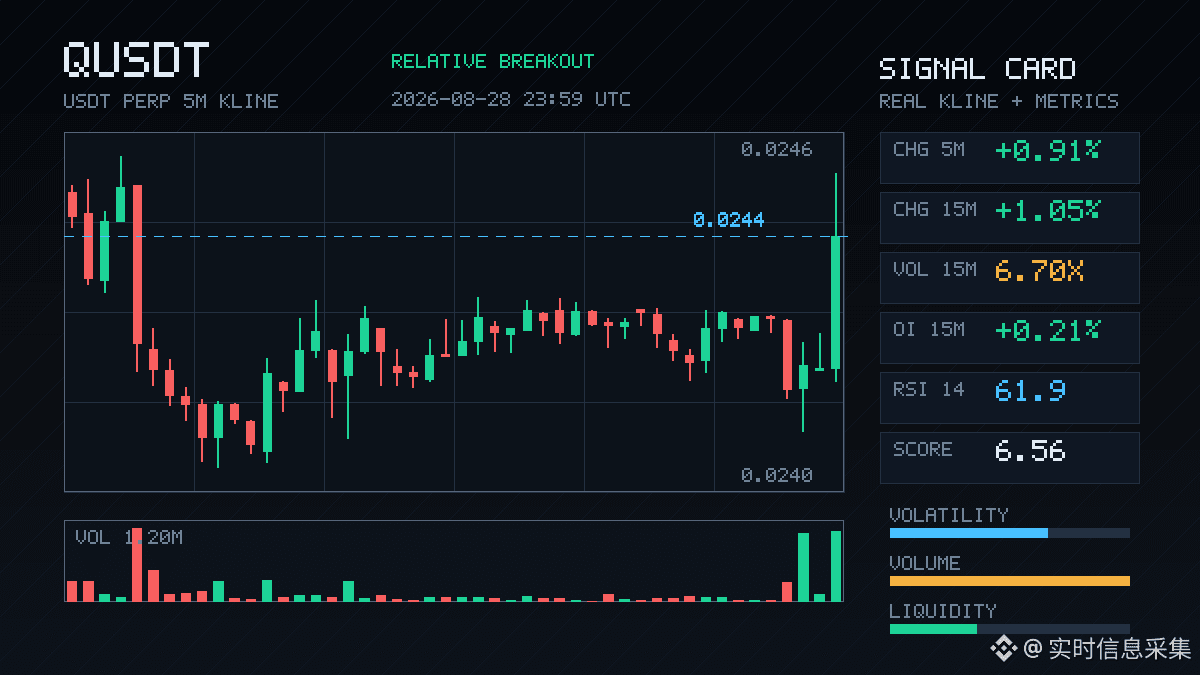
In just 15 minutes it surged 1%, with trading volume reaching 6.7 times the usual level. And at the close it even pushed through the upper boundary of the range formed by the latest 20 five-minute candlesticks. The key point is that OI is rising in sync too—open interest and price both moving upward. This suggests real new leverage long positions are entering (money actually coming in), not just short-covering and a fake spike.
Aggressive trading volume is up 40.9%, buy/sell ratio is 2.38, and the bid side in the order book looks clearly more aggressive. The funding rate is also in the recent high percentile. At the moment, bullish sentiment feels a bit overheated, but the market structure is still fairly healthy, with no signs of divergence.
Breakthrough above the high #6, and the nominal changes are also leading across the pool.
Keep an eye on whether it can hold above the upper edge of this range. Breakouts with this kind of volume-price alignment usually get a continuation move. But if the volume can’t keep up, then a pullback for confirmation is also a normal script.
$Q For short-term trading, pay attention to risk control—don’t chase too high.
$Q This one’s kind of interesting.
In just 15 minutes it surged 1%, with trading volume reaching 6.7 times the usual level. And at the close it even pushed through the upper boundary of the range formed by the latest 20 five-minute candlesticks. The key point is that OI is rising in sync too—open interest and price both moving upward. This suggests real new leverage long positions are entering (money actually coming in), not just short-covering and a fake spike.
Aggressive trading volume is up 40.9%, buy/sell ratio is 2.38, and the bid side in the order book looks clearly more aggressive. The funding rate is also in the recent high percentile. At the moment, bullish sentiment feels a bit overheated, but the market structure is still fairly healthy, with no signs of divergence.
Breakthrough above the high #6, and the nominal changes are also leading across the pool.
Keep an eye on whether it can hold above the upper edge of this range. Breakouts with this kind of volume-price alignment usually get a continuation move. But if the volume can’t keep up, then a pullback for confirmation is also a normal script.
$Q For short-term trading, pay attention to risk control—don’t chase too high.
In just 15 minutes it surged 1%, with trading volume reaching 6.7 times the usual level. And at the close it even pushed through the upper boundary of the range formed by the latest 20 five-minute candlesticks. The key point is that OI is rising in sync too—open interest and price both moving upward. This suggests real new leverage long positions are entering (money actually coming in), not just short-covering and a fake spike.
Aggressive trading volume is up 40.9%, buy/sell ratio is 2.38, and the bid side in the order book looks clearly more aggressive. The funding rate is also in the recent high percentile. At the moment, bullish sentiment feels a bit overheated, but the market structure is still fairly healthy, with no signs of divergence.
Breakthrough above the high #6, and the nominal changes are also leading across the pool.
Keep an eye on whether it can hold above the upper edge of this range. Breakouts with this kind of volume-price alignment usually get a continuation move. But if the volume can’t keep up, then a pullback for confirmation is also a normal script.
$Q For short-term trading, pay attention to risk control—don’t chase too high.
98

·
--
Hyperliquid ($HYPE) Gains Momentum with Strong Volume
Hyperliquid ($HYPE) is trending with a robust 24-hour volume of $516M, placing it at the #6 spot. Despite a modest 1.53% gain, the liquidity and market interest are significant. $HYPE is known for its innovative trading and lending protocols, attracting traders and institutions. The strong volume indicates ongoing institutional activity and market confidence. Traders should watch for any major developments that could further boost momentum. ⚡
Follow for more crypto setups.
#HahaProfit #Hyperliquid
Hyperliquid ($HYPE ) Gains Momentum with Strong Volume
Hyperliquid ($HYPE ) is trending with a robust 24-hour volume of $516M, placing it at the #6 spot. Despite a modest 1.53% gain, the liquidity and market interest are significant. $HYPE is known for its innovative trading and lending protocols, attracting traders and institutions. The strong volume indicates ongoing institutional activity and market confidence. Traders should watch for any major developments that could further boost momentum. ⚡
Follow for more crypto setups.
#HahaProfit #Hyperliquid
Hyperliquid ($HYPE ) is trending with a robust 24-hour volume of $516M, placing it at the #6 spot. Despite a modest 1.53% gain, the liquidity and market interest are significant. $HYPE is known for its innovative trading and lending protocols, attracting traders and institutions. The strong volume indicates ongoing institutional activity and market confidence. Traders should watch for any major developments that could further boost momentum. ⚡
Follow for more crypto setups.
#HahaProfit #Hyperliquid

1

·
--
Hyperliquid $HYPE Gains Momentum with High Volume
Hyperliquid ($HYPE) is trending with a 24h volume of $516M, placing it at #6 in trending rank. The coin is seeing increased interest, likely due to its robust liquidity and low fees. $HYPE’s recent 1.55% price gain is modest, but the high volume suggests strong underlying demand. Traders should keep an eye on this high-cap asset as it continues to attract attention. ⚡
Follow for daily crypto updates.
#DeGenYuv #Hyperliquid
Hyperliquid $HYPE Gains Momentum with High Volume
Hyperliquid ($HYPE ) is trending with a 24h volume of $516M, placing it at #6 in trending rank. The coin is seeing increased interest, likely due to its robust liquidity and low fees. $HYPE ’s recent 1.55% price gain is modest, but the high volume suggests strong underlying demand. Traders should keep an eye on this high-cap asset as it continues to attract attention. ⚡
Follow for daily crypto updates.
#DeGenYuv #Hyperliquid
Hyperliquid ($HYPE ) is trending with a 24h volume of $516M, placing it at #6 in trending rank. The coin is seeing increased interest, likely due to its robust liquidity and low fees. $HYPE ’s recent 1.55% price gain is modest, but the high volume suggests strong underlying demand. Traders should keep an eye on this high-cap asset as it continues to attract attention. ⚡
Follow for daily crypto updates.
#DeGenYuv #Hyperliquid

34

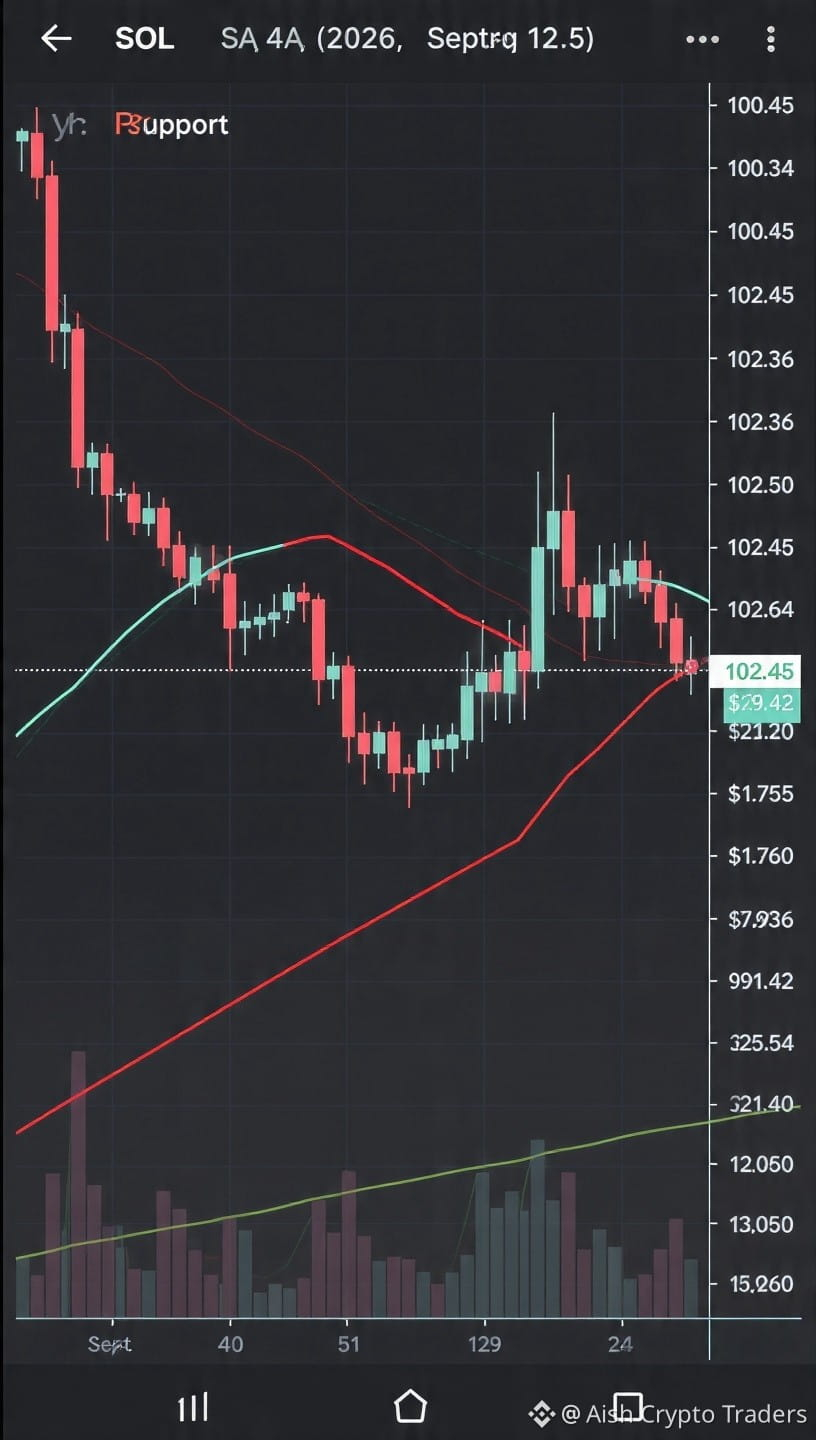
🚨 $SOL UPDATE: SEP 12, 2026 🚨
Solana is trading at $100.45 right now
24h Drop: -1.54% 📉
🔴 Resistance: $102.34 zone
Break and hold above this = Next target $104.16
🟢 Support: $99.42 zone
Lose this and we could retest $98.81
24h Range: $99.42 - $102.34
SOL is up +34.38% this month 🚀
Market Cap: $59.63B | Rank #6
Perp: SOLUSDT trading active
Bullish or Bearish on SOL? Comment 👇
#Solana #SOL #Crypto #BinanceSquare #Trading #DeFi #NFT #SolanaEcosystem #sol #ClarityActFacesProceduralVoteSept15 $SOL $SOLV
{spot}(SOLUSDT)
{future}(SOLVUSDT)
🚨 $SOL UPDATE: SEP 12, 2026 🚨
Solana is trading at $100.45 right now
24h Drop: -1.54% 📉
🔴 Resistance: $102.34 zone
Break and hold above this = Next target $104.16
🟢 Support: $99.42 zone
Lose this and we could retest $98.81
24h Range: $99.42 - $102.34
SOL is up +34.38% this month 🚀
Market Cap: $59.63B | Rank #6
Perp: SOLUSDT trading active
Bullish or Bearish on SOL? Comment 👇
#Solana #SOL #Crypto #BinanceSquare #Trading #DeFi #NFT #SolanaEcosystem #sol #ClarityActFacesProceduralVoteSept15 $SOL $SOLV
Solana is trading at $100.45 right now
24h Drop: -1.54% 📉
🔴 Resistance: $102.34 zone
Break and hold above this = Next target $104.16
🟢 Support: $99.42 zone
Lose this and we could retest $98.81
24h Range: $99.42 - $102.34
SOL is up +34.38% this month 🚀
Market Cap: $59.63B | Rank #6
Perp: SOLUSDT trading active
Bullish or Bearish on SOL? Comment 👇
#Solana #SOL #Crypto #BinanceSquare #Trading #DeFi #NFT #SolanaEcosystem #sol #ClarityActFacesProceduralVoteSept15 $SOL $SOLV
19
·
--
Zcash ($ZEC) Stays in the Spotlight Despite Market Dips
Zcash ($ZEC) is trending at #6, despite a 5.18% dip in 24 hours. The privacy-focused coin is seeing high volume, with $978M traded. Traders are watching $ZEC's resilience and its unique privacy features, which continue to attract interest in a privacy-conscious market. The coin's strong community and ongoing development efforts are keeping it relevant. 📊 What to watch: how $ZEC navigates the current market downturn. 🔍
Follow for daily crypto updates.
#DeGenYuv #Zcash
Zcash ($ZEC ) Stays in the Spotlight Despite Market Dips
Zcash ($ZEC ) is trending at #6, despite a 5.18% dip in 24 hours. The privacy-focused coin is seeing high volume, with $978M traded. Traders are watching $ZEC 's resilience and its unique privacy features, which continue to attract interest in a privacy-conscious market. The coin's strong community and ongoing development efforts are keeping it relevant. 📊 What to watch: how $ZEC navigates the current market downturn. 🔍
Follow for daily crypto updates.
#DeGenYuv #Zcash
Zcash ($ZEC ) is trending at #6, despite a 5.18% dip in 24 hours. The privacy-focused coin is seeing high volume, with $978M traded. Traders are watching $ZEC 's resilience and its unique privacy features, which continue to attract interest in a privacy-conscious market. The coin's strong community and ongoing development efforts are keeping it relevant. 📊 What to watch: how $ZEC navigates the current market downturn. 🔍
Follow for daily crypto updates.
#DeGenYuv #Zcash
29
·
--
Zcash ($ZEC) in the Spotlight: Privacy and Innovation
Zcash ($ZEC) is trending at #6, despite a 5.34% drop in the last 24 hours. The coin's strong market cap rank and high trading volume signal ongoing interest. $ZEC is known for its privacy features, making it a go-to for users seeking anonymity. Recent updates and community activity are fueling discussions around its future potential. Traders should keep an eye on privacy-focused developments and community engagement. ⚠️
Follow for more setups like this.
#HahaProfit #Zcash
Zcash ($ZEC ) in the Spotlight: Privacy and Innovation
Zcash ($ZEC ) is trending at #6, despite a 5.34% drop in the last 24 hours. The coin's strong market cap rank and high trading volume signal ongoing interest. $ZEC is known for its privacy features, making it a go-to for users seeking anonymity. Recent updates and community activity are fueling discussions around its future potential. Traders should keep an eye on privacy-focused developments and community engagement. ⚠️
Follow for more setups like this.
#HahaProfit #Zcash
Zcash ($ZEC ) is trending at #6, despite a 5.34% drop in the last 24 hours. The coin's strong market cap rank and high trading volume signal ongoing interest. $ZEC is known for its privacy features, making it a go-to for users seeking anonymity. Recent updates and community activity are fueling discussions around its future potential. Traders should keep an eye on privacy-focused developments and community engagement. ⚠️
Follow for more setups like this.
#HahaProfit #Zcash

124


·
--
$FIL This drop isn’t especially fierce, but the tape smells a bit bloody.
On the 15m timeframe, it dumps straight down with a 2.65x volume spike. The aggressive trade gap is -28.9%, and the buy/sell ratio falls to 0.55—there’s clearly sell pressure, as if someone is really cutting.
On the next 5m leg, a Binance liquidation agent liquidates 246K worth of contracts. The sells are even more concentrated, which is a classic long-deleveraging playbook.
Open interest follows the price down: on the 1h chart, perp contracts are down 1.65%, and notional shrinks by $1.5 million. This isn’t new shorts entering—it’s old longs being forced out: stop-losses, lower leverage, and shrinking positions. They hand over chips passively all the way.
What’s strange is that OI’s percentile rank is still as high as 78.2%, with the whole-pool notional change at #6. At this level, liquidation usually isn’t the endpoint—it’s more like flushing out floating longs. 24h trading volume is $434 million; liquidity isn’t lacking—the real question is whether buyers will dare to step in at this price.
A 1.29% drop by itself isn’t big, but combined with heavy volume, an aggressive sell bias, and concentrated liquidations, the market is short-term defensive. Next, watch two things: whether OI can stabilize and stop falling, and whether the aggressive buy/sell ratio can recover above 0.8. If it can’t, then expect more grinding.
$FIL This drop isn’t especially fierce, but the tape smells a bit bloody.
On the 15m timeframe, it dumps straight down with a 2.65x volume spike. The aggressive trade gap is -28.9%, and the buy/sell ratio falls to 0.55—there’s clearly sell pressure, as if someone is really cutting.
On the next 5m leg, a Binance liquidation agent liquidates 246K worth of contracts. The sells are even more concentrated, which is a classic long-deleveraging playbook.
Open interest follows the price down: on the 1h chart, perp contracts are down 1.65%, and notional shrinks by $1.5 million. This isn’t new shorts entering—it’s old longs being forced out: stop-losses, lower leverage, and shrinking positions. They hand over chips passively all the way.
What’s strange is that OI’s percentile rank is still as high as 78.2%, with the whole-pool notional change at #6. At this level, liquidation usually isn’t the endpoint—it’s more like flushing out floating longs. 24h trading volume is $434 million; liquidity isn’t lacking—the real question is whether buyers will dare to step in at this price.
A 1.29% drop by itself isn’t big, but combined with heavy volume, an aggressive sell bias, and concentrated liquidations, the market is short-term defensive. Next, watch two things: whether OI can stabilize and stop falling, and whether the aggressive buy/sell ratio can recover above 0.8. If it can’t, then expect more grinding.
On the 15m timeframe, it dumps straight down with a 2.65x volume spike. The aggressive trade gap is -28.9%, and the buy/sell ratio falls to 0.55—there’s clearly sell pressure, as if someone is really cutting.
On the next 5m leg, a Binance liquidation agent liquidates 246K worth of contracts. The sells are even more concentrated, which is a classic long-deleveraging playbook.
Open interest follows the price down: on the 1h chart, perp contracts are down 1.65%, and notional shrinks by $1.5 million. This isn’t new shorts entering—it’s old longs being forced out: stop-losses, lower leverage, and shrinking positions. They hand over chips passively all the way.
What’s strange is that OI’s percentile rank is still as high as 78.2%, with the whole-pool notional change at #6. At this level, liquidation usually isn’t the endpoint—it’s more like flushing out floating longs. 24h trading volume is $434 million; liquidity isn’t lacking—the real question is whether buyers will dare to step in at this price.
A 1.29% drop by itself isn’t big, but combined with heavy volume, an aggressive sell bias, and concentrated liquidations, the market is short-term defensive. Next, watch two things: whether OI can stabilize and stop falling, and whether the aggressive buy/sell ratio can recover above 0.8. If it can’t, then expect more grinding.
18

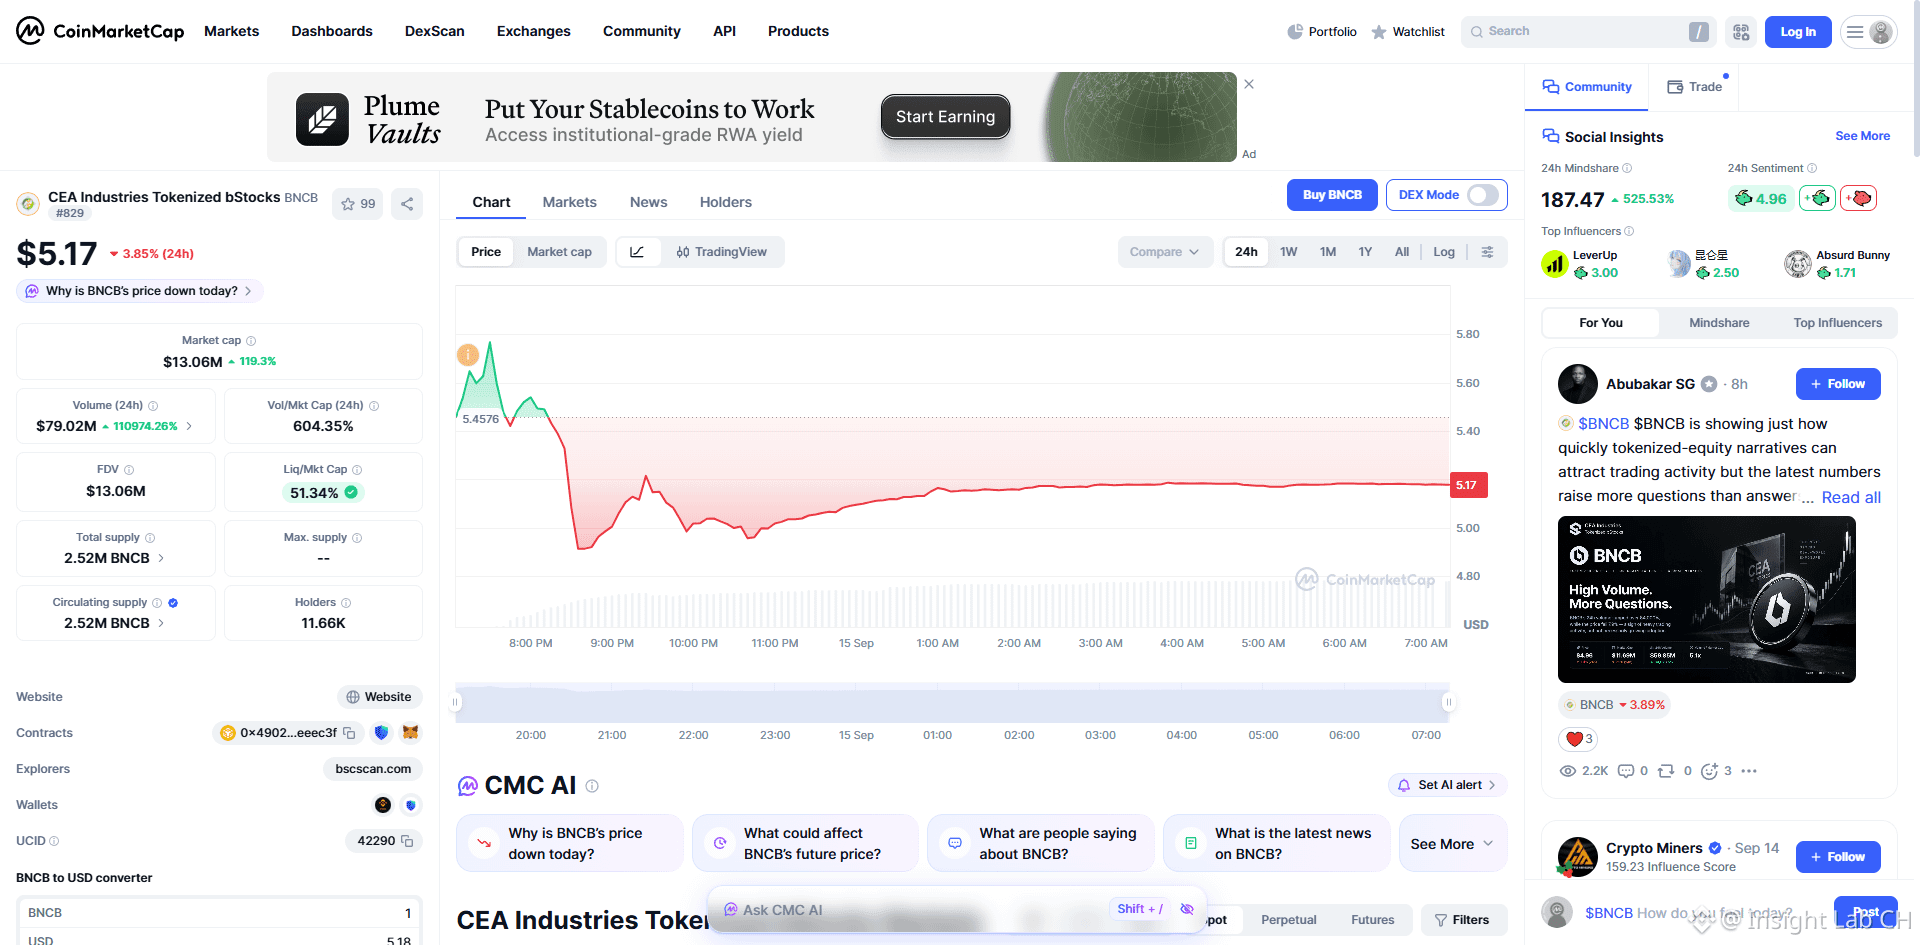
CEA Industries Tokenized bStocks($BNCB)currently ranks No. #6 on the CoinMarketCap trending list. Against the backdrop of ongoing uncertainty in liquidity and the regulatory environment, tokenized stocks and other assets are clearly driven by short-term speculation, and the risk of a downward valuation deviation from fundamentals should not be overlooked.⚠️ #RWA #TokenizedAssets
CEA Industries Tokenized bStocks($BNCB )currently ranks No. #6 on the CoinMarketCap trending list. Against the backdrop of ongoing uncertainty in liquidity and the regulatory environment, tokenized stocks and other assets are clearly driven by short-term speculation, and the risk of a downward valuation deviation from fundamentals should not be overlooked.⚠️ #RWA #TokenizedAssets
147
·
--
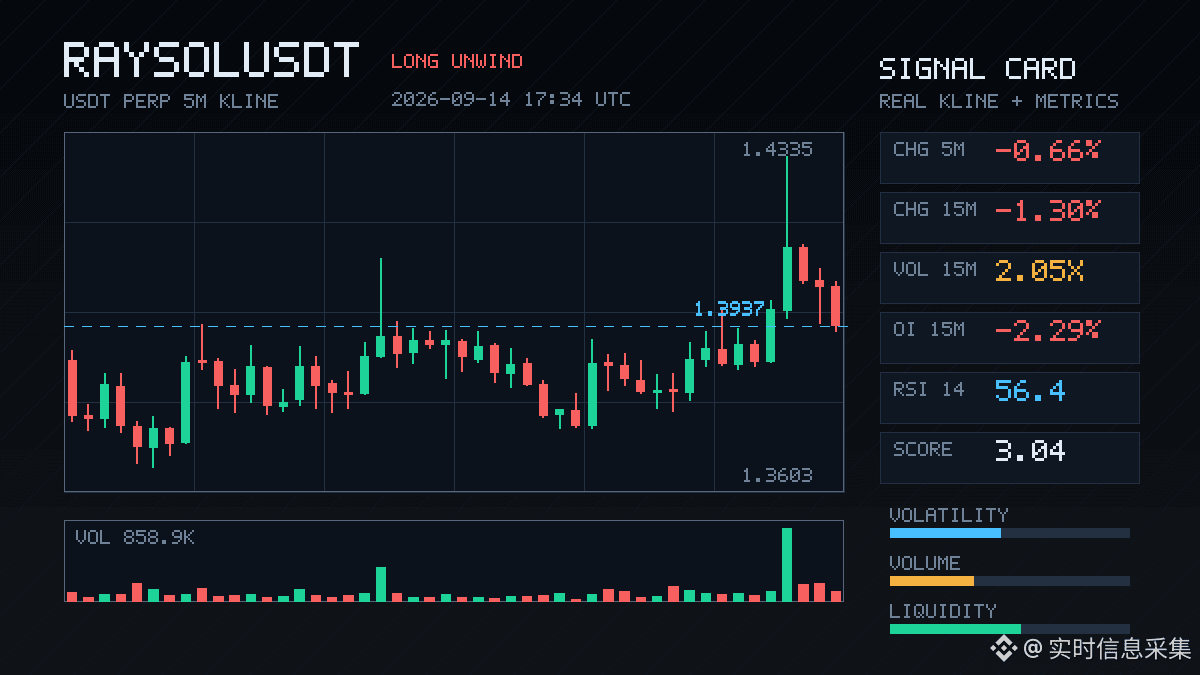
$RAYSOL OI abnormal quantile levels reached 93.5%. With an hour contract position, OI dropped directly by 3.27%, and the notional value decreased by more than 1.5 million.
Price on 15m fell 1.3%, aggressive trades had a difference of +16.7%, and buy/sell ratio was 1.40—just looking at this ratio it seems like someone is actively buying, but with both OI and notional dropping at the same time, it looks more like longs were squeezed out and liquidated to deleverage, not an upward structure from new capital entering.
In 24h, trading volume was 42M; on 15m, volume was 2.05x; volatility Z was 1.84. Depth data is sufficient. Whole-pool anomaly #6, notional change #28—among the earlier ones in the whole-pool scope, but not yet top-tier crowding.
Near its own historical extreme zone: a sample of longs deleveraging. Don’t rush to buy the dip in this situation—wait for OI to stabilize first.
$RAYSOL OI abnormal quantile levels reached 93.5%. With an hour contract position, OI dropped directly by 3.27%, and the notional value decreased by more than 1.5 million.
Price on 15m fell 1.3%, aggressive trades had a difference of +16.7%, and buy/sell ratio was 1.40—just looking at this ratio it seems like someone is actively buying, but with both OI and notional dropping at the same time, it looks more like longs were squeezed out and liquidated to deleverage, not an upward structure from new capital entering.
In 24h, trading volume was 42M; on 15m, volume was 2.05x; volatility Z was 1.84. Depth data is sufficient. Whole-pool anomaly #6, notional change #28—among the earlier ones in the whole-pool scope, but not yet top-tier crowding.
Near its own historical extreme zone: a sample of longs deleveraging. Don’t rush to buy the dip in this situation—wait for OI to stabilize first.
Price on 15m fell 1.3%, aggressive trades had a difference of +16.7%, and buy/sell ratio was 1.40—just looking at this ratio it seems like someone is actively buying, but with both OI and notional dropping at the same time, it looks more like longs were squeezed out and liquidated to deleverage, not an upward structure from new capital entering.
In 24h, trading volume was 42M; on 15m, volume was 2.05x; volatility Z was 1.84. Depth data is sufficient. Whole-pool anomaly #6, notional change #28—among the earlier ones in the whole-pool scope, but not yet top-tier crowding.
Near its own historical extreme zone: a sample of longs deleveraging. Don’t rush to buy the dip in this situation—wait for OI to stabilize first.
23

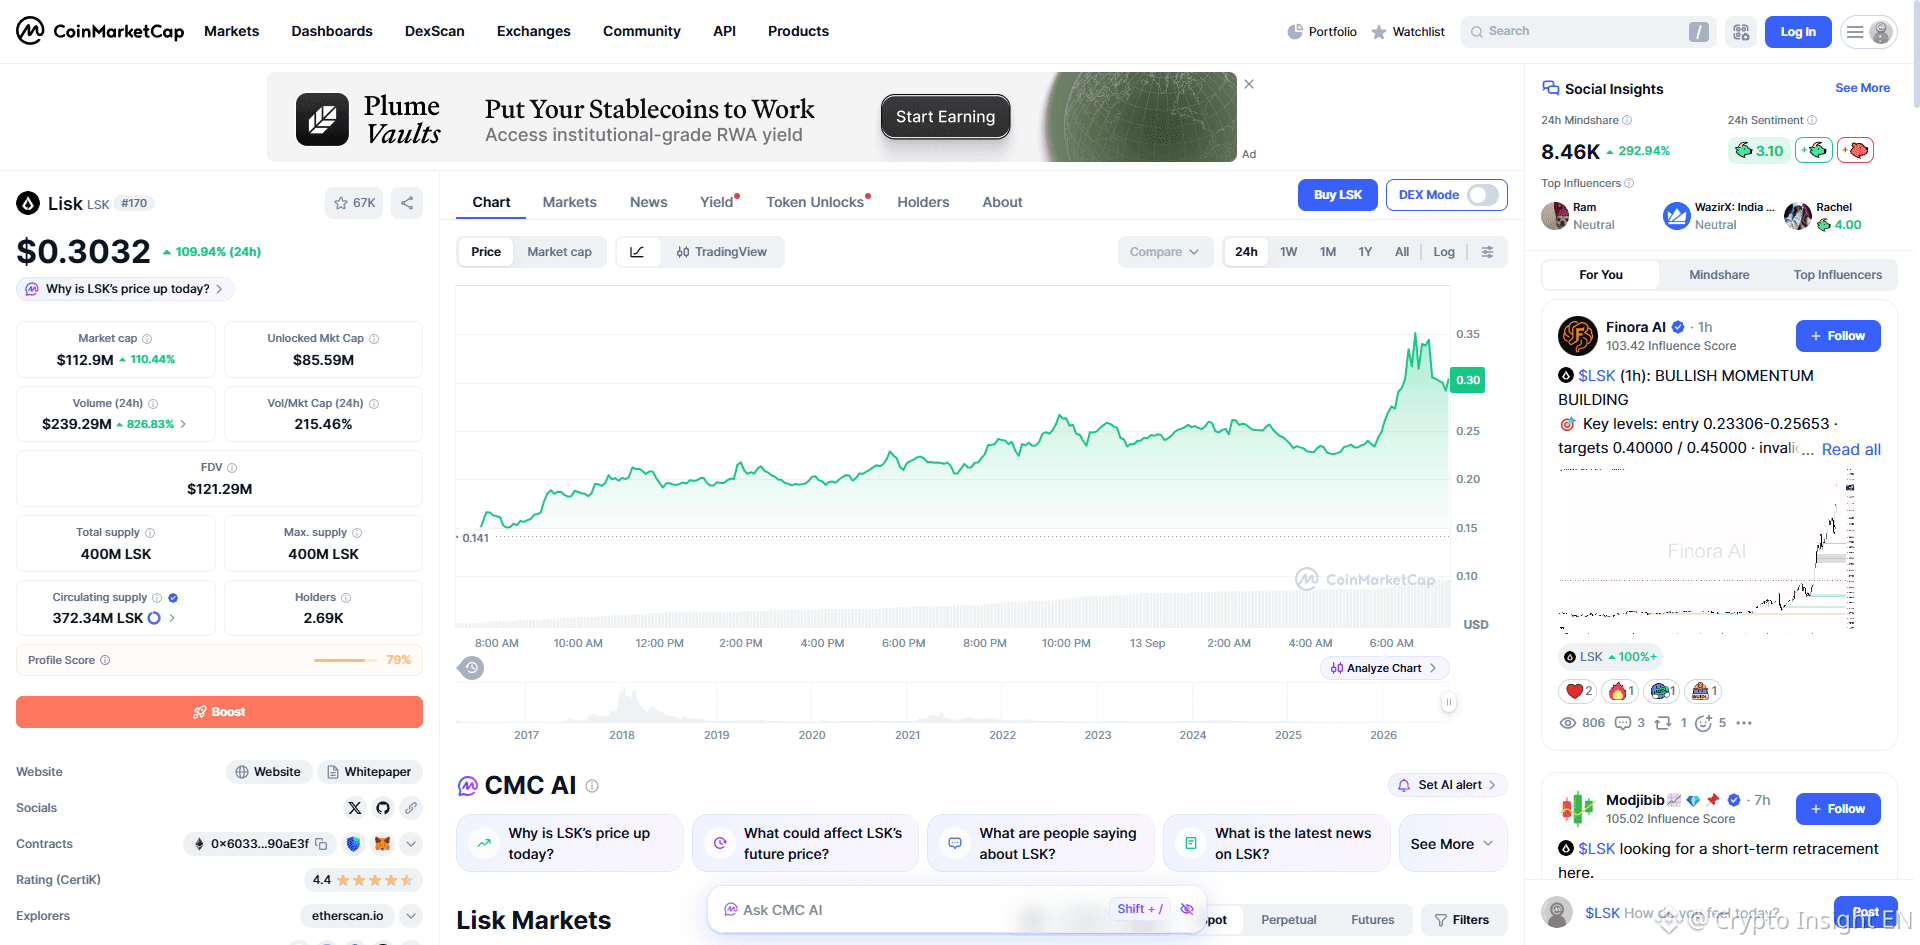
$LSK -52.29%: What other data confirms this strong run?$LSK /{v} just had a move large enough to hit the radar. What’s worth reading is the 'structure' of the move, not the headline. Market: 0.40956 · 24h -52.29% · volume ~1,745.2M USDT · 24,772,346 trades.
Location: 1/100 within the daily range · about 63.1% away from the high. Continuation requires: Breaking 0.403 with expanding open volume will make the bearish continuation scenario more credible.
Cool down if: Failing to hold the lower zone and reclaiming the midpoint 0.756445 will cause the pressure to weaken. 📌 LONG/SHORT perspective: **SHORT · STRONG · 84/100**.
$LSK -52.29%: What other data confirms this strong run?
$LSK /{v} just had a move large enough to hit the radar. What’s worth reading is the 'structure' of the move, not the headline. Market: 0.40956 · 24h -52.29% · volume ~1,745.2M USDT · 24,772,346 trades.
Location: 1/100 within the daily range · about 63.1% away from the high. Continuation requires: Breaking 0.403 with expanding open volume will make the bearish continuation scenario more credible.
Cool down if: Failing to hold the lower zone and reclaiming the midpoint 0.756445 will cause the pressure to weaken. 📌 LONG/SHORT perspective: **SHORT · STRONG · 84/100**.
Location: 1/100 within the daily range · about 63.1% away from the high. Continuation requires: Breaking 0.403 with expanding open volume will make the bearish continuation scenario more credible.
Cool down if: Failing to hold the lower zone and reclaiming the midpoint 0.756445 will cause the pressure to weaken. 📌 LONG/SHORT perspective: **SHORT · STRONG · 84/100**.
208
·
--
$FLOCK This 15m move pulled a bit too fast—up 7.53%, with volume directly surging to 11.66x.
The key isn’t the rise itself; it’s the OI moving up in sync—15m +3.82%, 1h +3.35%. The notional change is all above 500k U. There’s a strong flavor of new leveraged longs entering; it’s not just a spot-fueled pump.
OI is at the 97.8th percentile—ranked #6 across the whole pool, and #16 in notional change. This level is close to historical extreme ranges. Price just closed above the upper edge of the last 20 5m candles. Passive turnover is down 8.6%, buy/sell ratio is 1.19—bids are still pushing.
In the past 24h, turnover is a little over 70M; depth is keeping up as well.
This kind of structure is either fuel for acceleration, or the starting point of a cascade after leverage gets too crowded. Keep an eye on OI: if price stalls while OI is still climbing, that’s the signal.
$FLOCK This 15m move pulled a bit too fast—up 7.53%, with volume directly surging to 11.66x.
The key isn’t the rise itself; it’s the OI moving up in sync—15m +3.82%, 1h +3.35%. The notional change is all above 500k U. There’s a strong flavor of new leveraged longs entering; it’s not just a spot-fueled pump.
OI is at the 97.8th percentile—ranked #6 across the whole pool, and #16 in notional change. This level is close to historical extreme ranges. Price just closed above the upper edge of the last 20 5m candles. Passive turnover is down 8.6%, buy/sell ratio is 1.19—bids are still pushing.
In the past 24h, turnover is a little over 70M; depth is keeping up as well.
This kind of structure is either fuel for acceleration, or the starting point of a cascade after leverage gets too crowded. Keep an eye on OI: if price stalls while OI is still climbing, that’s the signal.
The key isn’t the rise itself; it’s the OI moving up in sync—15m +3.82%, 1h +3.35%. The notional change is all above 500k U. There’s a strong flavor of new leveraged longs entering; it’s not just a spot-fueled pump.
OI is at the 97.8th percentile—ranked #6 across the whole pool, and #16 in notional change. This level is close to historical extreme ranges. Price just closed above the upper edge of the last 20 5m candles. Passive turnover is down 8.6%, buy/sell ratio is 1.19—bids are still pushing.
In the past 24h, turnover is a little over 70M; depth is keeping up as well.
This kind of structure is either fuel for acceleration, or the starting point of a cascade after leverage gets too crowded. Keep an eye on OI: if price stalls while OI is still climbing, that’s the signal.
7

·
--
$XPL This move has some real substance.
In 15m, it directly surged 1.54%, and the volume hit 3.18x, with a Z value of 3.29—this isn’t just random wobbling, it’s a real level of activity. OI in 15m is +0.23%, and in 1h +0.14%. When you add up the notional change—over 1.5 million U—the price is rising while OI is also lifting in sync. That’s the typical leveraged long pressing in, not the kind of “covering” where shorts just unwind and burn out.
More importantly, OI abnormal percentile is 99.6%, for the whole pool #6. What that implies doesn’t need me to spell out: it’s been continuing across multiple consecutive cycles. Active traded volume is 24.8% higher, buy/sell ratio is 1.66, and bids are clearly pushing.
At the close, it already pierced the upper bound of the last ~20 5m Ks. Over 24h, turnover is 24.86M, and the depth confirms it.
So the main question now is just one: is this the rhythm to enter the historical extreme range, or is it the prelude for a higher distribution/top-off? I personally lean toward the former—but with leverage building this fast, have your stop-loss set very clearly.
$XPL This move has some real substance.
In 15m, it directly surged 1.54%, and the volume hit 3.18x, with a Z value of 3.29—this isn’t just random wobbling, it’s a real level of activity. OI in 15m is +0.23%, and in 1h +0.14%. When you add up the notional change—over 1.5 million U—the price is rising while OI is also lifting in sync. That’s the typical leveraged long pressing in, not the kind of “covering” where shorts just unwind and burn out.
More importantly, OI abnormal percentile is 99.6%, for the whole pool #6. What that implies doesn’t need me to spell out: it’s been continuing across multiple consecutive cycles. Active traded volume is 24.8% higher, buy/sell ratio is 1.66, and bids are clearly pushing.
At the close, it already pierced the upper bound of the last ~20 5m Ks. Over 24h, turnover is 24.86M, and the depth confirms it.
So the main question now is just one: is this the rhythm to enter the historical extreme range, or is it the prelude for a higher distribution/top-off? I personally lean toward the former—but with leverage building this fast, have your stop-loss set very clearly.
In 15m, it directly surged 1.54%, and the volume hit 3.18x, with a Z value of 3.29—this isn’t just random wobbling, it’s a real level of activity. OI in 15m is +0.23%, and in 1h +0.14%. When you add up the notional change—over 1.5 million U—the price is rising while OI is also lifting in sync. That’s the typical leveraged long pressing in, not the kind of “covering” where shorts just unwind and burn out.
More importantly, OI abnormal percentile is 99.6%, for the whole pool #6. What that implies doesn’t need me to spell out: it’s been continuing across multiple consecutive cycles. Active traded volume is 24.8% higher, buy/sell ratio is 1.66, and bids are clearly pushing.
At the close, it already pierced the upper bound of the last ~20 5m Ks. Over 24h, turnover is 24.86M, and the depth confirms it.
So the main question now is just one: is this the rhythm to enter the historical extreme range, or is it the prelude for a higher distribution/top-off? I personally lean toward the former—but with leverage building this fast, have your stop-loss set very clearly.
12
·
--
$MORPHO 15m High volume 2.97x, yet the price actually fell 0.83%; the close just broke below the lower edge of the recent ~20-5m range. The buy-sell order ratio is 0.42, and it strongly smells like real money is being used to smash short positions into the market. The OI (open interest) abnormal percentile is 91.7%; in the whole pool #6, but the OI nominal value only moved by -0.79%—a typical sign that it’s not just closing longs, but adding new leveraged short exposure.
With this kind of structure, don’t rush in. Leverage has only just been added, and the sentiment hasn’t finished working itself out. The 24h trading value is only 6.21M; the pool is not deep, so slippage could be bigger than you think. Wait for the direction to be confirmed, or until this wave is swept through, then reassess.
$MORPHO 15m High volume 2.97x, yet the price actually fell 0.83%; the close just broke below the lower edge of the recent ~20-5m range. The buy-sell order ratio is 0.42, and it strongly smells like real money is being used to smash short positions into the market. The OI (open interest) abnormal percentile is 91.7%; in the whole pool #6, but the OI nominal value only moved by -0.79%—a typical sign that it’s not just closing longs, but adding new leveraged short exposure.
With this kind of structure, don’t rush in. Leverage has only just been added, and the sentiment hasn’t finished working itself out. The 24h trading value is only 6.21M; the pool is not deep, so slippage could be bigger than you think. Wait for the direction to be confirmed, or until this wave is swept through, then reassess.
With this kind of structure, don’t rush in. Leverage has only just been added, and the sentiment hasn’t finished working itself out. The 24h trading value is only 6.21M; the pool is not deep, so slippage could be bigger than you think. Wait for the direction to be confirmed, or until this wave is swept through, then reassess.
17
·
--
$SOPH This point has a bit of interest.
In the 15m, it directly topped out at +3.25%. Volume hit 1.99x. The closing price broke above the upper edge of nearly 20 consecutive 5m candles—yet OI is declining: 15m -0.63%, 1h -1.44%. Price is up while positions are down—this is a typical short covering move, not new longs being pushed in.
The aggressive trades are 14% lower, buy/sell ratio 1.32, which indicates this leg is being actively bought and consumed, not passively matched from resting orders. The question is: after the pump, is there someone to take over? If once the covering order flow ends, OI continues to fall, then this is just a one-off pulse—not the start of a trend.
Abnormality #6 across the whole pool, percentile 93.8%, close to its historical extreme zone. At this kind of level, I generally wouldn’t chase during the push. I’d rather wait for a pullback and confirmation—either to avoid missing out or to get a more comfortable entry.
The shorts have just been cleared in a round. Next, I’ll watch whether OI can hold steady. If it can’t, it’s just a rebound; if it can, then there’s a story to follow.
$SOPH This point has a bit of interest.
In the 15m, it directly topped out at +3.25%. Volume hit 1.99x. The closing price broke above the upper edge of nearly 20 consecutive 5m candles—yet OI is declining: 15m -0.63%, 1h -1.44%. Price is up while positions are down—this is a typical short covering move, not new longs being pushed in.
The aggressive trades are 14% lower, buy/sell ratio 1.32, which indicates this leg is being actively bought and consumed, not passively matched from resting orders. The question is: after the pump, is there someone to take over? If once the covering order flow ends, OI continues to fall, then this is just a one-off pulse—not the start of a trend.
Abnormality #6 across the whole pool, percentile 93.8%, close to its historical extreme zone. At this kind of level, I generally wouldn’t chase during the push. I’d rather wait for a pullback and confirmation—either to avoid missing out or to get a more comfortable entry.
The shorts have just been cleared in a round. Next, I’ll watch whether OI can hold steady. If it can’t, it’s just a rebound; if it can, then there’s a story to follow.
In the 15m, it directly topped out at +3.25%. Volume hit 1.99x. The closing price broke above the upper edge of nearly 20 consecutive 5m candles—yet OI is declining: 15m -0.63%, 1h -1.44%. Price is up while positions are down—this is a typical short covering move, not new longs being pushed in.
The aggressive trades are 14% lower, buy/sell ratio 1.32, which indicates this leg is being actively bought and consumed, not passively matched from resting orders. The question is: after the pump, is there someone to take over? If once the covering order flow ends, OI continues to fall, then this is just a one-off pulse—not the start of a trend.
Abnormality #6 across the whole pool, percentile 93.8%, close to its historical extreme zone. At this kind of level, I generally wouldn’t chase during the push. I’d rather wait for a pullback and confirmation—either to avoid missing out or to get a more comfortable entry.
The shorts have just been cleared in a round. Next, I’ll watch whether OI can hold steady. If it can’t, it’s just a rebound; if it can, then there’s a story to follow.
17

·
--
$ASTER There's something here.
In 15m, the pull isn’t that big—0.68%—but the trading volume directly jumped to 2.99x. OI also rises in sync—price up, open interest up—this is a typical long-increasing rally, not a kind of short-covering fake pump. Passive vs active execution gap is 18.2%, buy/sell ratio is 1.45, and the bids are coming with direction.
More importantly, it’s the location. The closing price just broke above the upper edge of the recent ~20 5m range, and price is already nearing its own historical extreme band. The overall pool OI abnormal percentile is 93.5%, with anomaly rank #6 and nominal change rank #7. Funding rate is also in a high percentile in recent days. Put together, this suggests leveraged longs are entering in a concentrated way—not just small-scale trading.
Over the past 24h, turnover is 68.51M, and depth is there—breakout is confirmed with volume. But the high percentile funding rate + approaching historical extremes means that if it can’t push through here, a reversal and squeeze in the other direction can happen very quickly.
My take: this structure is either the final buildup before acceleration, or a late-stage emotional top used for bull-trap / stop-hunt. You can chase, but your stop-loss must be tight—don’t hold it nakedly in a position like this.
$ASTER There's something here.
In 15m, the pull isn’t that big—0.68%—but the trading volume directly jumped to 2.99x. OI also rises in sync—price up, open interest up—this is a typical long-increasing rally, not a kind of short-covering fake pump. Passive vs active execution gap is 18.2%, buy/sell ratio is 1.45, and the bids are coming with direction.
More importantly, it’s the location. The closing price just broke above the upper edge of the recent ~20 5m range, and price is already nearing its own historical extreme band. The overall pool OI abnormal percentile is 93.5%, with anomaly rank #6 and nominal change rank #7. Funding rate is also in a high percentile in recent days. Put together, this suggests leveraged longs are entering in a concentrated way—not just small-scale trading.
Over the past 24h, turnover is 68.51M, and depth is there—breakout is confirmed with volume. But the high percentile funding rate + approaching historical extremes means that if it can’t push through here, a reversal and squeeze in the other direction can happen very quickly.
My take: this structure is either the final buildup before acceleration, or a late-stage emotional top used for bull-trap / stop-hunt. You can chase, but your stop-loss must be tight—don’t hold it nakedly in a position like this.
In 15m, the pull isn’t that big—0.68%—but the trading volume directly jumped to 2.99x. OI also rises in sync—price up, open interest up—this is a typical long-increasing rally, not a kind of short-covering fake pump. Passive vs active execution gap is 18.2%, buy/sell ratio is 1.45, and the bids are coming with direction.
More importantly, it’s the location. The closing price just broke above the upper edge of the recent ~20 5m range, and price is already nearing its own historical extreme band. The overall pool OI abnormal percentile is 93.5%, with anomaly rank #6 and nominal change rank #7. Funding rate is also in a high percentile in recent days. Put together, this suggests leveraged longs are entering in a concentrated way—not just small-scale trading.
Over the past 24h, turnover is 68.51M, and depth is there—breakout is confirmed with volume. But the high percentile funding rate + approaching historical extremes means that if it can’t push through here, a reversal and squeeze in the other direction can happen very quickly.
My take: this structure is either the final buildup before acceleration, or a late-stage emotional top used for bull-trap / stop-hunt. You can chase, but your stop-loss must be tight—don’t hold it nakedly in a position like this.
21
·
--
$MET This drop is quite straightforward. On the 15m chart it’s down -4.13%, and the volume has pulled up to 2.01x. Even at the close, price has fallen below the lower bound of the last 20 5m candles.
What’s even more interesting is the OI: 15m is -3.58% and 1h is -2.91%, and the nominal changes track closely as well. Price is dropping while OI is falling—this combination looks more like longs are deleveraging, stopping out, or reducing positions, rather than new shorts aggressively smashing the market. Passive-to-active trades:主动成交差 -21.7%, buy/sell ratio 0.64. Sell pressure does seem to be somewhat more active, but the abnormal percentile for OI has already climbed to 96.6%—the abnormal whole-pool rank is #6, nominal change rank is #9. Across several consecutive periods it’s been continuing. At this level, it looks more like cleaning up leverage, not just a simple emotional breakdown.
In the last 24h, trading value is 136M, and the depth is there. First, watch when this deleveraging wave stops—don’t rush to catch the falling knife.
$MET This drop is quite straightforward. On the 15m chart it’s down -4.13%, and the volume has pulled up to 2.01x. Even at the close, price has fallen below the lower bound of the last 20 5m candles.
What’s even more interesting is the OI: 15m is -3.58% and 1h is -2.91%, and the nominal changes track closely as well. Price is dropping while OI is falling—this combination looks more like longs are deleveraging, stopping out, or reducing positions, rather than new shorts aggressively smashing the market. Passive-to-active trades:主动成交差 -21.7%, buy/sell ratio 0.64. Sell pressure does seem to be somewhat more active, but the abnormal percentile for OI has already climbed to 96.6%—the abnormal whole-pool rank is #6, nominal change rank is #9. Across several consecutive periods it’s been continuing. At this level, it looks more like cleaning up leverage, not just a simple emotional breakdown.
In the last 24h, trading value is 136M, and the depth is there. First, watch when this deleveraging wave stops—don’t rush to catch the falling knife.
What’s even more interesting is the OI: 15m is -3.58% and 1h is -2.91%, and the nominal changes track closely as well. Price is dropping while OI is falling—this combination looks more like longs are deleveraging, stopping out, or reducing positions, rather than new shorts aggressively smashing the market. Passive-to-active trades:主动成交差 -21.7%, buy/sell ratio 0.64. Sell pressure does seem to be somewhat more active, but the abnormal percentile for OI has already climbed to 96.6%—the abnormal whole-pool rank is #6, nominal change rank is #9. Across several consecutive periods it’s been continuing. At this level, it looks more like cleaning up leverage, not just a simple emotional breakdown.
In the last 24h, trading value is 136M, and the depth is there. First, watch when this deleveraging wave stops—don’t rush to catch the falling knife.
2
·
--
$ASTER This move has something to it.
On the 15m timeframe, it broke above the upper edge of the recent 5m range of nearly 20 candles. Volume surged to 2.25x directly; the buy/sell ratio is 3.91. The aggressive trade difference is -59.2%, and the longs are extremely resolute.
The key is OI: 15m +0.24%, 1h +0.29%. The percentile is abnormal at 92.5%. In the whole pool, abnormal #4 and nominal change #6. It’s continued across multiple consecutive cycles. This isn’t just an emotion-driven pump—it’s new leveraged longs entering the market.
Funding rate has also reached a high percentile recently. 24h trading volume is 81M, and the depth has been confirmed.
Structurally, price and OI are moving together, which is much healthier than a fake breakout caused by short covering. Now it’s all about whether it can hold steady at the boundary of this range. If it holds, upside room opens; if it doesn’t, it’s just a wave of bull-trap-style luring.
Watch first—don’t rush to chase the top.
$ASTER This move has something to it.
On the 15m timeframe, it broke above the upper edge of the recent 5m range of nearly 20 candles. Volume surged to 2.25x directly; the buy/sell ratio is 3.91. The aggressive trade difference is -59.2%, and the longs are extremely resolute.
The key is OI: 15m +0.24%, 1h +0.29%. The percentile is abnormal at 92.5%. In the whole pool, abnormal #4 and nominal change #6. It’s continued across multiple consecutive cycles. This isn’t just an emotion-driven pump—it’s new leveraged longs entering the market.
Funding rate has also reached a high percentile recently. 24h trading volume is 81M, and the depth has been confirmed.
Structurally, price and OI are moving together, which is much healthier than a fake breakout caused by short covering. Now it’s all about whether it can hold steady at the boundary of this range. If it holds, upside room opens; if it doesn’t, it’s just a wave of bull-trap-style luring.
Watch first—don’t rush to chase the top.
On the 15m timeframe, it broke above the upper edge of the recent 5m range of nearly 20 candles. Volume surged to 2.25x directly; the buy/sell ratio is 3.91. The aggressive trade difference is -59.2%, and the longs are extremely resolute.
The key is OI: 15m +0.24%, 1h +0.29%. The percentile is abnormal at 92.5%. In the whole pool, abnormal #4 and nominal change #6. It’s continued across multiple consecutive cycles. This isn’t just an emotion-driven pump—it’s new leveraged longs entering the market.
Funding rate has also reached a high percentile recently. 24h trading volume is 81M, and the depth has been confirmed.
Structurally, price and OI are moving together, which is much healthier than a fake breakout caused by short covering. Now it’s all about whether it can hold steady at the boundary of this range. If it holds, upside room opens; if it doesn’t, it’s just a wave of bull-trap-style luring.
Watch first—don’t rush to chase the top.
17
·
--
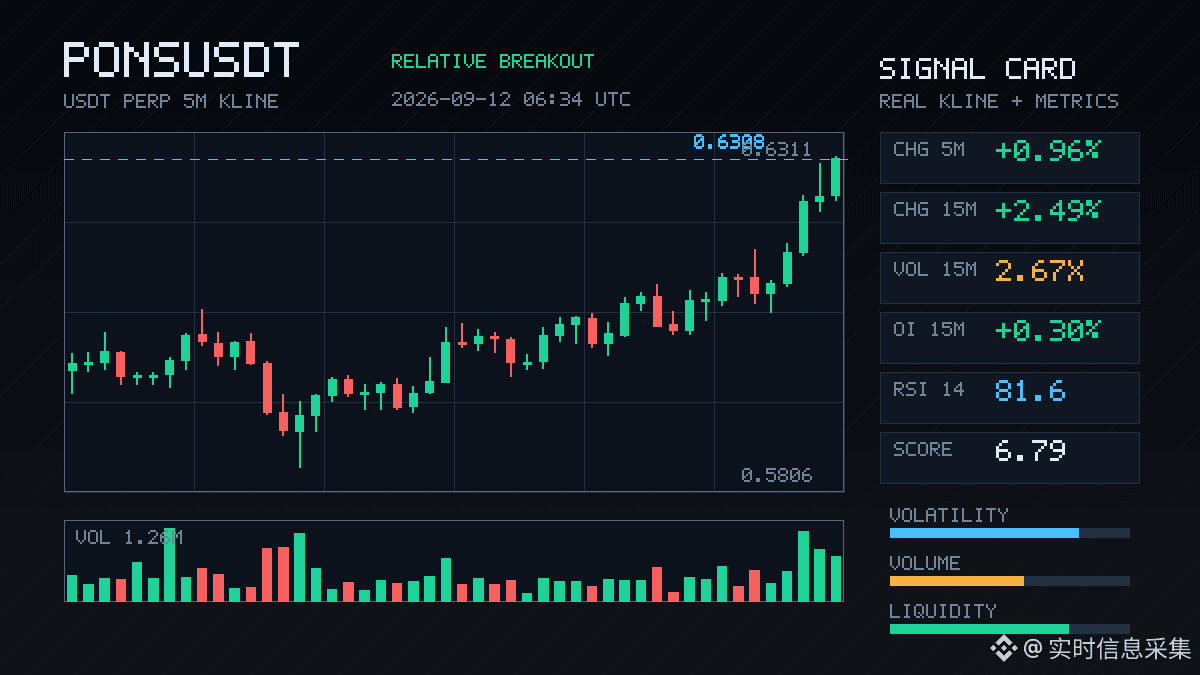
$PONS This move has something.
15m up 2.49% isn’t outrageous, but the volume directly jumped to 2.67x, with a Z value of 3.14. OI is rising in sync too—1h contracts are +0.53%, and notional value increased by 1.41M. Price is up and OI is up: this is new long positions entering, not a fakeout driven by short covering.
The entire pool’s anomalies are ranked #6, with notional changes at #4. Multiple consecutive periods are continuing, at the 88.3rd percentile of abnormality. The key point is that it broke out by stepping above the upper edge of the recent ~20 five-minute ranges—active traded volume is up 12.4%, buy/sell ratio is 1.28, and the bias is clearly bullish.
24h trading value is 168M—liquidity looks sufficient.
For this kind of structure, I usually watch for a pullback and confirmation. Chasing higher prices doesn’t make sense. But if the volume holds and the top edge of the range turns into support, there may be room to run later.
Not calling trades—just recording what I’m seeing on the chart. $PONS
$PONS This move has something.
15m up 2.49% isn’t outrageous, but the volume directly jumped to 2.67x, with a Z value of 3.14. OI is rising in sync too—1h contracts are +0.53%, and notional value increased by 1.41M. Price is up and OI is up: this is new long positions entering, not a fakeout driven by short covering.
The entire pool’s anomalies are ranked #6, with notional changes at #4. Multiple consecutive periods are continuing, at the 88.3rd percentile of abnormality. The key point is that it broke out by stepping above the upper edge of the recent ~20 five-minute ranges—active traded volume is up 12.4%, buy/sell ratio is 1.28, and the bias is clearly bullish.
24h trading value is 168M—liquidity looks sufficient.
For this kind of structure, I usually watch for a pullback and confirmation. Chasing higher prices doesn’t make sense. But if the volume holds and the top edge of the range turns into support, there may be room to run later.
Not calling trades—just recording what I’m seeing on the chart. $PONS
15m up 2.49% isn’t outrageous, but the volume directly jumped to 2.67x, with a Z value of 3.14. OI is rising in sync too—1h contracts are +0.53%, and notional value increased by 1.41M. Price is up and OI is up: this is new long positions entering, not a fakeout driven by short covering.
The entire pool’s anomalies are ranked #6, with notional changes at #4. Multiple consecutive periods are continuing, at the 88.3rd percentile of abnormality. The key point is that it broke out by stepping above the upper edge of the recent ~20 five-minute ranges—active traded volume is up 12.4%, buy/sell ratio is 1.28, and the bias is clearly bullish.
24h trading value is 168M—liquidity looks sufficient.
For this kind of structure, I usually watch for a pullback and confirmation. Chasing higher prices doesn’t make sense. But if the volume holds and the top edge of the range turns into support, there may be room to run later.
Not calling trades—just recording what I’m seeing on the chart. $PONS
19
·
--
$Bull came in—this wave is kind of interesting.
In the 15m window it surged +5.45%, with volume jumping straight to 4.69x of normal. Buy/sell ratio is 1.19. Active trade spread is +8.8%, and the order book shows real people are sweeping.
The key is OI: 15m +1.51%, 1h +2.98%. Nominal change over 1h did 5.39M U (+14.6%). Price is up and OI is also up—classic signs of new longs entering, not shorts covering to inflate the move. Plus, it’s at the 92.9th percentile. In the anomaly ranking of the whole pool, it’s #6, nominal change is #3. This has kept going through multiple consecutive cycles without breaking, and volume has stayed above normal all along.
In the last 24h, turnover is 644M. The pool is deep—this isn’t just small talk or small trading.
Near the new highs, building leverage longs feels comfortable, but it’s still a double-edged sword. The faster OI stacks, the more painful the squeeze will be later. You can chase, but don’t skimp on your stop-loss.
#Bull came in
$Bull came in—this wave is kind of interesting.
In the 15m window it surged +5.45%, with volume jumping straight to 4.69x of normal. Buy/sell ratio is 1.19. Active trade spread is +8.8%, and the order book shows real people are sweeping.
The key is OI: 15m +1.51%, 1h +2.98%. Nominal change over 1h did 5.39M U (+14.6%). Price is up and OI is also up—classic signs of new longs entering, not shorts covering to inflate the move. Plus, it’s at the 92.9th percentile. In the anomaly ranking of the whole pool, it’s #6, nominal change is #3. This has kept going through multiple consecutive cycles without breaking, and volume has stayed above normal all along.
In the last 24h, turnover is 644M. The pool is deep—this isn’t just small talk or small trading.
Near the new highs, building leverage longs feels comfortable, but it’s still a double-edged sword. The faster OI stacks, the more painful the squeeze will be later. You can chase, but don’t skimp on your stop-loss.
#Bull came in
In the 15m window it surged +5.45%, with volume jumping straight to 4.69x of normal. Buy/sell ratio is 1.19. Active trade spread is +8.8%, and the order book shows real people are sweeping.
The key is OI: 15m +1.51%, 1h +2.98%. Nominal change over 1h did 5.39M U (+14.6%). Price is up and OI is also up—classic signs of new longs entering, not shorts covering to inflate the move. Plus, it’s at the 92.9th percentile. In the anomaly ranking of the whole pool, it’s #6, nominal change is #3. This has kept going through multiple consecutive cycles without breaking, and volume has stayed above normal all along.
In the last 24h, turnover is 644M. The pool is deep—this isn’t just small talk or small trading.
Near the new highs, building leverage longs feels comfortable, but it’s still a double-edged sword. The faster OI stacks, the more painful the squeeze will be later. You can chase, but don’t skimp on your stop-loss.
#Bull came in
138
Log in to explore more content
Join global crypto users on Binance Square
⚡️ Get latest and useful information about crypto.
💬 Trusted by the world’s largest crypto exchange.
👍 Discover real insights from verified creators.
Email / Phone number
Trending Topics
1
#BitcoinReboundsTo$79K
8,736 views
91 Discussing
2
#GrayscalePutsXRPAt26.11%InAdvisorPortfolio
234 views
37 Discussing
3
#PhiladelphiaSemiconductorIndexFalls5.9%
399 views
28 Discussing
4
#SECChairUrgesCongressToAdvanceClarityAct
513 views
28 Discussing
5
#FedHikeOddsRiseTo89%
74,032 views
1,013 Discussing
6
#RLUSDSupplyHitsRecord$2.442B
5,187 views
61 Discussing
7
#AvalancheIntegratesIntoUAEPassDigitalVault
71,357 views
983 Discussing
8
#UKSeeksViewsOnTokenizingGold
58,266 views
748 Discussing
9
#AnthropicCEOCallsForAISlowdown
231,975 views
3,269 Discussing
10
#RevolutDataLeakReportedlyPostedAttackersThreatenDailyReleases
4,330 views
87 Discussing