

#ethereum
ethereum
104M views
258,807 Discussing
Hot
Latest

·
--
Bearish
Ethereum Near Resistance — Is Another 5% Drop Coming?
⠀
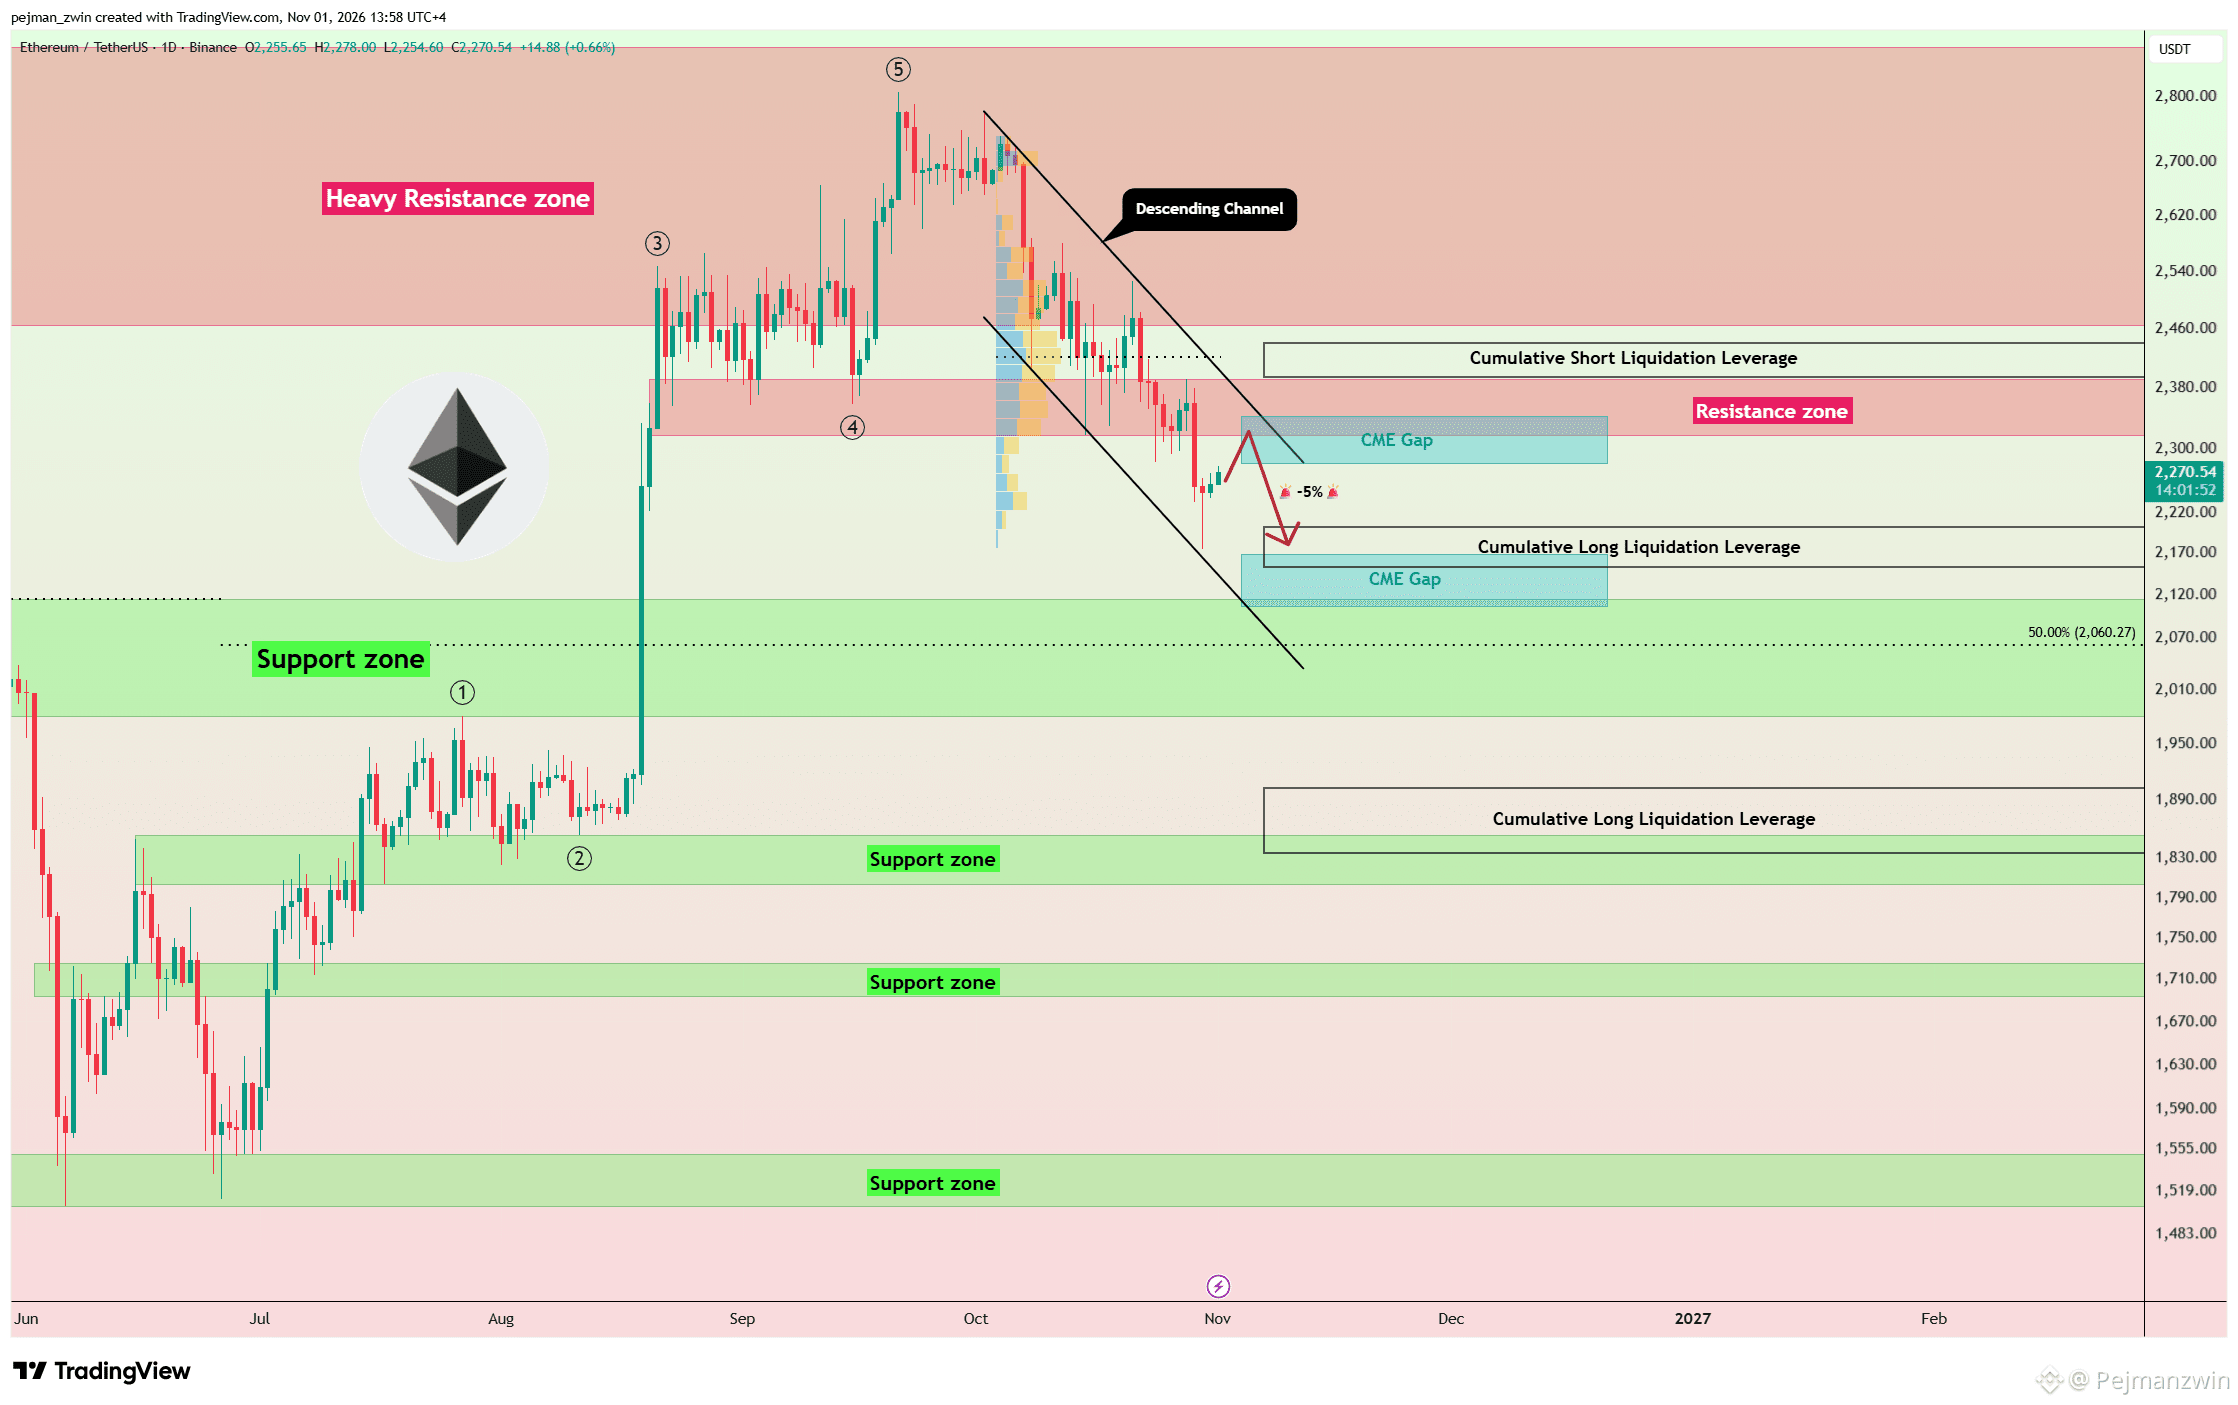
Ethereum remains in a corrective phase and has been moving inside a Descending Channel for nearly a month.
⠀
Now $ETH is approaching the Resistance Zone ($2,318-$2,392), the upper trendline of the channel, and the upper CME Gap ($2,293-$2,342.5).
⠀
For me, this is where the next important reaction could begin.
⠀
From an Elliott Wave perspective, Ethereum appears to have completed a five-wave impulsive structure, suggesting another impulsive move may be developing.
⠀
My main scenario is still bearish.
⠀
After approaching resistance and potentially filling the upper CME Gap, I expect renewed selling pressure and at least a 5% correction.
⠀
The first downside area is the Cumulative Long Liquidation Leverage ($2,153-$2,202), followed by the lower CME Gap ($2,106.5-$2,169) and the key $2,118 trading level.
⠀
However, $2,422 is my key invalidation level.
⠀
Break and hold above $2,422 → Bullish momentum strengthens
⠀
Reject resistance → 5%+ correction remains my main scenario
⠀
What comes next?
⠀
🟢 Break above $2,422
🔴 Correction toward ($2,153-$2,202)
⠀
#Ethereum
Ethereum Near Resistance — Is Another 5% Drop Coming?
⠀
Ethereum remains in a corrective phase and has been moving inside a Descending Channel for nearly a month.
⠀
Now $ETH is approaching the Resistance Zone ($2,318-$2,392), the upper trendline of the channel, and the upper CME Gap ($2,293-$2,342.5).
⠀
For me, this is where the next important reaction could begin.
⠀
From an Elliott Wave perspective, Ethereum appears to have completed a five-wave impulsive structure, suggesting another impulsive move may be developing.
⠀
My main scenario is still bearish.
⠀
After approaching resistance and potentially filling the upper CME Gap, I expect renewed selling pressure and at least a 5% correction.
⠀
The first downside area is the Cumulative Long Liquidation Leverage ($2,153-$2,202), followed by the lower CME Gap ($2,106.5-$2,169) and the key $2,118 trading level.
⠀
However, $2,422 is my key invalidation level.
⠀
Break and hold above $2,422 → Bullish momentum strengthens
⠀
Reject resistance → 5%+ correction remains my main scenario
⠀
What comes next?
⠀
🟢 Break above $2,422
🔴 Correction toward ($2,153-$2,202)
⠀
#Ethereum
⠀
Ethereum remains in a corrective phase and has been moving inside a Descending Channel for nearly a month.
⠀
Now $ETH is approaching the Resistance Zone ($2,318-$2,392), the upper trendline of the channel, and the upper CME Gap ($2,293-$2,342.5).
⠀
For me, this is where the next important reaction could begin.
⠀
From an Elliott Wave perspective, Ethereum appears to have completed a five-wave impulsive structure, suggesting another impulsive move may be developing.
⠀
My main scenario is still bearish.
⠀
After approaching resistance and potentially filling the upper CME Gap, I expect renewed selling pressure and at least a 5% correction.
⠀
The first downside area is the Cumulative Long Liquidation Leverage ($2,153-$2,202), followed by the lower CME Gap ($2,106.5-$2,169) and the key $2,118 trading level.
⠀
However, $2,422 is my key invalidation level.
⠀
Break and hold above $2,422 → Bullish momentum strengthens
⠀
Reject resistance → 5%+ correction remains my main scenario
⠀
What comes next?
⠀
🟢 Break above $2,422
🔴 Correction toward ($2,153-$2,202)
⠀
#Ethereum
DopamineGLOBAL:
cme gap fill near 2318-2342 then rejection, that is the setup i watch too
2
3
2.1k

·
--
Bullish
Honestly, $BTC and $ETH are currently trading near bottom price levels. It feels like the market is preparing for a major bullish move, with limited downside remaining.
If Bitcoin turns bullish, the entire crypto market could get a massive boost. 🚀
Following the Binance hot wallet hack, the market has started gradually heating up again. A strong upward move could be coming.
$ZEC is following the trend. Keep your eyes on the market! 👀
#BossSignal #CryptoMarket #Bitcoin #Ethereum
Honestly, $BTC and $ETH are currently trading near bottom price levels. It feels like the market is preparing for a major bullish move, with limited downside remaining.
If Bitcoin turns bullish, the entire crypto market could get a massive boost. 🚀
Following the Binance hot wallet hack, the market has started gradually heating up again. A strong upward move could be coming.
$ZEC is following the trend. Keep your eyes on the market! 👀
#BossSignal #CryptoMarket #Bitcoin #Ethereum
If Bitcoin turns bullish, the entire crypto market could get a massive boost. 🚀
Following the Binance hot wallet hack, the market has started gradually heating up again. A strong upward move could be coming.
$ZEC is following the trend. Keep your eyes on the market! 👀
#BossSignal #CryptoMarket #Bitcoin #Ethereum
65

$ETH Coin Price Prediction 🚀🔥⚡☠️💥
Ethereum Historical
According to the latest data gathered, the current price of Ethereum is $2,219 and ETH is presently ranked No. 2 in the entire crypto ecosystem. The circulation supply of Ethereum is 120,694,000 ETH, with a market cap of $353,631,000,000.00.
The coin is in a dip right now, so it can be a good buying opportunity for quick investment.
Price Prediction 2026
After the analysis of the prices of in previous years, it is assumed that in 2026, the minimum price of will be around $2267.08 The maximum expected ETH price may be around $5,201.47. On average, the trading price might be $4,689.66 in 2026.
Price Prediction 2027
Based on the technical analysis by cryptocurrency experts regarding the prices of , in 2027, ETH is expected to have the following minimum and maximum prices: about $6,069.92 and $7,707.30, respectively. The average expected trading cost is $6,304.40.
Price Prediction 2028
The experts in the field of cryptocurrency have analyzed the prices of and their fluctuations during the previous years. It is assumed that in 2028, the minimum ETH price might drop to $9,363.55, while its maximum can reach $10,579. On average, the trading cost will be around $9,615.73.
Price Prediction 2029
Based on the analysis of the costs of by crypto experts, the following maximum and minimum ETH prices are expected in 2029: $16,086 and $13,627. On average, it will be traded at $14,108.
Stay tuned for more updates ❤
#Ethereum
$ETH Coin Price Prediction 🚀🔥⚡☠️💥
Ethereum Historical
According to the latest data gathered, the current price of Ethereum is $2,219 and ETH is presently ranked No. 2 in the entire crypto ecosystem. The circulation supply of Ethereum is 120,694,000 ETH, with a market cap of $353,631,000,000.00.
The coin is in a dip right now, so it can be a good buying opportunity for quick investment.
Price Prediction 2026
After the analysis of the prices of in previous years, it is assumed that in 2026, the minimum price of will be around $2267.08 The maximum expected ETH price may be around $5,201.47. On average, the trading price might be $4,689.66 in 2026.
Price Prediction 2027
Based on the technical analysis by cryptocurrency experts regarding the prices of , in 2027, ETH is expected to have the following minimum and maximum prices: about $6,069.92 and $7,707.30, respectively. The average expected trading cost is $6,304.40.
Price Prediction 2028
The experts in the field of cryptocurrency have analyzed the prices of and their fluctuations during the previous years. It is assumed that in 2028, the minimum ETH price might drop to $9,363.55, while its maximum can reach $10,579. On average, the trading cost will be around $9,615.73.
Price Prediction 2029
Based on the analysis of the costs of by crypto experts, the following maximum and minimum ETH prices are expected in 2029: $16,086 and $13,627. On average, it will be traded at $14,108.
Stay tuned for more updates ❤
#Ethereum
Ethereum Historical
According to the latest data gathered, the current price of Ethereum is $2,219 and ETH is presently ranked No. 2 in the entire crypto ecosystem. The circulation supply of Ethereum is 120,694,000 ETH, with a market cap of $353,631,000,000.00.
The coin is in a dip right now, so it can be a good buying opportunity for quick investment.
Price Prediction 2026
After the analysis of the prices of in previous years, it is assumed that in 2026, the minimum price of will be around $2267.08 The maximum expected ETH price may be around $5,201.47. On average, the trading price might be $4,689.66 in 2026.
Price Prediction 2027
Based on the technical analysis by cryptocurrency experts regarding the prices of , in 2027, ETH is expected to have the following minimum and maximum prices: about $6,069.92 and $7,707.30, respectively. The average expected trading cost is $6,304.40.
Price Prediction 2028
The experts in the field of cryptocurrency have analyzed the prices of and their fluctuations during the previous years. It is assumed that in 2028, the minimum ETH price might drop to $9,363.55, while its maximum can reach $10,579. On average, the trading cost will be around $9,615.73.
Price Prediction 2029
Based on the analysis of the costs of by crypto experts, the following maximum and minimum ETH prices are expected in 2029: $16,086 and $13,627. On average, it will be traded at $14,108.
Stay tuned for more updates ❤
#Ethereum

2
195



🚀 ETH Market Update | Bulls vs Bears 🐂🐻
🔥 Ethereum is showing an interesting battle between Long and Short traders!
📊 Smart Traders Overview:
🔹 ETH Price: 2,251.90 USDT
🔹 Total Traders: 2,493
🔹 Long Traders: 877
🔹 Short Traders: 1,616
🔹 Long Positions: 425.35M USDT
🔹 Short Positions: 1.52B USDT
🐻 Short traders are currently dominating the market.
But remember, crypto markets can change direction at any moment!
💡 Trade smart. Manage your risk. Always DYOR.
🔥 What's your prediction?
Will ETH break above $2,300 or drop lower?
👇 Share your thoughts in the comments!
#Ethereum #Binance #CryptoTrading #BinanceSquare $ETH
🚀 ETH Market Update | Bulls vs Bears 🐂🐻
🔥 Ethereum is showing an interesting battle between Long and Short traders!
📊 Smart Traders Overview:
🔹 ETH Price: 2,251.90 USDT
🔹 Total Traders: 2,493
🔹 Long Traders: 877
🔹 Short Traders: 1,616
🔹 Long Positions: 425.35M USDT
🔹 Short Positions: 1.52B USDT
🐻 Short traders are currently dominating the market.
But remember, crypto markets can change direction at any moment!
💡 Trade smart. Manage your risk. Always DYOR.
🔥 What's your prediction?
Will ETH break above $2,300 or drop lower?
👇 Share your thoughts in the comments!
#Ethereum #Binance #CryptoTrading #BinanceSquare $ETH
🔥 Ethereum is showing an interesting battle between Long and Short traders!
📊 Smart Traders Overview:
🔹 ETH Price: 2,251.90 USDT
🔹 Total Traders: 2,493
🔹 Long Traders: 877
🔹 Short Traders: 1,616
🔹 Long Positions: 425.35M USDT
🔹 Short Positions: 1.52B USDT
🐻 Short traders are currently dominating the market.
But remember, crypto markets can change direction at any moment!
💡 Trade smart. Manage your risk. Always DYOR.
🔥 What's your prediction?
Will ETH break above $2,300 or drop lower?
👇 Share your thoughts in the comments!
#Ethereum #Binance #CryptoTrading #BinanceSquare $ETH

210


·
--
Bullish
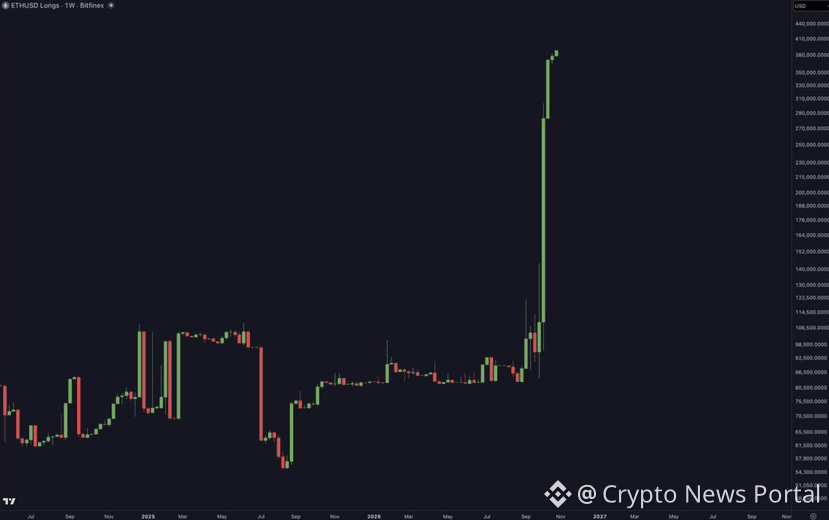
LONG positions on Ethereum are on the rise. Large investors are opening bullish positions on $ETH . A rally in Ethereum will likely trigger a broader uptrend across the altcoin market and $LUNC could well be at the forefront of this movement...
#Ethereum #Altcoins #Crypto #TerraClassic
{spot}(LUNCUSDT)
{future}(ETHUSDT)
LONG positions on Ethereum are on the rise. Large investors are opening bullish positions on $ETH . A rally in Ethereum will likely trigger a broader uptrend across the altcoin market and $LUNC could well be at the forefront of this movement...
#Ethereum #Altcoins #Crypto #TerraClassic
#Ethereum #Altcoins #Crypto #TerraClassic
3
725

·
--
Bearish
$ETH KEEP SHORTING
Overall structure remains bearish as long as the price trades below 2335 resistance
Recent price action shows a struggle to maintain upward momentum. This creates a localized range where current levels at 2265 offer poor risk-to-reward. We should wait for the price to sweep liquidity at the extremes of this range before entering Short
$ETH SHORT SETUP
· Entry Short: 2285 - 2300 (anticipating a fakeout or rejection at this resistance)
· SL: above 2335
· TP: 2220, 2180
Support me just Trade here👇$ETH
{future}(ETHUSDT)
#eth #Ethereum
$ETH KEEP SHORTING
Overall structure remains bearish as long as the price trades below 2335 resistance
Recent price action shows a struggle to maintain upward momentum. This creates a localized range where current levels at 2265 offer poor risk-to-reward. We should wait for the price to sweep liquidity at the extremes of this range before entering Short
$ETH SHORT SETUP
· Entry Short: 2285 - 2300 (anticipating a fakeout or rejection at this resistance)
· SL: above 2335
· TP: 2220, 2180
Support me just Trade here👇$ETH
#eth #Ethereum
Overall structure remains bearish as long as the price trades below 2335 resistance
Recent price action shows a struggle to maintain upward momentum. This creates a localized range where current levels at 2265 offer poor risk-to-reward. We should wait for the price to sweep liquidity at the extremes of this range before entering Short
$ETH SHORT SETUP
· Entry Short: 2285 - 2300 (anticipating a fakeout or rejection at this resistance)
· SL: above 2335
· TP: 2220, 2180
Support me just Trade here👇$ETH
#eth #Ethereum
WangLin_抄底
·
--
Bearish$ETH SHORT OPPORTUNITY
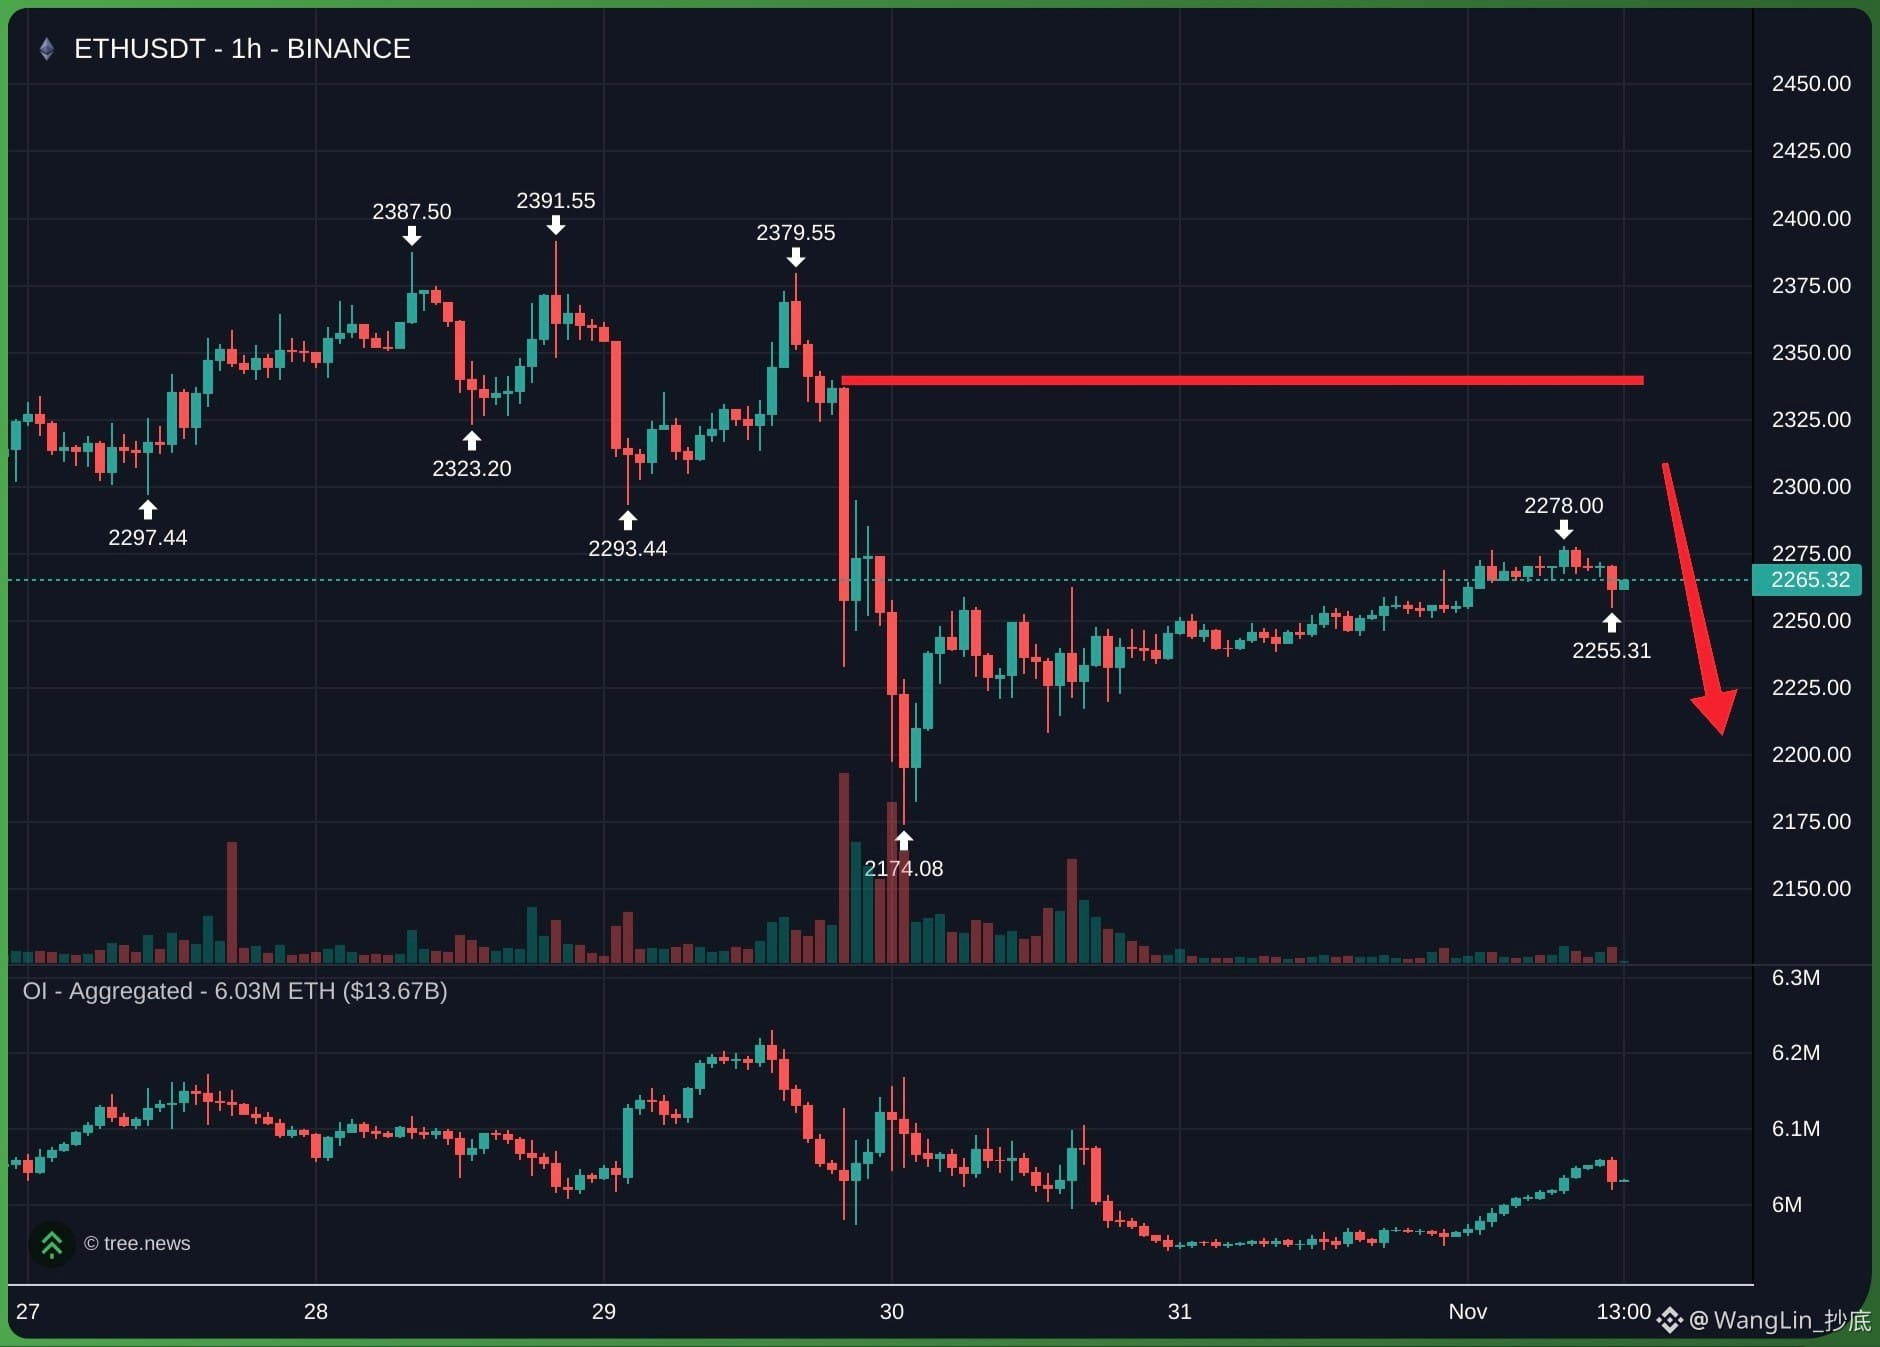
Overall structure remains bearish as long as price fails to reclaim 2320 - 2350 resistance wall
Charts showing clear series of higher lows forming a local ascending channel, which is typical for a bearish continuation pattern (bear flag).
Open Interest is relatively flat, indicating that aggressive buyers are not stepping in heavily, and the bounce is likely driven by short-term profit-taking rather than a trend reversal.
$ETH SHORT SETUP
· Entry Short 2270 - 2300
· Stop Loss: above 2340
· Take Profit: 2220 - 2180
Support me just Trade here👇$ETH
#eth #Ethereum
Overall structure remains bearish as long as price fails to reclaim 2320 - 2350 resistance wall
Charts showing clear series of higher lows forming a local ascending channel, which is typical for a bearish continuation pattern (bear flag).
Open Interest is relatively flat, indicating that aggressive buyers are not stepping in heavily, and the bounce is likely driven by short-term profit-taking rather than a trend reversal.
$ETH SHORT SETUP
· Entry Short 2270 - 2300
· Stop Loss: above 2340
· Take Profit: 2220 - 2180
Support me just Trade here👇$ETH
#eth #Ethereum
192


Article
🐋 WHAT ARE CRYPTO WHALES BUYING RIGHT NOW?
The Smart Money Moves That Every Crypto Trader Should W🐋 WHAT ARE CRYPTO WHALES BUYING RIGHT NOW?
The Smart Money Moves That Every Crypto Trader Should Watch!
Crypto whales are making significant moves in the market, but are they accumulating or preparing for a major correction?
According to November 1 market-tracking data, BTC, ETH and Hype hold some of the largest tracked whale positions, with approximately $1.22B, $856M and $500M respectively.
However, there's an interesting twist: tracked whale futures positions currently show stronger short exposure in BTC, ETH and HYPE than long exposure.
🔍 What Should We Watch?
Bitcoin ($BTC ): Largest tracked whale exposure, but short positions currently dominate.
Ethereum ($ETH ): Significant institutional-sized activity with mixed buying and selling.
$HYPE : Large whale exposure, but bearish futures positioning deserves attention.
ZEC: Showing particularly strong short positioning.
📊 My Market Observation
Whale activity can provide valuable clues about market sentiment, but large transactions don't automatically mean accumulation.
Traders should monitor exchange inflows, outflows, spot buying volume, open interest and liquidation levels before making decisions.
🚨 Final Thought
The biggest opportunity isn't blindly following whales. It's understanding WHY they're moving their money.
Are whales preparing for the next rally, or protecting themselves from a potential market correction?
What's your opinion? 🐋👇
#Crypto #Bitcoin #Ethereum #WhaleActivity #Binance
🐋 WHAT ARE CRYPTO WHALES BUYING RIGHT NOW? The Smart Money Moves That Every Crypto Trader Should W
🐋 WHAT ARE CRYPTO WHALES BUYING RIGHT NOW?
The Smart Money Moves That Every Crypto Trader Should Watch!
Crypto whales are making significant moves in the market, but are they accumulating or preparing for a major correction?
According to November 1 market-tracking data, BTC, ETH and Hype hold some of the largest tracked whale positions, with approximately $1.22B, $856M and $500M respectively.
However, there's an interesting twist: tracked whale futures positions currently show stronger short exposure in BTC, ETH and HYPE than long exposure.
🔍 What Should We Watch?
Bitcoin ($BTC ): Largest tracked whale exposure, but short positions currently dominate.
Ethereum ($ETH ): Significant institutional-sized activity with mixed buying and selling.
$HYPE : Large whale exposure, but bearish futures positioning deserves attention.
ZEC: Showing particularly strong short positioning.
📊 My Market Observation
Whale activity can provide valuable clues about market sentiment, but large transactions don't automatically mean accumulation.
Traders should monitor exchange inflows, outflows, spot buying volume, open interest and liquidation levels before making decisions.
🚨 Final Thought
The biggest opportunity isn't blindly following whales. It's understanding WHY they're moving their money.
Are whales preparing for the next rally, or protecting themselves from a potential market correction?
What's your opinion? 🐋👇
#Crypto #Bitcoin #Ethereum #WhaleActivity #Binance
The Smart Money Moves That Every Crypto Trader Should Watch!
Crypto whales are making significant moves in the market, but are they accumulating or preparing for a major correction?
According to November 1 market-tracking data, BTC, ETH and Hype hold some of the largest tracked whale positions, with approximately $1.22B, $856M and $500M respectively.
However, there's an interesting twist: tracked whale futures positions currently show stronger short exposure in BTC, ETH and HYPE than long exposure.
🔍 What Should We Watch?
Bitcoin ($BTC ): Largest tracked whale exposure, but short positions currently dominate.
Ethereum ($ETH ): Significant institutional-sized activity with mixed buying and selling.
$HYPE : Large whale exposure, but bearish futures positioning deserves attention.
ZEC: Showing particularly strong short positioning.
📊 My Market Observation
Whale activity can provide valuable clues about market sentiment, but large transactions don't automatically mean accumulation.
Traders should monitor exchange inflows, outflows, spot buying volume, open interest and liquidation levels before making decisions.
🚨 Final Thought
The biggest opportunity isn't blindly following whales. It's understanding WHY they're moving their money.
Are whales preparing for the next rally, or protecting themselves from a potential market correction?
What's your opinion? 🐋👇
#Crypto #Bitcoin #Ethereum #WhaleActivity #Binance
142

·
--
Bullish
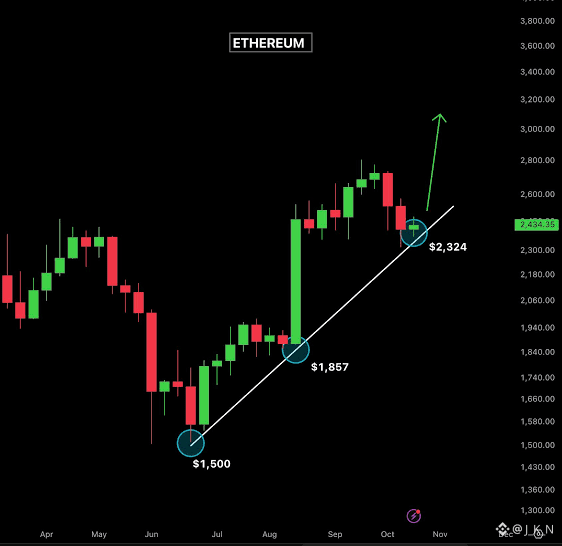
$ETH Technical Analysis: Crucial Candle Patterns & Key Zones to Watch!
Ethereum's price structure is catching massive attention as the daily chart reveals intense battlefield positioning between buyers and sellers. Following a clean retest of macro trend support lines, the asset is pressuring immediate structural barriers.
Here is a breakdown of the active technical signals:
🧩 The Candlestick Breakdown
• Rejection Candles: A recent daily shooting star pattern at local highs signals heavy selling pressure near overhead resistance.
• Demand Validation: Long lower-wick candles (hammer-like structures) are forming near support, indicating aggressive buyer absorption in lower demand blocks.
📉 Key Structural Levels
• Overhead Resistance: The immediate zone remains heavily guarded. A decisive close above this level clears the path toward a major macro range extension.
• Critical Support Block: If a broader market pullback occurs, buyers are heavily waiting around the key moving average floors. Losing this zone opens up a liquidity sweep downward.
⚡ Momentum & Indicators
• Moving Averages (EMA): Price action is actively fighting the short-term 9 and 21 Exponential Moving Averages (EMAs). A sustained breakout above them flips momentum purely bullish.
• Volume Profile: On-chain accumulation volume expands on down-days, showing institutional backing beneath the surface volatility.
💡 The Verdict: Wait for the daily candle to close above the current EMA compression before executing any breakout trades. Patience is key while liquidity gets squeezed.
💬 Are you bullish or bearish on $ETH at these levels? Drop your charts below! 👇
#Ethereum #Ethereum #technicalanalyst #cryptotrade #candlestick_patterns
$ETH Technical Analysis: Crucial Candle Patterns & Key Zones to Watch!
Ethereum's price structure is catching massive attention as the daily chart reveals intense battlefield positioning between buyers and sellers. Following a clean retest of macro trend support lines, the asset is pressuring immediate structural barriers.
Here is a breakdown of the active technical signals:
🧩 The Candlestick Breakdown
• Rejection Candles: A recent daily shooting star pattern at local highs signals heavy selling pressure near overhead resistance.
• Demand Validation: Long lower-wick candles (hammer-like structures) are forming near support, indicating aggressive buyer absorption in lower demand blocks.
📉 Key Structural Levels
• Overhead Resistance: The immediate zone remains heavily guarded. A decisive close above this level clears the path toward a major macro range extension.
• Critical Support Block: If a broader market pullback occurs, buyers are heavily waiting around the key moving average floors. Losing this zone opens up a liquidity sweep downward.
⚡ Momentum & Indicators
• Moving Averages (EMA): Price action is actively fighting the short-term 9 and 21 Exponential Moving Averages (EMAs). A sustained breakout above them flips momentum purely bullish.
• Volume Profile: On-chain accumulation volume expands on down-days, showing institutional backing beneath the surface volatility.
💡 The Verdict: Wait for the daily candle to close above the current EMA compression before executing any breakout trades. Patience is key while liquidity gets squeezed.
💬 Are you bullish or bearish on $ETH at these levels? Drop your charts below! 👇
#Ethereum #Ethereum #technicalanalyst #cryptotrade #candlestick_patterns
Ethereum's price structure is catching massive attention as the daily chart reveals intense battlefield positioning between buyers and sellers. Following a clean retest of macro trend support lines, the asset is pressuring immediate structural barriers.
Here is a breakdown of the active technical signals:
🧩 The Candlestick Breakdown
• Rejection Candles: A recent daily shooting star pattern at local highs signals heavy selling pressure near overhead resistance.
• Demand Validation: Long lower-wick candles (hammer-like structures) are forming near support, indicating aggressive buyer absorption in lower demand blocks.
📉 Key Structural Levels
• Overhead Resistance: The immediate zone remains heavily guarded. A decisive close above this level clears the path toward a major macro range extension.
• Critical Support Block: If a broader market pullback occurs, buyers are heavily waiting around the key moving average floors. Losing this zone opens up a liquidity sweep downward.
⚡ Momentum & Indicators
• Moving Averages (EMA): Price action is actively fighting the short-term 9 and 21 Exponential Moving Averages (EMAs). A sustained breakout above them flips momentum purely bullish.
• Volume Profile: On-chain accumulation volume expands on down-days, showing institutional backing beneath the surface volatility.
💡 The Verdict: Wait for the daily candle to close above the current EMA compression before executing any breakout trades. Patience is key while liquidity gets squeezed.
💬 Are you bullish or bearish on $ETH at these levels? Drop your charts below! 👇
#Ethereum #Ethereum #technicalanalyst #cryptotrade #candlestick_patterns
114

Article
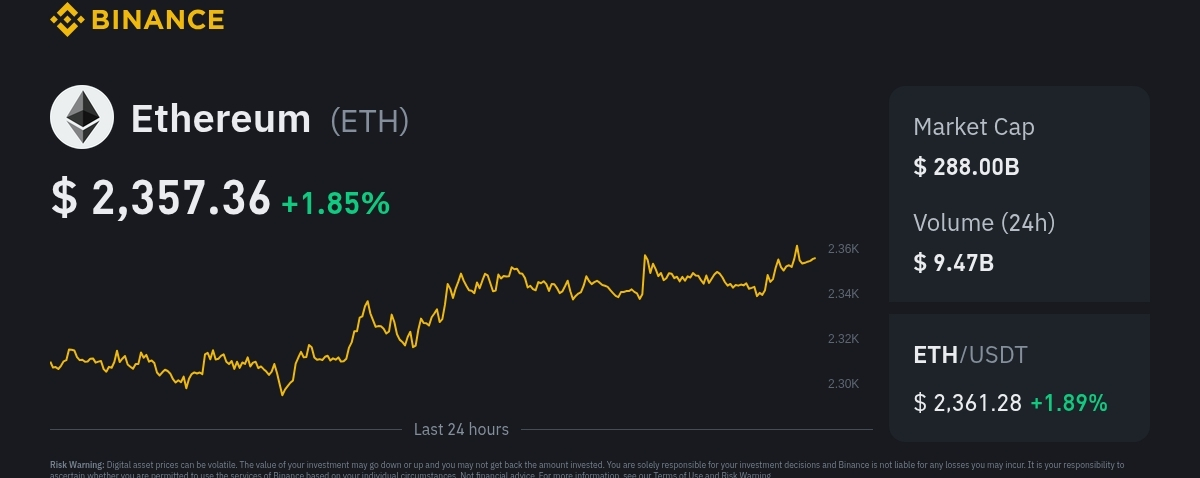
ETH /USD Technical Analysis — November 1, 2026$ETH /USD Technical Analysis — November 1, 2026
{spot}(ETHUSDT)
Short-term outlook: Bearish · Trading approach: Wait for confirmation
Ethereum is under selling pressure after falling below the important $2,350 area. Recent technical analysis describes a bearish price channel, with support near $2,150. Broader crypto-market weakness is also weighing on sentiment. StoneX +1
Latest verified reference area
Under pressure
### $2,150–$2,350
This is a technical range reported on October 30, not a confirmed live price for November 1. StoneX
Key support
### $2,150
Key resistance
### $2,350
Bearish target
### $2,000
Trend
### Bearish channel
1\. $ETH /USD trend analysis
* 4-hour chart: Favor sellers while price remains below resistance.
* Daily chart: Bearish structure, with ETH below $2,350.
* Market sentiment: Cautious, with recent ETF outflows and uncertainty surrounding Ethereum's upcoming upgrade. StoneX +1
### 2\. Trading scenarios
Bullish scenario — BUY
If ETH recovers above $2,350 and holds that level, a short-term recovery may develop. Wait for a confirmed breakout and retest before considering a long entry.
Bearish scenario — SELL
If ETH breaks below $2,150, the next major downside level is around $2,000. A confirmed breakdown would strengthen the bearish outlook. StoneX
Sideways scenario
If ETH stays between $2,150 and $2,350, it may consolidate. Avoid chasing price until a clear breakout or breakdown appears.
### 3\. My trading view
* Overall bias: Bearish below $2,350.
* Potential buy: Only after a confirmed recovery above resistance.
* Potential sell: After a confirmed breakdown below $2,150.
* Risk management: Keep position sizes reasonable, use stop-losses, and be careful with leverage.
Bottom line: ETH/USD currently has a bearish technical outlook. The most important level to watch is $2,150 support. A break below it could open the way toward $2,000, while a recovery above $2,350 would improve the short-term outlook.
The levels above come from the latest dated technical analysis I could verify, rather than a live exchange
feed. Confirm the current ETH/USD price before placing a trade.
#TrendingPredictions #Ethereum #ETHUSDT
ETH /USD Technical Analysis — November 1, 2026
$ETH /USD Technical Analysis — November 1, 2026
Short-term outlook: Bearish · Trading approach: Wait for confirmation
Ethereum is under selling pressure after falling below the important $2,350 area. Recent technical analysis describes a bearish price channel, with support near $2,150. Broader crypto-market weakness is also weighing on sentiment. StoneX +1
Latest verified reference area
Under pressure
### $2,150–$2,350
This is a technical range reported on October 30, not a confirmed live price for November 1. StoneX
Key support
### $2,150
Key resistance
### $2,350
Bearish target
### $2,000
Trend
### Bearish channel
1\. $ETH /USD trend analysis
* 4-hour chart: Favor sellers while price remains below resistance.
* Daily chart: Bearish structure, with ETH below $2,350.
* Market sentiment: Cautious, with recent ETF outflows and uncertainty surrounding Ethereum's upcoming upgrade. StoneX +1
### 2\. Trading scenarios
Bullish scenario — BUY
If ETH recovers above $2,350 and holds that level, a short-term recovery may develop. Wait for a confirmed breakout and retest before considering a long entry.
Bearish scenario — SELL
If ETH breaks below $2,150, the next major downside level is around $2,000. A confirmed breakdown would strengthen the bearish outlook. StoneX
Sideways scenario
If ETH stays between $2,150 and $2,350, it may consolidate. Avoid chasing price until a clear breakout or breakdown appears.
### 3\. My trading view
* Overall bias: Bearish below $2,350.
* Potential buy: Only after a confirmed recovery above resistance.
* Potential sell: After a confirmed breakdown below $2,150.
* Risk management: Keep position sizes reasonable, use stop-losses, and be careful with leverage.
Bottom line: ETH/USD currently has a bearish technical outlook. The most important level to watch is $2,150 support. A break below it could open the way toward $2,000, while a recovery above $2,350 would improve the short-term outlook.
The levels above come from the latest dated technical analysis I could verify, rather than a live exchange
feed. Confirm the current ETH/USD price before placing a trade.
#TrendingPredictions #Ethereum #ETHUSDT
Short-term outlook: Bearish · Trading approach: Wait for confirmation
Ethereum is under selling pressure after falling below the important $2,350 area. Recent technical analysis describes a bearish price channel, with support near $2,150. Broader crypto-market weakness is also weighing on sentiment. StoneX +1
Latest verified reference area
Under pressure
### $2,150–$2,350
This is a technical range reported on October 30, not a confirmed live price for November 1. StoneX
Key support
### $2,150
Key resistance
### $2,350
Bearish target
### $2,000
Trend
### Bearish channel
1\. $ETH /USD trend analysis
* 4-hour chart: Favor sellers while price remains below resistance.
* Daily chart: Bearish structure, with ETH below $2,350.
* Market sentiment: Cautious, with recent ETF outflows and uncertainty surrounding Ethereum's upcoming upgrade. StoneX +1
### 2\. Trading scenarios
Bullish scenario — BUY
If ETH recovers above $2,350 and holds that level, a short-term recovery may develop. Wait for a confirmed breakout and retest before considering a long entry.
Bearish scenario — SELL
If ETH breaks below $2,150, the next major downside level is around $2,000. A confirmed breakdown would strengthen the bearish outlook. StoneX
Sideways scenario
If ETH stays between $2,150 and $2,350, it may consolidate. Avoid chasing price until a clear breakout or breakdown appears.
### 3\. My trading view
* Overall bias: Bearish below $2,350.
* Potential buy: Only after a confirmed recovery above resistance.
* Potential sell: After a confirmed breakdown below $2,150.
* Risk management: Keep position sizes reasonable, use stop-losses, and be careful with leverage.
Bottom line: ETH/USD currently has a bearish technical outlook. The most important level to watch is $2,150 support. A break below it could open the way toward $2,000, while a recovery above $2,350 would improve the short-term outlook.
The levels above come from the latest dated technical analysis I could verify, rather than a live exchange
feed. Confirm the current ETH/USD price before placing a trade.
#TrendingPredictions #Ethereum #ETHUSDT
168

·
--
Bullish
🚨 $ETH AT A CRITICAL LEVEL! $2,278 — BREAKOUT OR ANOTHER TRAP?
🔥 $ETH IS WAKING UP… BUT THE REAL TEST IS STILL AHEAD!
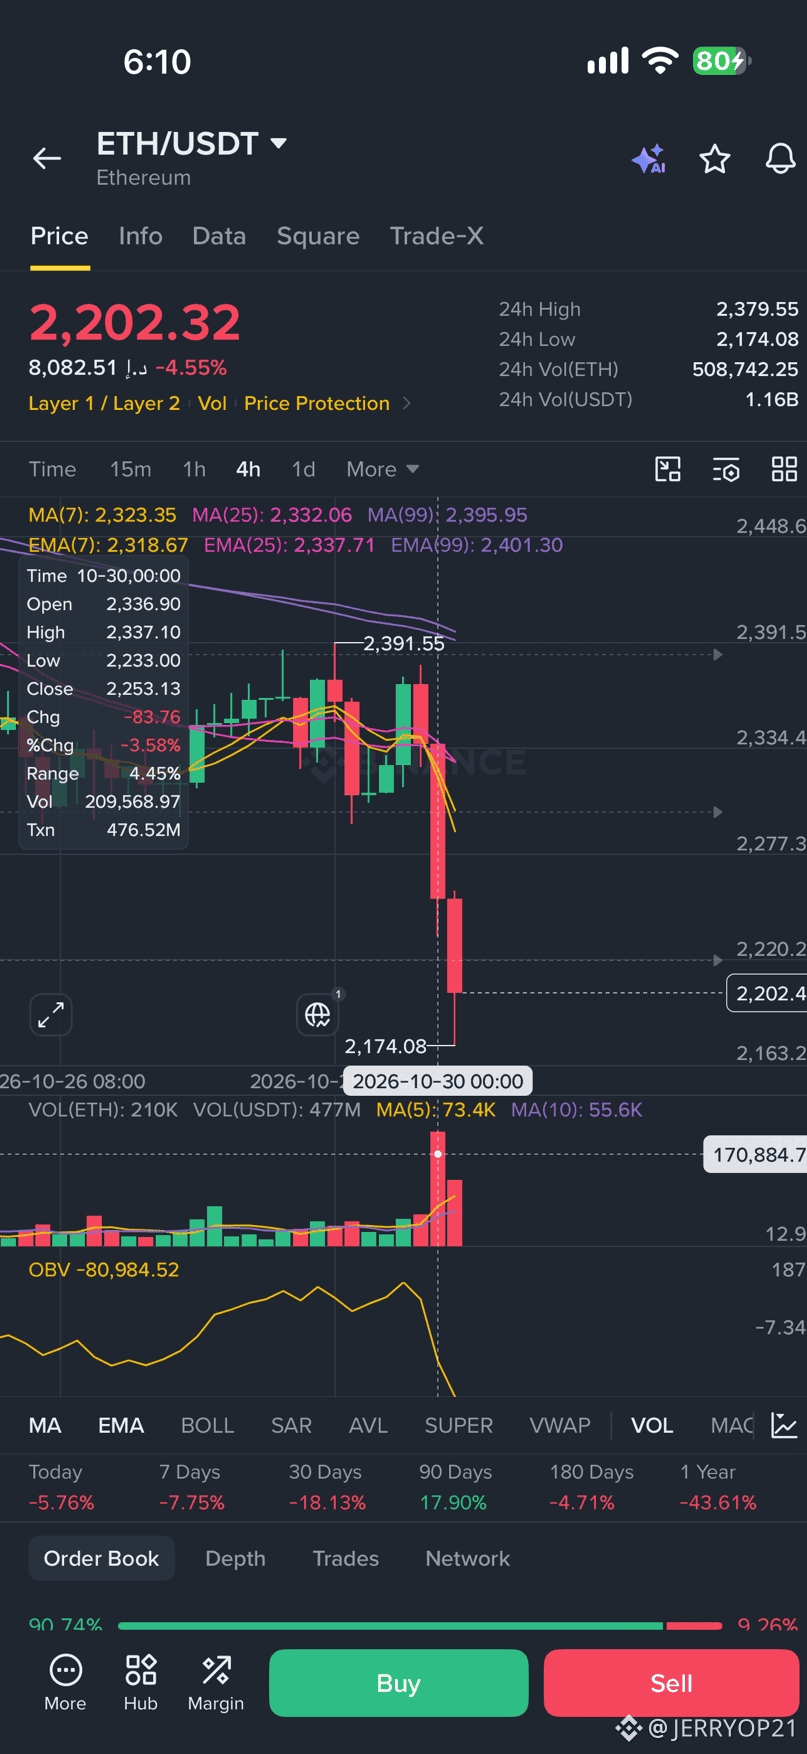
ETH has recovered from its recent drop toward $2,174 and is now trading around $2,271.33 in this 4H chart snapshot.
But here's the important question:
Can ETH reclaim $2,278, or will sellers reject the recovery again? 👀
Let's break down the levels that matter.
📊 THE MARKET MAP
🟢 Current price: $2,271.33
🟢 MA(7): $2,263.09
🔴 MA(25): $2,278.76
🔴 MA(99): $2,363.48
{future}(ETHUSDT)
🐂 BULLISH SCENARIO
If $ETH breaks and holds above the $2,278 resistance with strong volume, buyers may gain momentum.
The next area to watch is around $2,332, followed by the higher MA(99) resistance near $2,363.
🐻 BEARISH SCENARIO
If ETH gets rejected near $2,278 and loses the $2,221 support, the recovery could weaken.
A deeper pullback may bring the previous low around $2,174 back into focus.
⚡ THE SIGNAL I'M WATCHING
Not just a green candle. Not just a price pump.
I want to see a confirmed 4H breakout, stronger volume, and a successful hold above resistance.
That's the difference between chasing a move and understanding the market.
💬 YOUR TURN:
Would you watch ETH for a breakout above $2,278, or wait for a pullback toward $2,221?
Share your reasoning. Let's discuss the chart, not blindly follow the crowd!
📌 Save this analysis and compare these levels with ETH's next 4H candle.
#Ethereum #ETH #ETHUSDT #CryptoAnalysis #TechnicalAnalysis
🚨 $ETH AT A CRITICAL LEVEL! $2,278 — BREAKOUT OR ANOTHER TRAP?
🔥 $ETH IS WAKING UP… BUT THE REAL TEST IS STILL AHEAD!
ETH has recovered from its recent drop toward $2,174 and is now trading around $2,271.33 in this 4H chart snapshot.
But here's the important question:
Can ETH reclaim $2,278, or will sellers reject the recovery again? 👀
Let's break down the levels that matter.
📊 THE MARKET MAP
🟢 Current price: $2,271.33
🟢 MA(7): $2,263.09
🔴 MA(25): $2,278.76
🔴 MA(99): $2,363.48
🐂 BULLISH SCENARIO
If $ETH breaks and holds above the $2,278 resistance with strong volume, buyers may gain momentum.
The next area to watch is around $2,332, followed by the higher MA(99) resistance near $2,363.
🐻 BEARISH SCENARIO
If ETH gets rejected near $2,278 and loses the $2,221 support, the recovery could weaken.
A deeper pullback may bring the previous low around $2,174 back into focus.
⚡ THE SIGNAL I'M WATCHING
Not just a green candle. Not just a price pump.
I want to see a confirmed 4H breakout, stronger volume, and a successful hold above resistance.
That's the difference between chasing a move and understanding the market.
💬 YOUR TURN:
Would you watch ETH for a breakout above $2,278, or wait for a pullback toward $2,221?
Share your reasoning. Let's discuss the chart, not blindly follow the crowd!
📌 Save this analysis and compare these levels with ETH's next 4H candle.
#Ethereum #ETH #ETHUSDT #CryptoAnalysis #TechnicalAnalysis
🔥 $ETH IS WAKING UP… BUT THE REAL TEST IS STILL AHEAD!
ETH has recovered from its recent drop toward $2,174 and is now trading around $2,271.33 in this 4H chart snapshot.
But here's the important question:
Can ETH reclaim $2,278, or will sellers reject the recovery again? 👀
Let's break down the levels that matter.
📊 THE MARKET MAP
🟢 Current price: $2,271.33
🟢 MA(7): $2,263.09
🔴 MA(25): $2,278.76
🔴 MA(99): $2,363.48
🐂 BULLISH SCENARIO
If $ETH breaks and holds above the $2,278 resistance with strong volume, buyers may gain momentum.
The next area to watch is around $2,332, followed by the higher MA(99) resistance near $2,363.
🐻 BEARISH SCENARIO
If ETH gets rejected near $2,278 and loses the $2,221 support, the recovery could weaken.
A deeper pullback may bring the previous low around $2,174 back into focus.
⚡ THE SIGNAL I'M WATCHING
Not just a green candle. Not just a price pump.
I want to see a confirmed 4H breakout, stronger volume, and a successful hold above resistance.
That's the difference between chasing a move and understanding the market.
💬 YOUR TURN:
Would you watch ETH for a breakout above $2,278, or wait for a pullback toward $2,221?
Share your reasoning. Let's discuss the chart, not blindly follow the crowd!
📌 Save this analysis and compare these levels with ETH's next 4H candle.
#Ethereum #ETH #ETHUSDT #CryptoAnalysis #TechnicalAnalysis

72

·
--
🚨 $ETH — COME AT ME! 😂🔥
I dare you to hit my liquidation! LOL 🤣
Lalalalalalalalalall 🎶
But seriously, this is why you should keep your leverage low. 2x–4x MAX! ⚠️
Hope everyone who got liquidated today learned a valuable lesson. Protect your capital, manage your risk, and never let the market wipe you out.
🎯 $3,500 — WE MARCH ON!!!
#ETH #Ethereum #Crypto #BinanceSquare #Trading #CryptoCommunity
$BTC
{future}(ETHUSDT)
🚨 $ETH — COME AT ME! 😂🔥
I dare you to hit my liquidation! LOL 🤣
Lalalalalalalalalall 🎶
But seriously, this is why you should keep your leverage low. 2x–4x MAX! ⚠️
Hope everyone who got liquidated today learned a valuable lesson. Protect your capital, manage your risk, and never let the market wipe you out.
🎯 $3,500 — WE MARCH ON!!!
#ETH #Ethereum #Crypto #BinanceSquare #Trading #CryptoCommunity
$BTC
I dare you to hit my liquidation! LOL 🤣
Lalalalalalalalalall 🎶
But seriously, this is why you should keep your leverage low. 2x–4x MAX! ⚠️
Hope everyone who got liquidated today learned a valuable lesson. Protect your capital, manage your risk, and never let the market wipe you out.
🎯 $3,500 — WE MARCH ON!!!
#ETH #Ethereum #Crypto #BinanceSquare #Trading #CryptoCommunity
$BTC
842

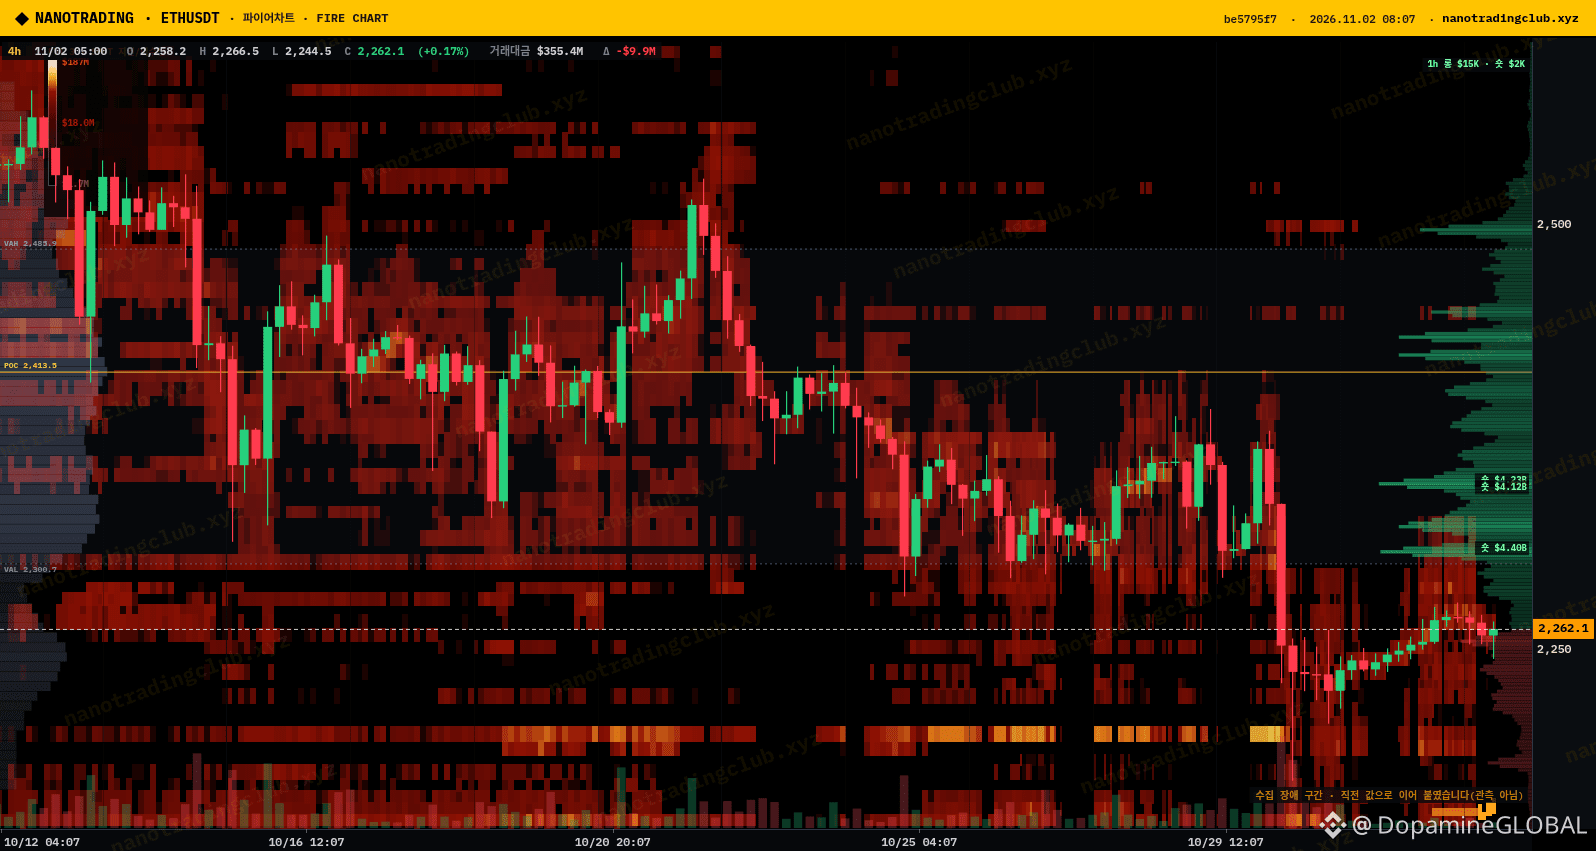
$ETH has spent the whole weekend grinding back up from the 10/29 dump and is sitting around 2,262 this morning, right under the value area low near 2,300. Volume's still there (~$2.7B on Binance perps in 24h) but the range is tight, 2,244 to 2,277.
What bugs me is positioning. About 72% of Binance futures accounts on ETHUSDT are long (L/S 2.55), top traders around 60% long, while funding is basically flat and OI has only drifted from ~2.36M to ~2.37M ETH over the last day. Lots of people leaning long without much new money behind it.
On the NanoTrading Fire chart (4h) the big stuff is overhead: short liquidation clusters labelled ~$4.40B right around 2,310 and another ~$4.1-4.2B pair near 2,345-2,350. The POC is way up at 2,413.5. Below price there's a bright liquidity band around 2,200 with nothing much labelled in between.
My plan: a 4h close back above 2,300 puts those short clusters in play and I'd look for 2,345 then the 2,413 POC. If $ETH loses 2,244, that crowded long side gets a reason to unwind toward 2,200. Waiting for one side to give.
Are you trusting this slow grind up, or does 72% longs make you nervous? 🤔
NFA, just how I'm reading it.
Source: NanoTrading Fire chart (nanotradingclub.xyz)
#ETH #Ethereum #NanoTrading
$ETH has spent the whole weekend grinding back up from the 10/29 dump and is sitting around 2,262 this morning, right under the value area low near 2,300. Volume's still there (~$2.7B on Binance perps in 24h) but the range is tight, 2,244 to 2,277.
What bugs me is positioning. About 72% of Binance futures accounts on ETHUSDT are long (L/S 2.55), top traders around 60% long, while funding is basically flat and OI has only drifted from ~2.36M to ~2.37M ETH over the last day. Lots of people leaning long without much new money behind it.
On the NanoTrading Fire chart (4h) the big stuff is overhead: short liquidation clusters labelled ~$4.40B right around 2,310 and another ~$4.1-4.2B pair near 2,345-2,350. The POC is way up at 2,413.5. Below price there's a bright liquidity band around 2,200 with nothing much labelled in between.
My plan: a 4h close back above 2,300 puts those short clusters in play and I'd look for 2,345 then the 2,413 POC. If $ETH loses 2,244, that crowded long side gets a reason to unwind toward 2,200. Waiting for one side to give.
Are you trusting this slow grind up, or does 72% longs make you nervous? 🤔
NFA, just how I'm reading it.
Source: NanoTrading Fire chart (nanotradingclub.xyz)
#ETH #Ethereum #NanoTrading
What bugs me is positioning. About 72% of Binance futures accounts on ETHUSDT are long (L/S 2.55), top traders around 60% long, while funding is basically flat and OI has only drifted from ~2.36M to ~2.37M ETH over the last day. Lots of people leaning long without much new money behind it.
On the NanoTrading Fire chart (4h) the big stuff is overhead: short liquidation clusters labelled ~$4.40B right around 2,310 and another ~$4.1-4.2B pair near 2,345-2,350. The POC is way up at 2,413.5. Below price there's a bright liquidity band around 2,200 with nothing much labelled in between.
My plan: a 4h close back above 2,300 puts those short clusters in play and I'd look for 2,345 then the 2,413 POC. If $ETH loses 2,244, that crowded long side gets a reason to unwind toward 2,200. Waiting for one side to give.
Are you trusting this slow grind up, or does 72% longs make you nervous? 🤔
NFA, just how I'm reading it.
Source: NanoTrading Fire chart (nanotradingclub.xyz)
#ETH #Ethereum #NanoTrading
29

·
--
30D trade $ETH 64.3 USDT
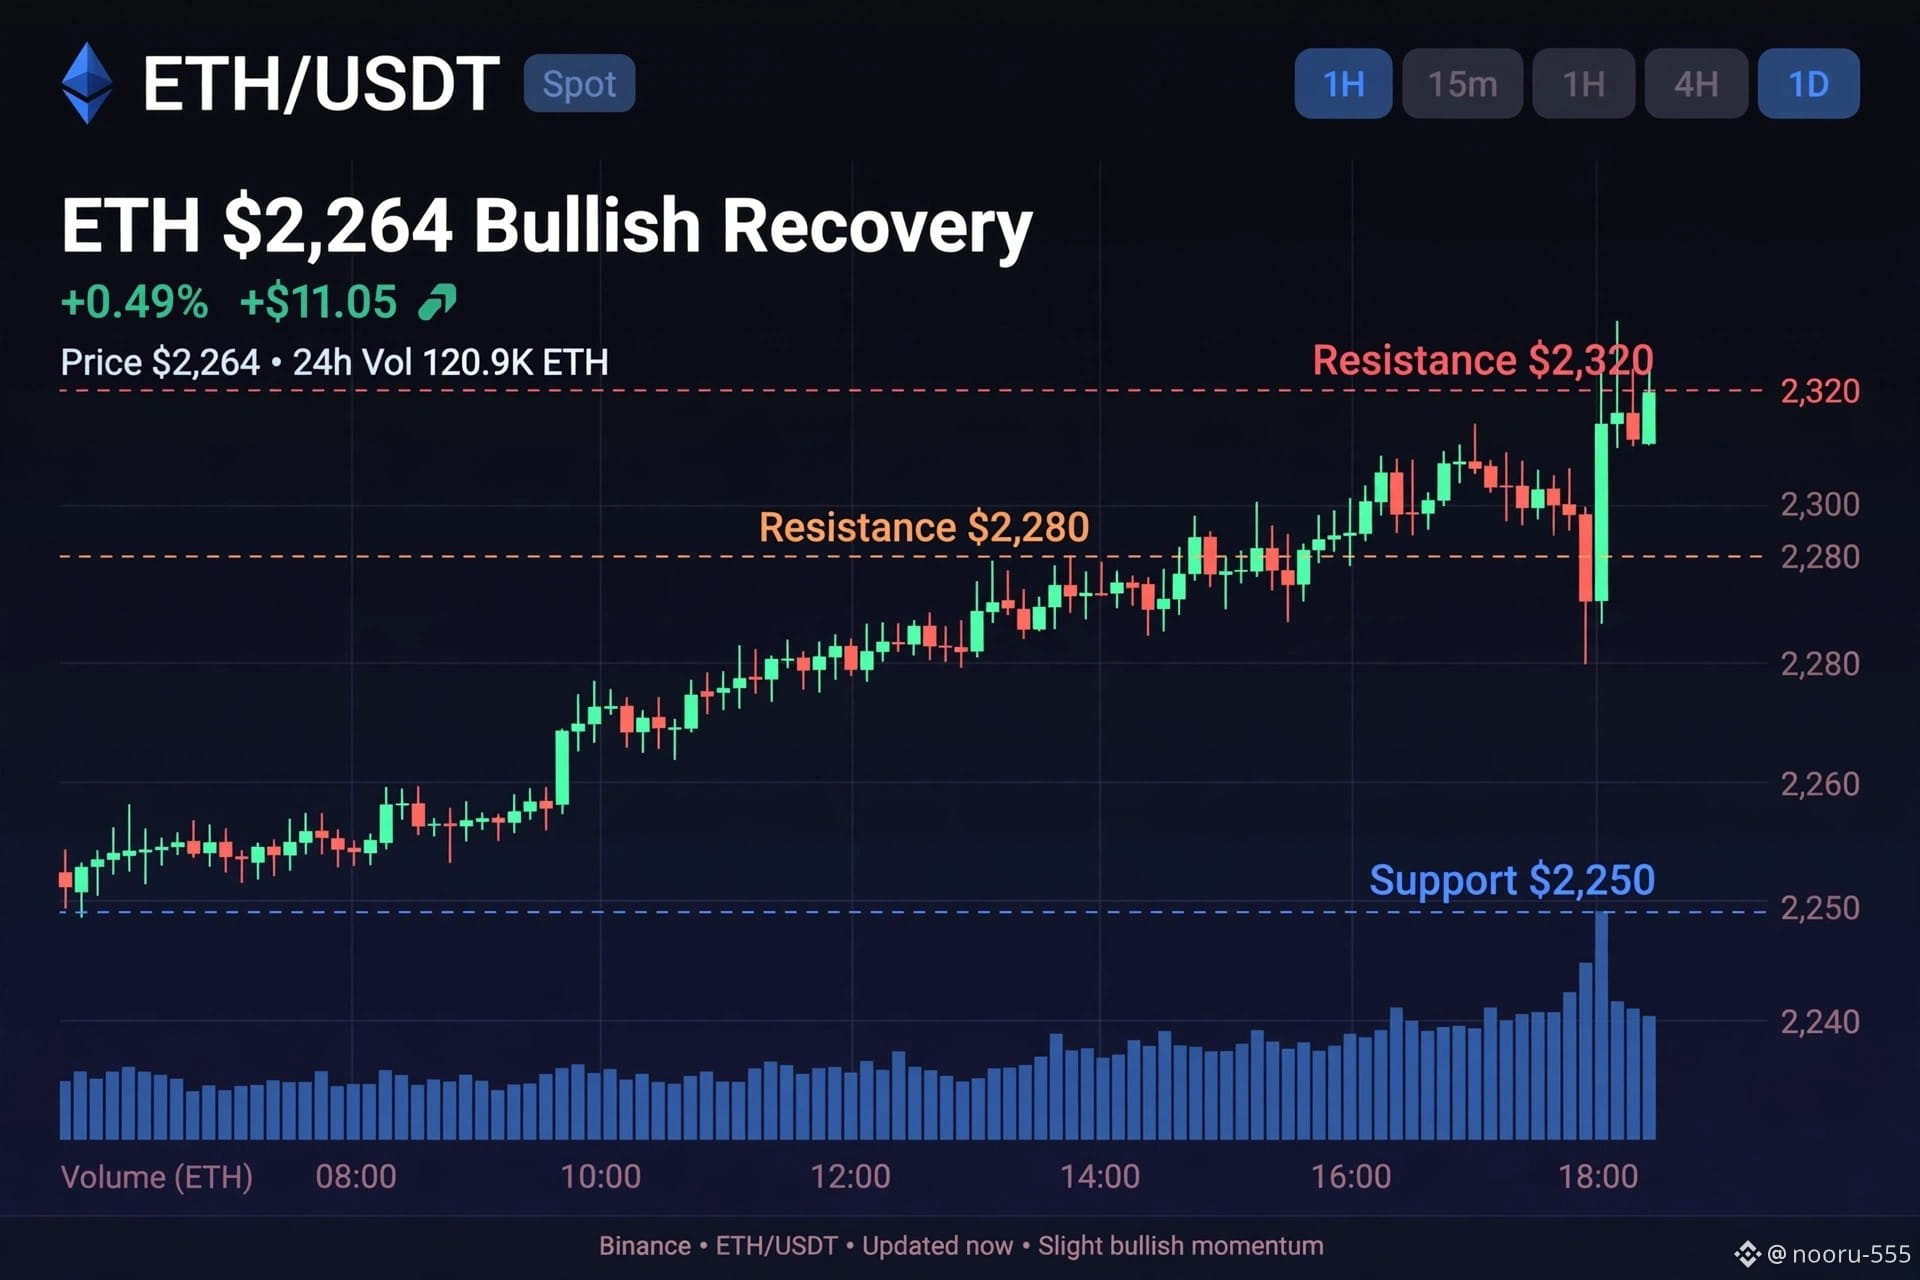
$ETH $2,264 Bullish Recovery 🚀
+0.49% after market FUD
Sup: $2,250 | Res: $2,280 → $2,320
Holding above $2,250 = bullish to $2,350
ETH is back? 👀
$ETH
{spot}(ETHUSDT)
#Ethereum #Crypto #CZDismissesClaimsBinanceHackWasPredicted
$ETH $2,264 Bullish Recovery 🚀
+0.49% after market FUD
Sup: $2,250 | Res: $2,280 → $2,320
Holding above $2,250 = bullish to $2,350
ETH is back? 👀
$ETH
#Ethereum #Crypto #CZDismissesClaimsBinanceHackWasPredicted
+0.49% after market FUD
Sup: $2,250 | Res: $2,280 → $2,320
Holding above $2,250 = bullish to $2,350
ETH is back? 👀
$ETH
#Ethereum #Crypto #CZDismissesClaimsBinanceHackWasPredicted
23

#usspotethetfspost23straightdaysofnetoutflows
🚨 THE ETF EQUATION: 23 Days in the Red 🚨
Let's break down this historic institutional exodus using pure math 🧮👇
(TradFi De-risking) + ($1B+ Monthly Withdrawals) = 23 Consecutive Days of Outflows 📉
The Asset Input:
(The Catalyst) = U.S. spot Ethereum ETFs just recorded 23 straight days of net outflows through Oct 30. Over $1 billion exited the funds in October alone.
The Key Deliverable:
(The Divergence) ➔ We are witnessing a massive split in behavior. While traditional finance pulled capital out of ETFs for nearly a full month without a single day of net buying, native on-chain Ethereum staking simultaneously climbed to record highs.
The Breakdown:
Wall Street and Web3 are reading the exact same asset differently. TradFi is dumping, while crypto natives are aggressively locking up supply.
Are we witnessing the ultimate Wall Street shakeout before a massive on-chain supply shock, or is TradFi seeing a fundamental flaw in Ethereum that crypto natives are completely ignoring? Drop your macro thesis below! 🐂🐻👇💬
$ETH
{future}(ETHUSDT)
#ETH #ETHETFS #Ethereum
#usspotethetfspost23straightdaysofnetoutflows
🚨 THE ETF EQUATION: 23 Days in the Red 🚨
Let's break down this historic institutional exodus using pure math 🧮👇
(TradFi De-risking) + ($1B+ Monthly Withdrawals) = 23 Consecutive Days of Outflows 📉
The Asset Input:
(The Catalyst) = U.S. spot Ethereum ETFs just recorded 23 straight days of net outflows through Oct 30. Over $1 billion exited the funds in October alone.
The Key Deliverable:
(The Divergence) ➔ We are witnessing a massive split in behavior. While traditional finance pulled capital out of ETFs for nearly a full month without a single day of net buying, native on-chain Ethereum staking simultaneously climbed to record highs.
The Breakdown:
Wall Street and Web3 are reading the exact same asset differently. TradFi is dumping, while crypto natives are aggressively locking up supply.
Are we witnessing the ultimate Wall Street shakeout before a massive on-chain supply shock, or is TradFi seeing a fundamental flaw in Ethereum that crypto natives are completely ignoring? Drop your macro thesis below! 🐂🐻👇💬
$ETH
#ETH #ETHETFS #Ethereum
🚨 THE ETF EQUATION: 23 Days in the Red 🚨
Let's break down this historic institutional exodus using pure math 🧮👇
(TradFi De-risking) + ($1B+ Monthly Withdrawals) = 23 Consecutive Days of Outflows 📉
The Asset Input:
(The Catalyst) = U.S. spot Ethereum ETFs just recorded 23 straight days of net outflows through Oct 30. Over $1 billion exited the funds in October alone.
The Key Deliverable:
(The Divergence) ➔ We are witnessing a massive split in behavior. While traditional finance pulled capital out of ETFs for nearly a full month without a single day of net buying, native on-chain Ethereum staking simultaneously climbed to record highs.
The Breakdown:
Wall Street and Web3 are reading the exact same asset differently. TradFi is dumping, while crypto natives are aggressively locking up supply.
Are we witnessing the ultimate Wall Street shakeout before a massive on-chain supply shock, or is TradFi seeing a fundamental flaw in Ethereum that crypto natives are completely ignoring? Drop your macro thesis below! 🐂🐻👇💬
$ETH
#ETH #ETHETFS #Ethereum

DopamineGLOBAL:
23 straight days of outflows while staking hits records, wild split
1
1
698

·
--
Bullish
🚨 BINANCE RESTORES ETHEREUM & BNB SMART CHAIN WITHDRAWALS! 🔥
Good news for the crypto community! Binance is gradually restoring withdrawal services following its recent security incident. The Ethereum (ETH) network and BNB Smart Chain (BSC) are included in the first phase, allowing withdrawals of ETH, BNB, USDT, and USDC as services become available. Binance has also announced that approximately 95% of the affected funds have been replenished. This is an important step toward restoring user confidence and normal exchange operations. However, withdrawals are being reopened in phases, so users may experience temporary delays. Always double check the selected network before transferring your funds.
A positive recovery milestone for Binance and the entire crypto market! 🚀
#Binance #Ethereum #BNB
#BinanceRestoresWithdrawalsForEthereumNetwork&BNBSmartChain
🚨 BINANCE RESTORES ETHEREUM & BNB SMART CHAIN WITHDRAWALS! 🔥
Good news for the crypto community! Binance is gradually restoring withdrawal services following its recent security incident. The Ethereum (ETH) network and BNB Smart Chain (BSC) are included in the first phase, allowing withdrawals of ETH, BNB, USDT, and USDC as services become available. Binance has also announced that approximately 95% of the affected funds have been replenished. This is an important step toward restoring user confidence and normal exchange operations. However, withdrawals are being reopened in phases, so users may experience temporary delays. Always double check the selected network before transferring your funds.
A positive recovery milestone for Binance and the entire crypto market! 🚀
#Binance #Ethereum #BNB
#BinanceRestoresWithdrawalsForEthereumNetwork&BNBSmartChain
Good news for the crypto community! Binance is gradually restoring withdrawal services following its recent security incident. The Ethereum (ETH) network and BNB Smart Chain (BSC) are included in the first phase, allowing withdrawals of ETH, BNB, USDT, and USDC as services become available. Binance has also announced that approximately 95% of the affected funds have been replenished. This is an important step toward restoring user confidence and normal exchange operations. However, withdrawals are being reopened in phases, so users may experience temporary delays. Always double check the selected network before transferring your funds.
A positive recovery milestone for Binance and the entire crypto market! 🚀
#Binance #Ethereum #BNB
#BinanceRestoresWithdrawalsForEthereumNetwork&BNBSmartChain

1
110

·
--
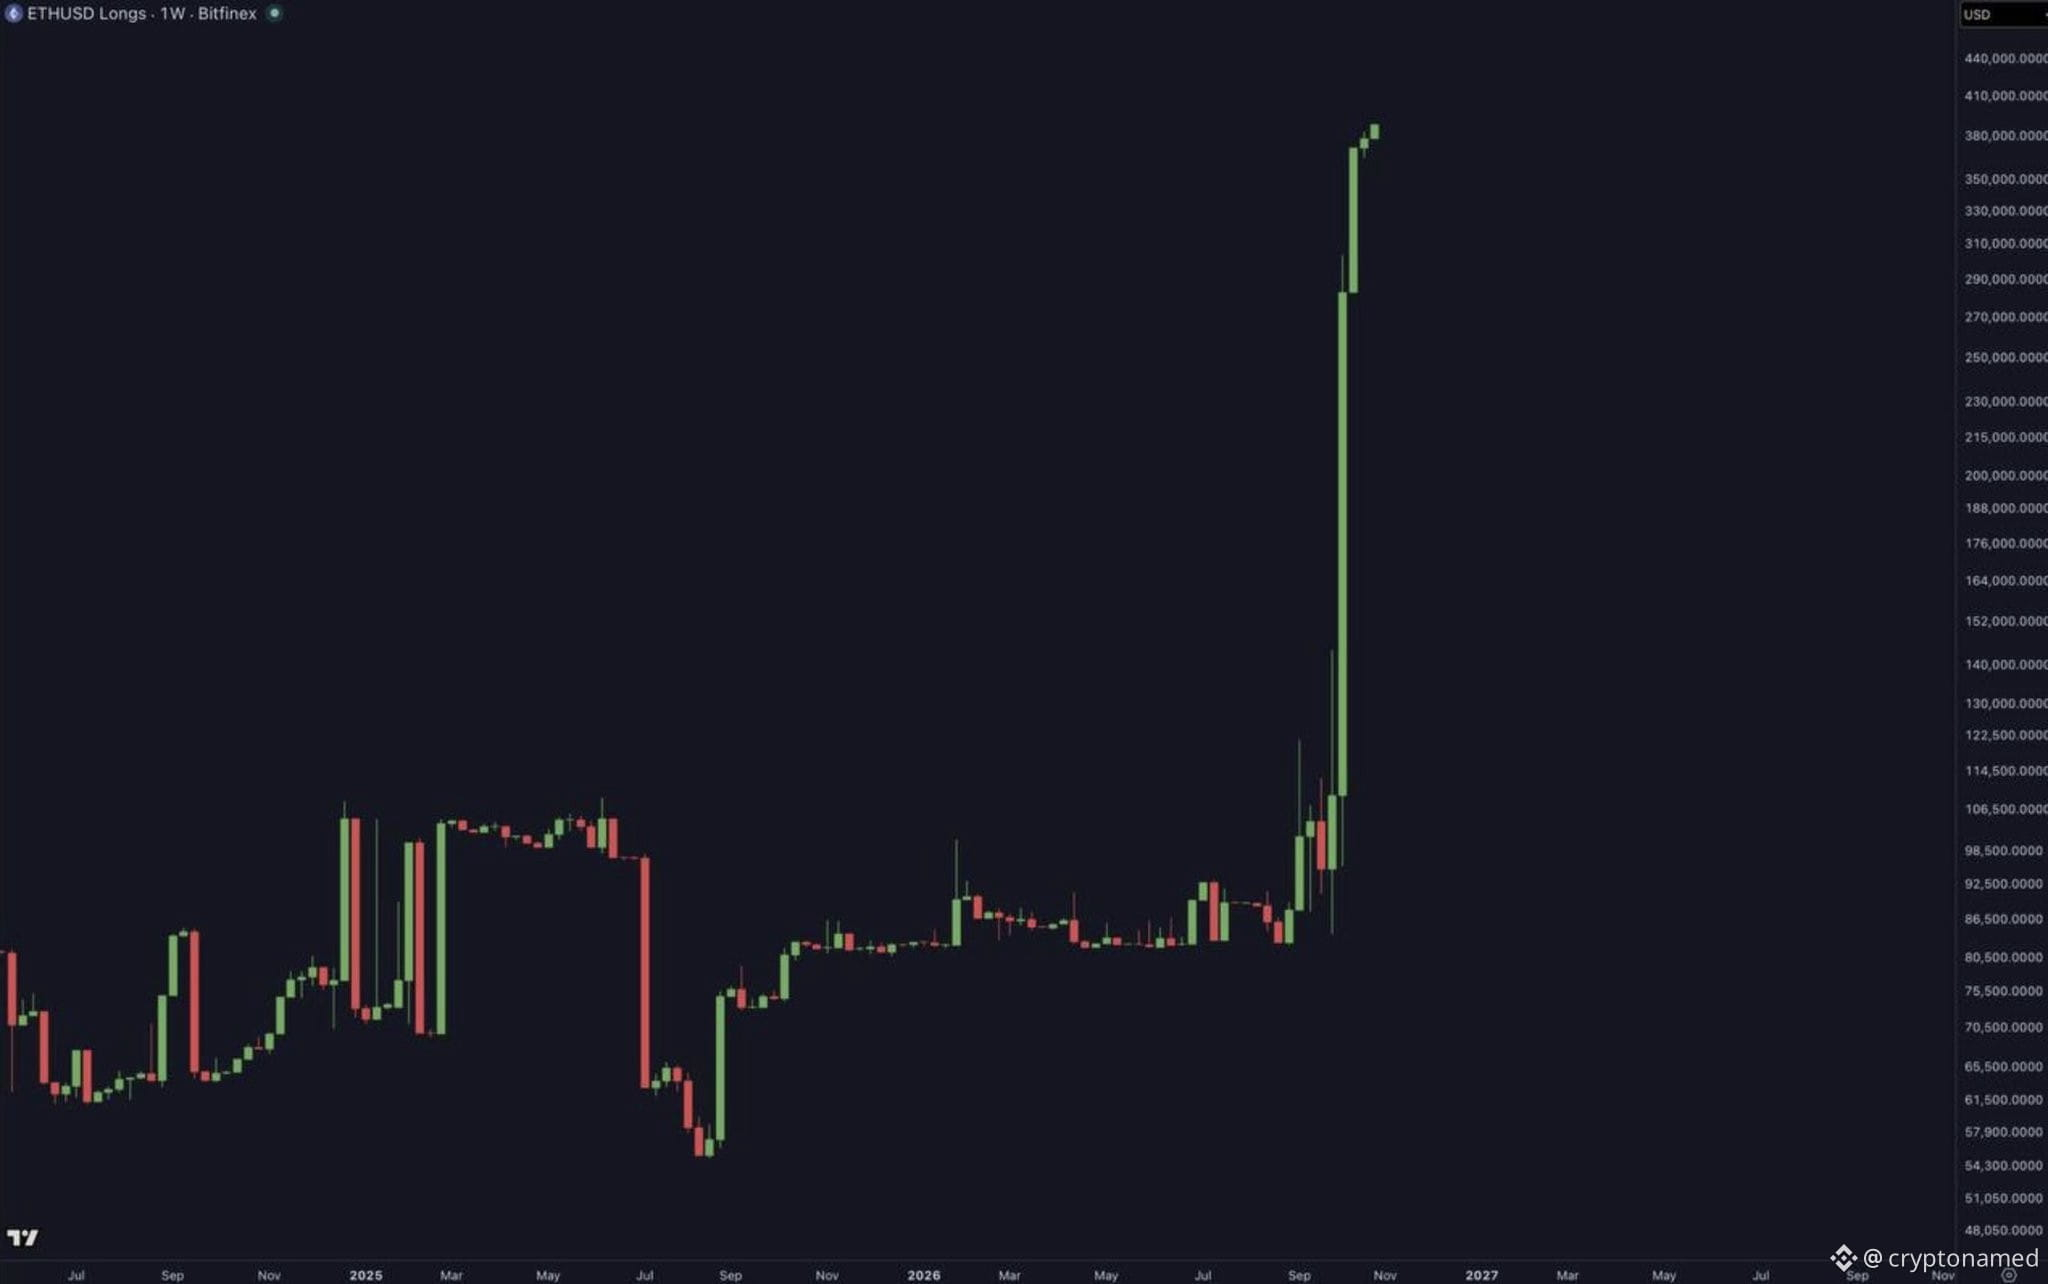
Ethereum’s next move could shake the altcoin market. 👀
Bullish positioning in $ETH is reportedly increasing, with large investors opening long positions. If Ethereum gains momentum, altcoins like $LUNC could benefit from a broader market rally.
But there’s a catch: rising long positions show bullish expectations, not guaranteed buying pressure or a confirmed breakout.
Bulls see an opportunity for an altcoin comeback; bears warn that crowded longs can unwind quickly.
Could $LUNC lead the next altcoin rally, or is that too optimistic? 🚀
#Ethereum #LUNC #Altcoins #Crypto #BinanceSquare
Ethereum’s next move could shake the altcoin market. 👀
Bullish positioning in $ETH is reportedly increasing, with large investors opening long positions. If Ethereum gains momentum, altcoins like $LUNC could benefit from a broader market rally.
But there’s a catch: rising long positions show bullish expectations, not guaranteed buying pressure or a confirmed breakout.
Bulls see an opportunity for an altcoin comeback; bears warn that crowded longs can unwind quickly.
Could $LUNC lead the next altcoin rally, or is that too optimistic? 🚀
#Ethereum #LUNC #Altcoins #Crypto #BinanceSquare
Bullish positioning in $ETH is reportedly increasing, with large investors opening long positions. If Ethereum gains momentum, altcoins like $LUNC could benefit from a broader market rally.
But there’s a catch: rising long positions show bullish expectations, not guaranteed buying pressure or a confirmed breakout.
Bulls see an opportunity for an altcoin comeback; bears warn that crowded longs can unwind quickly.
Could $LUNC lead the next altcoin rally, or is that too optimistic? 🚀
#Ethereum #LUNC #Altcoins #Crypto #BinanceSquare
124

·
--
🔥 $ETH — Ethereum Bulls Are Fighting Back, But One Resistance Could Decide the Next Move!
Ethereum is showing some encouraging signs of recovery, and I'm watching its 1-hour structure very closely.
Currently trading around $2,269, ETH has managed to recover from its recent lows. However, I don't think this is the right moment to blindly chase the green candles.
Here's what I'm seeing on the chart.
📊 1H Technical Breakdown
The RSI is hovering around 55.6, suggesting that bullish momentum is gradually returning without entering overbought territory.
More importantly, ETH is trading above two important moving averages:
• EMA20: $2,264.42
• EMA50: $2,262.61
This EMA alignment is encouraging for short-term buyers.
The Bollinger Bands also provide an interesting picture:
• Upper Band: $2,278.82
• Lower Band: $2,250.38
ETH is approaching the upper boundary, making the $2,278–$2,280 region an important resistance zone.
🎯 My Trading Strategy
I'm watching two possible scenarios.
🟢 Bullish Scenario:
If ETH successfully breaks above $2,280 with strong volume, the next upside levels I'm watching are:
TP1: $2,285
TP2: $2,300
TP3: $2,320
🔵 Pullback Opportunity:
I would prefer a controlled retracement toward $2,263–$2,255.
If buyers defend this zone and produce a strong bullish reaction, it could offer a more attractive LONG entry.
🛑 Risk Management
My bullish setup becomes invalid below $2,244.
If ETH loses this level, I won't hesitate to step aside.
⚠️ One Important Warning
The 1-hour recovery looks promising, but the broader 4-hour structure remains bearish.
That means traders should avoid confusing a short-term bounce with a confirmed trend reversal.
I'm watching volume, momentum and the next resistance reaction before making a decision.
Patience is part of trading. Sometimes the best trade is the one you don't take.
💬 What's your ETH prediction?
Will Ethereum break $2,280 and continue toward $2,300, or will sellers push it back toward $2,250?
#ETH #Ethereum #BinanceSquare #CryptoTrading
🔥 $ETH — Ethereum Bulls Are Fighting Back, But One Resistance Could Decide the Next Move!
Ethereum is showing some encouraging signs of recovery, and I'm watching its 1-hour structure very closely.
Currently trading around $2,269, ETH has managed to recover from its recent lows. However, I don't think this is the right moment to blindly chase the green candles.
Here's what I'm seeing on the chart.
📊 1H Technical Breakdown
The RSI is hovering around 55.6, suggesting that bullish momentum is gradually returning without entering overbought territory.
More importantly, ETH is trading above two important moving averages:
• EMA20: $2,264.42
• EMA50: $2,262.61
This EMA alignment is encouraging for short-term buyers.
The Bollinger Bands also provide an interesting picture:
• Upper Band: $2,278.82
• Lower Band: $2,250.38
ETH is approaching the upper boundary, making the $2,278–$2,280 region an important resistance zone.
🎯 My Trading Strategy
I'm watching two possible scenarios.
🟢 Bullish Scenario:
If ETH successfully breaks above $2,280 with strong volume, the next upside levels I'm watching are:
TP1: $2,285
TP2: $2,300
TP3: $2,320
🔵 Pullback Opportunity:
I would prefer a controlled retracement toward $2,263–$2,255.
If buyers defend this zone and produce a strong bullish reaction, it could offer a more attractive LONG entry.
🛑 Risk Management
My bullish setup becomes invalid below $2,244.
If ETH loses this level, I won't hesitate to step aside.
⚠️ One Important Warning
The 1-hour recovery looks promising, but the broader 4-hour structure remains bearish.
That means traders should avoid confusing a short-term bounce with a confirmed trend reversal.
I'm watching volume, momentum and the next resistance reaction before making a decision.
Patience is part of trading. Sometimes the best trade is the one you don't take.
💬 What's your ETH prediction?
Will Ethereum break $2,280 and continue toward $2,300, or will sellers push it back toward $2,250?
#ETH #Ethereum #BinanceSquare #CryptoTrading
Ethereum is showing some encouraging signs of recovery, and I'm watching its 1-hour structure very closely.
Currently trading around $2,269, ETH has managed to recover from its recent lows. However, I don't think this is the right moment to blindly chase the green candles.
Here's what I'm seeing on the chart.
📊 1H Technical Breakdown
The RSI is hovering around 55.6, suggesting that bullish momentum is gradually returning without entering overbought territory.
More importantly, ETH is trading above two important moving averages:
• EMA20: $2,264.42
• EMA50: $2,262.61
This EMA alignment is encouraging for short-term buyers.
The Bollinger Bands also provide an interesting picture:
• Upper Band: $2,278.82
• Lower Band: $2,250.38
ETH is approaching the upper boundary, making the $2,278–$2,280 region an important resistance zone.
🎯 My Trading Strategy
I'm watching two possible scenarios.
🟢 Bullish Scenario:
If ETH successfully breaks above $2,280 with strong volume, the next upside levels I'm watching are:
TP1: $2,285
TP2: $2,300
TP3: $2,320
🔵 Pullback Opportunity:
I would prefer a controlled retracement toward $2,263–$2,255.
If buyers defend this zone and produce a strong bullish reaction, it could offer a more attractive LONG entry.
🛑 Risk Management
My bullish setup becomes invalid below $2,244.
If ETH loses this level, I won't hesitate to step aside.
⚠️ One Important Warning
The 1-hour recovery looks promising, but the broader 4-hour structure remains bearish.
That means traders should avoid confusing a short-term bounce with a confirmed trend reversal.
I'm watching volume, momentum and the next resistance reaction before making a decision.
Patience is part of trading. Sometimes the best trade is the one you don't take.
💬 What's your ETH prediction?
Will Ethereum break $2,280 and continue toward $2,300, or will sellers push it back toward $2,250?
#ETH #Ethereum #BinanceSquare #CryptoTrading
DopamineGLOBAL:
rsi 55 above both emas but not chasing green candles, agreed
1
46

Ethereum-based ETFs have been experiencing continuous outflows for more than 23 weeks. This indicates that institutional investors’ interest in holding Ethereum (ETH) in their portfolios is waning. Institutional demand was particularly strong in August and September.
However, a sharp drop in demand was observed in October.
Total outflows from institutional investors exceeded $1 billion as of October 30. In the most recent trading session, outflows totaled $155.8 million. A significant portion of these outflows—$76.6 million—was recorded from BlackRock’s ETHA ETF alone.
#Ethereum $ETH
{spot}(ETHUSDT)
Ethereum-based ETFs have been experiencing continuous outflows for more than 23 weeks. This indicates that institutional investors’ interest in holding Ethereum (ETH) in their portfolios is waning. Institutional demand was particularly strong in August and September.
However, a sharp drop in demand was observed in October.
Total outflows from institutional investors exceeded $1 billion as of October 30. In the most recent trading session, outflows totaled $155.8 million. A significant portion of these outflows—$76.6 million—was recorded from BlackRock’s ETHA ETF alone.
#Ethereum $ETH
However, a sharp drop in demand was observed in October.
Total outflows from institutional investors exceeded $1 billion as of October 30. In the most recent trading session, outflows totaled $155.8 million. A significant portion of these outflows—$76.6 million—was recorded from BlackRock’s ETHA ETF alone.
#Ethereum $ETH
86

·
--
23 straight sessions of outflows. That's the longest streak U.S. spot Ethereum ETFs have ever had.
Farside data shows $155.7 million in net withdrawals on Oct 30 alone. BlackRock's ETHA led with $76.6 million out, Grayscale's Mini Trust lost $34.1 million and ETHE another $21.5 million.
Yet $ETH still trades near $2,270, up about 1% today. Price is holding while ETF money leaves, so someone else is buying, or sellers are running out.
Do you read the ETF streak as capitulation near a bottom, or as proof institutions are still cutting $ETH exposure?
#Ethereum #ETF #CryptoNews Not financial advice.
23 straight sessions of outflows. That's the longest streak U.S. spot Ethereum ETFs have ever had.
Farside data shows $155.7 million in net withdrawals on Oct 30 alone. BlackRock's ETHA led with $76.6 million out, Grayscale's Mini Trust lost $34.1 million and ETHE another $21.5 million.
Yet $ETH still trades near $2,270, up about 1% today. Price is holding while ETF money leaves, so someone else is buying, or sellers are running out.
Do you read the ETF streak as capitulation near a bottom, or as proof institutions are still cutting $ETH exposure?
#Ethereum #ETF #CryptoNews Not financial advice.
Farside data shows $155.7 million in net withdrawals on Oct 30 alone. BlackRock's ETHA led with $76.6 million out, Grayscale's Mini Trust lost $34.1 million and ETHE another $21.5 million.
Yet $ETH still trades near $2,270, up about 1% today. Price is holding while ETF money leaves, so someone else is buying, or sellers are running out.
Do you read the ETF streak as capitulation near a bottom, or as proof institutions are still cutting $ETH exposure?
#Ethereum #ETF #CryptoNews Not financial advice.
13
Log in to explore more content
Join global crypto users on Binance Square
⚡️ Get latest and useful information about crypto.
💬 Trusted by the world’s largest crypto exchange.
👍 Discover real insights from verified creators.
Email / Phone number
Trending Topics
1
#BinanceProcesses$4.65BWithdrawals
25,858 views
120 Discussing
2
#WithdrawalsBack: 15 networks live
7,938 views
129 Discussing
3
#BinanceUpdatesProofofReservesAddresses
128,891 views
1,562 Discussing
4
#BinanceToResumePhaseOneOfWithdrawals
165,638 views
1,619 Discussing
5
#BinanceHadAlreadyCovered$6BofHackLoss
11,162 views
142 Discussing
6
#FBIConfirmsNorthKoreaIsResponsibleForBinanceCryptoHack
52,804 views
154 Discussing
7
#CZDismissesClaimsBinanceHackWasPredicted
85,047 views
777 Discussing
8
#B14gReportsUnauthorizedTransferOfAbout97MCORE
32,972 views
406 Discussing
9
#USSpotETHETFsPost23StraightDaysOfNetOutflows
35,225 views
400 Discussing
10
#IntelHasItsWorstDaySince1974
130,427 views
1,004 Discussing