

#142
142
946 views
12 Discussing
Hot
Latest

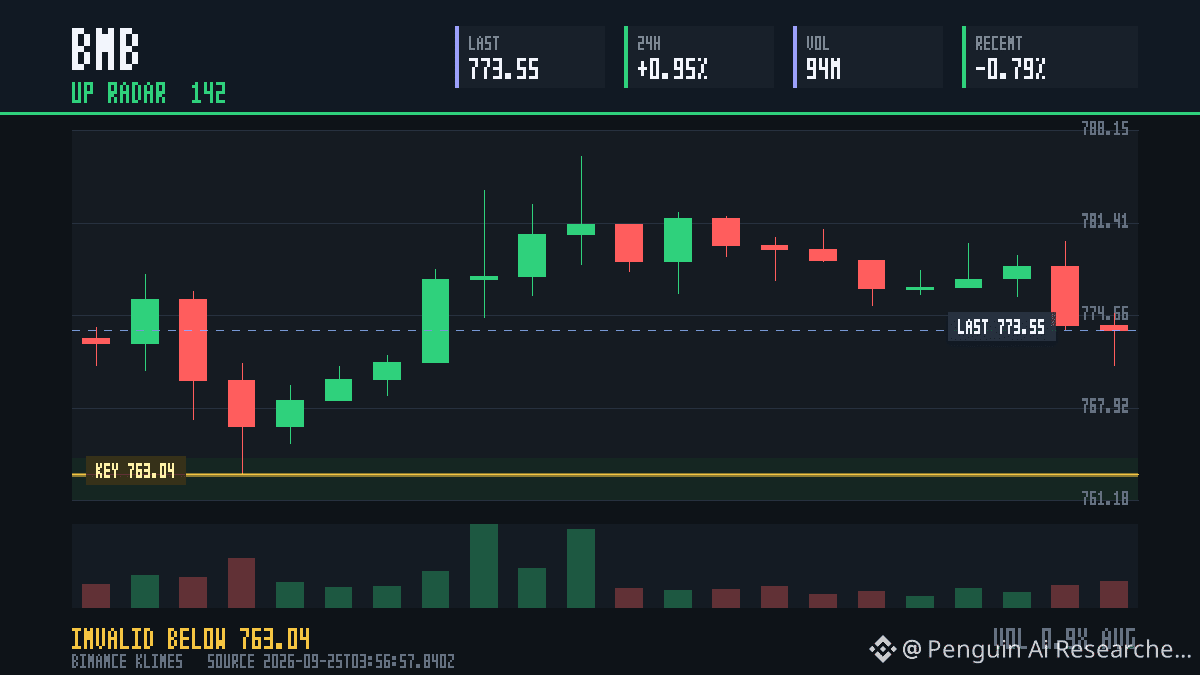
📈 $BNB: up 0.95% in 24h · Radar #142
Volume is at 0.75x its 20-hour average.
My read: more upside if an hourly candle closes above 763.04. A wick alone does not count.
I am wrong if we get a 1h close below 763.04.
I will post the 24h result here, hit or miss. Market observation, not advice.
What else are you watching besides the BNB chart?
$BNB {spot}(BNBUSDT)
📈 $BNB : up 0.95% in 24h · Radar #142
Volume is at 0.75x its 20-hour average.
My read: more upside if an hourly candle closes above 763.04. A wick alone does not count.
I am wrong if we get a 1h close below 763.04.
I will post the 24h result here, hit or miss. Market observation, not advice.
What else are you watching besides the BNB chart?
$BNB
Volume is at 0.75x its 20-hour average.
My read: more upside if an hourly candle closes above 763.04. A wick alone does not count.
I am wrong if we get a 1h close below 763.04.
I will post the 24h result here, hit or miss. Market observation, not advice.
What else are you watching besides the BNB chart?
$BNB
62


·
--
I’m keeping an eye on Hyperliquid (HYPE) +12% and Uniswap (UNI) +8% as they dominate the top‑10 spots. Bitcoin (BTC) still leads with a modest +3% gain, proving its resilience.
I’ve also spotted Cash Cat (CASHCAT) +15% and Pons (PONS) +9% climbing quickly, while Secret (SCRT) shows a steady +4% bounce.
Pudgy Penguins (PENGU) +7% and the under‑ranked token at #102, plus a surprise pop from the #142 token, keep the list fresh 🚀. I love watching these shifts!
$T, $FF, $T
I’m keeping an eye on Hyperliquid (HYPE) +12% and Uniswap (UNI) +8% as they dominate the top‑10 spots. Bitcoin (BTC) still leads with a modest +3% gain, proving its resilience.
I’ve also spotted Cash Cat (CASHCAT) +15% and Pons (PONS) +9% climbing quickly, while Secret (SCRT) shows a steady +4% bounce.
Pudgy Penguins (PENGU) +7% and the under‑ranked token at #102, plus a surprise pop from the #142 token, keep the list fresh 🚀. I love watching these shifts!
$T , $FF , $T
I’ve also spotted Cash Cat (CASHCAT) +15% and Pons (PONS) +9% climbing quickly, while Secret (SCRT) shows a steady +4% bounce.
Pudgy Penguins (PENGU) +7% and the under‑ranked token at #102, plus a surprise pop from the #142 token, keep the list fresh 🚀. I love watching these shifts!
$T , $FF , $T
526

·
--
ETH Slumps, NEAR Crashes – What’s Next?Cash Cat (CASHCATUSDT) is trending right now!
Rank: #142
ETH just fell 2.77% to ,387 – its biggest 24h drop in weeks. NEAR is the biggest loser, down 6.63% to .86, while SOL slipped 3.84% to 8.39. I see this as a short‑term shakeout; if
#bitcoin #ethereum #crypto
ETH Slumps, NEAR Crashes – What’s Next?
35

·
--
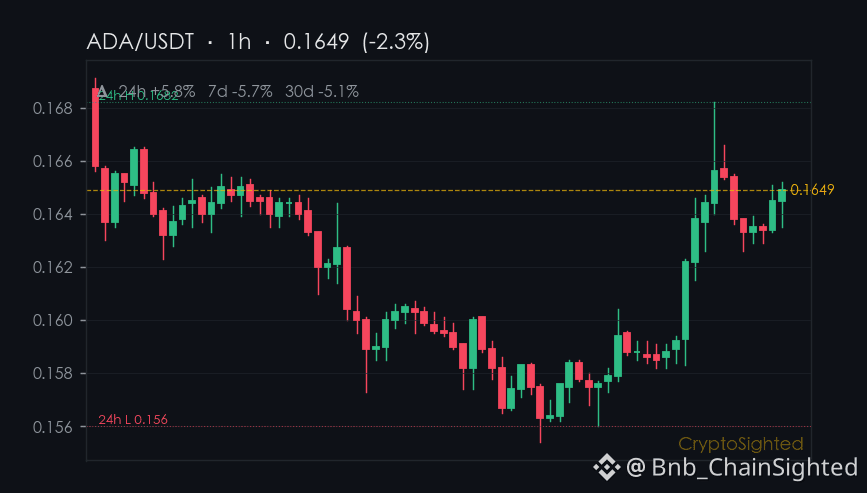
$ADA’s 24-hour surge of ↑5.8% stands out in a sea of red - while most coins are falling, it’s climbing.
ADA’s 24-hour price is now near $0.1651, hitting a high of $0.1682 and trading over 118 million tokens.
It’s moving, but not all the way. The 7-day dip suggests the broader narrative hasn’t shifted - just a short-term bounce.
The bigger picture: the crypto market is up 3.6% on the day, with $BTC and $ETH leading the charge.
But ADA’s path is different. It’s not following the same rhythm.
That divergence is worth watching - not just for what it says about ADA, but for what it might reveal about the broader market’s structure.
—
Not financial advice. DYOR.
📌 Hotspot Watch · #142 · #CryptoTrends #CryptoSighted $ADA
$ADA ’s 24-hour surge of ↑5.8% stands out in a sea of red - while most coins are falling, it’s climbing.
ADA’s 24-hour price is now near $0.1651, hitting a high of $0.1682 and trading over 118 million tokens.
It’s moving, but not all the way. The 7-day dip suggests the broader narrative hasn’t shifted - just a short-term bounce.
The bigger picture: the crypto market is up 3.6% on the day, with $BTC and $ETH leading the charge.
But ADA’s path is different. It’s not following the same rhythm.
That divergence is worth watching - not just for what it says about ADA, but for what it might reveal about the broader market’s structure.
—
Not financial advice. DYOR.
📌 Hotspot Watch · #142 · #CryptoTrends #CryptoSighted $ADA
ADA’s 24-hour price is now near $0.1651, hitting a high of $0.1682 and trading over 118 million tokens.
It’s moving, but not all the way. The 7-day dip suggests the broader narrative hasn’t shifted - just a short-term bounce.
The bigger picture: the crypto market is up 3.6% on the day, with $BTC and $ETH leading the charge.
But ADA’s path is different. It’s not following the same rhythm.
That divergence is worth watching - not just for what it says about ADA, but for what it might reveal about the broader market’s structure.
—
Not financial advice. DYOR.
📌 Hotspot Watch · #142 · #CryptoTrends #CryptoSighted $ADA
201

·
--
Funds don’t disappear out of thin air—they only leave traces on the charts.
Take a look at $MON ’s data over the past 30 days; the most unusual part is the volume spike from July 6 to July 7. Single-day volume surged to nearly $300 million, pulling the price out of the mud at $0.018 and up to $0.024. Currently, $MON has a market cap of about $260 million (#142), still 53% down from its ATH—but in recent trading, the price has held around $0.022 on declining volume.
This is a very typical structure of “impulse volume expansion + contraction while consolidating.” After moving onto Binance Futures, the liquidity premium has already been realized for a wave. After a huge turnover, the price has only dipped about 6% over the past week, suggesting that the earlier participating capital didn’t rush to dump. It looks more like they’re washing out short-term chips, trying to rebuild a higher price base.
But don’t get too optimistic—risk often hides in the cooling-off period. After the gigantic volume, the rapid drop in volume (daily trading volume has fallen back to the 30 million level) indicates that the ability of incoming buyers to absorb is weakening. If $MON can’t hold in the $0.022 range, and there’s no new narrative catalyst, then once it breaks below the prior breakout support, the abnormal move at the start of July will only amount to a short-term emotional spillover in a PVP.
The market always likes to play dead after going wild, and the real direction often forms while it’s “playing dead.” Do you think $MON ’s current volume contraction is smart money washing the market to build momentum, or just a mirage before the liquidity tide fully retreats? 📉
Funds don’t disappear out of thin air—they only leave traces on the charts.
Take a look at $MON ’s data over the past 30 days; the most unusual part is the volume spike from July 6 to July 7. Single-day volume surged to nearly $300 million, pulling the price out of the mud at $0.018 and up to $0.024. Currently, $MON has a market cap of about $260 million (#142), still 53% down from its ATH—but in recent trading, the price has held around $0.022 on declining volume.
This is a very typical structure of “impulse volume expansion + contraction while consolidating.” After moving onto Binance Futures, the liquidity premium has already been realized for a wave. After a huge turnover, the price has only dipped about 6% over the past week, suggesting that the earlier participating capital didn’t rush to dump. It looks more like they’re washing out short-term chips, trying to rebuild a higher price base.
But don’t get too optimistic—risk often hides in the cooling-off period. After the gigantic volume, the rapid drop in volume (daily trading volume has fallen back to the 30 million level) indicates that the ability of incoming buyers to absorb is weakening. If $MON can’t hold in the $0.022 range, and there’s no new narrative catalyst, then once it breaks below the prior breakout support, the abnormal move at the start of July will only amount to a short-term emotional spillover in a PVP.
The market always likes to play dead after going wild, and the real direction often forms while it’s “playing dead.” Do you think $MON ’s current volume contraction is smart money washing the market to build momentum, or just a mirage before the liquidity tide fully retreats? 📉
Take a look at $MON ’s data over the past 30 days; the most unusual part is the volume spike from July 6 to July 7. Single-day volume surged to nearly $300 million, pulling the price out of the mud at $0.018 and up to $0.024. Currently, $MON has a market cap of about $260 million (#142), still 53% down from its ATH—but in recent trading, the price has held around $0.022 on declining volume.
This is a very typical structure of “impulse volume expansion + contraction while consolidating.” After moving onto Binance Futures, the liquidity premium has already been realized for a wave. After a huge turnover, the price has only dipped about 6% over the past week, suggesting that the earlier participating capital didn’t rush to dump. It looks more like they’re washing out short-term chips, trying to rebuild a higher price base.
But don’t get too optimistic—risk often hides in the cooling-off period. After the gigantic volume, the rapid drop in volume (daily trading volume has fallen back to the 30 million level) indicates that the ability of incoming buyers to absorb is weakening. If $MON can’t hold in the $0.022 range, and there’s no new narrative catalyst, then once it breaks below the prior breakout support, the abnormal move at the start of July will only amount to a short-term emotional spillover in a PVP.
The market always likes to play dead after going wild, and the real direction often forms while it’s “playing dead.” Do you think $MON ’s current volume contraction is smart money washing the market to build momentum, or just a mirage before the liquidity tide fully retreats? 📉
3
144

·
--
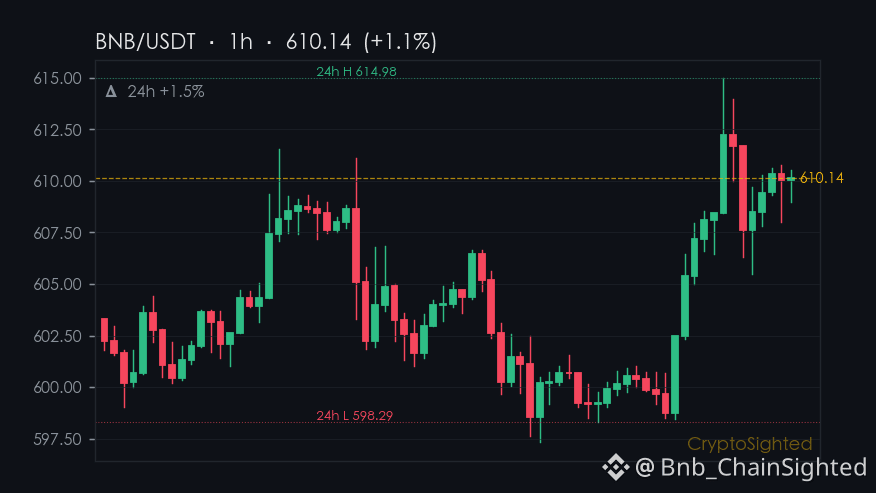
3.7% - a 7-day rise in $BNB’s derivatives positioning, but no move in price. What’s the story here?
BNB is currently sitting at $609.98, with a 1.55% gain in the last 24 hours, holding near its 24-hour range of $598.29 to $614.98.
The derivatives market shows a 3.7% increase in BNB’s contract positions over the past week - a sign of growing leverage exposure, but not yet reflected in spot price action.
The funding rate for BNB is currently at ↑0.0089%, indicating a balanced long/short dynamic.
However, the 21-period average funding rate has risen to ↑0.092%, suggesting a gradual increase in leverage costs - a potential warning sign for future volatility or liquidations.
This divergence between derivatives positioning and spot price is worth watching.
If the price fails to break above $614.98 soon, the rising leverage could signal a pullback.
—
Not financial advice. DYOR.
📌 Funding Pulse · #142 · #FundingRate #CryptoSighted $BNB
3.7% - a 7-day rise in $BNB ’s derivatives positioning, but no move in price. What’s the story here?
BNB is currently sitting at $609.98, with a 1.55% gain in the last 24 hours, holding near its 24-hour range of $598.29 to $614.98.
The derivatives market shows a 3.7% increase in BNB’s contract positions over the past week - a sign of growing leverage exposure, but not yet reflected in spot price action.
The funding rate for BNB is currently at ↑0.0089%, indicating a balanced long/short dynamic.
However, the 21-period average funding rate has risen to ↑0.092%, suggesting a gradual increase in leverage costs - a potential warning sign for future volatility or liquidations.
This divergence between derivatives positioning and spot price is worth watching.
If the price fails to break above $614.98 soon, the rising leverage could signal a pullback.
—
Not financial advice. DYOR.
📌 Funding Pulse · #142 · #FundingRate #CryptoSighted $BNB
BNB is currently sitting at $609.98, with a 1.55% gain in the last 24 hours, holding near its 24-hour range of $598.29 to $614.98.
The derivatives market shows a 3.7% increase in BNB’s contract positions over the past week - a sign of growing leverage exposure, but not yet reflected in spot price action.
The funding rate for BNB is currently at ↑0.0089%, indicating a balanced long/short dynamic.
However, the 21-period average funding rate has risen to ↑0.092%, suggesting a gradual increase in leverage costs - a potential warning sign for future volatility or liquidations.
This divergence between derivatives positioning and spot price is worth watching.
If the price fails to break above $614.98 soon, the rising leverage could signal a pullback.
—
Not financial advice. DYOR.
📌 Funding Pulse · #142 · #FundingRate #CryptoSighted $BNB
1
165
Log in to explore more content
Join global crypto users on Binance Square
⚡️ Get latest and useful information about crypto.
💬 Trusted by the world’s largest crypto exchange.
👍 Discover real insights from verified creators.
Email / Phone number
Trending Topics
1
#BitgetHackerFailsToMoveStolenFunds
116 views
52 Discussing
2
#BitMineETHHoldingsTop6Million
3,428 views
213 Discussing
3
#StrategyAdds1666BTCHoldingsReach847666
2,449 views
161 Discussing
4
#NvidiaApproves$150BBuyback
2,485 views
57 Discussing
5
#OpenAIDelaysGPT6.1OverSafetyIssues
14,137 views
486 Discussing
6
#AMDToAcquireWorldLabsFor$8.2B
1,272 views
47 Discussing
7
#AnthropicIPOProspectusCouldValueItOver$2T
4,302 views
73 Discussing
8
#HackersDrainOver12.4MXRPFromDCENTWallets
29,239 views
593 Discussing
9
#SECSaysDecentralizedTokenBuybacksNotInvestmentContracts
2,550 views
39 Discussing
10
#UKFCAWinsCourtOrderToRecover851400Pounds
85,455 views
1,433 Discussing