

320 WYATT
3.6k Beiträge

320 WYATT
Melden
Nutzer blockieren
An investment in knowledge pays the best interest📚📚 Technical Analysis 📊 Making Money 💰 Crypto Investor 💰 Technical Analysis Pro 📊 Market Research 💹
Trade eröffnen
Gelegenheitstrader
4.7 Jahre
0 Following
10.9K+ Follower
10.6K+ Like gegeben
Beiträge
Portfolio
Alle
Videos
Live
PINNED
·
--
Stimmt auf 10000 von euch an! Ich bin begeistert von der Unterstützung und freue mich auf das, was als Nächstes kommt. ❤️
#Trendingissue #mr320 #WriteToEarn2026 #100kUser #Binance320
Stimmt auf 10000 von euch an! Ich bin begeistert von der Unterstützung und freue mich auf das, was als Nächstes kommt. ❤️
#Trendingissue #mr320 #WriteToEarn2026 #100kUser #Binance320
#Trendingissue #mr320 #WriteToEarn2026 #100kUser #Binance320

2
7
145
·
--
Bullisch
$SHIB
{spot}(SHIBUSDT)
SHIB wurde am 27. September 2026 zu 0.00000598 $ gehandelt, was ungefähr 0.0000052 Euro entspricht. Die Zahl stammt aus dem CoinGecko-Marktsnapshot, der zu diesem Zeitpunkt aufgenommen wurde. In den vorangegangenen 24 Stunden bewegte sich der Kurs zwischen 0.00000582 $ und 0.00000606 $, ein Tagesgewinn von 0.16 Prozent. Die Marktkapitalisierung lag bei 3.486 Milliarden $, Rang 34 im Gesamtmarkt, bei einem Handelsvolumen von 84.5 Millionen $ innerhalb von 24 Stunden.
Die Lücke zwischen den Zeiträumen sagt mehr aus als der einzelne Tag. In sieben Tagen ist der Token um 9.46 Prozent gestiegen, in 30 Tagen um 10.71 Prozent und in 60 Tagen um 28.04 Prozent. Gemessen über ein ganzes Jahr liegt er jedoch 50.27 Prozent im Minus. SHIB hat sich aus einem tiefen Loch herausgearbeitet, ohne auch nur annähernd die Hälfte dessen zurückzuerobern, was es im Laufe des Jahres verloren hat.
Das Allzeithoch von 0.00008616 $ stammt vom 27. Oktober 2021. Der aktuelle Preis liegt rund 93 Prozent darunter. Damit SHIB dieses Hoch wieder erreicht, müsste sich der Preis verzehnzehnfachen. Bei unveränderter Umlaufmenge würde die Marktkapitalisierung dann bei ungefähr 50.7 Milliarden $ liegen. Nennen wir das eine Multiplikationsaufgabe. Sie zeigt die Größenordnung, die hinter einer scheinbar kleinen Zahl mit vielen Nullen steckt.
$SHIB #mr320 #Trendingissue #Trendingcoin320 #writetoearn2026
$SHIB
SHIB wurde am 27. September 2026 zu 0.00000598 $ gehandelt, was ungefähr 0.0000052 Euro entspricht. Die Zahl stammt aus dem CoinGecko-Marktsnapshot, der zu diesem Zeitpunkt aufgenommen wurde. In den vorangegangenen 24 Stunden bewegte sich der Kurs zwischen 0.00000582 $ und 0.00000606 $, ein Tagesgewinn von 0.16 Prozent. Die Marktkapitalisierung lag bei 3.486 Milliarden $, Rang 34 im Gesamtmarkt, bei einem Handelsvolumen von 84.5 Millionen $ innerhalb von 24 Stunden.
Die Lücke zwischen den Zeiträumen sagt mehr aus als der einzelne Tag. In sieben Tagen ist der Token um 9.46 Prozent gestiegen, in 30 Tagen um 10.71 Prozent und in 60 Tagen um 28.04 Prozent. Gemessen über ein ganzes Jahr liegt er jedoch 50.27 Prozent im Minus. SHIB hat sich aus einem tiefen Loch herausgearbeitet, ohne auch nur annähernd die Hälfte dessen zurückzuerobern, was es im Laufe des Jahres verloren hat.
Das Allzeithoch von 0.00008616 $ stammt vom 27. Oktober 2021. Der aktuelle Preis liegt rund 93 Prozent darunter. Damit SHIB dieses Hoch wieder erreicht, müsste sich der Preis verzehnzehnfachen. Bei unveränderter Umlaufmenge würde die Marktkapitalisierung dann bei ungefähr 50.7 Milliarden $ liegen. Nennen wir das eine Multiplikationsaufgabe. Sie zeigt die Größenordnung, die hinter einer scheinbar kleinen Zahl mit vielen Nullen steckt.
$SHIB #mr320 #Trendingissue #Trendingcoin320 #writetoearn2026
SHIB wurde am 27. September 2026 zu 0.00000598 $ gehandelt, was ungefähr 0.0000052 Euro entspricht. Die Zahl stammt aus dem CoinGecko-Marktsnapshot, der zu diesem Zeitpunkt aufgenommen wurde. In den vorangegangenen 24 Stunden bewegte sich der Kurs zwischen 0.00000582 $ und 0.00000606 $, ein Tagesgewinn von 0.16 Prozent. Die Marktkapitalisierung lag bei 3.486 Milliarden $, Rang 34 im Gesamtmarkt, bei einem Handelsvolumen von 84.5 Millionen $ innerhalb von 24 Stunden.
Die Lücke zwischen den Zeiträumen sagt mehr aus als der einzelne Tag. In sieben Tagen ist der Token um 9.46 Prozent gestiegen, in 30 Tagen um 10.71 Prozent und in 60 Tagen um 28.04 Prozent. Gemessen über ein ganzes Jahr liegt er jedoch 50.27 Prozent im Minus. SHIB hat sich aus einem tiefen Loch herausgearbeitet, ohne auch nur annähernd die Hälfte dessen zurückzuerobern, was es im Laufe des Jahres verloren hat.
Das Allzeithoch von 0.00008616 $ stammt vom 27. Oktober 2021. Der aktuelle Preis liegt rund 93 Prozent darunter. Damit SHIB dieses Hoch wieder erreicht, müsste sich der Preis verzehnzehnfachen. Bei unveränderter Umlaufmenge würde die Marktkapitalisierung dann bei ungefähr 50.7 Milliarden $ liegen. Nennen wir das eine Multiplikationsaufgabe. Sie zeigt die Größenordnung, die hinter einer scheinbar kleinen Zahl mit vielen Nullen steckt.
$SHIB #mr320 #Trendingissue #Trendingcoin320 #writetoearn2026

1
32
·
--
Bullisch
$ETH
{spot}(ETHUSDT)
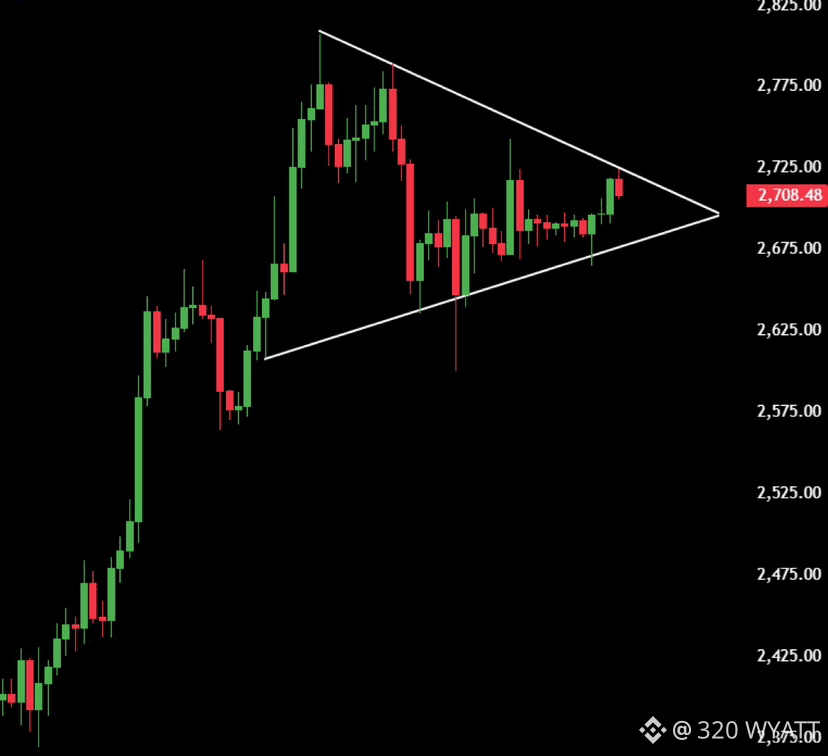
$ETH ist sehr nah an einem weiteren bullischen Ausbruch.
Ein 4H-Schlusskurs über $2,730 könnte ETH auf $3K🚀
#ETH320 #mr320 #Trendingissue #Trendingcoin320 #WriteToEarn2026
$ETH
$ETH ist sehr nah an einem weiteren bullischen Ausbruch.
Ein 4H-Schlusskurs über $2,730 könnte ETH auf $3K🚀
#ETH320 #mr320 #Trendingissue #Trendingcoin320 #WriteToEarn2026
$ETH ist sehr nah an einem weiteren bullischen Ausbruch.
Ein 4H-Schlusskurs über $2,730 könnte ETH auf $3K🚀
#ETH320 #mr320 #Trendingissue #Trendingcoin320 #WriteToEarn2026
56
·
--
Bullisch
$SOL
{spot}(SOLUSDT)
Solana (SOL) ist zum ersten Mal seit Januar über 120 USD gestiegen und hat in einer Woche rund 8% zugelegt, angetrieben von einer starken Marktdynamik. Der Anstieg folgt auf den Rollout des Alpenglow-Network-Upgrades auf Devnet, das darauf abzielt, die Transaktionsfinalität drastisch von 12,8 Sekunden auf 150 Millisekunden zu reduzieren und damit Geschwindigkeit und Effizienz zu erhöhen. Das institutionelle Interesse ist hoch: An der US-Börse gelistete Solana-ETFs verzeichneten mit 86,67 Millionen US-Dollar einen Rekord bei den Zuflüssen an einem einzigen Tag und brachten die gesamten ETF-Vermögenswerte auf 1,96 Milliarden US-Dollar. Auch die On-Chain-Kennzahlen deuten auf eine starke Aktivität hin, darunter eine stabile Marktkapitalisierung von 17,394 Milliarden US-Dollar und ein Spot-Handelsvolumen von Solana, das große Börsen wie Coinbase übertrifft. Marktbeobachter sehen 130 und 150 als entscheidende Widerstandsniveaus; ein Schlusskurs über 150 könnte deutlich höhere Kursziele auslösen.
#solana320 #Trendingcoin320 #Trendingissue #mr320 #writetoearn320
$SOL
Solana (SOL) ist zum ersten Mal seit Januar über 120 USD gestiegen und hat in einer Woche rund 8% zugelegt, angetrieben von einer starken Marktdynamik. Der Anstieg folgt auf den Rollout des Alpenglow-Network-Upgrades auf Devnet, das darauf abzielt, die Transaktionsfinalität drastisch von 12,8 Sekunden auf 150 Millisekunden zu reduzieren und damit Geschwindigkeit und Effizienz zu erhöhen. Das institutionelle Interesse ist hoch: An der US-Börse gelistete Solana-ETFs verzeichneten mit 86,67 Millionen US-Dollar einen Rekord bei den Zuflüssen an einem einzigen Tag und brachten die gesamten ETF-Vermögenswerte auf 1,96 Milliarden US-Dollar. Auch die On-Chain-Kennzahlen deuten auf eine starke Aktivität hin, darunter eine stabile Marktkapitalisierung von 17,394 Milliarden US-Dollar und ein Spot-Handelsvolumen von Solana, das große Börsen wie Coinbase übertrifft. Marktbeobachter sehen 130 und 150 als entscheidende Widerstandsniveaus; ein Schlusskurs über 150 könnte deutlich höhere Kursziele auslösen.
#solana320 #Trendingcoin320 #Trendingissue #mr320 #writetoearn320
Solana (SOL) ist zum ersten Mal seit Januar über 120 USD gestiegen und hat in einer Woche rund 8% zugelegt, angetrieben von einer starken Marktdynamik. Der Anstieg folgt auf den Rollout des Alpenglow-Network-Upgrades auf Devnet, das darauf abzielt, die Transaktionsfinalität drastisch von 12,8 Sekunden auf 150 Millisekunden zu reduzieren und damit Geschwindigkeit und Effizienz zu erhöhen. Das institutionelle Interesse ist hoch: An der US-Börse gelistete Solana-ETFs verzeichneten mit 86,67 Millionen US-Dollar einen Rekord bei den Zuflüssen an einem einzigen Tag und brachten die gesamten ETF-Vermögenswerte auf 1,96 Milliarden US-Dollar. Auch die On-Chain-Kennzahlen deuten auf eine starke Aktivität hin, darunter eine stabile Marktkapitalisierung von 17,394 Milliarden US-Dollar und ein Spot-Handelsvolumen von Solana, das große Börsen wie Coinbase übertrifft. Marktbeobachter sehen 130 und 150 als entscheidende Widerstandsniveaus; ein Schlusskurs über 150 könnte deutlich höhere Kursziele auslösen.
#solana320 #Trendingcoin320 #Trendingissue #mr320 #writetoearn320
1
64
·
--
Bullisch
$BTC
{spot}(BTCUSDT)
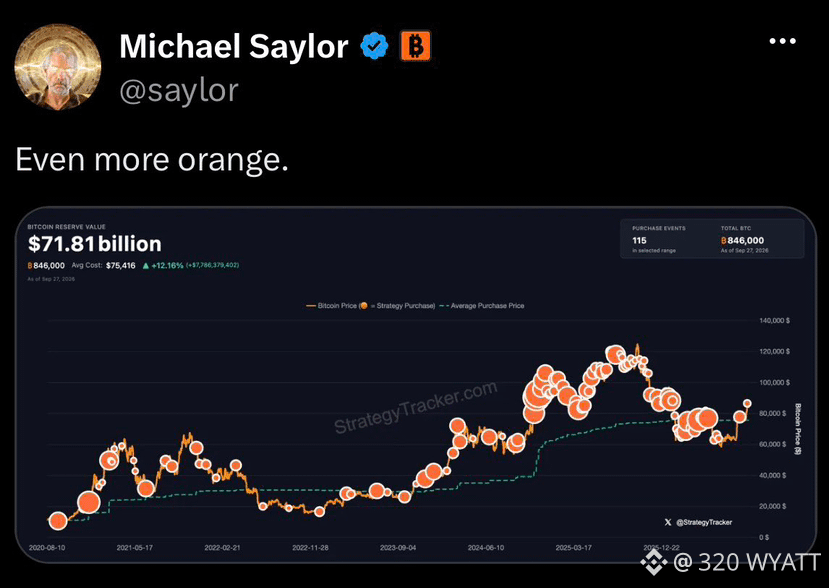
Saylor deutet an, dass er mehr Bitcoin kaufen wird 🔥
#BTC320 #Trendingcoin320 #Trendingissue #writetoearn320 #mr320
$BTC
Saylor deutet an, dass er mehr Bitcoin kaufen wird 🔥
#BTC320 #Trendingcoin320 #Trendingissue #writetoearn320 #mr320
Saylor deutet an, dass er mehr Bitcoin kaufen wird 🔥
#BTC320 #Trendingcoin320 #Trendingissue #writetoearn320 #mr320
74
·
--
Bullisch
$XRP
{spot}(XRPUSDT)
Ein symmetrisches Dreieck entsteht, wenn jeder Anstieg seinen Höhepunkt niedriger als der vorherige erreicht und jeder Rückgang seinen Tiefpunkt höher als der vorherige. So bilden sich zwei Trendlinien, die sich auf einen Punkt zubewegen. Die obere Trendlinie wirkt als Widerstand: Dort stoppen Verkäufer die Rallys. Die untere Linie dient als Unterstützung: Dort verhindern Käufer weitere Kursrückgänge. Ein Ausbruch erfolgt, wenn der Kurs eine dieser Linien durchbricht. Danach folgt ein Retest, bei dem geprüft wird, ob der frühere Widerstand nun als Unterstützung fungiert.
Die Dreiecksformation von XRP begann mit seinem Januar-2018-Hoch von 3,31 $. Die Rally im April 2021 erreichte ihren Höhepunkt bei 1,96 $ und traf dabei auf die obere Trendlinie, bevor XRP sie im November 2024 durchbrach – jedoch noch unter 1 $. Nach diesem Ausbruch stieg XRP im Juli 2025 auf ein Hoch von 3,65 $. Ein darauf folgender Bärenmarkt, der im August 2025 begann, drückte den Kurs jedoch bis August 2026 auf 0,98 $. Dort berührte er die alte Trendlinie und prallte wieder nach oben.
Diese Abfolge aus Ausbruch, anschließender Rally, Rücksetzer zur Linie und anschließender Erholung ist das klassische Muster. Der Anstieg bis 1,60 $ am 22. September beendete diese Sequenz. Der leichte Rückgang auf 1,55 $ gibt Anlass zur Sorge: Denn ein erneutes Schließen innerhalb des Dreiecks würde auf einen Fehlausbruch hindeuten und könnte späte Käufer in eine ungünstige Position bringen
#xrp320 #mr320 #Trendingissue #Trendingcoin320 #writetoearn320
$XRP
Ein symmetrisches Dreieck entsteht, wenn jeder Anstieg seinen Höhepunkt niedriger als der vorherige erreicht und jeder Rückgang seinen Tiefpunkt höher als der vorherige. So bilden sich zwei Trendlinien, die sich auf einen Punkt zubewegen. Die obere Trendlinie wirkt als Widerstand: Dort stoppen Verkäufer die Rallys. Die untere Linie dient als Unterstützung: Dort verhindern Käufer weitere Kursrückgänge. Ein Ausbruch erfolgt, wenn der Kurs eine dieser Linien durchbricht. Danach folgt ein Retest, bei dem geprüft wird, ob der frühere Widerstand nun als Unterstützung fungiert.
Die Dreiecksformation von XRP begann mit seinem Januar-2018-Hoch von 3,31 $. Die Rally im April 2021 erreichte ihren Höhepunkt bei 1,96 $ und traf dabei auf die obere Trendlinie, bevor XRP sie im November 2024 durchbrach – jedoch noch unter 1 $. Nach diesem Ausbruch stieg XRP im Juli 2025 auf ein Hoch von 3,65 $. Ein darauf folgender Bärenmarkt, der im August 2025 begann, drückte den Kurs jedoch bis August 2026 auf 0,98 $. Dort berührte er die alte Trendlinie und prallte wieder nach oben.
Diese Abfolge aus Ausbruch, anschließender Rally, Rücksetzer zur Linie und anschließender Erholung ist das klassische Muster. Der Anstieg bis 1,60 $ am 22. September beendete diese Sequenz. Der leichte Rückgang auf 1,55 $ gibt Anlass zur Sorge: Denn ein erneutes Schließen innerhalb des Dreiecks würde auf einen Fehlausbruch hindeuten und könnte späte Käufer in eine ungünstige Position bringen
#xrp320 #mr320 #Trendingissue #Trendingcoin320 #writetoearn320
Ein symmetrisches Dreieck entsteht, wenn jeder Anstieg seinen Höhepunkt niedriger als der vorherige erreicht und jeder Rückgang seinen Tiefpunkt höher als der vorherige. So bilden sich zwei Trendlinien, die sich auf einen Punkt zubewegen. Die obere Trendlinie wirkt als Widerstand: Dort stoppen Verkäufer die Rallys. Die untere Linie dient als Unterstützung: Dort verhindern Käufer weitere Kursrückgänge. Ein Ausbruch erfolgt, wenn der Kurs eine dieser Linien durchbricht. Danach folgt ein Retest, bei dem geprüft wird, ob der frühere Widerstand nun als Unterstützung fungiert.
Die Dreiecksformation von XRP begann mit seinem Januar-2018-Hoch von 3,31 $. Die Rally im April 2021 erreichte ihren Höhepunkt bei 1,96 $ und traf dabei auf die obere Trendlinie, bevor XRP sie im November 2024 durchbrach – jedoch noch unter 1 $. Nach diesem Ausbruch stieg XRP im Juli 2025 auf ein Hoch von 3,65 $. Ein darauf folgender Bärenmarkt, der im August 2025 begann, drückte den Kurs jedoch bis August 2026 auf 0,98 $. Dort berührte er die alte Trendlinie und prallte wieder nach oben.
Diese Abfolge aus Ausbruch, anschließender Rally, Rücksetzer zur Linie und anschließender Erholung ist das klassische Muster. Der Anstieg bis 1,60 $ am 22. September beendete diese Sequenz. Der leichte Rückgang auf 1,55 $ gibt Anlass zur Sorge: Denn ein erneutes Schließen innerhalb des Dreiecks würde auf einen Fehlausbruch hindeuten und könnte späte Käufer in eine ungünstige Position bringen
#xrp320 #mr320 #Trendingissue #Trendingcoin320 #writetoearn320
1
101
·
--
Bullisch
$BTC
{spot}(BTCUSDT)
Der Bitcoin-Dominanz ist der 11-wöchige Aufwärtstrend abhandengekommen.
BULLISCH FÜR ALTS.
#BTC320 #Trendingissue #Trendingcoin320 #mr320 #writetoearn320
$BTC
Der Bitcoin-Dominanz ist der 11-wöchige Aufwärtstrend abhandengekommen.
BULLISCH FÜR ALTS.
#BTC320 #Trendingissue #Trendingcoin320 #mr320 #writetoearn320
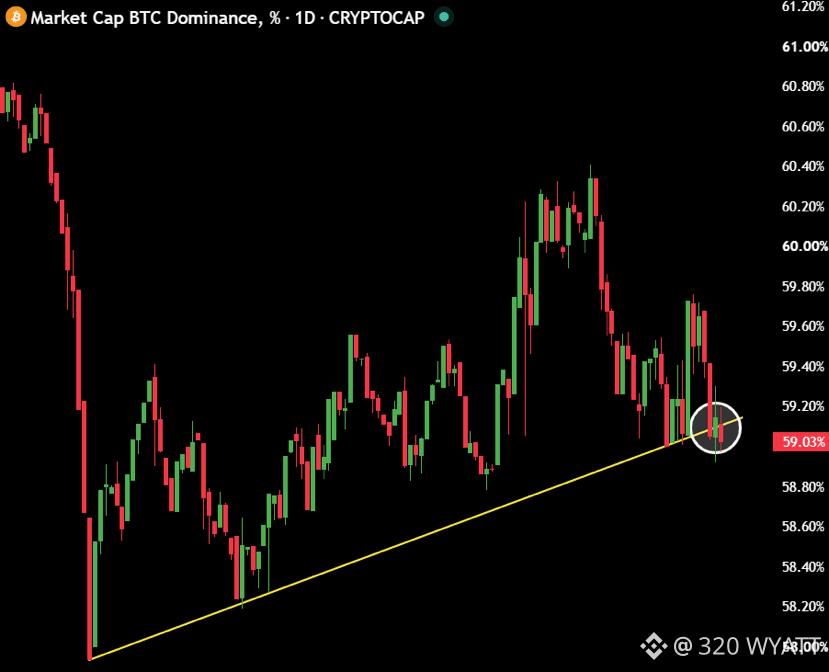
Der Bitcoin-Dominanz ist der 11-wöchige Aufwärtstrend abhandengekommen.
BULLISCH FÜR ALTS.
#BTC320 #Trendingissue #Trendingcoin320 #mr320 #writetoearn320
93
·
--
Bullisch
$BTC
{spot}(BTCUSDT)
Krypto steht kurz davor, GESICHTER zu SCHMELZEN.
Beim letzten Mal, als $BTC in einer mehrtägigen $1000-Spanne blieb, haben wir 15% gepumpt.
Sie wiederholen die Muster einfach immer wieder, und Menschen mit niedriger Intelligenz fallen darauf herein.
Jeder, der genau weiß, was gleich passieren wird, kauft mehr und bleibt geduldig.
LASS SIE DICH NICHT aus dem Markt schütteln, bevor die „Gott“-Kerzen passieren.
#BTC320 #Trendingcoin320 #Trendingissue #mr320 #btc
$BTC
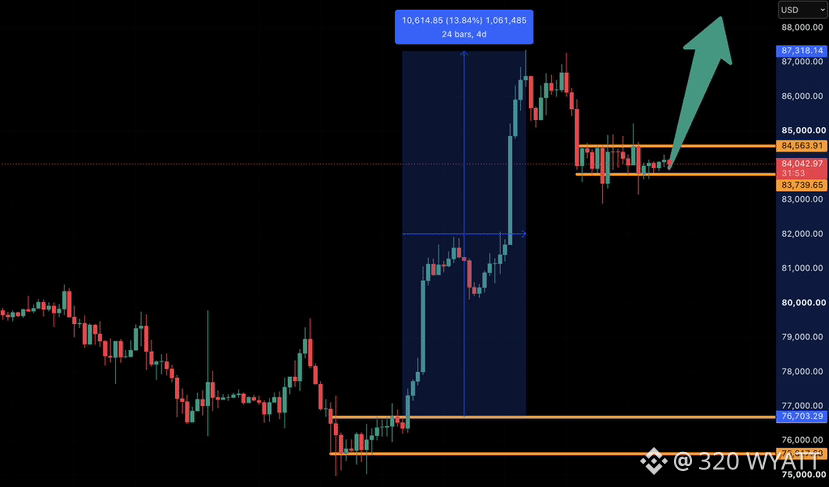
Krypto steht kurz davor, GESICHTER zu SCHMELZEN.
Beim letzten Mal, als $BTC in einer mehrtägigen $1000-Spanne blieb, haben wir 15% gepumpt.
Sie wiederholen die Muster einfach immer wieder, und Menschen mit niedriger Intelligenz fallen darauf herein.
Jeder, der genau weiß, was gleich passieren wird, kauft mehr und bleibt geduldig.
LASS SIE DICH NICHT aus dem Markt schütteln, bevor die „Gott“-Kerzen passieren.
#BTC320 #Trendingcoin320 #Trendingissue #mr320 #btc
Krypto steht kurz davor, GESICHTER zu SCHMELZEN.
Beim letzten Mal, als $BTC in einer mehrtägigen $1000-Spanne blieb, haben wir 15% gepumpt.
Sie wiederholen die Muster einfach immer wieder, und Menschen mit niedriger Intelligenz fallen darauf herein.
Jeder, der genau weiß, was gleich passieren wird, kauft mehr und bleibt geduldig.
LASS SIE DICH NICHT aus dem Markt schütteln, bevor die „Gott“-Kerzen passieren.
#BTC320 #Trendingcoin320 #Trendingissue #mr320 #btc
45
·
--
Bullisch
$XRP
{spot}(XRPUSDT)
XRP ist dabei, SCHMELZESCHWEREN GESICHTERN entgegenzusteuern.
$3.30 ist das erste Ziel.
Bist du dabei?
#xrp #xrp320 #Trendingcoin320 #mr320 #Trendingissue
$XRP
XRP ist dabei, SCHMELZESCHWEREN GESICHTERN entgegenzusteuern.
$3.30 ist das erste Ziel.
Bist du dabei?
#xrp #xrp320 #Trendingcoin320 #mr320 #Trendingissue
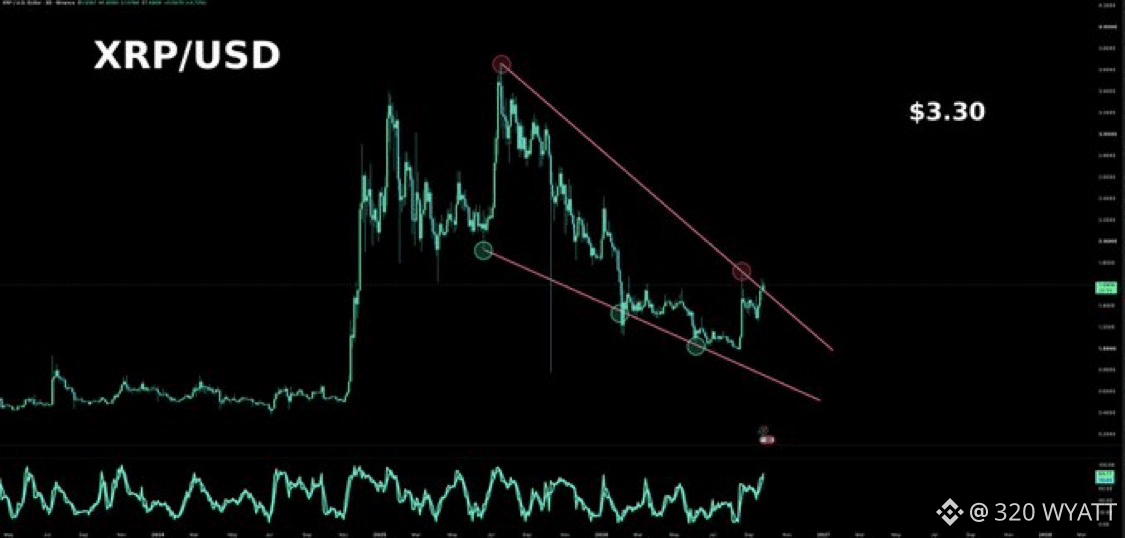
XRP ist dabei, SCHMELZESCHWEREN GESICHTERN entgegenzusteuern.
$3.30 ist das erste Ziel.
Bist du dabei?
#xrp #xrp320 #Trendingcoin320 #mr320 #Trendingissue
74
·
--
Bullisch
$XRP
{spot}(XRPUSDT)
Das XRP-Kursziel von 2 US-Dollar bis Ende 2026 stellt einen Zuwachs von 29 % gegenüber den Kursständen im späten September 2026 dar, impliziert jedoch eine Marktkapitalisierung von etwa 126 Milliarden US-Dollar, wofür eine erhebliche, dauerhaft anhaltende Nachfrage erforderlich ist. Obwohl XRP zuvor schon über 2 US-Dollar gehandelt wurde, erholt sich der Token von einem Rückgang von 48 % im Jahresvergleich, sodass ein Schlusskurs zum Jahresende bei 2 US-Dollar eher eine Erholung als die Fortsetzung eines Aufwärtstrends bedeutet. Neue XRP-ETFs in den USA von Grayscale und Bitwise verbessern den Zugang für Anleger, haben jedoch bislang nicht nachweislich genügend Zuflüsse, um die höhere Bewertung zu stützen. Zusätzlich haben sich die rechtlichen Probleme von Ripple zwar entspannt, aber fortlaufende Treuhand-/Escrow-Freigaben könnten das Angebot beeinflussen; damit ist das Kursziel von 2 US-Dollar zwar plausibel, erfordert jedoch eine starke Marktunterstützung.
#xrp320 #Trendingissue #xrp #Trendingcoin320 #SECKommissarinPeirceToLeaveOct2
$XRP
Das XRP-Kursziel von 2 US-Dollar bis Ende 2026 stellt einen Zuwachs von 29 % gegenüber den Kursständen im späten September 2026 dar, impliziert jedoch eine Marktkapitalisierung von etwa 126 Milliarden US-Dollar, wofür eine erhebliche, dauerhaft anhaltende Nachfrage erforderlich ist. Obwohl XRP zuvor schon über 2 US-Dollar gehandelt wurde, erholt sich der Token von einem Rückgang von 48 % im Jahresvergleich, sodass ein Schlusskurs zum Jahresende bei 2 US-Dollar eher eine Erholung als die Fortsetzung eines Aufwärtstrends bedeutet. Neue XRP-ETFs in den USA von Grayscale und Bitwise verbessern den Zugang für Anleger, haben jedoch bislang nicht nachweislich genügend Zuflüsse, um die höhere Bewertung zu stützen. Zusätzlich haben sich die rechtlichen Probleme von Ripple zwar entspannt, aber fortlaufende Treuhand-/Escrow-Freigaben könnten das Angebot beeinflussen; damit ist das Kursziel von 2 US-Dollar zwar plausibel, erfordert jedoch eine starke Marktunterstützung.
#xrp320 #Trendingissue #xrp #Trendingcoin320 #SECKommissarinPeirceToLeaveOct2
Das XRP-Kursziel von 2 US-Dollar bis Ende 2026 stellt einen Zuwachs von 29 % gegenüber den Kursständen im späten September 2026 dar, impliziert jedoch eine Marktkapitalisierung von etwa 126 Milliarden US-Dollar, wofür eine erhebliche, dauerhaft anhaltende Nachfrage erforderlich ist. Obwohl XRP zuvor schon über 2 US-Dollar gehandelt wurde, erholt sich der Token von einem Rückgang von 48 % im Jahresvergleich, sodass ein Schlusskurs zum Jahresende bei 2 US-Dollar eher eine Erholung als die Fortsetzung eines Aufwärtstrends bedeutet. Neue XRP-ETFs in den USA von Grayscale und Bitwise verbessern den Zugang für Anleger, haben jedoch bislang nicht nachweislich genügend Zuflüsse, um die höhere Bewertung zu stützen. Zusätzlich haben sich die rechtlichen Probleme von Ripple zwar entspannt, aber fortlaufende Treuhand-/Escrow-Freigaben könnten das Angebot beeinflussen; damit ist das Kursziel von 2 US-Dollar zwar plausibel, erfordert jedoch eine starke Marktunterstützung.
#xrp320 #Trendingissue #xrp #Trendingcoin320 #SECKommissarinPeirceToLeaveOct2
31
·
--
Bullisch
$SOL $ZEC
{spot}(ZECUSDT)
{spot}(SOLUSDT)
Händler auf den Prognosemärkten Polymarket und Kalshi setzen millionenfach darauf, ob Ethereum, Solana und Zcash bis Ende 2026 bestimmte Kursmarken erreichen. Ethereum hat eine 70%-Chance, $3.000 zu erreichen, Solana eine 60%-Chance, $140 zu erreichen, und Zcash eine 41%-Chance, $2.000 zu berühren – allerdings sind die Chancen geringer, dass diese Kryptowährungen das Jahr zu genau diesen Kursen beenden. Die Märkte unterscheiden zwischen einem kurzzeitigen Erreichen eines Kursniveaus und dem Halten bis zum Jahresende: Bei Kalshi richten sich die Kontrakte auf Schlusskurse, bei Polymarket auf jeden Kurs-Spike. Diese Aufteilung macht die Unsicherheit und die Volatilität der Kryptokurse deutlich, wenn das Jahr zu Ende geht – über $31 Millionen wurden allein in diese Ereignisse investiert. Anleger sollten beobachten, wie sich diese Prognosen in den letzten Monaten des Jahres 2026 entwickeln.
#solana #zec #CoinMarketCapCompletesCoinglassAcquisition #CircleMints500MUSDCOnSolana #PolymarketBankFailureBetsDrawFDICConcern
$SOL $ZEC
Händler auf den Prognosemärkten Polymarket und Kalshi setzen millionenfach darauf, ob Ethereum, Solana und Zcash bis Ende 2026 bestimmte Kursmarken erreichen. Ethereum hat eine 70%-Chance, $3.000 zu erreichen, Solana eine 60%-Chance, $140 zu erreichen, und Zcash eine 41%-Chance, $2.000 zu berühren – allerdings sind die Chancen geringer, dass diese Kryptowährungen das Jahr zu genau diesen Kursen beenden. Die Märkte unterscheiden zwischen einem kurzzeitigen Erreichen eines Kursniveaus und dem Halten bis zum Jahresende: Bei Kalshi richten sich die Kontrakte auf Schlusskurse, bei Polymarket auf jeden Kurs-Spike. Diese Aufteilung macht die Unsicherheit und die Volatilität der Kryptokurse deutlich, wenn das Jahr zu Ende geht – über $31 Millionen wurden allein in diese Ereignisse investiert. Anleger sollten beobachten, wie sich diese Prognosen in den letzten Monaten des Jahres 2026 entwickeln.
#solana #zec #CoinMarketCapCompletesCoinglassAcquisition #CircleMints500MUSDCOnSolana #PolymarketBankFailureBetsDrawFDICConcern
Händler auf den Prognosemärkten Polymarket und Kalshi setzen millionenfach darauf, ob Ethereum, Solana und Zcash bis Ende 2026 bestimmte Kursmarken erreichen. Ethereum hat eine 70%-Chance, $3.000 zu erreichen, Solana eine 60%-Chance, $140 zu erreichen, und Zcash eine 41%-Chance, $2.000 zu berühren – allerdings sind die Chancen geringer, dass diese Kryptowährungen das Jahr zu genau diesen Kursen beenden. Die Märkte unterscheiden zwischen einem kurzzeitigen Erreichen eines Kursniveaus und dem Halten bis zum Jahresende: Bei Kalshi richten sich die Kontrakte auf Schlusskurse, bei Polymarket auf jeden Kurs-Spike. Diese Aufteilung macht die Unsicherheit und die Volatilität der Kryptokurse deutlich, wenn das Jahr zu Ende geht – über $31 Millionen wurden allein in diese Ereignisse investiert. Anleger sollten beobachten, wie sich diese Prognosen in den letzten Monaten des Jahres 2026 entwickeln.
#solana #zec #CoinMarketCapCompletesCoinglassAcquisition #CircleMints500MUSDCOnSolana #PolymarketBankFailureBetsDrawFDICConcern
110
·
--
Bullisch
$BTC
{spot}(BTCUSDT)
Der Preis von Bitcoin ist seit 280 aufeinanderfolgenden Tagen unter den geschätzten durchschnittlichen Produktionskosten von etwa 85.000 US-Dollar geblieben und hat ihn nur diese Woche kurzzeitig überschritten. Diese lange Phase niedriger Preise setzt Miner unter Druck, entweder mehr Bitcoin zu verkaufen, die Ausrüstung herunterzufahren oder den Markt zu verlassen. Als Reaktion verlagern sich Miner zu günstigeren Stromquellen, nehmen ineffiziente Maschinen außer Betrieb und einige verlagern Ressourcen in die KI-Rechenleistung, die stabilere Einnahmen verspricht. Die Mining-Schwierigkeit und die Netzwerk-Rechenleistung sind beide zurückgegangen; die nächste Anpassung der Schwierigkeit wird voraussichtlich am 4. Oktober die Schwierigkeit um etwa 3,4% senken und damit die Bedingungen beim Mining möglicherweise erleichtern.
#BTC320 #Trendingissue #Trendingcoin320 #btc #mr320
$BTC
Der Preis von Bitcoin ist seit 280 aufeinanderfolgenden Tagen unter den geschätzten durchschnittlichen Produktionskosten von etwa 85.000 US-Dollar geblieben und hat ihn nur diese Woche kurzzeitig überschritten. Diese lange Phase niedriger Preise setzt Miner unter Druck, entweder mehr Bitcoin zu verkaufen, die Ausrüstung herunterzufahren oder den Markt zu verlassen. Als Reaktion verlagern sich Miner zu günstigeren Stromquellen, nehmen ineffiziente Maschinen außer Betrieb und einige verlagern Ressourcen in die KI-Rechenleistung, die stabilere Einnahmen verspricht. Die Mining-Schwierigkeit und die Netzwerk-Rechenleistung sind beide zurückgegangen; die nächste Anpassung der Schwierigkeit wird voraussichtlich am 4. Oktober die Schwierigkeit um etwa 3,4% senken und damit die Bedingungen beim Mining möglicherweise erleichtern.
#BTC320 #Trendingissue #Trendingcoin320 #btc #mr320
Der Preis von Bitcoin ist seit 280 aufeinanderfolgenden Tagen unter den geschätzten durchschnittlichen Produktionskosten von etwa 85.000 US-Dollar geblieben und hat ihn nur diese Woche kurzzeitig überschritten. Diese lange Phase niedriger Preise setzt Miner unter Druck, entweder mehr Bitcoin zu verkaufen, die Ausrüstung herunterzufahren oder den Markt zu verlassen. Als Reaktion verlagern sich Miner zu günstigeren Stromquellen, nehmen ineffiziente Maschinen außer Betrieb und einige verlagern Ressourcen in die KI-Rechenleistung, die stabilere Einnahmen verspricht. Die Mining-Schwierigkeit und die Netzwerk-Rechenleistung sind beide zurückgegangen; die nächste Anpassung der Schwierigkeit wird voraussichtlich am 4. Oktober die Schwierigkeit um etwa 3,4% senken und damit die Bedingungen beim Mining möglicherweise erleichtern.
#BTC320 #Trendingissue #Trendingcoin320 #btc #mr320

30
·
--
Bullisch
$XRP
{spot}(XRPUSDT)
🚨Was XRP tun müsste, um $30 zu erreichen🚨
Das $30-Ziel ist nicht Egrags nächster Halt für XRP. Es liegt am Ende einer langfristigen bullischen Roadmap und würde einen Anstieg von ungefähr 2.620% erfordern – oder mehr als das 27-Fache – von der $1,47-Region des Charts.
Zuerst müsste XRP einen Verlust von $1,47 vermeiden und dann entschlossen über $1,65 ausbrechen, nahe seinem 33-Monats-Durchschnitt.
Von dort aus zeigt Egrags Chart mehrere große Hürden: $3 und $5,50 tauchen auf, bevor die größeren Ziele von $7,50, $13 und $30 kommen.
#xrp320 #mr320 #Trendingissue #WriteToEarn2026 #Trendingcoin320
$XRP
🚨Was XRP tun müsste, um $30 zu erreichen🚨
Das $30-Ziel ist nicht Egrags nächster Halt für XRP. Es liegt am Ende einer langfristigen bullischen Roadmap und würde einen Anstieg von ungefähr 2.620% erfordern – oder mehr als das 27-Fache – von der $1,47-Region des Charts.
Zuerst müsste XRP einen Verlust von $1,47 vermeiden und dann entschlossen über $1,65 ausbrechen, nahe seinem 33-Monats-Durchschnitt.
Von dort aus zeigt Egrags Chart mehrere große Hürden: $3 und $5,50 tauchen auf, bevor die größeren Ziele von $7,50, $13 und $30 kommen.
#xrp320 #mr320 #Trendingissue #WriteToEarn2026 #Trendingcoin320
🚨Was XRP tun müsste, um $30 zu erreichen🚨
Das $30-Ziel ist nicht Egrags nächster Halt für XRP. Es liegt am Ende einer langfristigen bullischen Roadmap und würde einen Anstieg von ungefähr 2.620% erfordern – oder mehr als das 27-Fache – von der $1,47-Region des Charts.
Zuerst müsste XRP einen Verlust von $1,47 vermeiden und dann entschlossen über $1,65 ausbrechen, nahe seinem 33-Monats-Durchschnitt.
Von dort aus zeigt Egrags Chart mehrere große Hürden: $3 und $5,50 tauchen auf, bevor die größeren Ziele von $7,50, $13 und $30 kommen.
#xrp320 #mr320 #Trendingissue #WriteToEarn2026 #Trendingcoin320
57
·
--
Bullisch
$BTC $XAUT
{future}(XAUTUSDT)
{spot}(BTCUSDT)
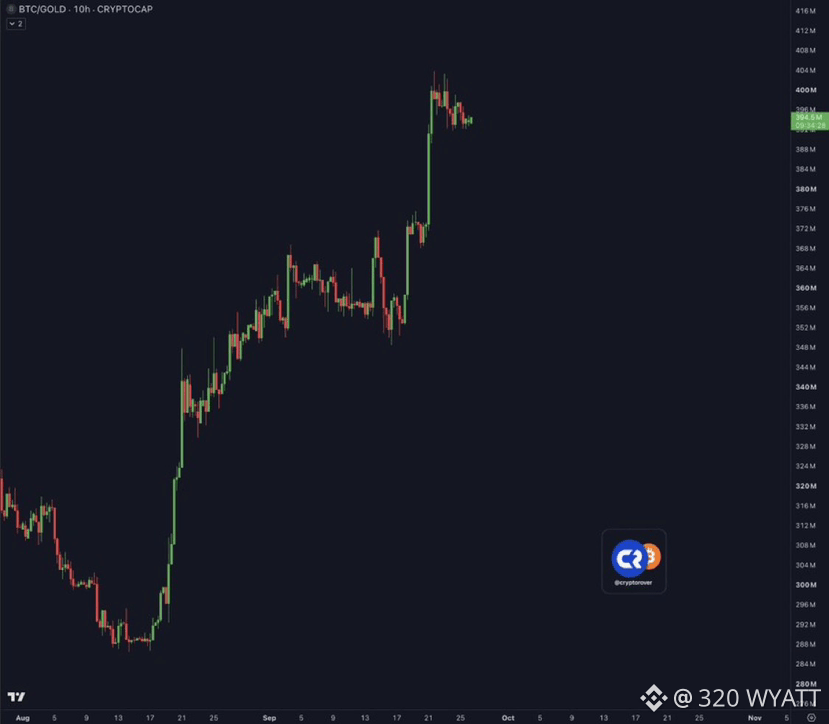
Bitcoin ist STEIGEND im Vergleich zu GOLD!
Es gibt kein zweites Bestes. 🔥
#BTC320 #btc #Trendingcoin320 #mr320 #Trendingissue
$BTC $XAUT
Bitcoin ist STEIGEND im Vergleich zu GOLD!
Es gibt kein zweites Bestes. 🔥
#BTC320 #btc #Trendingcoin320 #mr320 #Trendingissue
Bitcoin ist STEIGEND im Vergleich zu GOLD!
Es gibt kein zweites Bestes. 🔥
#BTC320 #btc #Trendingcoin320 #mr320 #Trendingissue
98
·
--
Bullisch
$ZEC $UNI $SOL
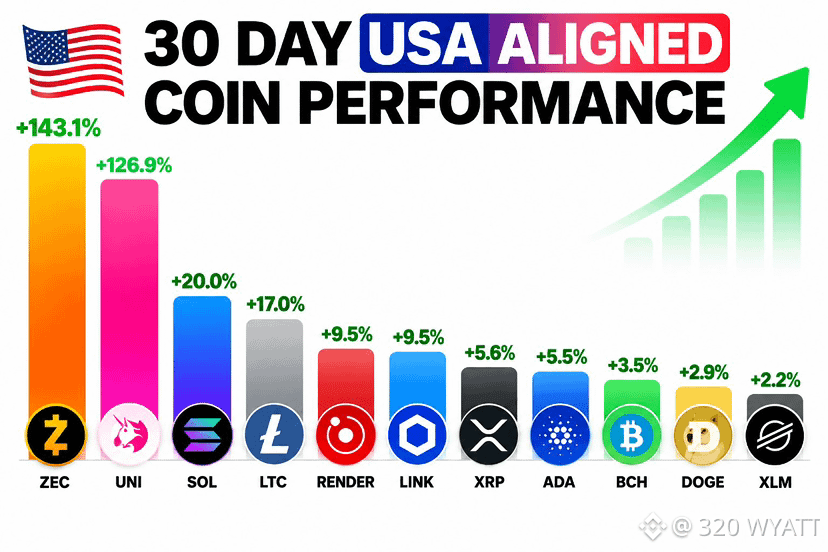
🐋 WHALE WATCH: ZEC rauf um 143%. UNI rauf um 127%. Alles andere auf dieser Liste ist zwar grün ausgefallen, aber in einer ganz anderen Größenordnung.
30-Tage-Performance der USA-ausgerichteten Coins:
=> $ZEC: +143,1%
=> $UNI: +126,9%
=> $SOL: +20,0%
=> $LTC: +17,0%
=> $RENDER: +7,4%
=> $LINK: +9,5%
=> $XRP: +5,6%
=> $ADA: +5,5%
=> $BCH: +3,5%
=> $DOGE: +2,9%
=> $XLM: +2,2%
Eine Privacy-Coin und ein DeFi-Bluechip verdoppeln sich, während Large Caps und Zahlungstokens im einstelligen Bereich bleiben – das sagt dir, dass das keine breite Marktbewegung war. Kapital jagte konkrete Katalysatoren. ZEC und UNI hatten sie. Der Rest nicht.
#zec #Trendingcoin320 #solana320 #BinanceSquare #mr320
{spot}(SOLUSDT)
{spot}(UNIUSDT)
{spot}(ZECUSDT)
$ZEC $UNI $SOL
🐋 WHALE WATCH: ZEC rauf um 143%. UNI rauf um 127%. Alles andere auf dieser Liste ist zwar grün ausgefallen, aber in einer ganz anderen Größenordnung.
30-Tage-Performance der USA-ausgerichteten Coins:
=> $ZEC : +143,1%
=> $UNI : +126,9%
=> $SOL : +20,0%
=> $LTC: +17,0%
=> $RENDER: +7,4%
=> $LINK: +9,5%
=> $XRP: +5,6%
=> $ADA: +5,5%
=> $BCH: +3,5%
=> $DOGE: +2,9%
=> $XLM: +2,2%
Eine Privacy-Coin und ein DeFi-Bluechip verdoppeln sich, während Large Caps und Zahlungstokens im einstelligen Bereich bleiben – das sagt dir, dass das keine breite Marktbewegung war. Kapital jagte konkrete Katalysatoren. ZEC und UNI hatten sie. Der Rest nicht.
#zec #Trendingcoin320 #solana320 #BinanceSquare #mr320
🐋 WHALE WATCH: ZEC rauf um 143%. UNI rauf um 127%. Alles andere auf dieser Liste ist zwar grün ausgefallen, aber in einer ganz anderen Größenordnung.
30-Tage-Performance der USA-ausgerichteten Coins:
=> $ZEC : +143,1%
=> $UNI : +126,9%
=> $SOL : +20,0%
=> $LTC: +17,0%
=> $RENDER: +7,4%
=> $LINK: +9,5%
=> $XRP: +5,6%
=> $ADA: +5,5%
=> $BCH: +3,5%
=> $DOGE: +2,9%
=> $XLM: +2,2%
Eine Privacy-Coin und ein DeFi-Bluechip verdoppeln sich, während Large Caps und Zahlungstokens im einstelligen Bereich bleiben – das sagt dir, dass das keine breite Marktbewegung war. Kapital jagte konkrete Katalysatoren. ZEC und UNI hatten sie. Der Rest nicht.
#zec #Trendingcoin320 #solana320 #BinanceSquare #mr320
67
·
--
Bullisch
$XRP
{spot}(XRPUSDT)
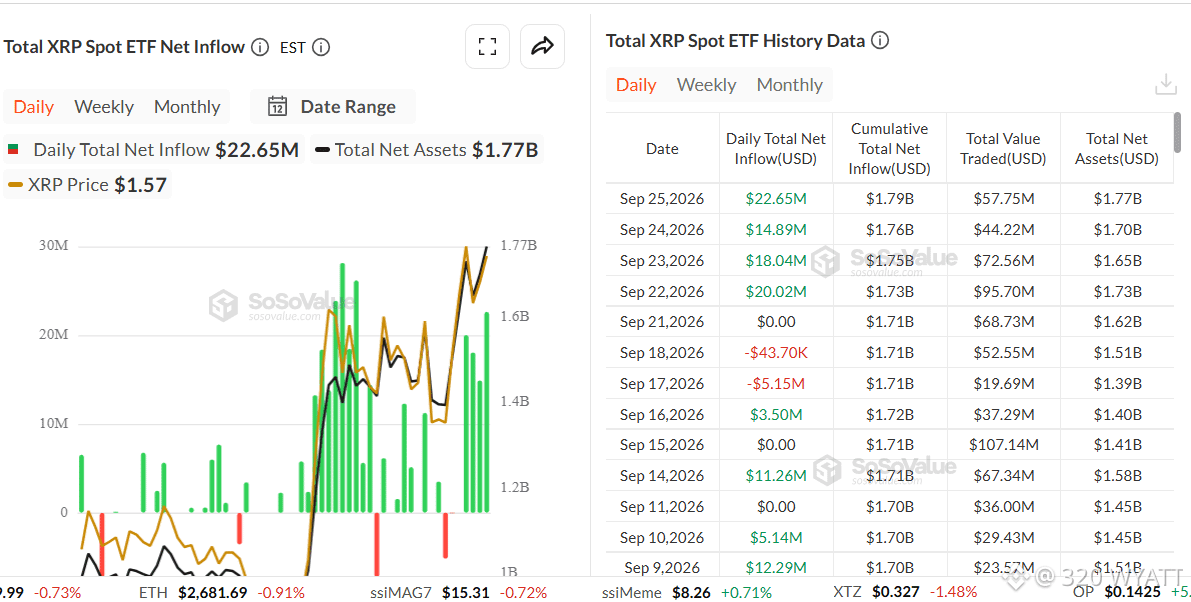
🚨XRP-ETFs ziehen 22,65 Millionen US-Dollar an, da Bitwise Zuflüsse anführt🚨
Die fünf US-amerikanischen Spot-XRP-ETFs verzeichneten am 25. September laut SoSoValue Nettozuflüsse in Höhe von 22,65 Millionen US-Dollar. Bitwise führte mit 18,39 Millionen US-Dollar und machte damit rund 81 % des täglichen Gesamtvolumens aus. Franklin Templetons XRPZ folgte mit 4,26 Millionen US-Dollar, während drei weitere Produkte keine Netto-Bewegung aufwiesen.
Die Zuwächse hoben die kumulierten Nettozuflüsse auf 1,79 Milliarden US-Dollar und die kombinierten Nettovermögenswerte auf 1,77 Milliarden US-Dollar. Die Gesamtanlagen entsprachen 1,80 % der Marktkapitalisierung von XRP. Der Handelswert über die fünf Produkte hinweg erreichte 57,75 Millionen US-Dollar, einschließlich 37,07 Millionen US-Dollar von Bitwise.
#xrp320 #mr320 #Trendingissue #writetoearn320 #Trendingcoin320
$XRP
🚨XRP-ETFs ziehen 22,65 Millionen US-Dollar an, da Bitwise Zuflüsse anführt🚨
Die fünf US-amerikanischen Spot-XRP-ETFs verzeichneten am 25. September laut SoSoValue Nettozuflüsse in Höhe von 22,65 Millionen US-Dollar. Bitwise führte mit 18,39 Millionen US-Dollar und machte damit rund 81 % des täglichen Gesamtvolumens aus. Franklin Templetons XRPZ folgte mit 4,26 Millionen US-Dollar, während drei weitere Produkte keine Netto-Bewegung aufwiesen.
Die Zuwächse hoben die kumulierten Nettozuflüsse auf 1,79 Milliarden US-Dollar und die kombinierten Nettovermögenswerte auf 1,77 Milliarden US-Dollar. Die Gesamtanlagen entsprachen 1,80 % der Marktkapitalisierung von XRP. Der Handelswert über die fünf Produkte hinweg erreichte 57,75 Millionen US-Dollar, einschließlich 37,07 Millionen US-Dollar von Bitwise.
#xrp320 #mr320 #Trendingissue #writetoearn320 #Trendingcoin320
🚨XRP-ETFs ziehen 22,65 Millionen US-Dollar an, da Bitwise Zuflüsse anführt🚨
Die fünf US-amerikanischen Spot-XRP-ETFs verzeichneten am 25. September laut SoSoValue Nettozuflüsse in Höhe von 22,65 Millionen US-Dollar. Bitwise führte mit 18,39 Millionen US-Dollar und machte damit rund 81 % des täglichen Gesamtvolumens aus. Franklin Templetons XRPZ folgte mit 4,26 Millionen US-Dollar, während drei weitere Produkte keine Netto-Bewegung aufwiesen.
Die Zuwächse hoben die kumulierten Nettozuflüsse auf 1,79 Milliarden US-Dollar und die kombinierten Nettovermögenswerte auf 1,77 Milliarden US-Dollar. Die Gesamtanlagen entsprachen 1,80 % der Marktkapitalisierung von XRP. Der Handelswert über die fünf Produkte hinweg erreichte 57,75 Millionen US-Dollar, einschließlich 37,07 Millionen US-Dollar von Bitwise.
#xrp320 #mr320 #Trendingissue #writetoearn320 #Trendingcoin320
212
·
--
$SHIB
{spot}(SHIBUSDT)
Shiba Inu (SHIB) verzeichnete innerhalb von acht Stunden einen dramatischen Anstieg der kurzfristigen Aktivität um 351 %, was auf eine erhöhte Marktvolatilität hindeutet. Der Preis stabilisierte sich nach einem jüngsten Rückgang bei etwa 0,00000589 US-Dollar, wobei SHIB seinen gleitenden 200-Tage-Durchschnitt übertraf und damit auf eine mögliche bullische Unterstützung hindeutet. Trotz allem bleibt der Kursimpuls instabil: Es sind erhebliche Preisschwankungen zu erwarten, da die wichtigen Widerstandsniveaus bei 0,0000060 US-Dollar sowie 0,0000062–0,0000063 US-Dollar entscheidend für weitere Gewinne sind. Wenn SHIB unter den 200-Tage-Durchschnitt fällt, könnten Unterstützungsniveaus nahe 0,0000054 US-Dollar und 0,0000051–0,0000052 US-Dollar in den Fokus rücken.
#shib320 #mr320 #Trendingissue #Trendingcoin320 #writetoearn320
$SHIB
Shiba Inu (SHIB) verzeichnete innerhalb von acht Stunden einen dramatischen Anstieg der kurzfristigen Aktivität um 351 %, was auf eine erhöhte Marktvolatilität hindeutet. Der Preis stabilisierte sich nach einem jüngsten Rückgang bei etwa 0,00000589 US-Dollar, wobei SHIB seinen gleitenden 200-Tage-Durchschnitt übertraf und damit auf eine mögliche bullische Unterstützung hindeutet. Trotz allem bleibt der Kursimpuls instabil: Es sind erhebliche Preisschwankungen zu erwarten, da die wichtigen Widerstandsniveaus bei 0,0000060 US-Dollar sowie 0,0000062–0,0000063 US-Dollar entscheidend für weitere Gewinne sind. Wenn SHIB unter den 200-Tage-Durchschnitt fällt, könnten Unterstützungsniveaus nahe 0,0000054 US-Dollar und 0,0000051–0,0000052 US-Dollar in den Fokus rücken.
#shib320 #mr320 #Trendingissue #Trendingcoin320 #writetoearn320
Shiba Inu (SHIB) verzeichnete innerhalb von acht Stunden einen dramatischen Anstieg der kurzfristigen Aktivität um 351 %, was auf eine erhöhte Marktvolatilität hindeutet. Der Preis stabilisierte sich nach einem jüngsten Rückgang bei etwa 0,00000589 US-Dollar, wobei SHIB seinen gleitenden 200-Tage-Durchschnitt übertraf und damit auf eine mögliche bullische Unterstützung hindeutet. Trotz allem bleibt der Kursimpuls instabil: Es sind erhebliche Preisschwankungen zu erwarten, da die wichtigen Widerstandsniveaus bei 0,0000060 US-Dollar sowie 0,0000062–0,0000063 US-Dollar entscheidend für weitere Gewinne sind. Wenn SHIB unter den 200-Tage-Durchschnitt fällt, könnten Unterstützungsniveaus nahe 0,0000054 US-Dollar und 0,0000051–0,0000052 US-Dollar in den Fokus rücken.
#shib320 #mr320 #Trendingissue #Trendingcoin320 #writetoearn320

22
·
--
Bullisch
$PEPE
{spot}(PEPEUSDT)
🚨Der 12%ige PEPE-Rückgang zeigt die andere Seite eines heißen Meme-Rallys🚨
PEPE stieg nach einer starken mehrtägigen Aufwärtsbewegung in die Konsolidierung ein. Ein Marktupdate vom 24. September brachte seinen Wochengewinn auf etwa 27%, selbst nachdem es am selben Tag stark gefallen war. Derweil war das Open Interest von rund 400 Millionen US-Dollar auf 334 Millionen US-Dollar gesunken, während die Dynamik nachließ. Gewinnmitnahmen nach der Rally waren ein wesentlicher Teil des Drucks. PEPE blieb für die Woche trotz des Abverkaufs deutlich im Plus.
Das ändert jedoch nichts daran, dass PEPE in der Meme-Coin-Diskussion bleibt. Es zeigt, dass der Handel eine Phase erreicht hat, in der frühe Inhaber Gewinne mitnehmen können, wenn der Kurs hart nach oben läuft – und zwar gegenüber neuen Käufern. Das öffentliche Chart ist bereits da, die Community kennt den Namen, und jede Rally gibt profitablen Inhabern eine weitere Gelegenheit, auszusteigen und ihre Positionen auszucashen.
#pepe320 #mr320 #Trendingissue #WriteToEarn2026 #Trendingcoin320
$PEPE
🚨Der 12%ige PEPE-Rückgang zeigt die andere Seite eines heißen Meme-Rallys🚨
PEPE stieg nach einer starken mehrtägigen Aufwärtsbewegung in die Konsolidierung ein. Ein Marktupdate vom 24. September brachte seinen Wochengewinn auf etwa 27%, selbst nachdem es am selben Tag stark gefallen war. Derweil war das Open Interest von rund 400 Millionen US-Dollar auf 334 Millionen US-Dollar gesunken, während die Dynamik nachließ. Gewinnmitnahmen nach der Rally waren ein wesentlicher Teil des Drucks. PEPE blieb für die Woche trotz des Abverkaufs deutlich im Plus.
Das ändert jedoch nichts daran, dass PEPE in der Meme-Coin-Diskussion bleibt. Es zeigt, dass der Handel eine Phase erreicht hat, in der frühe Inhaber Gewinne mitnehmen können, wenn der Kurs hart nach oben läuft – und zwar gegenüber neuen Käufern. Das öffentliche Chart ist bereits da, die Community kennt den Namen, und jede Rally gibt profitablen Inhabern eine weitere Gelegenheit, auszusteigen und ihre Positionen auszucashen.
#pepe320 #mr320 #Trendingissue #WriteToEarn2026 #Trendingcoin320
🚨Der 12%ige PEPE-Rückgang zeigt die andere Seite eines heißen Meme-Rallys🚨
PEPE stieg nach einer starken mehrtägigen Aufwärtsbewegung in die Konsolidierung ein. Ein Marktupdate vom 24. September brachte seinen Wochengewinn auf etwa 27%, selbst nachdem es am selben Tag stark gefallen war. Derweil war das Open Interest von rund 400 Millionen US-Dollar auf 334 Millionen US-Dollar gesunken, während die Dynamik nachließ. Gewinnmitnahmen nach der Rally waren ein wesentlicher Teil des Drucks. PEPE blieb für die Woche trotz des Abverkaufs deutlich im Plus.
Das ändert jedoch nichts daran, dass PEPE in der Meme-Coin-Diskussion bleibt. Es zeigt, dass der Handel eine Phase erreicht hat, in der frühe Inhaber Gewinne mitnehmen können, wenn der Kurs hart nach oben läuft – und zwar gegenüber neuen Käufern. Das öffentliche Chart ist bereits da, die Community kennt den Namen, und jede Rally gibt profitablen Inhabern eine weitere Gelegenheit, auszusteigen und ihre Positionen auszucashen.
#pepe320 #mr320 #Trendingissue #WriteToEarn2026 #Trendingcoin320
17
·
--
Bullisch
$XRP
{spot}(XRPUSDT)
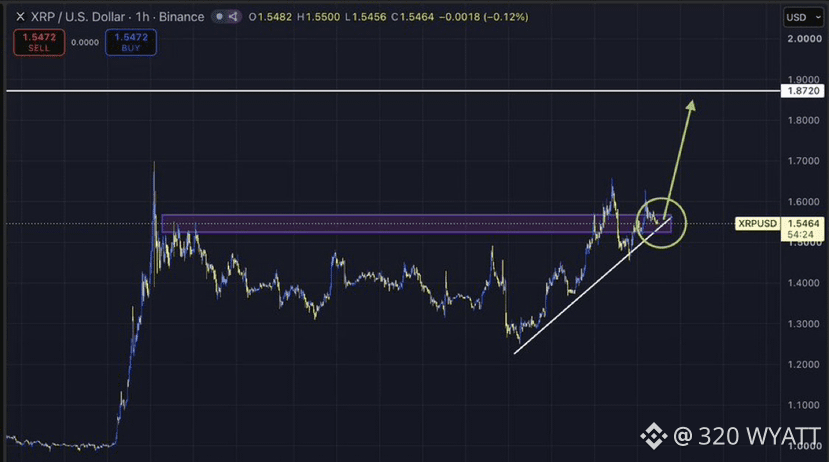
Ich würde mich wundern, wenn wir nicht so eine Bewegung wie diese von $XRP über das Wochenende sehen.
$1.80+ ist an der Reihe.
Pamp it 🟢
#xrp320 #mr320 #Trendingcoin320 #Trendingissue #WriteToEarn2026
$XRP
Ich würde mich wundern, wenn wir nicht so eine Bewegung wie diese von $XRP über das Wochenende sehen.
$1.80+ ist an der Reihe.
Pamp it 🟢
#xrp320 #mr320 #Trendingcoin320 #Trendingissue #WriteToEarn2026
Ich würde mich wundern, wenn wir nicht so eine Bewegung wie diese von $XRP über das Wochenende sehen.
$1.80+ ist an der Reihe.
Pamp it 🟢
#xrp320 #mr320 #Trendingcoin320 #Trendingissue #WriteToEarn2026
44
·
--
Bullisch
$BTC
{spot}(BTCUSDT)
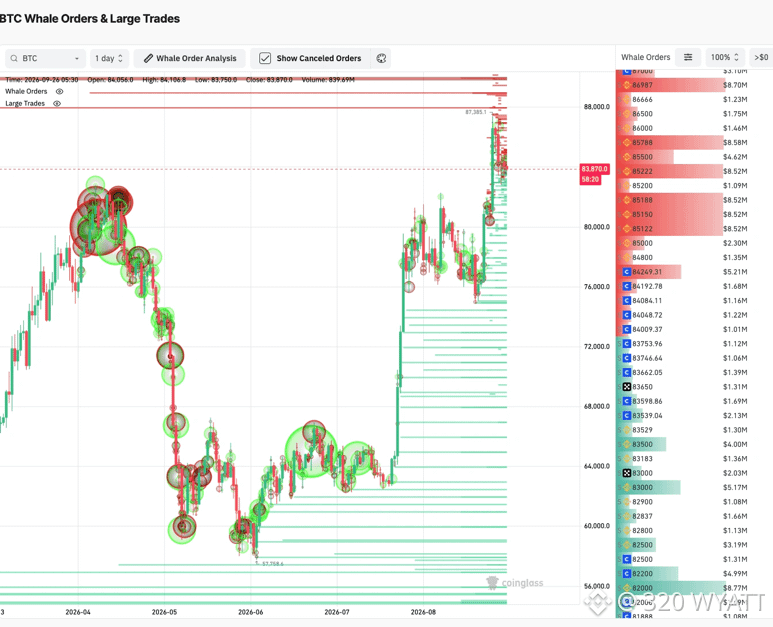
🚨Wal-Aktivität zeigt starkes Kaufen und Verkaufen🚨
BTC handelt bei rund 83.970 US-Dollar, nachdem es kürzlich in Richtung des Bereichs von 87.385 US-Dollar gedrückt wurde. Der wichtige Punkt ist, dass Wale große Orders auf beiden Seiten des Marktes platzieren und so eine klare Kampfzone schaffen.
Zwischen 85.122 und 87.000 US-Dollar werden große Verkaufsorders im Umfang von insgesamt etwa 37 Millionen US-Dollar platziert. Das schafft eine starke Verkaufswand, die es für Bitcoin möglicherweise schwieriger macht, sich über die Spanne von 85K – 87K zu bewegen.
Gleichzeitig werden etwa 21,1 Millionen US-Dollar an Kauforders zwischen 82.000 und 83.500 US-Dollar platziert.
Damit wird der Bereich 82K–83K zu einer wichtigen Unterstützungszone, während 85K – 87K weiterhin ein bedeutender Verkaufsbereich bleibt.
#BTC320 #Trendingissue #writetoearn320 #Trendingcoin320 #mr320
$BTC
🚨Wal-Aktivität zeigt starkes Kaufen und Verkaufen🚨
BTC handelt bei rund 83.970 US-Dollar, nachdem es kürzlich in Richtung des Bereichs von 87.385 US-Dollar gedrückt wurde. Der wichtige Punkt ist, dass Wale große Orders auf beiden Seiten des Marktes platzieren und so eine klare Kampfzone schaffen.
Zwischen 85.122 und 87.000 US-Dollar werden große Verkaufsorders im Umfang von insgesamt etwa 37 Millionen US-Dollar platziert. Das schafft eine starke Verkaufswand, die es für Bitcoin möglicherweise schwieriger macht, sich über die Spanne von 85K – 87K zu bewegen.
Gleichzeitig werden etwa 21,1 Millionen US-Dollar an Kauforders zwischen 82.000 und 83.500 US-Dollar platziert.
Damit wird der Bereich 82K–83K zu einer wichtigen Unterstützungszone, während 85K – 87K weiterhin ein bedeutender Verkaufsbereich bleibt.
#BTC320 #Trendingissue #writetoearn320 #Trendingcoin320 #mr320
🚨Wal-Aktivität zeigt starkes Kaufen und Verkaufen🚨
BTC handelt bei rund 83.970 US-Dollar, nachdem es kürzlich in Richtung des Bereichs von 87.385 US-Dollar gedrückt wurde. Der wichtige Punkt ist, dass Wale große Orders auf beiden Seiten des Marktes platzieren und so eine klare Kampfzone schaffen.
Zwischen 85.122 und 87.000 US-Dollar werden große Verkaufsorders im Umfang von insgesamt etwa 37 Millionen US-Dollar platziert. Das schafft eine starke Verkaufswand, die es für Bitcoin möglicherweise schwieriger macht, sich über die Spanne von 85K – 87K zu bewegen.
Gleichzeitig werden etwa 21,1 Millionen US-Dollar an Kauforders zwischen 82.000 und 83.500 US-Dollar platziert.
Damit wird der Bereich 82K–83K zu einer wichtigen Unterstützungszone, während 85K – 87K weiterhin ein bedeutender Verkaufsbereich bleibt.
#BTC320 #Trendingissue #writetoearn320 #Trendingcoin320 #mr320
26
Anmelden und weiter Inhalte entdecken
Krypto-Nutzer weltweit auf Binance Square kennenlernen
⚡️ Bleib in Sachen Krypto stets am Puls.
💬 Die weltgrößte Kryptobörse vertraut darauf.
👍 Erhalte verlässliche Einblicke von verifizierten Creators.
E-Mail-Adresse/Telefonnummer
Trendthemen
ChinaMayLetAlibabaByteDanceBuyNvidiaChips
152 Aufrufe
31 Kommentare
#ChinaMayLetAlibabaByteDanceBuyNvidiaChips
Diskussion
Berichten zufolge könnte China Unternehmen einschließlich Alibaba und ByteDance erlauben, die neu veröffentlichten RTX PRO 5500-Chips von Nvidia zu kaufen. Dem Bericht zufolge hat das Ministerium für Industrie und Informationstechnologie Unternehmen nach geplanten Mengen und beabsichtigten Verwendungszwecken gefragt, obwohl der Bericht nicht unabhängig verifiziert wurde.
Das ist bemerkenswert, weil:
Für Nvidia: Eine Genehmigung könnte zusätzliche Verkäufe nach China ermöglichen und Nvidias Präsenz im chinesischen KI-Ökosystem aufrechterhalten.
Für Alibaba & ByteDance: Mehr Rechenkapazität von Nvidia könnte die Entwicklung und Inferenz von KI-Modellen unterstützen, während die Nachfrage nach Rechenleistung stark ist.
Für Chinas Chip-Strategie: Die RTX PRO 5500 ist Nvidias wichtigster Data-Center-KI-Beschleuniger nicht, während chinesische Unternehmen auch an inländischen Alternativen arbeiten, etwa an den eigenen KI-Chips von Alibaba.
Für die Märkte: Eine Bestätigung bedeutender Käufe könnte die Stimmung rund um Nvidia und den gesamten Halbleitersektor beeinflussen, doch das Ausmaß und der Zeitpunkt etwaiger Genehmigungen bleiben ungewiss.
Der entscheidende Punkt ist, dass es sich um eine gemeldete potenzielle Genehmigung handelt, nicht um einen bestätigten Kaufvertrag.
PALASH5
·0 Likes
·123 Aufrufe
USChinaRelease$30BTariffCutProductLists
0 Aufrufe
1 Kommentare
SKoreaFSCConsidersVirtualAssetMarketMaker
954 Aufrufe
66 Kommentare