

#xrp320
xrp320
110,528 views
363 Discussing
Hot
Latest

·
--
Bearish
$XRP
{spot}(XRPUSDT)
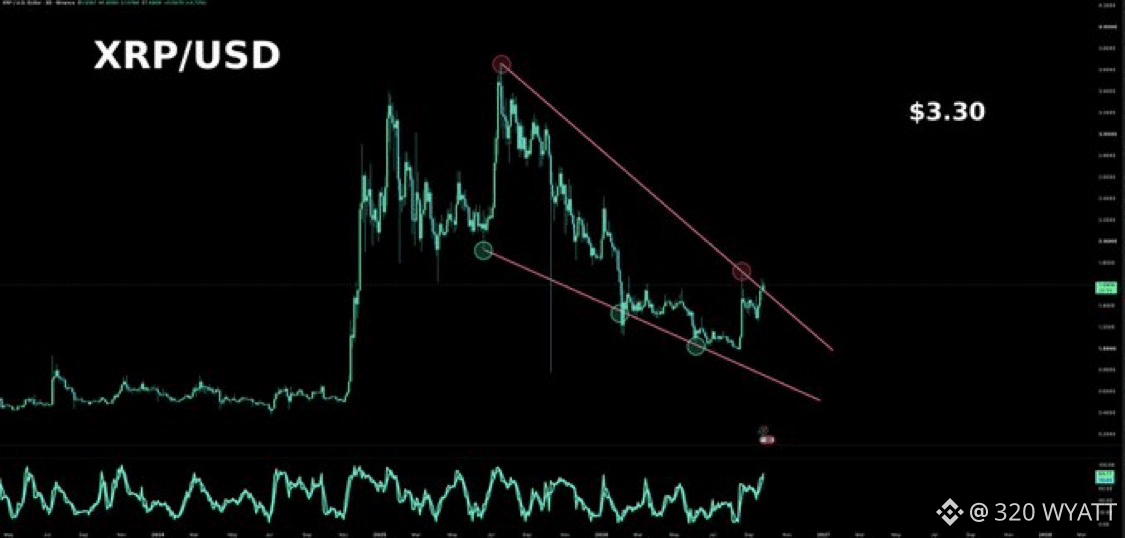
XRP is currently trading around $1.49 as its price moves inside a chart pattern known as a falling wedge. In technical analysis, this pattern usually means the downward trend is losing strength and buyers might soon take over. As the price gets squeezed tighter, a sharp move upward becomes more likely. If the broader crypto market goes into a new bull run, our analysis shows that XRP has a clear path to hit $2.00, then $2.75, and eventually reach $3.00.
""This is for educational purposes only, not financial advice.""
#xrp320 #Trendingissue #writetoearn320 #Trendingcoin320 #mr320
$XRP
XRP is currently trading around $1.49 as its price moves inside a chart pattern known as a falling wedge. In technical analysis, this pattern usually means the downward trend is losing strength and buyers might soon take over. As the price gets squeezed tighter, a sharp move upward becomes more likely. If the broader crypto market goes into a new bull run, our analysis shows that XRP has a clear path to hit $2.00, then $2.75, and eventually reach $3.00.
""This is for educational purposes only, not financial advice.""
#xrp320 #Trendingissue #writetoearn320 #Trendingcoin320 #mr320
XRP is currently trading around $1.49 as its price moves inside a chart pattern known as a falling wedge. In technical analysis, this pattern usually means the downward trend is losing strength and buyers might soon take over. As the price gets squeezed tighter, a sharp move upward becomes more likely. If the broader crypto market goes into a new bull run, our analysis shows that XRP has a clear path to hit $2.00, then $2.75, and eventually reach $3.00.
""This is for educational purposes only, not financial advice.""
#xrp320 #Trendingissue #writetoearn320 #Trendingcoin320 #mr320
184
·
--
Bearish
$XRP
{spot}(XRPUSDT)
Following an aggressive August rally, XRP is consolidating near $1.50 within a bullish falling wedge pattern, signaling potential macro continuation. A definitive breakout above the $1.50 psychological threshold exposes near-term targets of $1.80 to $2.00. Backed by broader Bitcoin-led market tailwinds, this technical structure could catalyze a staged ascent toward $3.00 by early 2027.
Conversely, a failure to defend pivotal support structures would invalidate this constructive outlook.
""This is for educational purposes only, not financial advice.""
#xrp320 #mr320 #Trendingissue #writetoearn320 #Trendingcoin320
$XRP
Following an aggressive August rally, XRP is consolidating near $1.50 within a bullish falling wedge pattern, signaling potential macro continuation. A definitive breakout above the $1.50 psychological threshold exposes near-term targets of $1.80 to $2.00. Backed by broader Bitcoin-led market tailwinds, this technical structure could catalyze a staged ascent toward $3.00 by early 2027.
Conversely, a failure to defend pivotal support structures would invalidate this constructive outlook.
""This is for educational purposes only, not financial advice.""
#xrp320 #mr320 #Trendingissue #writetoearn320 #Trendingcoin320
Following an aggressive August rally, XRP is consolidating near $1.50 within a bullish falling wedge pattern, signaling potential macro continuation. A definitive breakout above the $1.50 psychological threshold exposes near-term targets of $1.80 to $2.00. Backed by broader Bitcoin-led market tailwinds, this technical structure could catalyze a staged ascent toward $3.00 by early 2027.
Conversely, a failure to defend pivotal support structures would invalidate this constructive outlook.
""This is for educational purposes only, not financial advice.""
#xrp320 #mr320 #Trendingissue #writetoearn320 #Trendingcoin320
126
·
--
Bullish
$XRP
{spot}(XRPUSDT)
XRP is gearing up to MELT FACES.
$3.30 is the first target.
Are you in?
#xrp #xrp320 #Trendingcoin320 #mr320 #Trendingissue
$XRP
XRP is gearing up to MELT FACES.
$3.30 is the first target.
Are you in?
#xrp #xrp320 #Trendingcoin320 #mr320 #Trendingissue
XRP is gearing up to MELT FACES.
$3.30 is the first target.
Are you in?
#xrp #xrp320 #Trendingcoin320 #mr320 #Trendingissue
81
·
--
Bullish
$XRP
{spot}(XRPUSDT)
Despite the XRP Ledger (XRPL) eclipsing $1 trillion in cumulative processed value and facilitating billions of transactions, XRP has depreciated by approximately 49% year-over-year, compressed to a trading liquidity zone near $1.50. The network is progressively diversifying beyond its architectural roots in cross-border settlements; institutional participants are increasingly leveraging the ledger to deploy tokenized real-world assets (RWAs) and stablecoins, alongside the nascent development of native credit protocols.
#xrp320 #Trendingissue #Trendingcoin320 #writetoearn320 #mr320
$XRP
Despite the XRP Ledger (XRPL) eclipsing $1 trillion in cumulative processed value and facilitating billions of transactions, XRP has depreciated by approximately 49% year-over-year, compressed to a trading liquidity zone near $1.50. The network is progressively diversifying beyond its architectural roots in cross-border settlements; institutional participants are increasingly leveraging the ledger to deploy tokenized real-world assets (RWAs) and stablecoins, alongside the nascent development of native credit protocols.
#xrp320 #Trendingissue #Trendingcoin320 #writetoearn320 #mr320
Despite the XRP Ledger (XRPL) eclipsing $1 trillion in cumulative processed value and facilitating billions of transactions, XRP has depreciated by approximately 49% year-over-year, compressed to a trading liquidity zone near $1.50. The network is progressively diversifying beyond its architectural roots in cross-border settlements; institutional participants are increasingly leveraging the ledger to deploy tokenized real-world assets (RWAs) and stablecoins, alongside the nascent development of native credit protocols.
#xrp320 #Trendingissue #Trendingcoin320 #writetoearn320 #mr320
459
·
--
Bullish
$XRP
{spot}(XRPUSDT)
Despite a flurry of project announcements on the XRP Ledger, XRP has experienced a 50% contraction over the past year. The cryptocurrency currently trades approximately 59% beneath its historical zenith of $3.65, which was recorded in July 2025.
With a formidable market capitalization hovering around $95 billion and roughly 63.1 billion tokens circulating out of a finite 100-billion supply, XRP possesses immense inertia. Consequently, catalyzing upward price momentum demands a monumental surge in buy-side pressure—a challenge further compounded by Ripple's programmatic release of more tokens from its escrow reserves over time.
#xrp320 #Trendingissue #Trendingcoin320 #mr320 #writetoearn320
$XRP
Despite a flurry of project announcements on the XRP Ledger, XRP has experienced a 50% contraction over the past year. The cryptocurrency currently trades approximately 59% beneath its historical zenith of $3.65, which was recorded in July 2025.
With a formidable market capitalization hovering around $95 billion and roughly 63.1 billion tokens circulating out of a finite 100-billion supply, XRP possesses immense inertia. Consequently, catalyzing upward price momentum demands a monumental surge in buy-side pressure—a challenge further compounded by Ripple's programmatic release of more tokens from its escrow reserves over time.
#xrp320 #Trendingissue #Trendingcoin320 #mr320 #writetoearn320
Despite a flurry of project announcements on the XRP Ledger, XRP has experienced a 50% contraction over the past year. The cryptocurrency currently trades approximately 59% beneath its historical zenith of $3.65, which was recorded in July 2025.
With a formidable market capitalization hovering around $95 billion and roughly 63.1 billion tokens circulating out of a finite 100-billion supply, XRP possesses immense inertia. Consequently, catalyzing upward price momentum demands a monumental surge in buy-side pressure—a challenge further compounded by Ripple's programmatic release of more tokens from its escrow reserves over time.
#xrp320 #Trendingissue #Trendingcoin320 #mr320 #writetoearn320
173
·
--
Bullish
$XRP
{spot}(XRPUSDT)
The technical posture of XRP denotes distinct structural resilience as the asset exhibits an inherently constructive configuration, firmly sustaining its trajectory above a dense confluence of key Exponential Moving Averages (EMAs). Currently printing at $1.4996 following marginal localized contractions, the asset continues to trade above its 50-day, 100-day, and 200-day EMAs, which remain tightly compressed within the $1.330 to $1.400 corridor. This technical compression serves as a formidable structural floor, validating the macro longevity of the medium-term uptrend and providing buyers with a strong baseline support mechanism.
#xrp320 #mr320 #Trendingissue #Trendingcoin320 #writetoearn320
$XRP
The technical posture of XRP denotes distinct structural resilience as the asset exhibits an inherently constructive configuration, firmly sustaining its trajectory above a dense confluence of key Exponential Moving Averages (EMAs). Currently printing at $1.4996 following marginal localized contractions, the asset continues to trade above its 50-day, 100-day, and 200-day EMAs, which remain tightly compressed within the $1.330 to $1.400 corridor. This technical compression serves as a formidable structural floor, validating the macro longevity of the medium-term uptrend and providing buyers with a strong baseline support mechanism.
#xrp320 #mr320 #Trendingissue #Trendingcoin320 #writetoearn320
The technical posture of XRP denotes distinct structural resilience as the asset exhibits an inherently constructive configuration, firmly sustaining its trajectory above a dense confluence of key Exponential Moving Averages (EMAs). Currently printing at $1.4996 following marginal localized contractions, the asset continues to trade above its 50-day, 100-day, and 200-day EMAs, which remain tightly compressed within the $1.330 to $1.400 corridor. This technical compression serves as a formidable structural floor, validating the macro longevity of the medium-term uptrend and providing buyers with a strong baseline support mechanism.
#xrp320 #mr320 #Trendingissue #Trendingcoin320 #writetoearn320
83
·
--
Bullish
$XRP
{spot}(XRPUSDT)
XRP is currently trading at $1.4996, maintaining a solid bullish bias despite a slight dip yesterday. The price is safely holding above its 50-day, 100-day, and 200-day Exponential Moving Averages (EMAs)—which are tightly grouped between $1.330 and $1.400—confirming that the medium-term upward trend is still fully intact.
While the Relative Strength Index (RSI) sitting at 56 shows that buyers still control the market without being overextended, a slightly negative MACD signals a minor loss in upward speed after the recent rally. If the price moves up, it faces immediate resistance at $1.671, with a major hurdle ahead at $1.900 where sellers might step back in. On the downside, initial support sits at the 50-day EMA near $1.398, followed by deeper safety nets down to the psychological $1.300 and $1.000 demand zones if a sharper correction takes place.
#xrp320 #Trendingissue #Trendingcoin320 #writetoearn320 #mr320
$XRP
XRP is currently trading at $1.4996, maintaining a solid bullish bias despite a slight dip yesterday. The price is safely holding above its 50-day, 100-day, and 200-day Exponential Moving Averages (EMAs)—which are tightly grouped between $1.330 and $1.400—confirming that the medium-term upward trend is still fully intact.
While the Relative Strength Index (RSI) sitting at 56 shows that buyers still control the market without being overextended, a slightly negative MACD signals a minor loss in upward speed after the recent rally. If the price moves up, it faces immediate resistance at $1.671, with a major hurdle ahead at $1.900 where sellers might step back in. On the downside, initial support sits at the 50-day EMA near $1.398, followed by deeper safety nets down to the psychological $1.300 and $1.000 demand zones if a sharper correction takes place.
#xrp320 #Trendingissue #Trendingcoin320 #writetoearn320 #mr320
XRP is currently trading at $1.4996, maintaining a solid bullish bias despite a slight dip yesterday. The price is safely holding above its 50-day, 100-day, and 200-day Exponential Moving Averages (EMAs)—which are tightly grouped between $1.330 and $1.400—confirming that the medium-term upward trend is still fully intact.
While the Relative Strength Index (RSI) sitting at 56 shows that buyers still control the market without being overextended, a slightly negative MACD signals a minor loss in upward speed after the recent rally. If the price moves up, it faces immediate resistance at $1.671, with a major hurdle ahead at $1.900 where sellers might step back in. On the downside, initial support sits at the 50-day EMA near $1.398, followed by deeper safety nets down to the psychological $1.300 and $1.000 demand zones if a sharper correction takes place.
#xrp320 #Trendingissue #Trendingcoin320 #writetoearn320 #mr320
92
·
--
Bullish
$XRP
{spot}(XRPUSDT)
The digital asset XRP is currently consolidating around the $1.52 threshold, compressing within a multi-year descending broadening wedge coupled with a near-term triangle pattern. Chart technicians postulate a macro-scale upside trajectory toward $10—representing a projected 560% rally—while a decisive four-hour candlestick close above $1.53 could trigger a near-term breakout toward $1.62. Supporting this underlying structure, whale distribution remains robust and stable, with large-scale holders sustaining an aggregate balance of approximately 3.9 billion XRP.
Conversely, derivative metrics and on-chain indicators introduce a note of caution, dampening the overwhelmingly bullish sentiment. Although open interest (OI) on the Binance centralized exchange has staged a modest recovery to $516.6 million from its 2026 cyclical lows, it remains severely compressed relative to the $1.3 billion peak recorded in October 2025. Furthermore, the Relative Strength Index (RSI) registers below the neutral 50 line, indicating a lack of near-term directional momentum. With market strategists assigning a 65–70% probability to an upside breakout against a 30–35% downside risk, the prevailing environment underscores constrained leveraged conviction and mandates a highly disciplined risk-management approach for market participants.
#xrp320 #mr320 #Trendingissue #Trendingcoin320 #writetoearn320
$XRP
The digital asset XRP is currently consolidating around the $1.52 threshold, compressing within a multi-year descending broadening wedge coupled with a near-term triangle pattern. Chart technicians postulate a macro-scale upside trajectory toward $10—representing a projected 560% rally—while a decisive four-hour candlestick close above $1.53 could trigger a near-term breakout toward $1.62. Supporting this underlying structure, whale distribution remains robust and stable, with large-scale holders sustaining an aggregate balance of approximately 3.9 billion XRP.
Conversely, derivative metrics and on-chain indicators introduce a note of caution, dampening the overwhelmingly bullish sentiment. Although open interest (OI) on the Binance centralized exchange has staged a modest recovery to $516.6 million from its 2026 cyclical lows, it remains severely compressed relative to the $1.3 billion peak recorded in October 2025. Furthermore, the Relative Strength Index (RSI) registers below the neutral 50 line, indicating a lack of near-term directional momentum. With market strategists assigning a 65–70% probability to an upside breakout against a 30–35% downside risk, the prevailing environment underscores constrained leveraged conviction and mandates a highly disciplined risk-management approach for market participants.
#xrp320 #mr320 #Trendingissue #Trendingcoin320 #writetoearn320
The digital asset XRP is currently consolidating around the $1.52 threshold, compressing within a multi-year descending broadening wedge coupled with a near-term triangle pattern. Chart technicians postulate a macro-scale upside trajectory toward $10—representing a projected 560% rally—while a decisive four-hour candlestick close above $1.53 could trigger a near-term breakout toward $1.62. Supporting this underlying structure, whale distribution remains robust and stable, with large-scale holders sustaining an aggregate balance of approximately 3.9 billion XRP.
Conversely, derivative metrics and on-chain indicators introduce a note of caution, dampening the overwhelmingly bullish sentiment. Although open interest (OI) on the Binance centralized exchange has staged a modest recovery to $516.6 million from its 2026 cyclical lows, it remains severely compressed relative to the $1.3 billion peak recorded in October 2025. Furthermore, the Relative Strength Index (RSI) registers below the neutral 50 line, indicating a lack of near-term directional momentum. With market strategists assigning a 65–70% probability to an upside breakout against a 30–35% downside risk, the prevailing environment underscores constrained leveraged conviction and mandates a highly disciplined risk-management approach for market participants.
#xrp320 #mr320 #Trendingissue #Trendingcoin320 #writetoearn320
124
·
--
Bullish
Verified
$XRP
{spot}(XRPUSDT)
In a notable display of growing investor confidence, spot XRP ETFs registered a commendable $4.74 million in net inflows last week. This influx of capital highlights a robust appetite for regulated crypto investment vehicles, suggesting that institutional players are increasingly positioning themselves to capture the asset's potential upside amidst broader market shifts.
#xrp320 #Trendingissue #Trendingcoin320 #writetoearn320 #mr320
$XRP
In a notable display of growing investor confidence, spot XRP ETFs registered a commendable $4.74 million in net inflows last week. This influx of capital highlights a robust appetite for regulated crypto investment vehicles, suggesting that institutional players are increasingly positioning themselves to capture the asset's potential upside amidst broader market shifts.
#xrp320 #Trendingissue #Trendingcoin320 #writetoearn320 #mr320
In a notable display of growing investor confidence, spot XRP ETFs registered a commendable $4.74 million in net inflows last week. This influx of capital highlights a robust appetite for regulated crypto investment vehicles, suggesting that institutional players are increasingly positioning themselves to capture the asset's potential upside amidst broader market shifts.
#xrp320 #Trendingissue #Trendingcoin320 #writetoearn320 #mr320
2
2.2k
·
--
Bullish
$XRP
{spot}(XRPUSDT)
Early October witnessed muted trading volume for XRP as bearish sentiment intensified across cryptocurrency communities, with social metrics tilting significantly toward negative commentary. Nonetheless, technical analysts project a potential near-term rebound toward the $2 threshold, bolstered by constructive chart formations such as an inverse head-and-shoulders and an ascending triangle.
Furthermore, surpassing a pivotal resistance level at $3.66 could act as a catalyst for exponential gains. This optimistic outlook is reinforced by a contraction of XRP supply across centralized exchanges, a supply-side dynamic that typically underpins price stability and fosters upward mobility. At the time of compilation, XRP was valued at $1.51, commanding a $95 billion market capitalization.
#xrp320 #Trendingissue #Trendingcoin320 #writetoearn320 #mr320
$XRP
Early October witnessed muted trading volume for XRP as bearish sentiment intensified across cryptocurrency communities, with social metrics tilting significantly toward negative commentary. Nonetheless, technical analysts project a potential near-term rebound toward the $2 threshold, bolstered by constructive chart formations such as an inverse head-and-shoulders and an ascending triangle.
Furthermore, surpassing a pivotal resistance level at $3.66 could act as a catalyst for exponential gains. This optimistic outlook is reinforced by a contraction of XRP supply across centralized exchanges, a supply-side dynamic that typically underpins price stability and fosters upward mobility. At the time of compilation, XRP was valued at $1.51, commanding a $95 billion market capitalization.
#xrp320 #Trendingissue #Trendingcoin320 #writetoearn320 #mr320
Early October witnessed muted trading volume for XRP as bearish sentiment intensified across cryptocurrency communities, with social metrics tilting significantly toward negative commentary. Nonetheless, technical analysts project a potential near-term rebound toward the $2 threshold, bolstered by constructive chart formations such as an inverse head-and-shoulders and an ascending triangle.
Furthermore, surpassing a pivotal resistance level at $3.66 could act as a catalyst for exponential gains. This optimistic outlook is reinforced by a contraction of XRP supply across centralized exchanges, a supply-side dynamic that typically underpins price stability and fosters upward mobility. At the time of compilation, XRP was valued at $1.51, commanding a $95 billion market capitalization.
#xrp320 #Trendingissue #Trendingcoin320 #writetoearn320 #mr320
127
·
--
Bullish
$XRP
{spot}(XRPUSDT)
Technical analysis from late September identified a critical resistance zone for XRP spanning $1.57 to $1.70. Despite a recent rebound toward this boundary, the lack of a convincing breakout leaves the asset testing a familiar structural ceiling.
While a speculative $2 target maintains investor engagement, these on-paper valuations have yet to translate into realized returns, as the token faces persistent selling pressure overhead.
Consequently, this stagnation alters the risk-reward calculus for fresh capital. As XRP buyers wait out the consolidation, capital is increasingly shifting toward early-stage ventures like the AlphaPepe presale ahead of its initial exchange listing.
#xrp320 #mr320 #Trendingissue #Trendingcoin320 #writetoearn320
$XRP
Technical analysis from late September identified a critical resistance zone for XRP spanning $1.57 to $1.70. Despite a recent rebound toward this boundary, the lack of a convincing breakout leaves the asset testing a familiar structural ceiling.
While a speculative $2 target maintains investor engagement, these on-paper valuations have yet to translate into realized returns, as the token faces persistent selling pressure overhead.
Consequently, this stagnation alters the risk-reward calculus for fresh capital. As XRP buyers wait out the consolidation, capital is increasingly shifting toward early-stage ventures like the AlphaPepe presale ahead of its initial exchange listing.
#xrp320 #mr320 #Trendingissue #Trendingcoin320 #writetoearn320
Technical analysis from late September identified a critical resistance zone for XRP spanning $1.57 to $1.70. Despite a recent rebound toward this boundary, the lack of a convincing breakout leaves the asset testing a familiar structural ceiling.
While a speculative $2 target maintains investor engagement, these on-paper valuations have yet to translate into realized returns, as the token faces persistent selling pressure overhead.
Consequently, this stagnation alters the risk-reward calculus for fresh capital. As XRP buyers wait out the consolidation, capital is increasingly shifting toward early-stage ventures like the AlphaPepe presale ahead of its initial exchange listing.
#xrp320 #mr320 #Trendingissue #Trendingcoin320 #writetoearn320
1
866
·
--
Bullish
$XRP
{spot}(XRPUSDT)
Franklin Templeton's tokenized asset volume on the XRP Ledger has skyrocketed by an unprecedented 6,000%, signaling an aggressive institutional pivot by the $1.7 trillion investment manager toward on-chain capital allocation. Within mere weeks of transitioning to a fully live status on the network, the total value of Franklin Templeton's digital assets distributed via the platform surged from initial seed levels to more than $48 million.
#xrp320 #mr320 #Trendingissue #Trendingcoin320 #writetoearn320
$XRP
Franklin Templeton's tokenized asset volume on the XRP Ledger has skyrocketed by an unprecedented 6,000%, signaling an aggressive institutional pivot by the $1.7 trillion investment manager toward on-chain capital allocation. Within mere weeks of transitioning to a fully live status on the network, the total value of Franklin Templeton's digital assets distributed via the platform surged from initial seed levels to more than $48 million.
#xrp320 #mr320 #Trendingissue #Trendingcoin320 #writetoearn320
Franklin Templeton's tokenized asset volume on the XRP Ledger has skyrocketed by an unprecedented 6,000%, signaling an aggressive institutional pivot by the $1.7 trillion investment manager toward on-chain capital allocation. Within mere weeks of transitioning to a fully live status on the network, the total value of Franklin Templeton's digital assets distributed via the platform surged from initial seed levels to more than $48 million.
#xrp320 #mr320 #Trendingissue #Trendingcoin320 #writetoearn320
149
·
--
Bullish
$XRP
{spot}(XRPUSDT)
The XRP price has consolidated around the $1.48 to $1.56 range over the last 10 days, experiencing moderate volatility after a rejection from its late-September highs near $1.62. As of October 4, 2026, the live price stabilizes at approximately $1.49.
#xrp320 #mr320 #Trendingissue #Trendingcoin320 #writetoearn320
$XRP
The XRP price has consolidated around the $1.48 to $1.56 range over the last 10 days, experiencing moderate volatility after a rejection from its late-September highs near $1.62. As of October 4, 2026, the live price stabilizes at approximately $1.49.
#xrp320 #mr320 #Trendingissue #Trendingcoin320 #writetoearn320
The XRP price has consolidated around the $1.48 to $1.56 range over the last 10 days, experiencing moderate volatility after a rejection from its late-September highs near $1.62. As of October 4, 2026, the live price stabilizes at approximately $1.49.
#xrp320 #mr320 #Trendingissue #Trendingcoin320 #writetoearn320
1
69
·
--
Bullish
$XRP
{spot}(XRPUSDT)
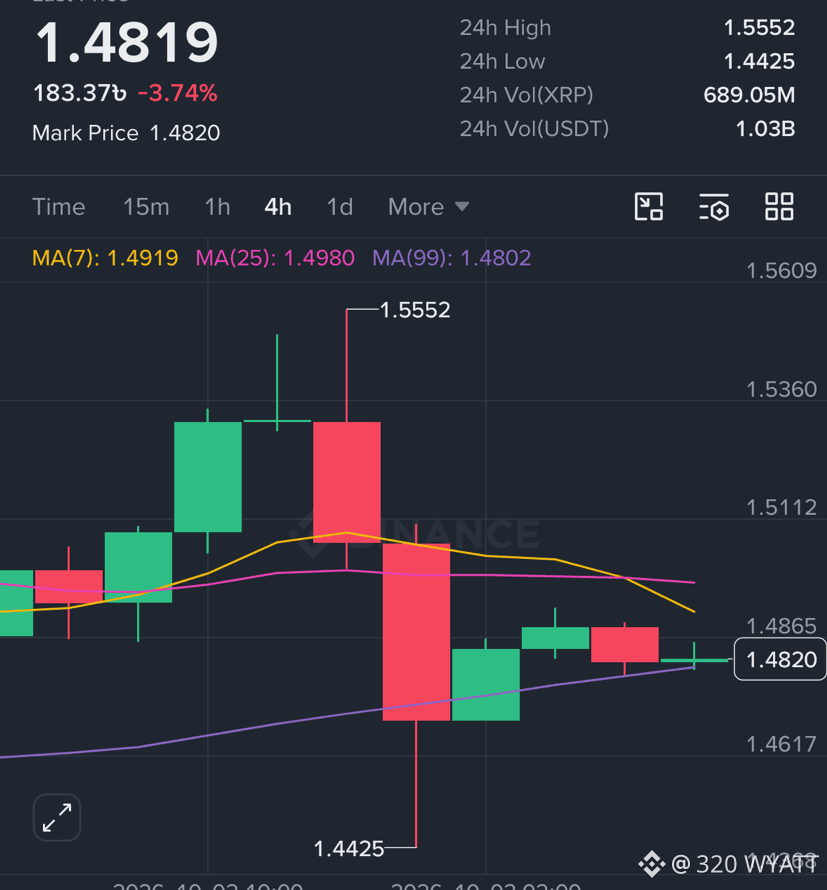
The current spot price of XRP sits at $1.48 USD, reflecting a modest 24-hour contraction of approximately 3.66%. Concurrently, the digital asset commands an aggregate market capitalization of $93.71 billion USD, while its 24-hour liquidity remains robust, with trading volumes consolidating around $4.07 billion USD.
#xrp320 #Trendingissue #writetoearn320 #Trendingcoin320 #mr320
$XRP
The current spot price of XRP sits at $1.48 USD, reflecting a modest 24-hour contraction of approximately 3.66%. Concurrently, the digital asset commands an aggregate market capitalization of $93.71 billion USD, while its 24-hour liquidity remains robust, with trading volumes consolidating around $4.07 billion USD.
#xrp320 #Trendingissue #writetoearn320 #Trendingcoin320 #mr320
The current spot price of XRP sits at $1.48 USD, reflecting a modest 24-hour contraction of approximately 3.66%. Concurrently, the digital asset commands an aggregate market capitalization of $93.71 billion USD, while its 24-hour liquidity remains robust, with trading volumes consolidating around $4.07 billion USD.
#xrp320 #Trendingissue #writetoearn320 #Trendingcoin320 #mr320
62
·
--
Bearish
$XRP
{spot}(XRPUSDT)
🚨🚨A former Goldman Sachs analyst has indeed captured the cryptocurrency community's attention by asserting that XRP is poised to experience a parabolic surge, eclipsing its previous all-time high before 2027.
#xrp320 #mr320 #writetoearn320 #Trendingissue #Trendingcoin320
$XRP
🚨🚨A former Goldman Sachs analyst has indeed captured the cryptocurrency community's attention by asserting that XRP is poised to experience a parabolic surge, eclipsing its previous all-time high before 2027.
#xrp320 #mr320 #writetoearn320 #Trendingissue #Trendingcoin320
🚨🚨A former Goldman Sachs analyst has indeed captured the cryptocurrency community's attention by asserting that XRP is poised to experience a parabolic surge, eclipsing its previous all-time high before 2027.
#xrp320 #mr320 #writetoearn320 #Trendingissue #Trendingcoin320
Sylvester Nagode CdJN:
Пока я вижу кучу позитивный новостей и боковик
2
2
4
1.3k
·
--
Bullish
$XRP
{spot}(XRPUSDT)
XRP at $1.54, extending its advance well above the main Exponential Moving Averages, which keeps the near-term bias bullish. Price holds over the 50-day EMA at $1.38 and the 200-day EMA at $1.37, while the 100-day EMA at $1.32 and the SuperTrend line at $1.28 track far below as trend support.
Momentum remains constructive, with the Relative Strength Index (RSI) around 60 suggesting sustained buying pressure, although the slightly negative Moving Average Convergence Divergence (MACD) near the zero line hints at a moderating upside swing rather than an outright.
On the downside, immediate technical footing lies at the former break area of the rising support trendline near $1.40, followed by clustered dynamic demand at the 50-day EMA at $1.38 and the 200-day EMA at $1.37. Deeper pullbacks would expose the 100-day EMA at $1.32, then the SuperTrend baseline at $1.28, where a stronger medium-term floor lies.
With no clear overhead levels on the daily chart, the pair would likely need a decisive break back below the $1.40-$1.38 region to weaken the prevailing bullish structure on the daily timeframe.
On the weekly chart, XRP similarly retains a constructive bullish bias as price holds above the 50-week EMA at $1.52 and the longer-term 200-week EMA at $1.37. The SuperTrend line at $0.96 sits well below the market, reinforcing a medium-term uptrend, while the RSI at 57 leans bullish without being overbought.
#xrp320 #mr320 #Trendingissue #Trendingcoin320 #writetoearn320
$XRP
XRP at $1.54, extending its advance well above the main Exponential Moving Averages, which keeps the near-term bias bullish. Price holds over the 50-day EMA at $1.38 and the 200-day EMA at $1.37, while the 100-day EMA at $1.32 and the SuperTrend line at $1.28 track far below as trend support.
Momentum remains constructive, with the Relative Strength Index (RSI) around 60 suggesting sustained buying pressure, although the slightly negative Moving Average Convergence Divergence (MACD) near the zero line hints at a moderating upside swing rather than an outright.
On the downside, immediate technical footing lies at the former break area of the rising support trendline near $1.40, followed by clustered dynamic demand at the 50-day EMA at $1.38 and the 200-day EMA at $1.37. Deeper pullbacks would expose the 100-day EMA at $1.32, then the SuperTrend baseline at $1.28, where a stronger medium-term floor lies.
With no clear overhead levels on the daily chart, the pair would likely need a decisive break back below the $1.40-$1.38 region to weaken the prevailing bullish structure on the daily timeframe.
On the weekly chart, XRP similarly retains a constructive bullish bias as price holds above the 50-week EMA at $1.52 and the longer-term 200-week EMA at $1.37. The SuperTrend line at $0.96 sits well below the market, reinforcing a medium-term uptrend, while the RSI at 57 leans bullish without being overbought.
#xrp320 #mr320 #Trendingissue #Trendingcoin320 #writetoearn320
XRP at $1.54, extending its advance well above the main Exponential Moving Averages, which keeps the near-term bias bullish. Price holds over the 50-day EMA at $1.38 and the 200-day EMA at $1.37, while the 100-day EMA at $1.32 and the SuperTrend line at $1.28 track far below as trend support.
Momentum remains constructive, with the Relative Strength Index (RSI) around 60 suggesting sustained buying pressure, although the slightly negative Moving Average Convergence Divergence (MACD) near the zero line hints at a moderating upside swing rather than an outright.
On the downside, immediate technical footing lies at the former break area of the rising support trendline near $1.40, followed by clustered dynamic demand at the 50-day EMA at $1.38 and the 200-day EMA at $1.37. Deeper pullbacks would expose the 100-day EMA at $1.32, then the SuperTrend baseline at $1.28, where a stronger medium-term floor lies.
With no clear overhead levels on the daily chart, the pair would likely need a decisive break back below the $1.40-$1.38 region to weaken the prevailing bullish structure on the daily timeframe.
On the weekly chart, XRP similarly retains a constructive bullish bias as price holds above the 50-week EMA at $1.52 and the longer-term 200-week EMA at $1.37. The SuperTrend line at $0.96 sits well below the market, reinforcing a medium-term uptrend, while the RSI at 57 leans bullish without being overbought.
#xrp320 #mr320 #Trendingissue #Trendingcoin320 #writetoearn320
150
·
--
Bullish
$XRP
{spot}(XRPUSDT)
XRP trades around $1.51, holding steady near the $1.50 mark since late September. A key event is the shareholder vote in New York on the merger creating Evernorth, a company holding 473 million XRP, which would list on Nasdaq under ticker XRPN. This could influence XRP supply and price dynamics. Additionally, Ripple's monthly escrow window opens, potentially releasing up to 1 billion XRP into the market, a significant volume relative to daily trading. German investors should note tax differences between owning XRP tokens directly and shares like XRPN. The market awaits these developments, with price levels between $1.28 and $1.57 critical for near-term movements.
#xrp320 #mr320 #Trendingcoin320 #Trendingissue #WriteToEarn2026
$XRP
XRP trades around $1.51, holding steady near the $1.50 mark since late September. A key event is the shareholder vote in New York on the merger creating Evernorth, a company holding 473 million XRP, which would list on Nasdaq under ticker XRPN. This could influence XRP supply and price dynamics. Additionally, Ripple's monthly escrow window opens, potentially releasing up to 1 billion XRP into the market, a significant volume relative to daily trading. German investors should note tax differences between owning XRP tokens directly and shares like XRPN. The market awaits these developments, with price levels between $1.28 and $1.57 critical for near-term movements.
#xrp320 #mr320 #Trendingcoin320 #Trendingissue #WriteToEarn2026
XRP trades around $1.51, holding steady near the $1.50 mark since late September. A key event is the shareholder vote in New York on the merger creating Evernorth, a company holding 473 million XRP, which would list on Nasdaq under ticker XRPN. This could influence XRP supply and price dynamics. Additionally, Ripple's monthly escrow window opens, potentially releasing up to 1 billion XRP into the market, a significant volume relative to daily trading. German investors should note tax differences between owning XRP tokens directly and shares like XRPN. The market awaits these developments, with price levels between $1.28 and $1.57 critical for near-term movements.
#xrp320 #mr320 #Trendingcoin320 #Trendingissue #WriteToEarn2026
XRP-5.24%
XRPNUS+11.58%
87
·
--
Bullish
$XRP
{spot}(XRPUSDT)
XRP enters Q4 with the market watching a straightforward test: can new demand absorb the supply between $1.60 and $1.70? ETF inflows, large-holder accumulation and expanding institutional use of XRPL provide measurable demand indicators, while derivatives positioning adds liquidity and leverage to the market. The technical structure remains constructive above the $1.37–$1.46 support band.
A sustained break above $1.70 would move the Q4 setup toward $1.80–$1.90 and then the $2.00–$2.20 supply zone shown on the chart. Until that breakout occurs, XRP remains in a defined consolidation beneath major overhead resistance.
#xrp320 #mr320 #Trendingcoin320 #Trendingissue #writetoearn320
$XRP
XRP enters Q4 with the market watching a straightforward test: can new demand absorb the supply between $1.60 and $1.70? ETF inflows, large-holder accumulation and expanding institutional use of XRPL provide measurable demand indicators, while derivatives positioning adds liquidity and leverage to the market. The technical structure remains constructive above the $1.37–$1.46 support band.
A sustained break above $1.70 would move the Q4 setup toward $1.80–$1.90 and then the $2.00–$2.20 supply zone shown on the chart. Until that breakout occurs, XRP remains in a defined consolidation beneath major overhead resistance.
#xrp320 #mr320 #Trendingcoin320 #Trendingissue #writetoearn320
XRP enters Q4 with the market watching a straightforward test: can new demand absorb the supply between $1.60 and $1.70? ETF inflows, large-holder accumulation and expanding institutional use of XRPL provide measurable demand indicators, while derivatives positioning adds liquidity and leverage to the market. The technical structure remains constructive above the $1.37–$1.46 support band.
A sustained break above $1.70 would move the Q4 setup toward $1.80–$1.90 and then the $2.00–$2.20 supply zone shown on the chart. Until that breakout occurs, XRP remains in a defined consolidation beneath major overhead resistance.
#xrp320 #mr320 #Trendingcoin320 #Trendingissue #writetoearn320
285
·
--
Bullish
$XRP
{spot}(XRPUSDT)
🚨XRP shows early signs of weakness🚨
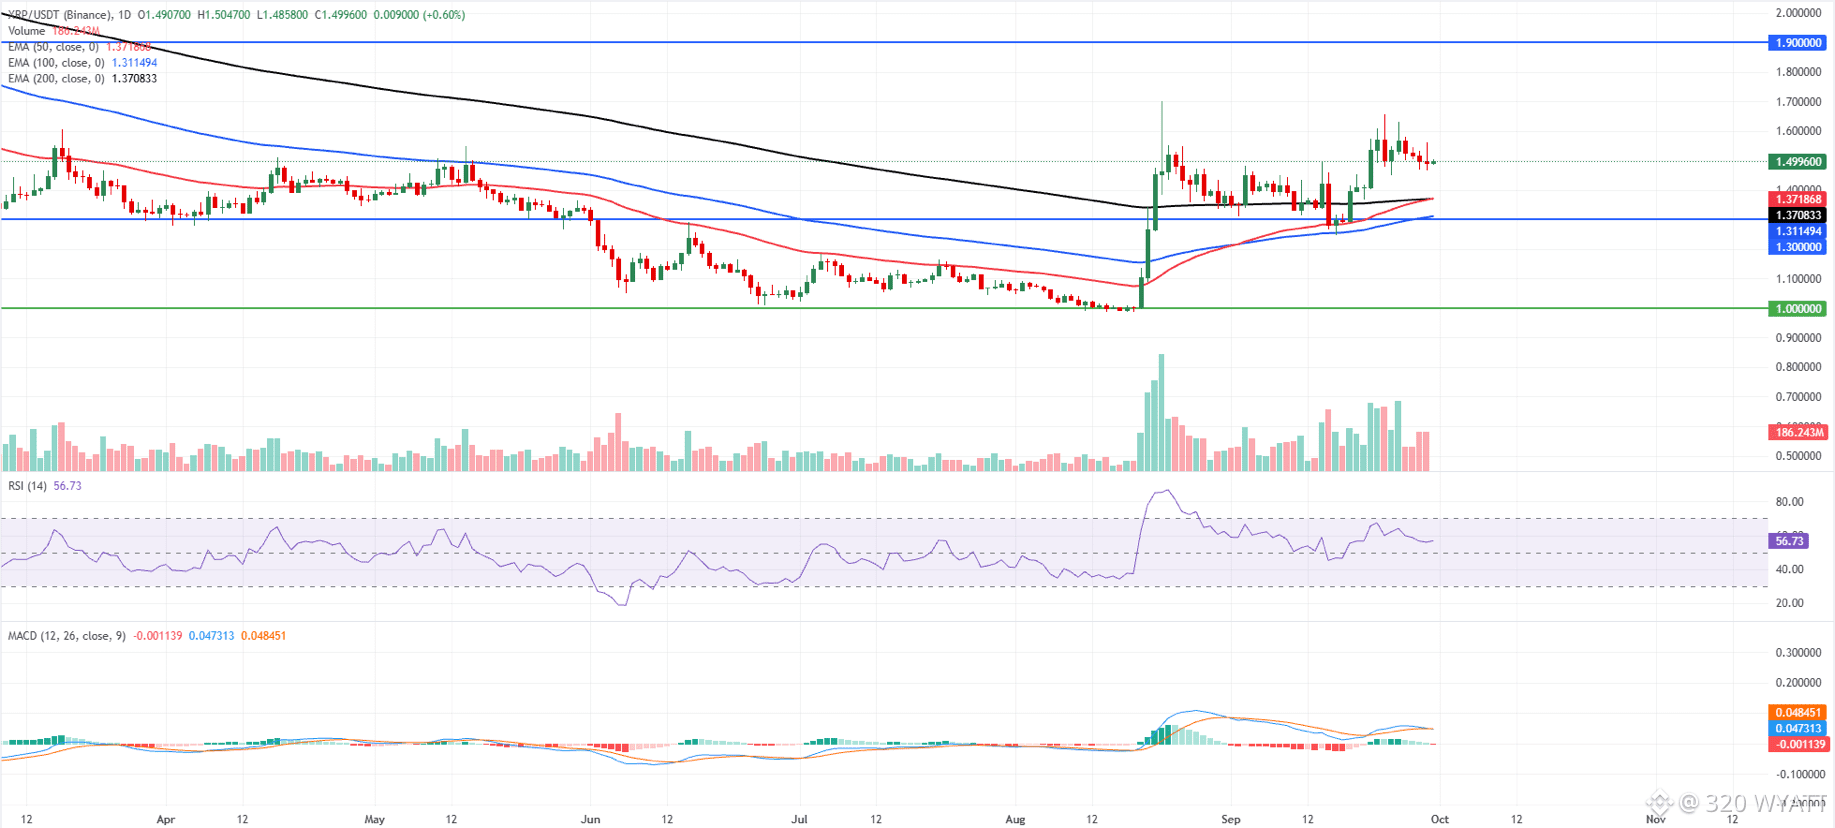
XRP price trades at $1.499 on Wednesday after four consecutive days of losses since last week. Despite this correction, XRP maintains a constructive Outlook, holding well above the 50-day and 200-day EMAs at $1.371 and $1.370, as well as the 100-day EMA at $1.311.
The RSI at 56 stays in positive territory without reaching overbought levels. At the same time, the MACD flattens just below the zero line, suggesting that bullish momentum is moderating but the broader upside structure remains intact.
On the downside, initial support is seen at the clustered 50-day and 200-day EMAs around $1.370, followed by the 100-day EMA at $1.311 and the horizontal level at $1.300, before a deeper floor emerges near $1.000.
On the topside, the next key hurdle is the horizontal resistance at $1.900, and a sustained break above this barrier would open the path for a continuation of the prevailing uptrend.
#xrp320 #mr320 #Trendingissue #Trendingcoin320 #WriteToEarn2026
$XRP
🚨XRP shows early signs of weakness🚨
XRP price trades at $1.499 on Wednesday after four consecutive days of losses since last week. Despite this correction, XRP maintains a constructive Outlook, holding well above the 50-day and 200-day EMAs at $1.371 and $1.370, as well as the 100-day EMA at $1.311.
The RSI at 56 stays in positive territory without reaching overbought levels. At the same time, the MACD flattens just below the zero line, suggesting that bullish momentum is moderating but the broader upside structure remains intact.
On the downside, initial support is seen at the clustered 50-day and 200-day EMAs around $1.370, followed by the 100-day EMA at $1.311 and the horizontal level at $1.300, before a deeper floor emerges near $1.000.
On the topside, the next key hurdle is the horizontal resistance at $1.900, and a sustained break above this barrier would open the path for a continuation of the prevailing uptrend.
#xrp320 #mr320 #Trendingissue #Trendingcoin320 #WriteToEarn2026
🚨XRP shows early signs of weakness🚨
XRP price trades at $1.499 on Wednesday after four consecutive days of losses since last week. Despite this correction, XRP maintains a constructive Outlook, holding well above the 50-day and 200-day EMAs at $1.371 and $1.370, as well as the 100-day EMA at $1.311.
The RSI at 56 stays in positive territory without reaching overbought levels. At the same time, the MACD flattens just below the zero line, suggesting that bullish momentum is moderating but the broader upside structure remains intact.
On the downside, initial support is seen at the clustered 50-day and 200-day EMAs around $1.370, followed by the 100-day EMA at $1.311 and the horizontal level at $1.300, before a deeper floor emerges near $1.000.
On the topside, the next key hurdle is the horizontal resistance at $1.900, and a sustained break above this barrier would open the path for a continuation of the prevailing uptrend.
#xrp320 #mr320 #Trendingissue #Trendingcoin320 #WriteToEarn2026
73
·
--
Bullish
$XRP
{spot}(XRPUSDT)
XRP closed June at $1.04 and closed July at $1.06. Throughout August, it fluctuated between $0.99 and $1.70 but managed to stabilize in September within a tighter range of $1.25 to $1.66, indicating that buyers are holding onto most of August's gains.
Despite this recovery, XRP remains down 17.3% for 2026 and 45.8% compared to the previous year, a more significant decline than Bitcoin's drop of 23.2%. The token reached a high of $3.67 in July 2025, closed the year at $1.84, and hit $2.42 in January 2026, placing it about 58% below its peak and 37% below its January high.
Many investors are still facing losses since many bought in at prices above $2.75, leading them to sell during each rally as the price nears their purchase levels.
#xrp320 #mr320 #Trendingissue #Trendingcoin320 #mr320
$XRP
XRP closed June at $1.04 and closed July at $1.06. Throughout August, it fluctuated between $0.99 and $1.70 but managed to stabilize in September within a tighter range of $1.25 to $1.66, indicating that buyers are holding onto most of August's gains.
Despite this recovery, XRP remains down 17.3% for 2026 and 45.8% compared to the previous year, a more significant decline than Bitcoin's drop of 23.2%. The token reached a high of $3.67 in July 2025, closed the year at $1.84, and hit $2.42 in January 2026, placing it about 58% below its peak and 37% below its January high.
Many investors are still facing losses since many bought in at prices above $2.75, leading them to sell during each rally as the price nears their purchase levels.
#xrp320 #mr320 #Trendingissue #Trendingcoin320 #mr320
XRP closed June at $1.04 and closed July at $1.06. Throughout August, it fluctuated between $0.99 and $1.70 but managed to stabilize in September within a tighter range of $1.25 to $1.66, indicating that buyers are holding onto most of August's gains.
Despite this recovery, XRP remains down 17.3% for 2026 and 45.8% compared to the previous year, a more significant decline than Bitcoin's drop of 23.2%. The token reached a high of $3.67 in July 2025, closed the year at $1.84, and hit $2.42 in January 2026, placing it about 58% below its peak and 37% below its January high.
Many investors are still facing losses since many bought in at prices above $2.75, leading them to sell during each rally as the price nears their purchase levels.
#xrp320 #mr320 #Trendingissue #Trendingcoin320 #mr320
117
Log in to explore more content
Join global crypto users on Binance Square
⚡️ Get latest and useful information about crypto.
💬 Trusted by the world’s largest crypto exchange.
👍 Discover real insights from verified creators.
Email / Phone number
Trending Topics
1
#FedMinutesFocusOnOctoberPause
9,557 views
271 Discussing
2
#BinanceLaunchesBinanceIntelligence
913,147 views
5,549 Discussing
3
#RobinhoodAdds$25MInBitcoinToBalanceSheet
589 views
25 Discussing
4
#SP500AndNasdaqHitRecordHighs
3,673 views
152 Discussing
5
#USMortgageRatesRiseTo7.49%
3,530 views
132 Discussing
6
#BTCFallsBelow$84K
70,151 views
189 Discussing
7
#DubaiVARAIssuesReserveAssetAuditCircular
27,497 views
747 Discussing
8
#SECApproves3XBitcoinETF
26,427 views
610 Discussing
9
#WinklevossFilesSpotZcashETFApplication
34,698 views
721 Discussing
10
#SouthKoreaAITradeLiftsWorldcoinTo$7.41B
3,753 views
52 Discussing