

#writetoearn2026
writetoearn2026
107,746 views
650 Discussing
Hot
Latest

·
--
Bullish
$XRP
{spot}(XRPUSDT)
XRP trades around $1.51, holding steady near the $1.50 mark since late September. A key event is the shareholder vote in New York on the merger creating Evernorth, a company holding 473 million XRP, which would list on Nasdaq under ticker XRPN. This could influence XRP supply and price dynamics. Additionally, Ripple's monthly escrow window opens, potentially releasing up to 1 billion XRP into the market, a significant volume relative to daily trading. German investors should note tax differences between owning XRP tokens directly and shares like XRPN. The market awaits these developments, with price levels between $1.28 and $1.57 critical for near-term movements.
#xrp320 #mr320 #Trendingcoin320 #Trendingissue #WriteToEarn2026
$XRP
XRP trades around $1.51, holding steady near the $1.50 mark since late September. A key event is the shareholder vote in New York on the merger creating Evernorth, a company holding 473 million XRP, which would list on Nasdaq under ticker XRPN. This could influence XRP supply and price dynamics. Additionally, Ripple's monthly escrow window opens, potentially releasing up to 1 billion XRP into the market, a significant volume relative to daily trading. German investors should note tax differences between owning XRP tokens directly and shares like XRPN. The market awaits these developments, with price levels between $1.28 and $1.57 critical for near-term movements.
#xrp320 #mr320 #Trendingcoin320 #Trendingissue #WriteToEarn2026
XRP trades around $1.51, holding steady near the $1.50 mark since late September. A key event is the shareholder vote in New York on the merger creating Evernorth, a company holding 473 million XRP, which would list on Nasdaq under ticker XRPN. This could influence XRP supply and price dynamics. Additionally, Ripple's monthly escrow window opens, potentially releasing up to 1 billion XRP into the market, a significant volume relative to daily trading. German investors should note tax differences between owning XRP tokens directly and shares like XRPN. The market awaits these developments, with price levels between $1.28 and $1.57 critical for near-term movements.
#xrp320 #mr320 #Trendingcoin320 #Trendingissue #WriteToEarn2026
XRP-1.18%
XRPNUS+67.48%
72
·
--
Bullish
$XRP
{spot}(XRPUSDT)
🚨XRP shows early signs of weakness🚨
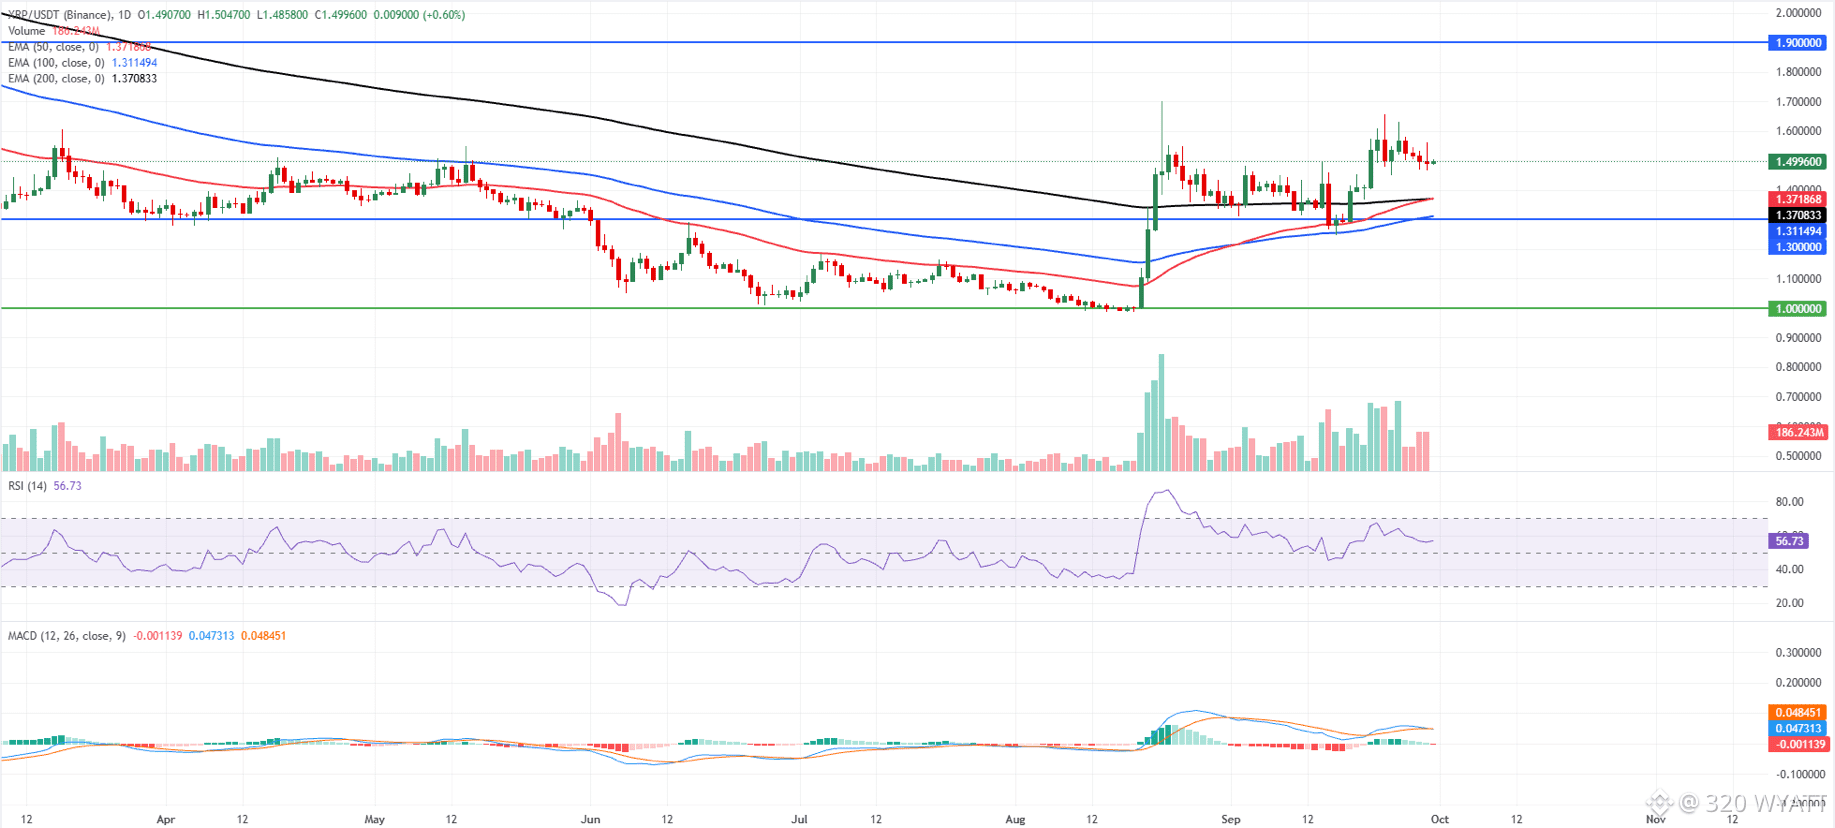
XRP price trades at $1.499 on Wednesday after four consecutive days of losses since last week. Despite this correction, XRP maintains a constructive Outlook, holding well above the 50-day and 200-day EMAs at $1.371 and $1.370, as well as the 100-day EMA at $1.311.
The RSI at 56 stays in positive territory without reaching overbought levels. At the same time, the MACD flattens just below the zero line, suggesting that bullish momentum is moderating but the broader upside structure remains intact.
On the downside, initial support is seen at the clustered 50-day and 200-day EMAs around $1.370, followed by the 100-day EMA at $1.311 and the horizontal level at $1.300, before a deeper floor emerges near $1.000.
On the topside, the next key hurdle is the horizontal resistance at $1.900, and a sustained break above this barrier would open the path for a continuation of the prevailing uptrend.
#xrp320 #mr320 #Trendingissue #Trendingcoin320 #WriteToEarn2026
$XRP
🚨XRP shows early signs of weakness🚨
XRP price trades at $1.499 on Wednesday after four consecutive days of losses since last week. Despite this correction, XRP maintains a constructive Outlook, holding well above the 50-day and 200-day EMAs at $1.371 and $1.370, as well as the 100-day EMA at $1.311.
The RSI at 56 stays in positive territory without reaching overbought levels. At the same time, the MACD flattens just below the zero line, suggesting that bullish momentum is moderating but the broader upside structure remains intact.
On the downside, initial support is seen at the clustered 50-day and 200-day EMAs around $1.370, followed by the 100-day EMA at $1.311 and the horizontal level at $1.300, before a deeper floor emerges near $1.000.
On the topside, the next key hurdle is the horizontal resistance at $1.900, and a sustained break above this barrier would open the path for a continuation of the prevailing uptrend.
#xrp320 #mr320 #Trendingissue #Trendingcoin320 #WriteToEarn2026
🚨XRP shows early signs of weakness🚨
XRP price trades at $1.499 on Wednesday after four consecutive days of losses since last week. Despite this correction, XRP maintains a constructive Outlook, holding well above the 50-day and 200-day EMAs at $1.371 and $1.370, as well as the 100-day EMA at $1.311.
The RSI at 56 stays in positive territory without reaching overbought levels. At the same time, the MACD flattens just below the zero line, suggesting that bullish momentum is moderating but the broader upside structure remains intact.
On the downside, initial support is seen at the clustered 50-day and 200-day EMAs around $1.370, followed by the 100-day EMA at $1.311 and the horizontal level at $1.300, before a deeper floor emerges near $1.000.
On the topside, the next key hurdle is the horizontal resistance at $1.900, and a sustained break above this barrier would open the path for a continuation of the prevailing uptrend.
#xrp320 #mr320 #Trendingissue #Trendingcoin320 #WriteToEarn2026
69
·
--
Bullish
$SOL
{spot}(SOLUSDT)
Solana (SOL) is trading at $121.69, slightly up by 0.23%, after reaching an intraday high of $124.95. The price rally gained momentum after breaking above $94.85 earlier in September, supported by strong technical indicators like RSI near overbought levels and a positive MACD. Network activity has increased, with total value locked on Solana rising from $4.7 billion in August to $6.7 billion in late September. Additionally, derivatives open interest has climbed to $7.5 billion, highlighted by a large 20x leveraged long position worth $67.88 million, signaling high trader confidence but also potential for volatility. The next key price level to watch is $124.95, which if surpassed, could extend the uptrend.
#solana320 #Trendingissue #mr320 #Trendingcoin320 #writetoearn2026
$SOL
Solana (SOL) is trading at $121.69, slightly up by 0.23%, after reaching an intraday high of $124.95. The price rally gained momentum after breaking above $94.85 earlier in September, supported by strong technical indicators like RSI near overbought levels and a positive MACD. Network activity has increased, with total value locked on Solana rising from $4.7 billion in August to $6.7 billion in late September. Additionally, derivatives open interest has climbed to $7.5 billion, highlighted by a large 20x leveraged long position worth $67.88 million, signaling high trader confidence but also potential for volatility. The next key price level to watch is $124.95, which if surpassed, could extend the uptrend.
#solana320 #Trendingissue #mr320 #Trendingcoin320 #writetoearn2026
Solana (SOL) is trading at $121.69, slightly up by 0.23%, after reaching an intraday high of $124.95. The price rally gained momentum after breaking above $94.85 earlier in September, supported by strong technical indicators like RSI near overbought levels and a positive MACD. Network activity has increased, with total value locked on Solana rising from $4.7 billion in August to $6.7 billion in late September. Additionally, derivatives open interest has climbed to $7.5 billion, highlighted by a large 20x leveraged long position worth $67.88 million, signaling high trader confidence but also potential for volatility. The next key price level to watch is $124.95, which if surpassed, could extend the uptrend.
#solana320 #Trendingissue #mr320 #Trendingcoin320 #writetoearn2026

99
·
--
Bullish
$SHIB
{spot}(SHIBUSDT)
SHIB traded at $0.00000598 on September 27, 2026, which works out at roughly 0.0000052 euros. The figure comes from the CoinGecko market snapshot taken at that moment. Over the preceding 24 hours the price moved between $0.00000582 and $0.00000606, a daily gain of 0.16 percent. Market capitalisation stood at $3.486 billion, rank 34 in the overall market, on trading volume of $84.5 million in 24 hours.
The gap between the time frames is more telling than the single day. Over seven days the token is up 9.46 percent, over 30 days 10.71 percent, over 60 days 28.04 percent. Measured over a full year it is down 50.27 percent. SHIB has worked its way up out of a deep hole without recovering even half of what it lost over the year.
The all-time high of $0.00008616 dates from October 27, 2021. The current price sits around 93 percent below it. For SHIB to reach that high again, the price would have to multiply fourteenfold. With the circulating supply unchanged, market capitalisation would then stand at roughly $50.7 billion. Call that a multiplication exercise. It shows the order of magnitude hiding behind a seemingly small number with a lot of zeros.
$SHIB #mr320 #Trendingissue #Trendingcoin320 #writetoearn2026
$SHIB
SHIB traded at $0.00000598 on September 27, 2026, which works out at roughly 0.0000052 euros. The figure comes from the CoinGecko market snapshot taken at that moment. Over the preceding 24 hours the price moved between $0.00000582 and $0.00000606, a daily gain of 0.16 percent. Market capitalisation stood at $3.486 billion, rank 34 in the overall market, on trading volume of $84.5 million in 24 hours.
The gap between the time frames is more telling than the single day. Over seven days the token is up 9.46 percent, over 30 days 10.71 percent, over 60 days 28.04 percent. Measured over a full year it is down 50.27 percent. SHIB has worked its way up out of a deep hole without recovering even half of what it lost over the year.
The all-time high of $0.00008616 dates from October 27, 2021. The current price sits around 93 percent below it. For SHIB to reach that high again, the price would have to multiply fourteenfold. With the circulating supply unchanged, market capitalisation would then stand at roughly $50.7 billion. Call that a multiplication exercise. It shows the order of magnitude hiding behind a seemingly small number with a lot of zeros.
$SHIB #mr320 #Trendingissue #Trendingcoin320 #writetoearn2026
SHIB traded at $0.00000598 on September 27, 2026, which works out at roughly 0.0000052 euros. The figure comes from the CoinGecko market snapshot taken at that moment. Over the preceding 24 hours the price moved between $0.00000582 and $0.00000606, a daily gain of 0.16 percent. Market capitalisation stood at $3.486 billion, rank 34 in the overall market, on trading volume of $84.5 million in 24 hours.
The gap between the time frames is more telling than the single day. Over seven days the token is up 9.46 percent, over 30 days 10.71 percent, over 60 days 28.04 percent. Measured over a full year it is down 50.27 percent. SHIB has worked its way up out of a deep hole without recovering even half of what it lost over the year.
The all-time high of $0.00008616 dates from October 27, 2021. The current price sits around 93 percent below it. For SHIB to reach that high again, the price would have to multiply fourteenfold. With the circulating supply unchanged, market capitalisation would then stand at roughly $50.7 billion. Call that a multiplication exercise. It shows the order of magnitude hiding behind a seemingly small number with a lot of zeros.
$SHIB #mr320 #Trendingissue #Trendingcoin320 #writetoearn2026

1
55
·
--
Bullish
$ETH
{spot}(ETHUSDT)
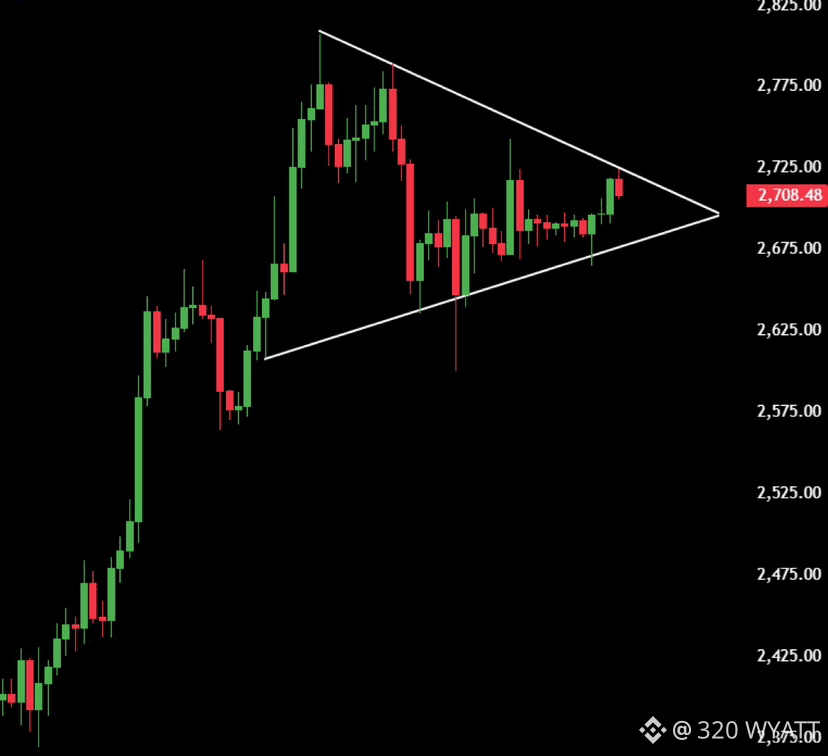
$ETH is very close to another bullish breakout.
A 4H close above $2,730 could pump ETH to $3K🚀
#ETH320 #mr320 #Trendingissue #Trendingcoin320 #WriteToEarn2026
$ETH
$ETH is very close to another bullish breakout.
A 4H close above $2,730 could pump ETH to $3K🚀
#ETH320 #mr320 #Trendingissue #Trendingcoin320 #WriteToEarn2026
$ETH is very close to another bullish breakout.
A 4H close above $2,730 could pump ETH to $3K🚀
#ETH320 #mr320 #Trendingissue #Trendingcoin320 #WriteToEarn2026
74
·
--
Bullish
$XRP
{spot}(XRPUSDT)
🚨What XRP Would Need to Do to Reach $30🚨
The $30 target is not Egrag's next stop for XRP. It sits at the far end of a long-term bullish roadmap and would require a rise of roughly 2,620%, or more than 27 times, from the chart's $1.47 region.
First, XRP would need to avoid a loss of $1.47 and then decisively break above $1.65, near its 33-month moving average.
From there, Egrag's chart maps several major hurdles: $3 and $5.50 appear before the bigger targets of $7.50, $13, and $30.
#xrp320 #mr320 #Trendingissue #WriteToEarn2026 #Trendingcoin320
$XRP
🚨What XRP Would Need to Do to Reach $30🚨
The $30 target is not Egrag's next stop for XRP. It sits at the far end of a long-term bullish roadmap and would require a rise of roughly 2,620%, or more than 27 times, from the chart's $1.47 region.
First, XRP would need to avoid a loss of $1.47 and then decisively break above $1.65, near its 33-month moving average.
From there, Egrag's chart maps several major hurdles: $3 and $5.50 appear before the bigger targets of $7.50, $13, and $30.
#xrp320 #mr320 #Trendingissue #WriteToEarn2026 #Trendingcoin320
🚨What XRP Would Need to Do to Reach $30🚨
The $30 target is not Egrag's next stop for XRP. It sits at the far end of a long-term bullish roadmap and would require a rise of roughly 2,620%, or more than 27 times, from the chart's $1.47 region.
First, XRP would need to avoid a loss of $1.47 and then decisively break above $1.65, near its 33-month moving average.
From there, Egrag's chart maps several major hurdles: $3 and $5.50 appear before the bigger targets of $7.50, $13, and $30.
#xrp320 #mr320 #Trendingissue #WriteToEarn2026 #Trendingcoin320
63
·
--
Bullish
$XRP
{spot}(XRPUSDT)
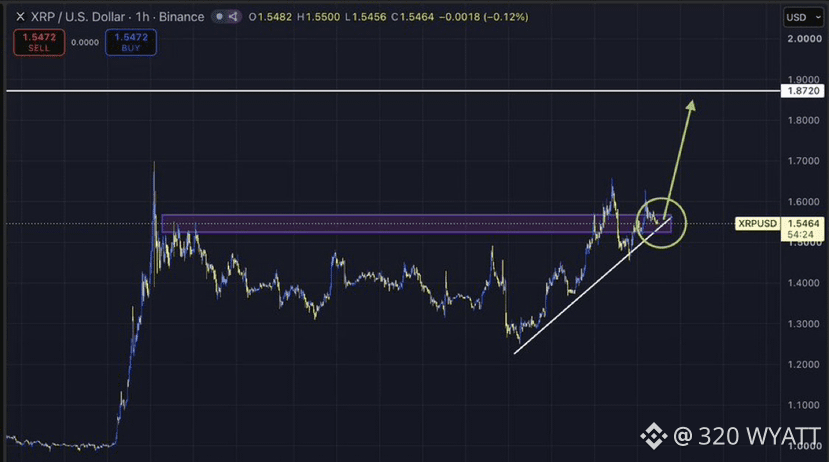
I’d be surprised if we don’t see a move like this from $XRP over the weekend.
$1.80+ is calling.
Pamp it 🟢
#xrp320 #mr320 #Trendingcoin320 #Trendingissue #WriteToEarn2026
$XRP
I’d be surprised if we don’t see a move like this from $XRP over the weekend.
$1.80+ is calling.
Pamp it 🟢
#xrp320 #mr320 #Trendingcoin320 #Trendingissue #WriteToEarn2026
I’d be surprised if we don’t see a move like this from $XRP over the weekend.
$1.80+ is calling.
Pamp it 🟢
#xrp320 #mr320 #Trendingcoin320 #Trendingissue #WriteToEarn2026
44
·
--
Bullish
$PEPE
{spot}(PEPEUSDT)
🚨PEPE's 12% Drop Shows the Other Side of a Hot Meme Rally🚨
PEPE entered the pullback after a strong multi-day advance. One September 24 market update put its weekly gain around 27% even after the sharp daily fall, while open interest had dropped from roughly $400 million to $334 million as momentum cooled. Profit-taking after the rally was a major part of the pressure. PEPE remained strongly positive for the week despite the selloff
None of that removes PEPE from the meme coin conversation. It shows the trade has reached a stage where early holders can sell into fresh buyers whenever the price runs hard. The public chart is already there, the crowd knows the name and every rally gives profitable holders another chance to cash out.
#pepe320 #mr320 #Trendingissue #WriteToEarn2026 #Trendingcoin320
$PEPE
🚨PEPE's 12% Drop Shows the Other Side of a Hot Meme Rally🚨
PEPE entered the pullback after a strong multi-day advance. One September 24 market update put its weekly gain around 27% even after the sharp daily fall, while open interest had dropped from roughly $400 million to $334 million as momentum cooled. Profit-taking after the rally was a major part of the pressure. PEPE remained strongly positive for the week despite the selloff
None of that removes PEPE from the meme coin conversation. It shows the trade has reached a stage where early holders can sell into fresh buyers whenever the price runs hard. The public chart is already there, the crowd knows the name and every rally gives profitable holders another chance to cash out.
#pepe320 #mr320 #Trendingissue #WriteToEarn2026 #Trendingcoin320
🚨PEPE's 12% Drop Shows the Other Side of a Hot Meme Rally🚨
PEPE entered the pullback after a strong multi-day advance. One September 24 market update put its weekly gain around 27% even after the sharp daily fall, while open interest had dropped from roughly $400 million to $334 million as momentum cooled. Profit-taking after the rally was a major part of the pressure. PEPE remained strongly positive for the week despite the selloff
None of that removes PEPE from the meme coin conversation. It shows the trade has reached a stage where early holders can sell into fresh buyers whenever the price runs hard. The public chart is already there, the crowd knows the name and every rally gives profitable holders another chance to cash out.
#pepe320 #mr320 #Trendingissue #WriteToEarn2026 #Trendingcoin320

17
·
--
Bullish
$BNB
{spot}(BNBUSDT)
BNB trades at $771.57 today, up 1.09% in 24 hours, per CoinMarketCap. For today, the line to watch is $780. KuCoin traders mark it as support right under the $800 wall. BNB has not closed above $800 since early 2026, Criptolog notes, so a close there would be big news.
For this week, Brave New Coin says a firm move past $807.49 is the step that matters most. For this month, the same report sets $869.15 as the next chart target, then $959.52, the last big high. On the way down, support sits at $750 to $760. Reaching $959 would be a gain of about 23%. That is a fine move for a coin worth over $100 billion. It is also a move that takes months, not days.
#BNB320 #Trendingcoin320 #mr320 #Trendingissue #WriteToEarn2026
$BNB
BNB trades at $771.57 today, up 1.09% in 24 hours, per CoinMarketCap. For today, the line to watch is $780. KuCoin traders mark it as support right under the $800 wall. BNB has not closed above $800 since early 2026, Criptolog notes, so a close there would be big news.
For this week, Brave New Coin says a firm move past $807.49 is the step that matters most. For this month, the same report sets $869.15 as the next chart target, then $959.52, the last big high. On the way down, support sits at $750 to $760. Reaching $959 would be a gain of about 23%. That is a fine move for a coin worth over $100 billion. It is also a move that takes months, not days.
#BNB320 #Trendingcoin320 #mr320 #Trendingissue #WriteToEarn2026
BNB trades at $771.57 today, up 1.09% in 24 hours, per CoinMarketCap. For today, the line to watch is $780. KuCoin traders mark it as support right under the $800 wall. BNB has not closed above $800 since early 2026, Criptolog notes, so a close there would be big news.
For this week, Brave New Coin says a firm move past $807.49 is the step that matters most. For this month, the same report sets $869.15 as the next chart target, then $959.52, the last big high. On the way down, support sits at $750 to $760. Reaching $959 would be a gain of about 23%. That is a fine move for a coin worth over $100 billion. It is also a move that takes months, not days.
#BNB320 #Trendingcoin320 #mr320 #Trendingissue #WriteToEarn2026

49
·
--
Bullish
$FIL
{spot}(FILUSDT)
FIL remains technically robust, with price holding comfortably above the MA-20 ($0.99), MA-50 ($0.97), and the long-term MA-200 ($0.84) on the hourly timeframe. The Ichimoku Kijun at $0.99 now serves as immediate support, while the latest surge establishes $1.03 as a near-term session high. Momentum indicators reinforce the bullish backdrop: MACD signals a buy, ADX is neutral, and RSI registers at 68.96, signaling strong upside yet approaching overbought territory. Both Stochastic RSI and CCI corroborate overbought conditions, while Bull/Bear Power and the Awesome Oscillator point to ongoing buyer dominance amid heightened volatility.
#Fil320 #mr320 #Trendingissue #Trendingcoin320 #WriteToEarn2026
$FIL
FIL remains technically robust, with price holding comfortably above the MA-20 ($0.99), MA-50 ($0.97), and the long-term MA-200 ($0.84) on the hourly timeframe. The Ichimoku Kijun at $0.99 now serves as immediate support, while the latest surge establishes $1.03 as a near-term session high. Momentum indicators reinforce the bullish backdrop: MACD signals a buy, ADX is neutral, and RSI registers at 68.96, signaling strong upside yet approaching overbought territory. Both Stochastic RSI and CCI corroborate overbought conditions, while Bull/Bear Power and the Awesome Oscillator point to ongoing buyer dominance amid heightened volatility.
#Fil320 #mr320 #Trendingissue #Trendingcoin320 #WriteToEarn2026
FIL remains technically robust, with price holding comfortably above the MA-20 ($0.99), MA-50 ($0.97), and the long-term MA-200 ($0.84) on the hourly timeframe. The Ichimoku Kijun at $0.99 now serves as immediate support, while the latest surge establishes $1.03 as a near-term session high. Momentum indicators reinforce the bullish backdrop: MACD signals a buy, ADX is neutral, and RSI registers at 68.96, signaling strong upside yet approaching overbought territory. Both Stochastic RSI and CCI corroborate overbought conditions, while Bull/Bear Power and the Awesome Oscillator point to ongoing buyer dominance amid heightened volatility.
#Fil320 #mr320 #Trendingissue #Trendingcoin320 #WriteToEarn2026

45
·
--
Bullish
Verified
$QNT
{spot}(QNTUSDT)
🚨
Why Is QNT’s Price Up Today?🚨
Quant (QNT) is up 40% to $101 in the past 24 hours, sharply outperforming the broader crypto market, which has remained mostly flat. The strong rally came mainly after a major institutional partnership announcement.
On September 24, Quant announced that The Clearing House had selected its technology for a new network that will help clear and settle tokenized deposits for U.S. financial institutions.
The network is expected to launch in the first half of 2027. The deal links Quant’s technology with major banking infrastructure and has fueled strong buying interest in QNT.
Social media sentiment is also strongly bullish, with a net score of 5.26, suggesting growing retail interest.
At the same time, the seven-day RSI has climbed to 78.83, showing strong buying pressure but also pointing to overbought conditions.
#QNT320 #mr320 #Trendingissue #Trendingcoin320 #writetoearn2026
$QNT
🚨
Why Is QNT’s Price Up Today?🚨
Quant (QNT) is up 40% to $101 in the past 24 hours, sharply outperforming the broader crypto market, which has remained mostly flat. The strong rally came mainly after a major institutional partnership announcement.
On September 24, Quant announced that The Clearing House had selected its technology for a new network that will help clear and settle tokenized deposits for U.S. financial institutions.
The network is expected to launch in the first half of 2027. The deal links Quant’s technology with major banking infrastructure and has fueled strong buying interest in QNT.
Social media sentiment is also strongly bullish, with a net score of 5.26, suggesting growing retail interest.
At the same time, the seven-day RSI has climbed to 78.83, showing strong buying pressure but also pointing to overbought conditions.
#QNT320 #mr320 #Trendingissue #Trendingcoin320 #writetoearn2026
🚨
Why Is QNT’s Price Up Today?🚨
Quant (QNT) is up 40% to $101 in the past 24 hours, sharply outperforming the broader crypto market, which has remained mostly flat. The strong rally came mainly after a major institutional partnership announcement.
On September 24, Quant announced that The Clearing House had selected its technology for a new network that will help clear and settle tokenized deposits for U.S. financial institutions.
The network is expected to launch in the first half of 2027. The deal links Quant’s technology with major banking infrastructure and has fueled strong buying interest in QNT.
Social media sentiment is also strongly bullish, with a net score of 5.26, suggesting growing retail interest.
At the same time, the seven-day RSI has climbed to 78.83, showing strong buying pressure but also pointing to overbought conditions.
#QNT320 #mr320 #Trendingissue #Trendingcoin320 #writetoearn2026

2
2.5k
·
--
Bullish
Verified
$XRP
{spot}(XRPUSDT)
XRP's price increased to $1.5509 on September 25, marking a 1.09% rise. Over the three trading sessions from September 22 to 24, U.S. spot XRP exchange-traded funds (ETFs) attracted around $52.95 million in net inflows, indicating strong investor interest. Bitwise and Franklin's XRP ETFs were notable recipients, with Bitwise receiving nearly $9.9 million on September 24. These inflows reflect capital moving into XRP-related investment products, which could support the token's market demand going forward.
XRP trades at Rp27,551 on Pluang as of September 25, 2026, 15:51 WIB, showing a 3.74% gain in the past day. The token's market cap stands at Rp1.726,73 trillion, with a 24-hour trading volume of Rp88,23 trillion. Despite a majority of sell orders at 56%, typical holders keep XRP for around 71 days on the platform.
#xrp320 #Trendingcoin320 #mr320 #WriteToEarn2026 #Trendingissue
$XRP
XRP's price increased to $1.5509 on September 25, marking a 1.09% rise. Over the three trading sessions from September 22 to 24, U.S. spot XRP exchange-traded funds (ETFs) attracted around $52.95 million in net inflows, indicating strong investor interest. Bitwise and Franklin's XRP ETFs were notable recipients, with Bitwise receiving nearly $9.9 million on September 24. These inflows reflect capital moving into XRP-related investment products, which could support the token's market demand going forward.
XRP trades at Rp27,551 on Pluang as of September 25, 2026, 15:51 WIB, showing a 3.74% gain in the past day. The token's market cap stands at Rp1.726,73 trillion, with a 24-hour trading volume of Rp88,23 trillion. Despite a majority of sell orders at 56%, typical holders keep XRP for around 71 days on the platform.
#xrp320 #Trendingcoin320 #mr320 #WriteToEarn2026 #Trendingissue
XRP's price increased to $1.5509 on September 25, marking a 1.09% rise. Over the three trading sessions from September 22 to 24, U.S. spot XRP exchange-traded funds (ETFs) attracted around $52.95 million in net inflows, indicating strong investor interest. Bitwise and Franklin's XRP ETFs were notable recipients, with Bitwise receiving nearly $9.9 million on September 24. These inflows reflect capital moving into XRP-related investment products, which could support the token's market demand going forward.
XRP trades at Rp27,551 on Pluang as of September 25, 2026, 15:51 WIB, showing a 3.74% gain in the past day. The token's market cap stands at Rp1.726,73 trillion, with a 24-hour trading volume of Rp88,23 trillion. Despite a majority of sell orders at 56%, typical holders keep XRP for around 71 days on the platform.
#xrp320 #Trendingcoin320 #mr320 #WriteToEarn2026 #Trendingissue
82
·
--
Bullish
$ADA
{spot}(ADAUSDT)
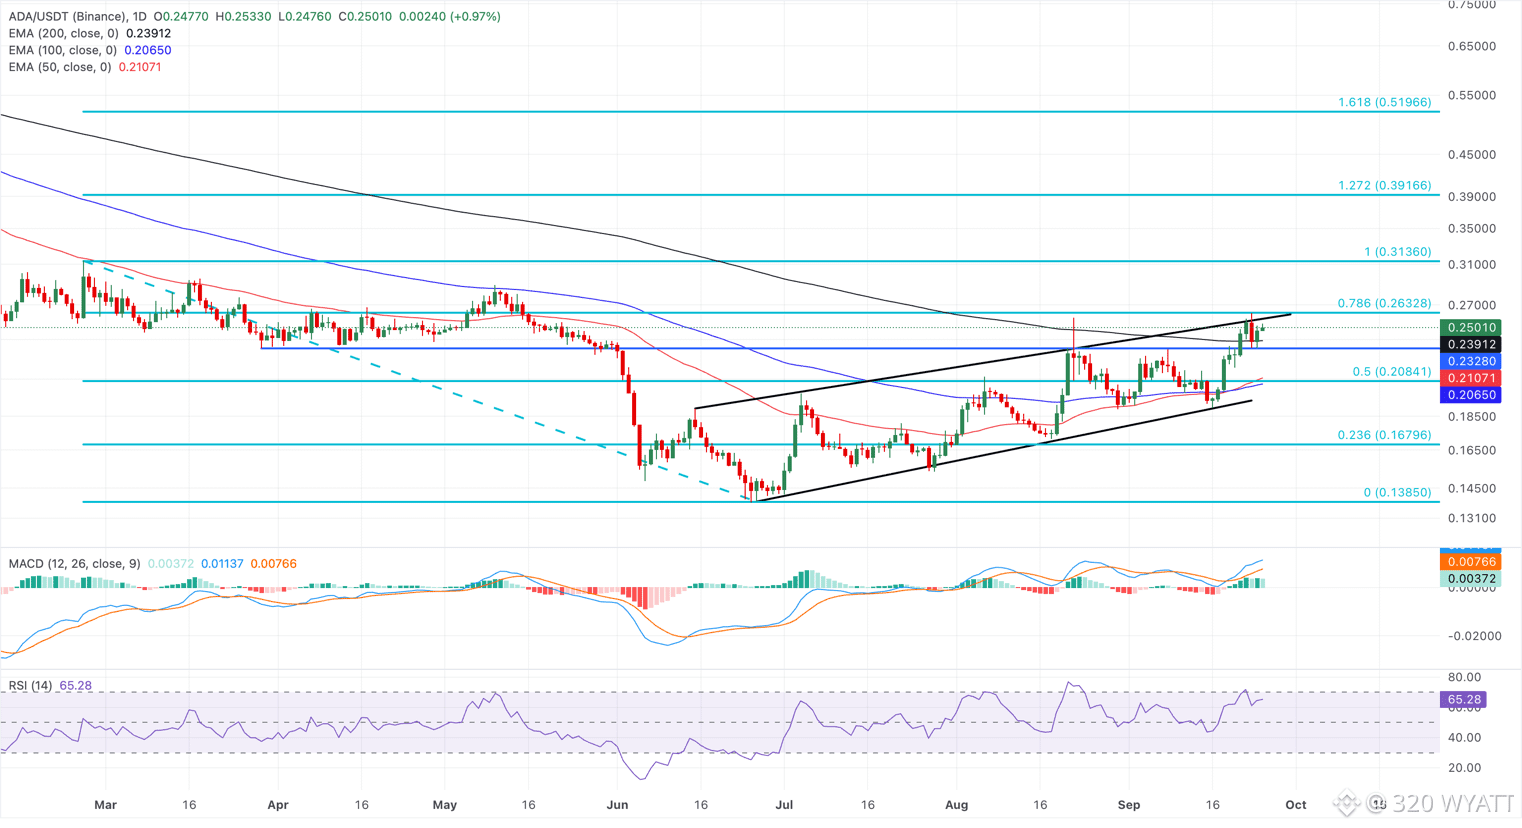
Cardano hovers around $0.2500 at press time on Friday, following a 4% rebound the previous day. The ADA token tests an overhead resistance trendline of the rising channel pattern, reinforced by the 78.6% Fibonacci retracement level at $0.2632, measured from $0.3136 to $0.1385.
A confirmed breakout above this resistance cluster could target the $0.3136 swing high, with upside toward the 1.272 Fibonacci extension level at $0.3916.
Momentum gauges back the constructive tone, with the RSI near 65 and the MACD in positive territory with a positive histogram, suggesting buyers retain control, albeit with conditions edging towards overbought.
On the flip side, the 200-day EMA at $0.2420 and the March 29 low at $0.2328 serve as the immediate support level, guarding the downside to the 50% retracement level at $0.2841, reinforced by the 50- and 100-day EMAs at $0.2106 and $0.2066, respectively.
#Ada320 #mr320 #Trendingcoin320 #Trendingissue #WriteToEarn2026
$ADA
Cardano hovers around $0.2500 at press time on Friday, following a 4% rebound the previous day. The ADA token tests an overhead resistance trendline of the rising channel pattern, reinforced by the 78.6% Fibonacci retracement level at $0.2632, measured from $0.3136 to $0.1385.
A confirmed breakout above this resistance cluster could target the $0.3136 swing high, with upside toward the 1.272 Fibonacci extension level at $0.3916.
Momentum gauges back the constructive tone, with the RSI near 65 and the MACD in positive territory with a positive histogram, suggesting buyers retain control, albeit with conditions edging towards overbought.
On the flip side, the 200-day EMA at $0.2420 and the March 29 low at $0.2328 serve as the immediate support level, guarding the downside to the 50% retracement level at $0.2841, reinforced by the 50- and 100-day EMAs at $0.2106 and $0.2066, respectively.
#Ada320 #mr320 #Trendingcoin320 #Trendingissue #WriteToEarn2026
Cardano hovers around $0.2500 at press time on Friday, following a 4% rebound the previous day. The ADA token tests an overhead resistance trendline of the rising channel pattern, reinforced by the 78.6% Fibonacci retracement level at $0.2632, measured from $0.3136 to $0.1385.
A confirmed breakout above this resistance cluster could target the $0.3136 swing high, with upside toward the 1.272 Fibonacci extension level at $0.3916.
Momentum gauges back the constructive tone, with the RSI near 65 and the MACD in positive territory with a positive histogram, suggesting buyers retain control, albeit with conditions edging towards overbought.
On the flip side, the 200-day EMA at $0.2420 and the March 29 low at $0.2328 serve as the immediate support level, guarding the downside to the 50% retracement level at $0.2841, reinforced by the 50- and 100-day EMAs at $0.2106 and $0.2066, respectively.
#Ada320 #mr320 #Trendingcoin320 #Trendingissue #WriteToEarn2026
39
·
--
Bullish
$SOL
{spot}(SOLUSDT)
🚨Solana poised for further rally🚨
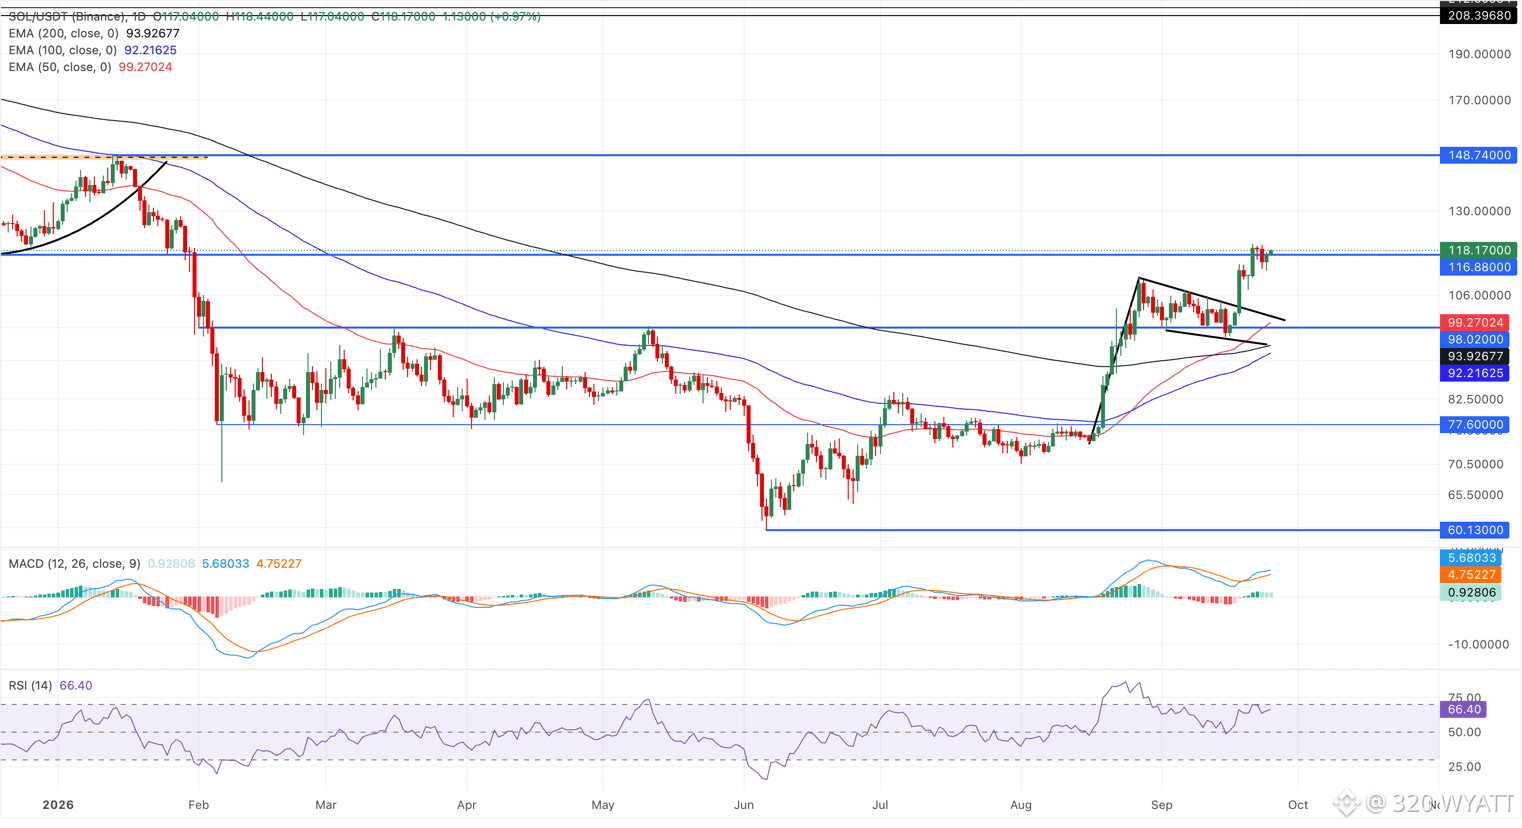
Solana trades around $118 on Friday, following a roughly 2% rebound the previous day. The altcoin holds significantly above the 50-, 100-, and 200-day EMAs at $99.27, $92.22, and $93.93, respectively, underpinning a constructive bullish bias.
From a technical perspective, the price is extending a breakout rally from a bullish flag pattern, marked by the 10% rally on September 18. To further extend the rally, Solana must confirm a bullish breakout of the December 18 low at $116.88, which could open the path toward the January 6 high at $148.74.
Momentum aligns with this stance, as the MACD remains above its signal line in positive territory, with a mildly positive histogram, while the RSI at 66 suggests firm bullish momentum without yet signaling extreme overbought conditions.
On the flip side, crucial support for Solana emerges at the broken trendline near the $100 psychological level, with the 50-day EMA at $99.21 reinforcing it.
#solana320 #mr320 #Trendingcoin320 #Trendingissue #writetoearn2026
$SOL
🚨Solana poised for further rally🚨
Solana trades around $118 on Friday, following a roughly 2% rebound the previous day. The altcoin holds significantly above the 50-, 100-, and 200-day EMAs at $99.27, $92.22, and $93.93, respectively, underpinning a constructive bullish bias.
From a technical perspective, the price is extending a breakout rally from a bullish flag pattern, marked by the 10% rally on September 18. To further extend the rally, Solana must confirm a bullish breakout of the December 18 low at $116.88, which could open the path toward the January 6 high at $148.74.
Momentum aligns with this stance, as the MACD remains above its signal line in positive territory, with a mildly positive histogram, while the RSI at 66 suggests firm bullish momentum without yet signaling extreme overbought conditions.
On the flip side, crucial support for Solana emerges at the broken trendline near the $100 psychological level, with the 50-day EMA at $99.21 reinforcing it.
#solana320 #mr320 #Trendingcoin320 #Trendingissue #writetoearn2026
🚨Solana poised for further rally🚨
Solana trades around $118 on Friday, following a roughly 2% rebound the previous day. The altcoin holds significantly above the 50-, 100-, and 200-day EMAs at $99.27, $92.22, and $93.93, respectively, underpinning a constructive bullish bias.
From a technical perspective, the price is extending a breakout rally from a bullish flag pattern, marked by the 10% rally on September 18. To further extend the rally, Solana must confirm a bullish breakout of the December 18 low at $116.88, which could open the path toward the January 6 high at $148.74.
Momentum aligns with this stance, as the MACD remains above its signal line in positive territory, with a mildly positive histogram, while the RSI at 66 suggests firm bullish momentum without yet signaling extreme overbought conditions.
On the flip side, crucial support for Solana emerges at the broken trendline near the $100 psychological level, with the 50-day EMA at $99.21 reinforcing it.
#solana320 #mr320 #Trendingcoin320 #Trendingissue #writetoearn2026
69
·
--
Bullish
$XRP
{spot}(XRPUSDT)
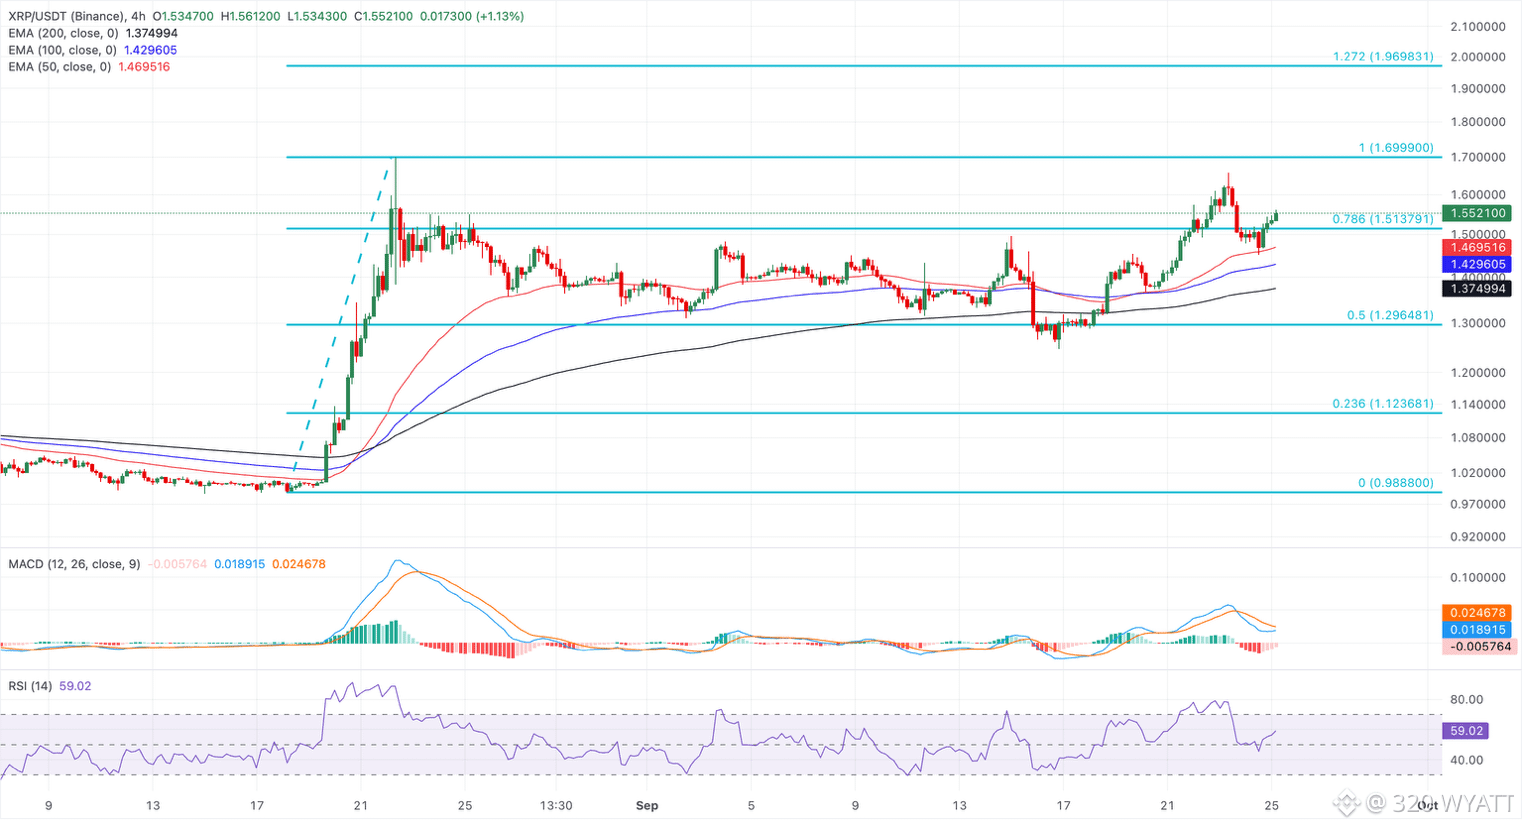
🚨Ripple takes a rebound above $1.50🚨
Ripple trades above $1.55 at press time on Friday, maintaining a constructive near-term bias. The cross-border remittance token stays clearly above the 50-, 100- and 200-period Exponential Moving Averages (EMAs) on the four-hour chart, which fan out positively, hinting at an intact uptrend structure.
Momentum is moderately supportive on the same chart, with the Relative Strength Index (RSI) hovering just under 60, while the Moving Average Convergence Divergence (MACD) remains marginally below zero, suggesting the latest advance is slowing but not yet reversing.
#xrp320 #mr320 #Trendingcoin320 #Trendingissue #WriteToEarn2026
$XRP
🚨Ripple takes a rebound above $1.50🚨
Ripple trades above $1.55 at press time on Friday, maintaining a constructive near-term bias. The cross-border remittance token stays clearly above the 50-, 100- and 200-period Exponential Moving Averages (EMAs) on the four-hour chart, which fan out positively, hinting at an intact uptrend structure.
Momentum is moderately supportive on the same chart, with the Relative Strength Index (RSI) hovering just under 60, while the Moving Average Convergence Divergence (MACD) remains marginally below zero, suggesting the latest advance is slowing but not yet reversing.
#xrp320 #mr320 #Trendingcoin320 #Trendingissue #WriteToEarn2026
🚨Ripple takes a rebound above $1.50🚨
Ripple trades above $1.55 at press time on Friday, maintaining a constructive near-term bias. The cross-border remittance token stays clearly above the 50-, 100- and 200-period Exponential Moving Averages (EMAs) on the four-hour chart, which fan out positively, hinting at an intact uptrend structure.
Momentum is moderately supportive on the same chart, with the Relative Strength Index (RSI) hovering just under 60, while the Moving Average Convergence Divergence (MACD) remains marginally below zero, suggesting the latest advance is slowing but not yet reversing.
#xrp320 #mr320 #Trendingcoin320 #Trendingissue #WriteToEarn2026
15
·
--
Bullish
$BTC
{spot}(BTCUSDT)
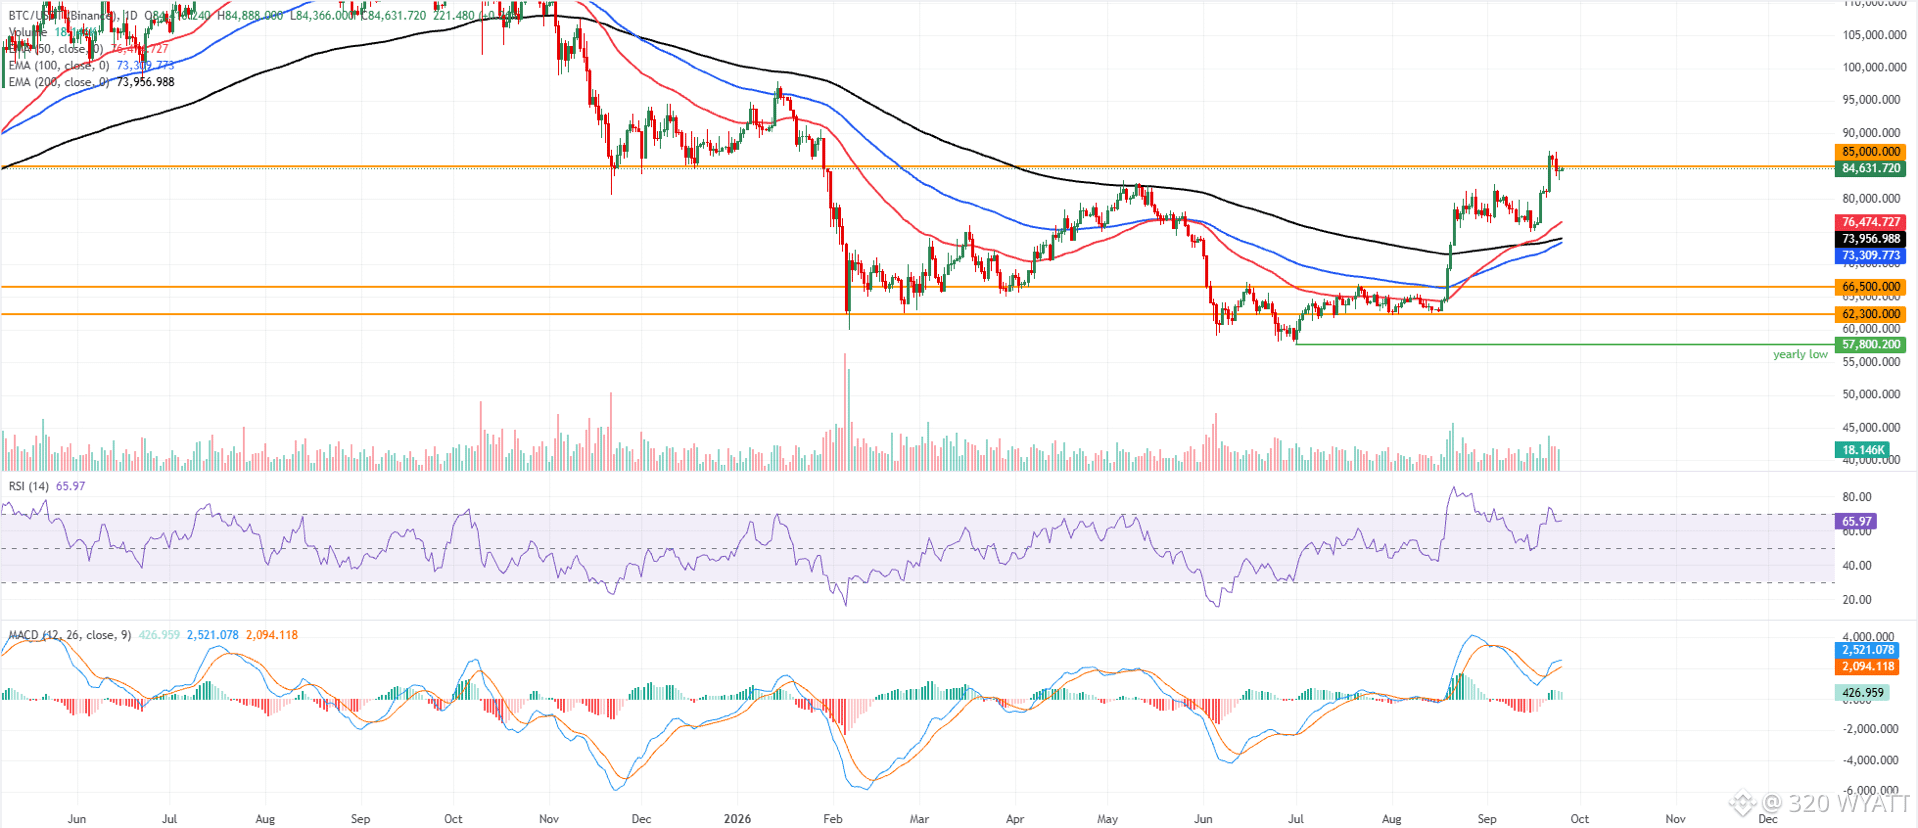
Bitcoin price trades at $84,631 on Friday, retaining a bullish near-term bias as it holds well above the 50-day, 100-day and 200-day Exponential Moving Averages (EMAs) clustered between roughly $73,300 and $76,400.
The Relative Strength Index (RSI) at 65 stays in positive territory without being overbought, while the Moving Average Convergence Divergence (MACD) remains in positive territory with the signal line above zero, hinting that upside momentum is still constructive even after the recent surge.
On the topside, immediate resistance is seen at the horizontal barrier near $85,000.
On the downside, the first relevant support is around the 50-day EMA at $76,474 and the 200-day and 100-day EMAs at $73,956 and $73,309, which form a broader demand zone on pullbacks. Deeper declines would expose horizontal supports at $66,500 and $62,300, where buyers could attempt to reassert control if a larger correction unfolds.
#BTC320 #Trendingcoin320 #mr320 #WriteToEarn2026 #Trendingissue
$BTC
Bitcoin price trades at $84,631 on Friday, retaining a bullish near-term bias as it holds well above the 50-day, 100-day and 200-day Exponential Moving Averages (EMAs) clustered between roughly $73,300 and $76,400.
The Relative Strength Index (RSI) at 65 stays in positive territory without being overbought, while the Moving Average Convergence Divergence (MACD) remains in positive territory with the signal line above zero, hinting that upside momentum is still constructive even after the recent surge.
On the topside, immediate resistance is seen at the horizontal barrier near $85,000.
On the downside, the first relevant support is around the 50-day EMA at $76,474 and the 200-day and 100-day EMAs at $73,956 and $73,309, which form a broader demand zone on pullbacks. Deeper declines would expose horizontal supports at $66,500 and $62,300, where buyers could attempt to reassert control if a larger correction unfolds.
#BTC320 #Trendingcoin320 #mr320 #WriteToEarn2026 #Trendingissue
Bitcoin price trades at $84,631 on Friday, retaining a bullish near-term bias as it holds well above the 50-day, 100-day and 200-day Exponential Moving Averages (EMAs) clustered between roughly $73,300 and $76,400.
The Relative Strength Index (RSI) at 65 stays in positive territory without being overbought, while the Moving Average Convergence Divergence (MACD) remains in positive territory with the signal line above zero, hinting that upside momentum is still constructive even after the recent surge.
On the topside, immediate resistance is seen at the horizontal barrier near $85,000.
On the downside, the first relevant support is around the 50-day EMA at $76,474 and the 200-day and 100-day EMAs at $73,956 and $73,309, which form a broader demand zone on pullbacks. Deeper declines would expose horizontal supports at $66,500 and $62,300, where buyers could attempt to reassert control if a larger correction unfolds.
#BTC320 #Trendingcoin320 #mr320 #WriteToEarn2026 #Trendingissue
59
·
--
Bullish
$XRP
{spot}(XRPUSDT)
XRP price recovered above $1.50 after dropping near $1.45 during a broader crypto market sell-off. The number of XRP holder addresses rose to 8.15 million, indicating growing interest beyond daily trading fluctuations. However, recent inflows of about 524,000 XRP to exchanges suggest some holders may be preparing to sell, though the scale is modest compared to earlier spikes. If XRP holds support around $1.45 and breaks above $1.60, it could continue its upward trend toward $1.66, but a drop below $1.42 might shift focus to lower support levels.
XRP trades at Rp27,506 on Pluang, up 3.50% as of Sep 25, 2026 04:43 WIB, showing resilience after recent market fluctuations. The platform sees a balanced order activity with 56% selling and 44% buying, and typical holders keep XRP for about 71 days. This steady trading behavior complements the news of rising holder addresses reaching 8.15 million, indicating sustained interest in XRP beyond short-term price moves.
#xrp320 #mr320 #Trendingcoin320 #WriteToEarn2026 #xrp
$XRP
XRP price recovered above $1.50 after dropping near $1.45 during a broader crypto market sell-off. The number of XRP holder addresses rose to 8.15 million, indicating growing interest beyond daily trading fluctuations. However, recent inflows of about 524,000 XRP to exchanges suggest some holders may be preparing to sell, though the scale is modest compared to earlier spikes. If XRP holds support around $1.45 and breaks above $1.60, it could continue its upward trend toward $1.66, but a drop below $1.42 might shift focus to lower support levels.
XRP trades at Rp27,506 on Pluang, up 3.50% as of Sep 25, 2026 04:43 WIB, showing resilience after recent market fluctuations. The platform sees a balanced order activity with 56% selling and 44% buying, and typical holders keep XRP for about 71 days. This steady trading behavior complements the news of rising holder addresses reaching 8.15 million, indicating sustained interest in XRP beyond short-term price moves.
#xrp320 #mr320 #Trendingcoin320 #WriteToEarn2026 #xrp
XRP price recovered above $1.50 after dropping near $1.45 during a broader crypto market sell-off. The number of XRP holder addresses rose to 8.15 million, indicating growing interest beyond daily trading fluctuations. However, recent inflows of about 524,000 XRP to exchanges suggest some holders may be preparing to sell, though the scale is modest compared to earlier spikes. If XRP holds support around $1.45 and breaks above $1.60, it could continue its upward trend toward $1.66, but a drop below $1.42 might shift focus to lower support levels.
XRP trades at Rp27,506 on Pluang, up 3.50% as of Sep 25, 2026 04:43 WIB, showing resilience after recent market fluctuations. The platform sees a balanced order activity with 56% selling and 44% buying, and typical holders keep XRP for about 71 days. This steady trading behavior complements the news of rising holder addresses reaching 8.15 million, indicating sustained interest in XRP beyond short-term price moves.
#xrp320 #mr320 #Trendingcoin320 #WriteToEarn2026 #xrp
110
·
--
Bullish
$BTC
{spot}(BTCUSDT)
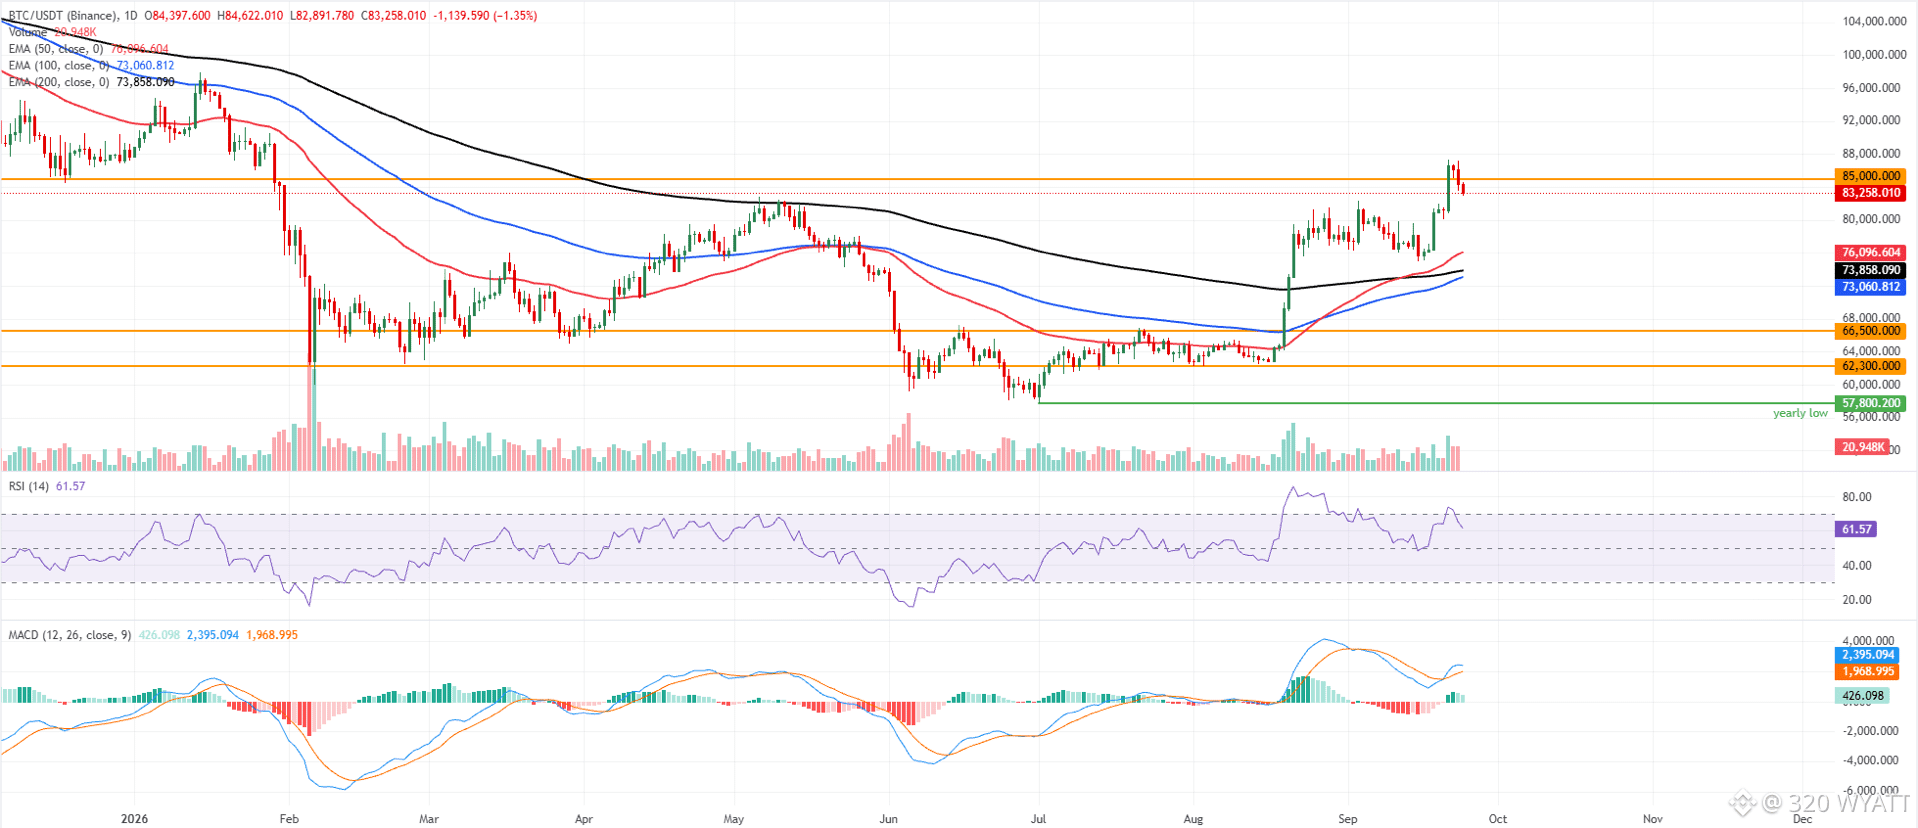
Bitcoin price trades at $84,550 at the time of writing on Thursday, extending the correction for the third consecutive day. Despite the pullback, BTC maintains a bullish near‑term bias as it holds well above the 50-day, 100-day and 200-day Exponential Moving Averages (EMAs) clustered between roughly $73,000 and $76,000.
The broader uptrend remains intact, with the Relative Strength Index (RSI) around 62 on the daily chart, pointing to firm but not extreme bullish momentum. At the same time, the Moving Average Convergence Divergence (MACD) histogram stays in positive territory, suggesting upside pressure remains despite the recent decline from the latest highs.
On the topside, initial resistance emerges at the horizontal barrier near $85,000, where a clear break would open the way for a higher rise into the $100,000 mark.
On the downside, immediate demand is expected around the current price area, followed by stronger structural support at the 50-day EMA at $76,096, the 200-day EMA at $73,858 and the 100-day EMA at $73,060. A deeper retracement toward the horizontal floors at $66,500 and $62,300 would still leave the broader bullish structure intact but signal a more extended corrective phase.
#BTC320 #mr320 #Trendingissue #WriteToEarn2026 #Trendingcoin320
$BTC
Bitcoin price trades at $84,550 at the time of writing on Thursday, extending the correction for the third consecutive day. Despite the pullback, BTC maintains a bullish near‑term bias as it holds well above the 50-day, 100-day and 200-day Exponential Moving Averages (EMAs) clustered between roughly $73,000 and $76,000.
The broader uptrend remains intact, with the Relative Strength Index (RSI) around 62 on the daily chart, pointing to firm but not extreme bullish momentum. At the same time, the Moving Average Convergence Divergence (MACD) histogram stays in positive territory, suggesting upside pressure remains despite the recent decline from the latest highs.
On the topside, initial resistance emerges at the horizontal barrier near $85,000, where a clear break would open the way for a higher rise into the $100,000 mark.
On the downside, immediate demand is expected around the current price area, followed by stronger structural support at the 50-day EMA at $76,096, the 200-day EMA at $73,858 and the 100-day EMA at $73,060. A deeper retracement toward the horizontal floors at $66,500 and $62,300 would still leave the broader bullish structure intact but signal a more extended corrective phase.
#BTC320 #mr320 #Trendingissue #WriteToEarn2026 #Trendingcoin320
Bitcoin price trades at $84,550 at the time of writing on Thursday, extending the correction for the third consecutive day. Despite the pullback, BTC maintains a bullish near‑term bias as it holds well above the 50-day, 100-day and 200-day Exponential Moving Averages (EMAs) clustered between roughly $73,000 and $76,000.
The broader uptrend remains intact, with the Relative Strength Index (RSI) around 62 on the daily chart, pointing to firm but not extreme bullish momentum. At the same time, the Moving Average Convergence Divergence (MACD) histogram stays in positive territory, suggesting upside pressure remains despite the recent decline from the latest highs.
On the topside, initial resistance emerges at the horizontal barrier near $85,000, where a clear break would open the way for a higher rise into the $100,000 mark.
On the downside, immediate demand is expected around the current price area, followed by stronger structural support at the 50-day EMA at $76,096, the 200-day EMA at $73,858 and the 100-day EMA at $73,060. A deeper retracement toward the horizontal floors at $66,500 and $62,300 would still leave the broader bullish structure intact but signal a more extended corrective phase.
#BTC320 #mr320 #Trendingissue #WriteToEarn2026 #Trendingcoin320
25
·
--
Bullish
$FIL
{spot}(FILUSDT)
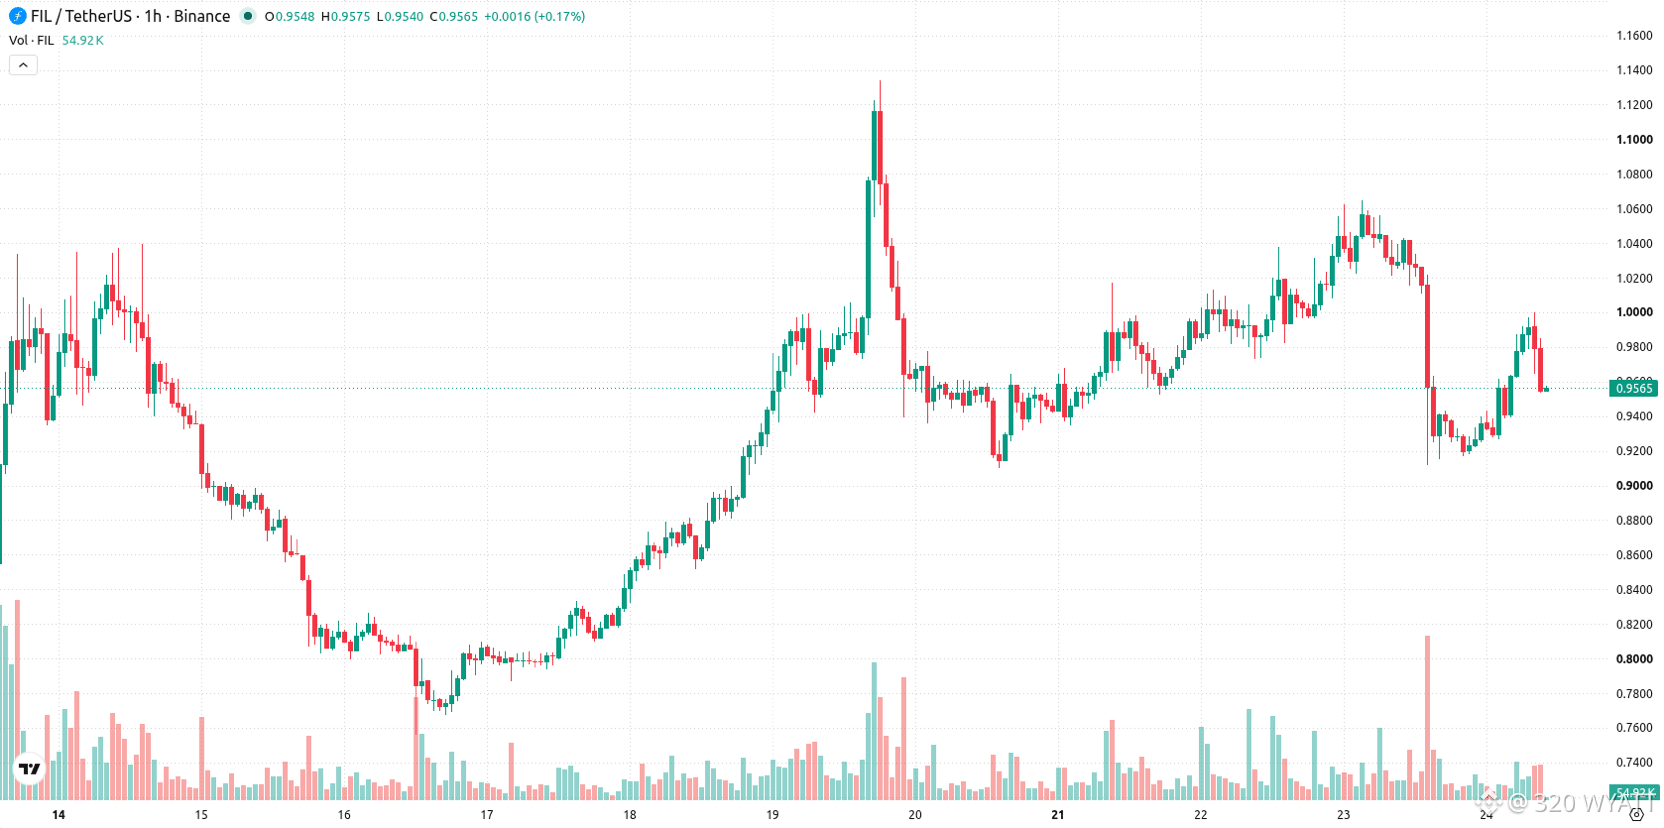
FIL remains above the MA-20 but is capped below the MA-50, while preserving distance from the MA-200 for long-term support. Immediate resistance is seen at the Ichimoku Kijun level of $0.97735, with the current range defined by $0.8889707 as key support and $1.0596 as the upper boundary. On the indicator front, MACD and ADX both reflect a strong bias toward sellers, but RSI hovers near neutral and shows a buy, while both Stochastic RSI and CCI have entered overbought territory. Bull/Bear Power detects intraday buyer activity, countered by a neutral Awesome Oscillator. This divergence among technical signals highlights mixed underlying momentum.
#Fil320 #mr320 #Trendingissue #writetoearn2026 #Trendingcoin320
$FIL
FIL remains above the MA-20 but is capped below the MA-50, while preserving distance from the MA-200 for long-term support. Immediate resistance is seen at the Ichimoku Kijun level of $0.97735, with the current range defined by $0.8889707 as key support and $1.0596 as the upper boundary. On the indicator front, MACD and ADX both reflect a strong bias toward sellers, but RSI hovers near neutral and shows a buy, while both Stochastic RSI and CCI have entered overbought territory. Bull/Bear Power detects intraday buyer activity, countered by a neutral Awesome Oscillator. This divergence among technical signals highlights mixed underlying momentum.
#Fil320 #mr320 #Trendingissue #writetoearn2026 #Trendingcoin320
FIL remains above the MA-20 but is capped below the MA-50, while preserving distance from the MA-200 for long-term support. Immediate resistance is seen at the Ichimoku Kijun level of $0.97735, with the current range defined by $0.8889707 as key support and $1.0596 as the upper boundary. On the indicator front, MACD and ADX both reflect a strong bias toward sellers, but RSI hovers near neutral and shows a buy, while both Stochastic RSI and CCI have entered overbought territory. Bull/Bear Power detects intraday buyer activity, countered by a neutral Awesome Oscillator. This divergence among technical signals highlights mixed underlying momentum.
#Fil320 #mr320 #Trendingissue #writetoearn2026 #Trendingcoin320
48
·
--
Bullish
$XRP
{spot}(XRPUSDT)
A $1,000 investment in XRP on September 24, 2026, could double to $2,000 if the token reaches its 52-week opening price of $2.94. XRP traded at about $1.47 at the time, with a 12-month high of $3.04 and a low of $0.98. Market data shows a 40% chance XRP will hit $2 by the end of 2026, with higher probabilities in 2027. Price movements will be influenced by Bitcoin trends and developments at Ripple Labs, including institutional adoption and potential market dilution.
XRP is currently priced at Rp26,674 on Pluang as of September 24, 2026, 20:21 WIB. The token has seen a 1-day decline of 3.96%, with a market capitalization of Rp1.658,04 trillion. Pluang users show a slight selling bias with 56% of orders to sell versus 44% to buy, and the typical holding period is 71 days.
#xrp320 #xrp #Trendingissue #Trendingcoin320 #WriteToEarn2026
$XRP
A $1,000 investment in XRP on September 24, 2026, could double to $2,000 if the token reaches its 52-week opening price of $2.94. XRP traded at about $1.47 at the time, with a 12-month high of $3.04 and a low of $0.98. Market data shows a 40% chance XRP will hit $2 by the end of 2026, with higher probabilities in 2027. Price movements will be influenced by Bitcoin trends and developments at Ripple Labs, including institutional adoption and potential market dilution.
XRP is currently priced at Rp26,674 on Pluang as of September 24, 2026, 20:21 WIB. The token has seen a 1-day decline of 3.96%, with a market capitalization of Rp1.658,04 trillion. Pluang users show a slight selling bias with 56% of orders to sell versus 44% to buy, and the typical holding period is 71 days.
#xrp320 #xrp #Trendingissue #Trendingcoin320 #WriteToEarn2026
A $1,000 investment in XRP on September 24, 2026, could double to $2,000 if the token reaches its 52-week opening price of $2.94. XRP traded at about $1.47 at the time, with a 12-month high of $3.04 and a low of $0.98. Market data shows a 40% chance XRP will hit $2 by the end of 2026, with higher probabilities in 2027. Price movements will be influenced by Bitcoin trends and developments at Ripple Labs, including institutional adoption and potential market dilution.
XRP is currently priced at Rp26,674 on Pluang as of September 24, 2026, 20:21 WIB. The token has seen a 1-day decline of 3.96%, with a market capitalization of Rp1.658,04 trillion. Pluang users show a slight selling bias with 56% of orders to sell versus 44% to buy, and the typical holding period is 71 days.
#xrp320 #xrp #Trendingissue #Trendingcoin320 #WriteToEarn2026
39
Log in to explore more content
Join global crypto users on Binance Square
⚡️ Get latest and useful information about crypto.
💬 Trusted by the world’s largest crypto exchange.
👍 Discover real insights from verified creators.
Email / Phone number
Trending Topics
1
#ZcashETFPostsFirstWeeklyOutflow$93.6M
3,609 views
32 Discussing
2
#GreekPoliceBustCryptoScamRingArrest17
5,067 views
141 Discussing
3
#BitcoinRejectedAt$87K
62,664 views
97 Discussing
4
#FedOctoberRateHikeOddsFallTo17%
35,062 views
546 Discussing
5
#NvidiaHitsRecordHighUp2.4%
16,806 views
368 Discussing
6
#CanaryFilesAmendedS1ForPEPEETF
7,663 views
249 Discussing
7
#USRussiaUkraineTalksReportedlyIncludeLukoilOilDeal
16,804 views
308 Discussing
8
#BitcoinParesGainsAfterRallyTo$86.5K
40,696 views
154 Discussing
9
#CerebrasSinksNearly20%OnReportNvidiaToPowerOpenAI
92,084 views
904 Discussing
10
#SECProposesCryptoCustodyRules
118,676 views
1,111 Discussing