
#writetoearn320
writetoearn320
7,316 views
84 Discussing
Hot
Latest

·
--
Bullish
$XRP
{spot}(XRPUSDT)
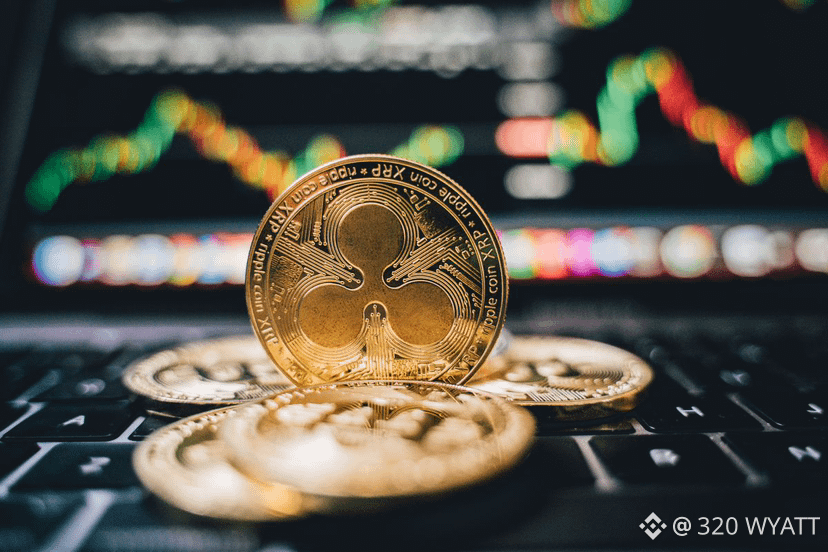
XRP is currently trading at $1.253, maintaining a bearish outlook as it stays below its key 50, 100, and 200-day EMAs. A low RSI of 37 and a negative MACD confirm that sellers still control the market momentum.
To reverse this downward trend and push toward $1.900, XRP must first break past initial resistance at $1.300 and clear the critical $1.540 level. Without immediate support, falling below $1.250 could trigger deeper losses before finding fresh buyer demand.
#xrp320 #mr320 #Trendingissue #writetoearn320 #Trendingcoin320
$XRP
XRP is currently trading at $1.253, maintaining a bearish outlook as it stays below its key 50, 100, and 200-day EMAs. A low RSI of 37 and a negative MACD confirm that sellers still control the market momentum.
To reverse this downward trend and push toward $1.900, XRP must first break past initial resistance at $1.300 and clear the critical $1.540 level. Without immediate support, falling below $1.250 could trigger deeper losses before finding fresh buyer demand.
#xrp320 #mr320 #Trendingissue #writetoearn320 #Trendingcoin320
XRP is currently trading at $1.253, maintaining a bearish outlook as it stays below its key 50, 100, and 200-day EMAs. A low RSI of 37 and a negative MACD confirm that sellers still control the market momentum.
To reverse this downward trend and push toward $1.900, XRP must first break past initial resistance at $1.300 and clear the critical $1.540 level. Without immediate support, falling below $1.250 could trigger deeper losses before finding fresh buyer demand.
#xrp320 #mr320 #Trendingissue #writetoearn320 #Trendingcoin320
539
·
--
Bullish
$ETH
{spot}(ETHUSDT)
Ethereum is currently trading at $2,295, maintaining a short-term bearish bias as it holds below key Exponential Moving Averages (EMAs). If the price attempts a recovery, it faces immediate overhead resistance at the 200-day EMA near $2,313, followed by the 100-day EMA at $2,353, and a broken ascending trendline pivot at $2,385. Higher horizontal and moving average barriers stand at $2,400 and $2,417 respectively, with a major cap further off at $2,770. On the downside, if the current pullback extends, the next critical structural support sits near $1,823, where buyers are expected to step in and defend the broader uptrend. This bearish outlook is supported by technical indicators, as the RSI remains weak at 37 and the MACD is negative, suggesting that any upward bounces will likely trigger selling pressure into nearby resistance.
#ETH320 #Trendingissue #Trendingcoin320 #mr320 #writetoearn320
$ETH
Ethereum is currently trading at $2,295, maintaining a short-term bearish bias as it holds below key Exponential Moving Averages (EMAs). If the price attempts a recovery, it faces immediate overhead resistance at the 200-day EMA near $2,313, followed by the 100-day EMA at $2,353, and a broken ascending trendline pivot at $2,385. Higher horizontal and moving average barriers stand at $2,400 and $2,417 respectively, with a major cap further off at $2,770. On the downside, if the current pullback extends, the next critical structural support sits near $1,823, where buyers are expected to step in and defend the broader uptrend. This bearish outlook is supported by technical indicators, as the RSI remains weak at 37 and the MACD is negative, suggesting that any upward bounces will likely trigger selling pressure into nearby resistance.
#ETH320 #Trendingissue #Trendingcoin320 #mr320 #writetoearn320
Ethereum is currently trading at $2,295, maintaining a short-term bearish bias as it holds below key Exponential Moving Averages (EMAs). If the price attempts a recovery, it faces immediate overhead resistance at the 200-day EMA near $2,313, followed by the 100-day EMA at $2,353, and a broken ascending trendline pivot at $2,385. Higher horizontal and moving average barriers stand at $2,400 and $2,417 respectively, with a major cap further off at $2,770. On the downside, if the current pullback extends, the next critical structural support sits near $1,823, where buyers are expected to step in and defend the broader uptrend. This bearish outlook is supported by technical indicators, as the RSI remains weak at 37 and the MACD is negative, suggesting that any upward bounces will likely trigger selling pressure into nearby resistance.
#ETH320 #Trendingissue #Trendingcoin320 #mr320 #writetoearn320

127
·
--
Bullish
$BTC
{spot}(BTCUSDT)
Bitcoin is currently consolidating at $78,462 as short-term momentum shifts bearish, wedged tightly between key Exponential Moving Averages (EMAs). While the 50-day EMA at $80,307 presents strong overhead resistance and caps bullish recovery, the 100-day and 200-day EMAs at $77,831 and $76,471 provide solid underlying support that keeps the macro structure intact. Momentum indicators are weak—with the RSI near 40 and a negative MACD—reflecting exhausted buying pressure rather than market panic.
Ultimately, Bitcoin remains locked in a range-bound phase until a decisive breakout occurs. Bulls must reclaim the 50-day EMA at $80,307 to target the next major resistance at $85,000. Conversely, immediate downside protection sits at $77,831, but a daily close below the critical $76,471 floor would break the macro structure and trigger a much deeper market correction.
#BTC320 #Trendingissue #Trendingcoin320 #writetoearn320 #mr320
$BTC
Bitcoin is currently consolidating at $78,462 as short-term momentum shifts bearish, wedged tightly between key Exponential Moving Averages (EMAs). While the 50-day EMA at $80,307 presents strong overhead resistance and caps bullish recovery, the 100-day and 200-day EMAs at $77,831 and $76,471 provide solid underlying support that keeps the macro structure intact. Momentum indicators are weak—with the RSI near 40 and a negative MACD—reflecting exhausted buying pressure rather than market panic.
Ultimately, Bitcoin remains locked in a range-bound phase until a decisive breakout occurs. Bulls must reclaim the 50-day EMA at $80,307 to target the next major resistance at $85,000. Conversely, immediate downside protection sits at $77,831, but a daily close below the critical $76,471 floor would break the macro structure and trigger a much deeper market correction.
#BTC320 #Trendingissue #Trendingcoin320 #writetoearn320 #mr320
Bitcoin is currently consolidating at $78,462 as short-term momentum shifts bearish, wedged tightly between key Exponential Moving Averages (EMAs). While the 50-day EMA at $80,307 presents strong overhead resistance and caps bullish recovery, the 100-day and 200-day EMAs at $77,831 and $76,471 provide solid underlying support that keeps the macro structure intact. Momentum indicators are weak—with the RSI near 40 and a negative MACD—reflecting exhausted buying pressure rather than market panic.
Ultimately, Bitcoin remains locked in a range-bound phase until a decisive breakout occurs. Bulls must reclaim the 50-day EMA at $80,307 to target the next major resistance at $85,000. Conversely, immediate downside protection sits at $77,831, but a daily close below the critical $76,471 floor would break the macro structure and trigger a much deeper market correction.
#BTC320 #Trendingissue #Trendingcoin320 #writetoearn320 #mr320

200
·
--
Bullish
$XRP
{spot}(XRPUSDT)
XRP is in a strong bullish trend but shows some short-term caution.
• Bullish Signals: The price is trading above key moving averages (hourly MA-20, MA-50, and daily MA-200), indicating strong upward momentum. Main indicators like MACD, ADX, RSI, and Stoch RSI all confirm firm buyer control and strong buying conditions.
• Support Level: The Ichimoku Kijun provides immediate support at $1.3184.
• Caution: Despite the overall bullish setup, XRP is currently trading near its session low with low volatility, suggesting a slow or cautious intraday outlook.
#xrp320 #Trendingissue #Trendingcoin320 #writetoearn320 #mr320
$XRP
XRP is in a strong bullish trend but shows some short-term caution.
• Bullish Signals: The price is trading above key moving averages (hourly MA-20, MA-50, and daily MA-200), indicating strong upward momentum. Main indicators like MACD, ADX, RSI, and Stoch RSI all confirm firm buyer control and strong buying conditions.
• Support Level: The Ichimoku Kijun provides immediate support at $1.3184.
• Caution: Despite the overall bullish setup, XRP is currently trading near its session low with low volatility, suggesting a slow or cautious intraday outlook.
#xrp320 #Trendingissue #Trendingcoin320 #writetoearn320 #mr320
XRP is in a strong bullish trend but shows some short-term caution.
• Bullish Signals: The price is trading above key moving averages (hourly MA-20, MA-50, and daily MA-200), indicating strong upward momentum. Main indicators like MACD, ADX, RSI, and Stoch RSI all confirm firm buyer control and strong buying conditions.
• Support Level: The Ichimoku Kijun provides immediate support at $1.3184.
• Caution: Despite the overall bullish setup, XRP is currently trading near its session low with low volatility, suggesting a slow or cautious intraday outlook.
#xrp320 #Trendingissue #Trendingcoin320 #writetoearn320 #mr320
1
282
·
--
Bearish
$XRP
{spot}(XRPUSDT)
XRP experienced a sharp, short-term liquidity flush on October 14, plunging 2.16% within a single hour from $1.36 to $1.33. This swift depreciation extended its 24-hour losses to 2.92%, triggering a wave of long capitulation.
#xrp320 #Trendingissue #Trendingcoin320 #mr320 #writetoearn320
$XRP
XRP experienced a sharp, short-term liquidity flush on October 14, plunging 2.16% within a single hour from $1.36 to $1.33. This swift depreciation extended its 24-hour losses to 2.92%, triggering a wave of long capitulation.
#xrp320 #Trendingissue #Trendingcoin320 #mr320 #writetoearn320
XRP experienced a sharp, short-term liquidity flush on October 14, plunging 2.16% within a single hour from $1.36 to $1.33. This swift depreciation extended its 24-hour losses to 2.92%, triggering a wave of long capitulation.
#xrp320 #Trendingissue #Trendingcoin320 #mr320 #writetoearn320
1
276
·
--
Bullish
Verified
$XRP
{spot}(XRPUSDT)
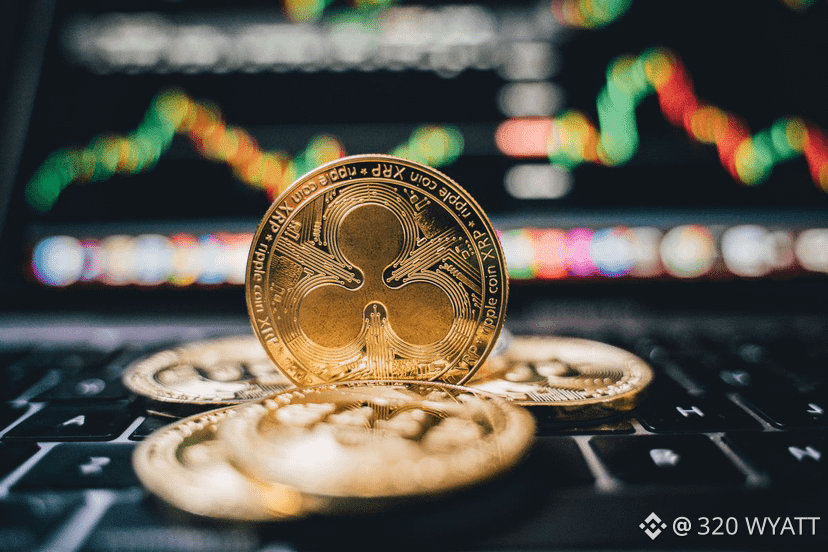
XRP traded at $1.36, marking a 3.4% daily decline and a nearly 10% drop over the week, with its position below key moving averages signaling strong market indecision. While this downward trend persists, a significant 90 million token increase in XRP holdings on Korean exchanges Upbit and Bithumb over three weeks indicates a strategic shift in custody rather than an active sell-off. On the institutional front, Standard Chartered has professionalized crypto custody by offering services for Ripple's stablecoin, RLUSD, directly on the XRP Ledger. However, immediate growth remains capped as RLUSD is not yet authorized for public trading in the EU, and the XRP lending function stays inactive. Investors should closely monitor the $1.39–$1.40 resistance zone for clear price direction while carefully weighing these regulatory and custody factors.
#xrp320 #Trendingissue #Trendingcoin320 #mr320 #writetoearn320
$XRP
XRP traded at $1.36, marking a 3.4% daily decline and a nearly 10% drop over the week, with its position below key moving averages signaling strong market indecision. While this downward trend persists, a significant 90 million token increase in XRP holdings on Korean exchanges Upbit and Bithumb over three weeks indicates a strategic shift in custody rather than an active sell-off. On the institutional front, Standard Chartered has professionalized crypto custody by offering services for Ripple's stablecoin, RLUSD, directly on the XRP Ledger. However, immediate growth remains capped as RLUSD is not yet authorized for public trading in the EU, and the XRP lending function stays inactive. Investors should closely monitor the $1.39–$1.40 resistance zone for clear price direction while carefully weighing these regulatory and custody factors.
#xrp320 #Trendingissue #Trendingcoin320 #mr320 #writetoearn320
XRP traded at $1.36, marking a 3.4% daily decline and a nearly 10% drop over the week, with its position below key moving averages signaling strong market indecision. While this downward trend persists, a significant 90 million token increase in XRP holdings on Korean exchanges Upbit and Bithumb over three weeks indicates a strategic shift in custody rather than an active sell-off. On the institutional front, Standard Chartered has professionalized crypto custody by offering services for Ripple's stablecoin, RLUSD, directly on the XRP Ledger. However, immediate growth remains capped as RLUSD is not yet authorized for public trading in the EU, and the XRP lending function stays inactive. Investors should closely monitor the $1.39–$1.40 resistance zone for clear price direction while carefully weighing these regulatory and custody factors.
#xrp320 #Trendingissue #Trendingcoin320 #mr320 #writetoearn320
817
·
--
Bullish
$XRP
{spot}(XRPUSDT)
🚨Long-term momentum faces near-term oscillator-driven uncertainty🚨
On the technical front, XRP is holding above the MA-50 on the hourly chart but trades below the MA-20, with price levels showing firm support from the MA-200 on the daily timeframe. Ichimoku Kijun resistance is found at $1.5745, establishing a critical barrier on the upside. Momentum indicators show a divided picture: MACD and ADX continue to favor further gains, while RSI sits at a neutral 51. Stochastic RSI is deeply oversold, CCI points to increased selling, and Bull/Bear Power reflects intraday seller dominance, highlighting ongoing uncertainty between strong longer-term momentum and near-term bearish oscillator signals.
#xrp320 #Trendingcoin320 #Trendingissue #writetoearn320 #mr320
$XRP
🚨Long-term momentum faces near-term oscillator-driven uncertainty🚨
On the technical front, XRP is holding above the MA-50 on the hourly chart but trades below the MA-20, with price levels showing firm support from the MA-200 on the daily timeframe. Ichimoku Kijun resistance is found at $1.5745, establishing a critical barrier on the upside. Momentum indicators show a divided picture: MACD and ADX continue to favor further gains, while RSI sits at a neutral 51. Stochastic RSI is deeply oversold, CCI points to increased selling, and Bull/Bear Power reflects intraday seller dominance, highlighting ongoing uncertainty between strong longer-term momentum and near-term bearish oscillator signals.
#xrp320 #Trendingcoin320 #Trendingissue #writetoearn320 #mr320
🚨Long-term momentum faces near-term oscillator-driven uncertainty🚨
On the technical front, XRP is holding above the MA-50 on the hourly chart but trades below the MA-20, with price levels showing firm support from the MA-200 on the daily timeframe. Ichimoku Kijun resistance is found at $1.5745, establishing a critical barrier on the upside. Momentum indicators show a divided picture: MACD and ADX continue to favor further gains, while RSI sits at a neutral 51. Stochastic RSI is deeply oversold, CCI points to increased selling, and Bull/Bear Power reflects intraday seller dominance, highlighting ongoing uncertainty between strong longer-term momentum and near-term bearish oscillator signals.
#xrp320 #Trendingcoin320 #Trendingissue #writetoearn320 #mr320

34
·
--
Bullish
$BTC
{spot}(BTCUSDT)
🚨Whale Activity Shows Heavy Buying and Selling🚨
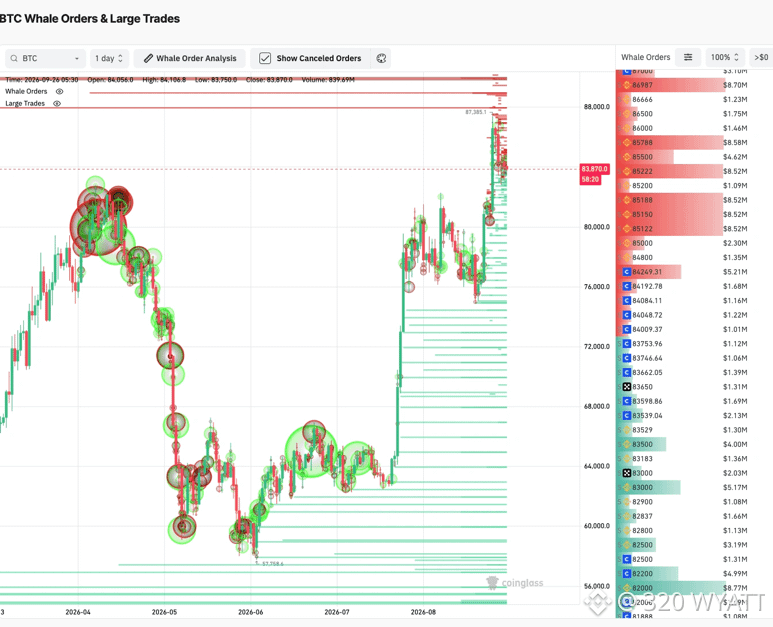
BTC is trading around $83,970, after recently pushing toward the $87,385 area. The important point is that whales are placing large orders on both sides of the market, creating a clear battle zone.
Between $85,122 and $87,000, large sell orders totaling around $37 million are placed. This creates a strong sell wall that could make it harder for Bitcoin to move above the $85K – $87K range.
At the same time, around $21.1 million in buy orders are placed between $82,000 and $83,500.
This makes the $82K–$83K area an important support zone, while $85K – $87K remains a major selling area.
#BTC320 #Trendingissue #writetoearn320 #Trendingcoin320 #mr320
$BTC
🚨Whale Activity Shows Heavy Buying and Selling🚨
BTC is trading around $83,970, after recently pushing toward the $87,385 area. The important point is that whales are placing large orders on both sides of the market, creating a clear battle zone.
Between $85,122 and $87,000, large sell orders totaling around $37 million are placed. This creates a strong sell wall that could make it harder for Bitcoin to move above the $85K – $87K range.
At the same time, around $21.1 million in buy orders are placed between $82,000 and $83,500.
This makes the $82K–$83K area an important support zone, while $85K – $87K remains a major selling area.
#BTC320 #Trendingissue #writetoearn320 #Trendingcoin320 #mr320
🚨Whale Activity Shows Heavy Buying and Selling🚨
BTC is trading around $83,970, after recently pushing toward the $87,385 area. The important point is that whales are placing large orders on both sides of the market, creating a clear battle zone.
Between $85,122 and $87,000, large sell orders totaling around $37 million are placed. This creates a strong sell wall that could make it harder for Bitcoin to move above the $85K – $87K range.
At the same time, around $21.1 million in buy orders are placed between $82,000 and $83,500.
This makes the $82K–$83K area an important support zone, while $85K – $87K remains a major selling area.
#BTC320 #Trendingissue #writetoearn320 #Trendingcoin320 #mr320
28
·
--
Bullish
$XRP
{spot}(XRPUSDT)
A symmetric triangle occurs when each rally peaks lower than the previous one and each decline bottoms higher, creating two trendlines that squeeze the price toward a point. The upper trendline acts as resistance, where sellers halt rallies, while the lower line serves as support, where buyers prevent price drops. A breakout occurs when price moves past one of these lines, and a retest follows, testing whether old resistance now serves as support.
XRP’s triangle formation began at its January 2018 peak of $3.31. The rally in April 2021 peaked at $1.96, hitting the upper trendline before XRP broke above it in November 2024, still below $1. After that breakout, XRP soared to a high of $3.65 in July 2025. However, a bear market that started in August 2025 pushed the price down to $0.98 by August 2026, where it touched the old trendline and bounced back.
This sequence of breakout, subsequent rally, pullback to the line, and recovery is the classic pattern. The move up to $1.60 on September 22 completed this sequence. The slight dip to $1.55 raises concerns, as closing back inside the triangle would suggest a false breakout and could trap late buyers
#xrp320 #mr320 #Trendingissue #Trendingcoin320 #writetoearn320
$XRP
A symmetric triangle occurs when each rally peaks lower than the previous one and each decline bottoms higher, creating two trendlines that squeeze the price toward a point. The upper trendline acts as resistance, where sellers halt rallies, while the lower line serves as support, where buyers prevent price drops. A breakout occurs when price moves past one of these lines, and a retest follows, testing whether old resistance now serves as support.
XRP’s triangle formation began at its January 2018 peak of $3.31. The rally in April 2021 peaked at $1.96, hitting the upper trendline before XRP broke above it in November 2024, still below $1. After that breakout, XRP soared to a high of $3.65 in July 2025. However, a bear market that started in August 2025 pushed the price down to $0.98 by August 2026, where it touched the old trendline and bounced back.
This sequence of breakout, subsequent rally, pullback to the line, and recovery is the classic pattern. The move up to $1.60 on September 22 completed this sequence. The slight dip to $1.55 raises concerns, as closing back inside the triangle would suggest a false breakout and could trap late buyers
#xrp320 #mr320 #Trendingissue #Trendingcoin320 #writetoearn320
A symmetric triangle occurs when each rally peaks lower than the previous one and each decline bottoms higher, creating two trendlines that squeeze the price toward a point. The upper trendline acts as resistance, where sellers halt rallies, while the lower line serves as support, where buyers prevent price drops. A breakout occurs when price moves past one of these lines, and a retest follows, testing whether old resistance now serves as support.
XRP’s triangle formation began at its January 2018 peak of $3.31. The rally in April 2021 peaked at $1.96, hitting the upper trendline before XRP broke above it in November 2024, still below $1. After that breakout, XRP soared to a high of $3.65 in July 2025. However, a bear market that started in August 2025 pushed the price down to $0.98 by August 2026, where it touched the old trendline and bounced back.
This sequence of breakout, subsequent rally, pullback to the line, and recovery is the classic pattern. The move up to $1.60 on September 22 completed this sequence. The slight dip to $1.55 raises concerns, as closing back inside the triangle would suggest a false breakout and could trap late buyers
#xrp320 #mr320 #Trendingissue #Trendingcoin320 #writetoearn320

1
117
·
--
Bullish
$BTC
{spot}(BTCUSDT)
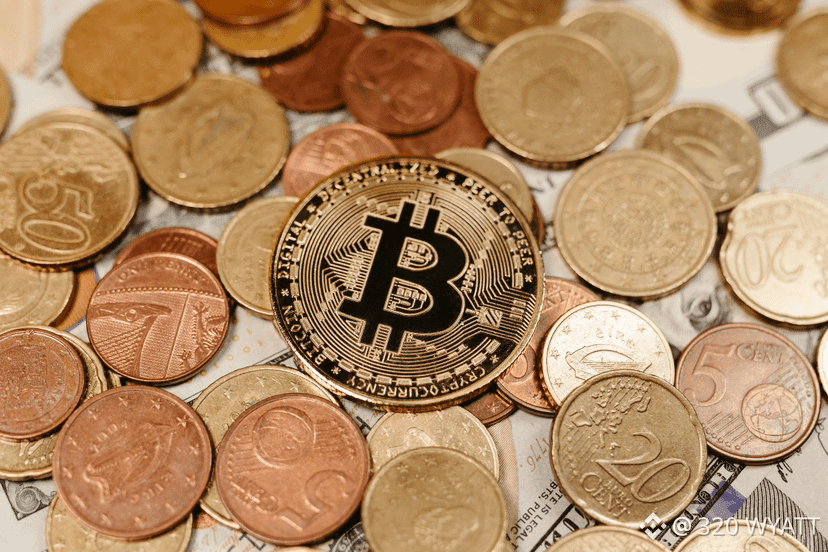
The Bitcoin price has rebounded strongly over the last 10 days, climbing from the $81,000 range to consolidate above $84,000. As of October 4, 2026, the live price of BTC stabilizes at approximately $84,807.
#BTC320 #Trendingissue #Trendingcoin320 #writetoearn320 #mr320
$BTC
The Bitcoin price has rebounded strongly over the last 10 days, climbing from the $81,000 range to consolidate above $84,000. As of October 4, 2026, the live price of BTC stabilizes at approximately $84,807.
#BTC320 #Trendingissue #Trendingcoin320 #writetoearn320 #mr320
The Bitcoin price has rebounded strongly over the last 10 days, climbing from the $81,000 range to consolidate above $84,000. As of October 4, 2026, the live price of BTC stabilizes at approximately $84,807.
#BTC320 #Trendingissue #Trendingcoin320 #writetoearn320 #mr320
54
·
--
Bullish
$ETH
{spot}(ETHUSDT)
A prominent crypto whale, currently netting over $5 million in weekly profits, has aggressively scaled into a massive $61 million Ethereum ($ETH) short position.
This highly leveraged bearish bet faces an immediate liquidation price of $3,014. Should $ETH price action experience a sharp upward impulse and breach this psychological threshold, it will trigger an automated forced liquidation. This could potentially spark a "short squeeze," rapidly accelerating upward volatility.
#ETH320 #mr320 #Trendingcoin320 #Trendingissue #writetoearn320
$ETH
A prominent crypto whale, currently netting over $5 million in weekly profits, has aggressively scaled into a massive $61 million Ethereum ($ETH ) short position.
This highly leveraged bearish bet faces an immediate liquidation price of $3,014. Should $ETH price action experience a sharp upward impulse and breach this psychological threshold, it will trigger an automated forced liquidation. This could potentially spark a "short squeeze," rapidly accelerating upward volatility.
#ETH320 #mr320 #Trendingcoin320 #Trendingissue #writetoearn320
A prominent crypto whale, currently netting over $5 million in weekly profits, has aggressively scaled into a massive $61 million Ethereum ($ETH ) short position.
This highly leveraged bearish bet faces an immediate liquidation price of $3,014. Should $ETH price action experience a sharp upward impulse and breach this psychological threshold, it will trigger an automated forced liquidation. This could potentially spark a "short squeeze," rapidly accelerating upward volatility.
#ETH320 #mr320 #Trendingcoin320 #Trendingissue #writetoearn320

62
·
--
Bullish
$XRP
{spot}(XRPUSDT)
Early October witnessed muted trading volume for XRP as bearish sentiment intensified across cryptocurrency communities, with social metrics tilting significantly toward negative commentary. Nonetheless, technical analysts project a potential near-term rebound toward the $2 threshold, bolstered by constructive chart formations such as an inverse head-and-shoulders and an ascending triangle.
Furthermore, surpassing a pivotal resistance level at $3.66 could act as a catalyst for exponential gains. This optimistic outlook is reinforced by a contraction of XRP supply across centralized exchanges, a supply-side dynamic that typically underpins price stability and fosters upward mobility. At the time of compilation, XRP was valued at $1.51, commanding a $95 billion market capitalization.
#xrp320 #Trendingissue #Trendingcoin320 #writetoearn320 #mr320
$XRP
Early October witnessed muted trading volume for XRP as bearish sentiment intensified across cryptocurrency communities, with social metrics tilting significantly toward negative commentary. Nonetheless, technical analysts project a potential near-term rebound toward the $2 threshold, bolstered by constructive chart formations such as an inverse head-and-shoulders and an ascending triangle.
Furthermore, surpassing a pivotal resistance level at $3.66 could act as a catalyst for exponential gains. This optimistic outlook is reinforced by a contraction of XRP supply across centralized exchanges, a supply-side dynamic that typically underpins price stability and fosters upward mobility. At the time of compilation, XRP was valued at $1.51, commanding a $95 billion market capitalization.
#xrp320 #Trendingissue #Trendingcoin320 #writetoearn320 #mr320
Early October witnessed muted trading volume for XRP as bearish sentiment intensified across cryptocurrency communities, with social metrics tilting significantly toward negative commentary. Nonetheless, technical analysts project a potential near-term rebound toward the $2 threshold, bolstered by constructive chart formations such as an inverse head-and-shoulders and an ascending triangle.
Furthermore, surpassing a pivotal resistance level at $3.66 could act as a catalyst for exponential gains. This optimistic outlook is reinforced by a contraction of XRP supply across centralized exchanges, a supply-side dynamic that typically underpins price stability and fosters upward mobility. At the time of compilation, XRP was valued at $1.51, commanding a $95 billion market capitalization.
#xrp320 #Trendingissue #Trendingcoin320 #writetoearn320 #mr320
130
·
--
Bullish
$XRP
{spot}(XRPUSDT)
XRP is currently trading at $1.4996, maintaining a solid bullish bias despite a slight dip yesterday. The price is safely holding above its 50-day, 100-day, and 200-day Exponential Moving Averages (EMAs)—which are tightly grouped between $1.330 and $1.400—confirming that the medium-term upward trend is still fully intact.
While the Relative Strength Index (RSI) sitting at 56 shows that buyers still control the market without being overextended, a slightly negative MACD signals a minor loss in upward speed after the recent rally. If the price moves up, it faces immediate resistance at $1.671, with a major hurdle ahead at $1.900 where sellers might step back in. On the downside, initial support sits at the 50-day EMA near $1.398, followed by deeper safety nets down to the psychological $1.300 and $1.000 demand zones if a sharper correction takes place.
#xrp320 #Trendingissue #Trendingcoin320 #writetoearn320 #mr320
$XRP
XRP is currently trading at $1.4996, maintaining a solid bullish bias despite a slight dip yesterday. The price is safely holding above its 50-day, 100-day, and 200-day Exponential Moving Averages (EMAs)—which are tightly grouped between $1.330 and $1.400—confirming that the medium-term upward trend is still fully intact.
While the Relative Strength Index (RSI) sitting at 56 shows that buyers still control the market without being overextended, a slightly negative MACD signals a minor loss in upward speed after the recent rally. If the price moves up, it faces immediate resistance at $1.671, with a major hurdle ahead at $1.900 where sellers might step back in. On the downside, initial support sits at the 50-day EMA near $1.398, followed by deeper safety nets down to the psychological $1.300 and $1.000 demand zones if a sharper correction takes place.
#xrp320 #Trendingissue #Trendingcoin320 #writetoearn320 #mr320
XRP is currently trading at $1.4996, maintaining a solid bullish bias despite a slight dip yesterday. The price is safely holding above its 50-day, 100-day, and 200-day Exponential Moving Averages (EMAs)—which are tightly grouped between $1.330 and $1.400—confirming that the medium-term upward trend is still fully intact.
While the Relative Strength Index (RSI) sitting at 56 shows that buyers still control the market without being overextended, a slightly negative MACD signals a minor loss in upward speed after the recent rally. If the price moves up, it faces immediate resistance at $1.671, with a major hurdle ahead at $1.900 where sellers might step back in. On the downside, initial support sits at the 50-day EMA near $1.398, followed by deeper safety nets down to the psychological $1.300 and $1.000 demand zones if a sharper correction takes place.
#xrp320 #Trendingissue #Trendingcoin320 #writetoearn320 #mr320
111
·
--
Bullish
$BTC
{spot}(BTCUSDT)
Marking a historic milestone in Bitcoin lore, today commemorates the twelve-year anniversary of the market's defiance against the BearWhale.The anonymous investor abruptly initiated a liquidation of 30,000 BTC at a heavily discounted rate of $300.
Retail and institutional buyers aggressively met the selling pressure, absorbing the entire $9 million supply shock almost instantaneously to preserve market stability. In retrospect, the decision to dump the asset proved catastrophic; at current market valuations, those coins are worth $2.5 billion, locking in an astronomical opportunity cost for the seller.
#BTC320 #Trendingissue #writetoearn320 #mr320 #Trendingcoin320
$BTC
Marking a historic milestone in Bitcoin lore, today commemorates the twelve-year anniversary of the market's defiance against the BearWhale.The anonymous investor abruptly initiated a liquidation of 30,000 BTC at a heavily discounted rate of $300.
Retail and institutional buyers aggressively met the selling pressure, absorbing the entire $9 million supply shock almost instantaneously to preserve market stability. In retrospect, the decision to dump the asset proved catastrophic; at current market valuations, those coins are worth $2.5 billion, locking in an astronomical opportunity cost for the seller.
#BTC320 #Trendingissue #writetoearn320 #mr320 #Trendingcoin320
Marking a historic milestone in Bitcoin lore, today commemorates the twelve-year anniversary of the market's defiance against the BearWhale.The anonymous investor abruptly initiated a liquidation of 30,000 BTC at a heavily discounted rate of $300.
Retail and institutional buyers aggressively met the selling pressure, absorbing the entire $9 million supply shock almost instantaneously to preserve market stability. In retrospect, the decision to dump the asset proved catastrophic; at current market valuations, those coins are worth $2.5 billion, locking in an astronomical opportunity cost for the seller.
#BTC320 #Trendingissue #writetoearn320 #mr320 #Trendingcoin320

115
·
--
Bullish
Verified
$XRP
{spot}(XRPUSDT)
In a notable display of growing investor confidence, spot XRP ETFs registered a commendable $4.74 million in net inflows last week. This influx of capital highlights a robust appetite for regulated crypto investment vehicles, suggesting that institutional players are increasingly positioning themselves to capture the asset's potential upside amidst broader market shifts.
#xrp320 #Trendingissue #Trendingcoin320 #writetoearn320 #mr320
$XRP
In a notable display of growing investor confidence, spot XRP ETFs registered a commendable $4.74 million in net inflows last week. This influx of capital highlights a robust appetite for regulated crypto investment vehicles, suggesting that institutional players are increasingly positioning themselves to capture the asset's potential upside amidst broader market shifts.
#xrp320 #Trendingissue #Trendingcoin320 #writetoearn320 #mr320
In a notable display of growing investor confidence, spot XRP ETFs registered a commendable $4.74 million in net inflows last week. This influx of capital highlights a robust appetite for regulated crypto investment vehicles, suggesting that institutional players are increasingly positioning themselves to capture the asset's potential upside amidst broader market shifts.
#xrp320 #Trendingissue #Trendingcoin320 #writetoearn320 #mr320
2
2.2k
·
--
Bullish
$BTC
{spot}(BTCUSDT)
Despite the legislative setback of the Crypto Clarity Act failing to pass and the structural headwinds of escalating interest rates, Bitcoin has demonstrated remarkable market resilience. Having capitulated from its $126,000 peak down to a $57,000 cyclical trough, BTC has engineered a powerful trend reversal to robustly reclaim the $85,000 vector. This impressive recovery underscores an asymmetric fortitude, signifying that institutional absorption and programmatic buying are effectively overpowering traditional macro vulnerabilities and spot market sell pressure.
#BTC320 #Trendingissue #Trendingcoin320 #writetoearn320 #mr320
$BTC
Despite the legislative setback of the Crypto Clarity Act failing to pass and the structural headwinds of escalating interest rates, Bitcoin has demonstrated remarkable market resilience. Having capitulated from its $126,000 peak down to a $57,000 cyclical trough, BTC has engineered a powerful trend reversal to robustly reclaim the $85,000 vector. This impressive recovery underscores an asymmetric fortitude, signifying that institutional absorption and programmatic buying are effectively overpowering traditional macro vulnerabilities and spot market sell pressure.
#BTC320 #Trendingissue #Trendingcoin320 #writetoearn320 #mr320
Despite the legislative setback of the Crypto Clarity Act failing to pass and the structural headwinds of escalating interest rates, Bitcoin has demonstrated remarkable market resilience. Having capitulated from its $126,000 peak down to a $57,000 cyclical trough, BTC has engineered a powerful trend reversal to robustly reclaim the $85,000 vector. This impressive recovery underscores an asymmetric fortitude, signifying that institutional absorption and programmatic buying are effectively overpowering traditional macro vulnerabilities and spot market sell pressure.
#BTC320 #Trendingissue #Trendingcoin320 #writetoearn320 #mr320

36
·
--
Bullish
$BTC
{spot}(BTCUSDT)
Bitcoin is currently trading at $86,722 following three consecutive weeks of gains, comfortably anchored above its 50-day ($79,206), 100-day ($75,375), and 200-day ($75,001) Exponential Moving Averages (EMAs) to reinforce a robust, extended structural uptrend. While the Relative Strength Index (RSI) hovering near 69 flashes imminent overbought conditions and a flattening MACD hints at plateauing incremental momentum, the near-term bullish bias remains firmly intact. On the downside, initial horizontal support rests at $85,000, followed by dynamic demand at the 50-day EMA ($79,206) and a deeper medium-term floor clustered between $75,400 and $75,000, with major macro cushions at $66,500 and $62,300 standing ready to absorb any intensified profit-taking.
#BTC320 #Trendingissue #Trendingcoin320 #writetoearn320 #mr320
$BTC
Bitcoin is currently trading at $86,722 following three consecutive weeks of gains, comfortably anchored above its 50-day ($79,206), 100-day ($75,375), and 200-day ($75,001) Exponential Moving Averages (EMAs) to reinforce a robust, extended structural uptrend. While the Relative Strength Index (RSI) hovering near 69 flashes imminent overbought conditions and a flattening MACD hints at plateauing incremental momentum, the near-term bullish bias remains firmly intact. On the downside, initial horizontal support rests at $85,000, followed by dynamic demand at the 50-day EMA ($79,206) and a deeper medium-term floor clustered between $75,400 and $75,000, with major macro cushions at $66,500 and $62,300 standing ready to absorb any intensified profit-taking.
#BTC320 #Trendingissue #Trendingcoin320 #writetoearn320 #mr320
Bitcoin is currently trading at $86,722 following three consecutive weeks of gains, comfortably anchored above its 50-day ($79,206), 100-day ($75,375), and 200-day ($75,001) Exponential Moving Averages (EMAs) to reinforce a robust, extended structural uptrend. While the Relative Strength Index (RSI) hovering near 69 flashes imminent overbought conditions and a flattening MACD hints at plateauing incremental momentum, the near-term bullish bias remains firmly intact. On the downside, initial horizontal support rests at $85,000, followed by dynamic demand at the 50-day EMA ($79,206) and a deeper medium-term floor clustered between $75,400 and $75,000, with major macro cushions at $66,500 and $62,300 standing ready to absorb any intensified profit-taking.
#BTC320 #Trendingissue #Trendingcoin320 #writetoearn320 #mr320

95
·
--
Bullish
$XRP
{spot}(XRPUSDT)
The current spot price of XRP sits at $1.48 USD, reflecting a modest 24-hour contraction of approximately 3.66%. Concurrently, the digital asset commands an aggregate market capitalization of $93.71 billion USD, while its 24-hour liquidity remains robust, with trading volumes consolidating around $4.07 billion USD.
#xrp320 #Trendingissue #writetoearn320 #Trendingcoin320 #mr320
$XRP
The current spot price of XRP sits at $1.48 USD, reflecting a modest 24-hour contraction of approximately 3.66%. Concurrently, the digital asset commands an aggregate market capitalization of $93.71 billion USD, while its 24-hour liquidity remains robust, with trading volumes consolidating around $4.07 billion USD.
#xrp320 #Trendingissue #writetoearn320 #Trendingcoin320 #mr320
The current spot price of XRP sits at $1.48 USD, reflecting a modest 24-hour contraction of approximately 3.66%. Concurrently, the digital asset commands an aggregate market capitalization of $93.71 billion USD, while its 24-hour liquidity remains robust, with trading volumes consolidating around $4.07 billion USD.
#xrp320 #Trendingissue #writetoearn320 #Trendingcoin320 #mr320
64
·
--
Bullish
$DOGE
{spot}(DOGEUSDT)
🚨🚨Dogecoin whales purchased over 1,140,000,000 DOGE in the past 4 days.
#doge320 #mr320 #Trendingissue #Trendingcoin320 #writetoearn320
$DOGE
🚨🚨Dogecoin whales purchased over 1,140,000,000 DOGE in the past 4 days.
#doge320 #mr320 #Trendingissue #Trendingcoin320 #writetoearn320
🚨🚨Dogecoin whales purchased over 1,140,000,000 DOGE in the past 4 days.
#doge320 #mr320 #Trendingissue #Trendingcoin320 #writetoearn320

115
·
--
Bullish
$BTC
{spot}(BTCUSDT)
The breakout gives bitcoin a stronger floor than it had a week ago. It hit a high of $87,374 on September 21. That came after a 14.4% gain in seven days, per Analytics Insight. The climb also broke $82,000, a price that had blocked bitcoin for a month.
That old ceiling now acts as support, per TradingKey. When a ceiling turns into a floor, a rally has room to breathe. That is the moment sharp traders start looking past bitcoin for the bigger move.
#btc #BTC320 #Trendingissue #Trendingcoin320 #writetoearn320
$BTC
The breakout gives bitcoin a stronger floor than it had a week ago. It hit a high of $87,374 on September 21. That came after a 14.4% gain in seven days, per Analytics Insight. The climb also broke $82,000, a price that had blocked bitcoin for a month.
That old ceiling now acts as support, per TradingKey. When a ceiling turns into a floor, a rally has room to breathe. That is the moment sharp traders start looking past bitcoin for the bigger move.
#btc #BTC320 #Trendingissue #Trendingcoin320 #writetoearn320
The breakout gives bitcoin a stronger floor than it had a week ago. It hit a high of $87,374 on September 21. That came after a 14.4% gain in seven days, per Analytics Insight. The climb also broke $82,000, a price that had blocked bitcoin for a month.
That old ceiling now acts as support, per TradingKey. When a ceiling turns into a floor, a rally has room to breathe. That is the moment sharp traders start looking past bitcoin for the bigger move.
#btc #BTC320 #Trendingissue #Trendingcoin320 #writetoearn320

80
Log in to explore more content
Join global crypto users on Binance Square
⚡️ Get latest and useful information about crypto.
💬 Trusted by the world’s largest crypto exchange.
👍 Discover real insights from verified creators.
Email / Phone number
Trending Topics
1
#HotCPIDecemberHikePriced
110,099 views
1,287 Discussing
2
#AnthropicRejectsIPODelayValuationinQuestion
232,825 views
1,951 Discussing
3
#CanNvidiaEarningsEaseMarketConcerns?
40,087 views
583 Discussing
4
#BitcoinFiveWeeklyLosses
565,657 views
3,477 Discussing
5
#TrumpMediaAdds1510BTCInQ3
11,309 views
150 Discussing
6
#TradFiForBeginners
438,568 views
2,857 Discussing
7
#NvidiaInvestigatesAfterHuang’sAffairApology
531,705 views
3,266 Discussing
8
#ADPWeeklyEstimateShowsUSPrivatePayrollsUp19750
19,460 views
306 Discussing
9
#BitcoinSpotETFsPost$201MNetOutflowForThirdStraightDay
3,159 views
39 Discussing
10
#CryptoLiquidationsReach$1.16BIn24Hours
81,420 views
88 Discussing